
Using fuzzy logic models - WUR
153
Transcript of Using fuzzy logic models - WUR


Using fuzzy logic models
to reveal farmers’ motives to
integrate livestock, fish, and crops

Promotor: Prof. Dr. Johan A.J. Verreth Hoogleraar Aquacultuur en Visserij Wageningen Universiteit Co-promotoren: Dr. Ir. Henk M.J. Udo Universitair hoofddocent Leerstoelgroep Dierlijke Productie Systemen Wageningen Universiteit Dr. Ir. Jan van den Berg
Universitair hoofddocent Faculteit Technologie, Bestuur en Management Technische Universiteit Delft
Dr. Ir. Uzay Kaymak Universitair hoofddocent Capaciteitsgroep Econometrie Erasmus Universiteit, Rotterdam Promotiecommissie: Prof. Dr. Leontine Visser Wageningen Universiteit Prof. Dr. Ir. Herman van Keulen Wageningen Universiteit Dr William Silvert
University of Algarve, Portugal Dr Dave C. Little, Institute of Aquaculture, Stirling University, Scotland
Dit onderzoek is uitgevoerd binnen de onderzoeksschool WIAS (Wageningen Institute of Animal Sciences)

Roel H. Bosma (2007)
Using fuzzy logic models to reveal farmers’ motives to integrate livestock, fish, and crops
PhD thesis Wageningen University, the Netherlands ISBN: 978-90-8504-780-3

Using fuzzy logic models to reveal farmers’ motives to
integrate livestock, fish, and crops
Roel H. Bosma
Proefschrift ter verkrijging van de graad van doctor
op gezag van de rector magnificus van Wageningen Universiteit,
Prof. dr. M.J.Kropff, in het openbaar te verdedigen op dinsdag 18 december 2007
des namiddags te vier uur in de Aula.

ABSTRACT Rural extension services have changed paradigm and shifted to more participatory approaches, whereas in common mathematical models of farming systems, farmers’ motivation is solely represented by ‘utility maximisation’. While globally, farmers specialise, in Vietnam the rice-based systems have diversified into more sustainable integrated agriculture–aquaculture. We gathered data from 144 farms in six villages in two ecological zones of the Mekong Delta, Vietnam. Using the livelihood framework we conceptualised farmers’ decision-making in a fuzzy logic model that can deal with subjective linguistic statements through ‘if–then’ rules. The desire to improve livelihoods and diet, mainly for their children’ well-being was the farmers’ main motive for diversification. Livestock, including fish, was essential in the expansion and accumulation stages of the nuclear families’ life-course having five stages. In 10 recursive steps we developed a model of farmers’ decision-making in a transparent hierarchical tree composed of several Mamdani-based inference systems, each with its rule base. Model conceptualisation, variables selection, model structuring, and definition of linguistic values, membership functions and rule base were based on a first set of data that was completed before calibration. In a pilot, the simulation of the frequency distribution of four fish-production systems was good, but classification of individual farmers was poor. Using composed variables for land, water, labour and capital decreased the fuzziness of the inference in this pilot model. In a more elaborated three-layer model, the whole farm composition was simulated using variables for the production factors, farmers’ appreciation of prices, farmer’s know-how of 10 activities, operational variables of social motives for integration and diversification as well as for risk-taking behaviour and for rice food security. Model’s classification of individual farmers in the delta was good for the land-based activities but poor for the livestock activities. A test on the hill farmers’ dataset showed that the model was context-specific. The model’s sensitivity to the social variables determining diversification and integration was of the same magnitude as its sensitivity to product’s prices and farmer’s know-how, but smaller than its sensitivity to labour, capital and land endowment.
We conclude that farmers’ decision-making can be simulated using a fuzzy logic model. In the Mekong Delta farm diversification and integration are driven by labour, income, homestead area, number of young children, index of integration, household life-course, and level of education and age of the household head, in decreasing order. The choice of a component depends on the household’s assets and specific know-how, and on marketability. Farm models that do not include family-related motivations might be less reliable than generally suggested.

FOREWORD After my last long-term assignment in West Africa, I was able to profit from a study leave, paid for by the Dutch ministry of Development Cooperation at the chair group of Development Economics, Wageningen University, to prepare a first PhD project. I chose this chair group because I felt a lack in economic knowledge was restricting my full understanding of development related problems. This chair group received me on the personal recommendation of a staff member who perceived that my available studies could be used to elaborate a PhD. Personally I felt these studies covered too wide a field to make a coherent thesis. The request for funding of the project ‘Trade-offs on farm-household welfare, food security and bio-diversity, of cattle breed choice and production strategies for dairy development in Sub-Saharan Africa’ was not awarded. At the chair group of Animal Production Systems, I prepared a similar, but larger, project that was not awarded by the European Union. I owe a great deal to the staff members of both the above mentioned groups and retain the ambition to elaborate an integrated project involving them. Studying peasant economics, cost-benefit, agricultural development policies, environmental economics and modelling left me puzzled with the limited inclusion of farmers’ motivations in the common models of farm economics, land use planning and natural resource management. A talk by Dr William Silvert, organised collectively by the chairgroups of Animal Production Systems and Plant Production Systems on 24th January 2003, inspired the subject of this thesis: use fuzzy logic to model other motivations that farmers have besides ‘utility maximisation’. The offer from the chairgroup Aquaculture and Fisheries to manage the INREF-POND project gave me the opportunity to elaborate this research project. The choice for the location of the field-work, the Mekong Delta, Vietnam, was related to the project, and it was to consider another context that I also did surveys in the hill and upland districts, which compared to the fresh water alluvial delta districts are less appropriate for aquaculture. Originally it was intended to extend the thesis subject to options for integrated agriculture-aquaculture development in Sub-Saharan Africa but this was too ambitious and ambiguous. Still it remains my ambition to use the results of the POND projects, to support the development of the more sustainable integrated agriculture-aquaculture production systems in Sub-Saharan Africa. I hope this thesis provides a first step.

GLOSSARY of technical terms and abbreviations
Antecedent = premise = basis of a reasonable line of arguments CAF / CIL / CIN = cash income from on-farm/livestock/off- and non-farm activities CCI = number of components contributing to cash income Calibration = fitting a model’s output with the data Centre of gravity = central point in the universe of an object (function) Consequence = result of a line of arguments Defuzzification = decoding a fuzzy output in a crisp decision Degree of fulfilment = degree to which the consequence of fuzzy rules is fulfilled DM = decision-making ES = expert system Face-validation = Fitting the output of a model to the calibration data Fine-tuning = calibrating a model for individual cases Firing strength = see Degree of fulfilment FIS = fuzzy inference system = system of inputs and outputs with their related
membership functions, rule base and inference engine FLM = fuzzy logic model FRF = farmers’ reference frame Fuzzification = encoding crisp values in linguistic expressions Fuzzy = non-crisp = a vague description of a parameters’ quantification Fuzzy logic = compute with linguistic values organised in sets of ‘if–then ’ rules HFS = hierarchical fuzzy system = hierarchical tree of several FISs HH = household IAAS = integrated agriculture aquaculture farming system ICR = individual classification rate Inference engine = mathematical procedure (algorithms) calculating the firing strength IIC = Indicator for the Integration of Components. INREF = Interdisciplinary Research and Education Fund of WU LT = linguistic terms = the set of fuzzy linguistic values of a variable Mamdani = type of inference engine using minimum and maximum operators to truncate
and add sections of MFs and calculate the rule’ firing strength MD = Mekong Delta MF = membership function = function defining the space occupied by a
linguistic value in the universe of discourse NC = number of components NGO = non-governmental organisation Operational-validation= checking the validity of a model on another dataset PRA = Participatory Rural Appraisal (PCA = Part. Community Appraisal) Rule base = set of rules of a FIS t-(co)norm = mathematical function used to calculate with graphical areas Universe of discourse = space occupied by the arguments of a rule VND = ₫ = Vietnamese Dong (15,000₫ = 1 US$); kVND = ₫ x103; mVND = ₫ x106

TABLE OF CONTENTS
1. General introduction 1.1. Integrated agriculture aquaculture farming systems........................................1 1.2. Innovation processes ...........................................................................................2 1.3. Decision-making ...................................................................................................3 1.4. Simulation of change............................................................................................3 1.5. Fuzzy logic models ...............................................................................................5 1.6. Statement of the problem....................................................................................6
2. Farmers’ motives for agriculture diversification and its contribution to livelihoods in the Mekong Delta ....................................................................................................9 2.1. Introduction........................................................................................................ 11 2.2. Methodology....................................................................................................... 12 2.3. Results ................................................................................................................. 15 2.4. Discussion and conclusions ............................................................................. 32
3. Assessing and modelling farmers’ decision-making on integrating aquaculture into agriculture in the Mekong Delta ............................................................................. 35 3.1. Introduction........................................................................................................ 37 3.2. Methodology....................................................................................................... 38 3.3. Results ................................................................................................................. 44 3.4. Discussion and conclusions ............................................................................. 54
4. A methodology for designing fuzzy logic models to simulate farmers' decisions in integrated agriculture aquaculture systems............................................................ 57 4.1. Introduction........................................................................................................ 59 4.2. Including individual motives into fuzzy logic models.................................. 61 4.3. Applying the approach for decisions on farm composition ....................... 70 4.4. Discussion and conclusions. ............................................................................ 82
5. Using fuzzy logic modelling to simulate Mekong Delta farmers’ decision-making on diversification and integration ........................................................................... 85 5.1. Introduction........................................................................................................ 87 5.2. Methodology....................................................................................................... 88 5.3. Results ................................................................................................................. 94 5.4. Discussion and conclusions ........................................................................... 104
6. General discussion and conclusions.......................................................................... 109
References ............................................................................................................................ 121
Summary ............................................................................................................................. 131 Samenvatting ...................................................................................................................... 134
Authors' biography, publications, completed training plan, acknowledgements..... 137

CHAPTER 1
GENERAL
INTRODUCTION

1
1. General introduction
Views on agricultural innovation and related processes of technological changes in farming systems are subject to a major paradigm shift. Development services work more and more with a participatory approach, putting farmers forward as the major actor making decisions, using extension workers as process facilitators and researchers as information sources. The development strategies applied in the past neglected the large diversity of innovations that evolved from farmers’ perceptions [136]. Many mistakes in agrarian development might have been avoided through a better understanding of farmers’ perceptions, motives and drives within their particular context [12]. At present the analysis of agricultural innovation considers a context-mechanism-outcome pathway and recognises that social surveys and on-farm research are part of the change process (Pawson and Tilley, 1997 cited by [69]). Such an approach assumes that changes are not just explained by context but also by the management and decision-making process.
A major concern of agrarian development is ecological, economical and social sustainability for which mixed farming systems seem appropriate [72]. The change over to ecologically more sustainable production systems is especially crucial for the “licence to produce” of farm products. This change largely depends upon farmers’ decisions. Disentangling the interface between farmers’ perceptions of the innovations and their decisions concerning an effective and sustainable integration of the various farming components is a major challenge. To identify and design more sustainable farming systems scientists frequently use simulation modelling, in which the farmers’ perceptions and decision-making process are mostly ignored. The inclusion of farmers’ perceptions and motives seems crucial for the recent trend to use models not only for exploration of policy options, but also for the development of tools to support decision-making at farm level.
1.1. Integrated Agriculture Aquaculture farming Systems Mixed crop-livestock and livestock-fish-crop systems have the potential to maintain eco-systems’ functions and health, to absorb shocks of the natural resource base [72, 127] and to absorb sudden changes in the economic environment [95]. Fishponds contribute to households’ food security and income, and function as a nutrient trap on those farms that integrate the pond in livestock-fish-crop farming systems; the livestock component furnishes nutrients to the pond and the pond sediments are used as fertiliser for the crops [89].

Chapter 1 _____________________________________________________________
2
The contribution to ecological and economic sustainability of the integration
of these components in a farming system depends on the extent to which the integration is realised [131]. Notwithstanding the potential contribution of integrated agriculture aquaculture farming systems (IAASs) to sustainability on one hand and the increasing concern for sustainable livelihood systems on the other, the general global trend in agriculture is further specialisation.
Surprisingly, since 1975 the majority of farming systems in the Mekong Delta, Vietnam, have changed from self-sufficiency driven systems producing mainly rice in mono-culture for marketing to a variety of rice-based IAAS with many variations in terms of crop/fish/livestock combinations, degree of system integration, and market orientation [127, 142]. Phong et al. [122], identified up to 16 combinations of rice, garden, upland crop, livestock, fishpond and biogas; 50 % of the farms had four components and 90% at least two. In Vietnam, aquaculture has a broad cultural background, facilitating its rapid expansion [43] and the IAAS has contributed largely to the recent successful economic development of family farms [95]. The contextual factors driving the Vietnamese farmers to engage in these innovations have been identified [121], but social and individual motives in the decision-making process were mostly neglected.
1.2. Innovation Processes Until about 1980, the agricultural innovation strategy of most development services was based upon techniques and technologies resulting from on-station research [33]. This strategy is criticised as it 1/ neglects diversity in ecological, social, cultural and individual contexts [93], 2/ is limited in dealing with social and ecological processes characterised by a degree of uncertainty and unpredictability [144], and 3/ ignores the different reactions of farmers due to their individual knowledge, capabilities, social embedding and perceptions of the context [92].
Lightfoot et al. [89] and Chambers [33-35] introduced new participatory approaches that assist scientists and farmers to generate management practises inserting scientific findings into the livelihood systems [138]. Farmers each adapt technologies in their specific manner thus creating a range of technical innovations [25, 97]. At national level, part of the variation between the farms was explained by the concept of agro-ecological zones. The classification of agro-ecological zones considers characteristics such as rainfall, temperature, soil, topography, cropping system and water resources. Agricultural research and extension services use these zones to develop recommendations, innovations and strategies of intervention according to the diversity of farmers’ conditions.

_______________________________________________ General Introduction
3
1.3. Decision-making Decisions of individual farmers are the key of agricultural innovation and change. Bennett [12] presented a framework of the agri-family and its subsystems for an anthropological, i.e. holistic, analysis of management styles. This framework contained the five resources: natural, financial, human, physical and social assets, which are considered essential for decision-making in rural livelihoods [31, 144]. An analysis of decision-making should collect data on these assets and also consider farmers’ basic values classified by Gasson [cited by 58].
Nevertheless, decision-making is mostly embedded in a trajectory or pathway [36]. De Bruyn & van Dijk [24] consider that decision-making is a step-by-step process with recursive feedback against the background of farmers’ reference frames and with social coordination to avoid negative outcomes. The process of change can be studied with an actor-oriented and network perspective of the socio-technical regimes in which the innovation is integrated [71]. The socio-technical regime approach allows to account for: 1/ the embedding of technical change in society; 2/ the chaotic trajectories of innovations; 3/ the fluid dynamics of multiple actors networks involved in the generation and spread of innovations, and 4/ the cultural reference frame of the end-users in the niches or regimes [71].
1.4. Simulation of change To assess the factors affecting the process of technical change and to explore the rate of innovation in agriculture, three types of simulation models are developed. Gladwin [62] presented a model of decision-tree analysis, but her approach seems to have been abandoned. The multi-agent systems were recently developed to simulate platform processes with multiple stakeholders, following the principles of role playing computer games [139]. Multi-agent systems allow negotiation and, at present, are used to simulate various scenarios of common resource management by actor groups. These models could be appropriate to simulate the rate of change considering the networks build around the various innovations [46] and the innovation typology of farmers [47]. Though the simulation is validated with stakeholders and the negotiation processes can be random, flexibility and knowledge of individuals is hardly accounted for in the multi-agent systems.

Chapter 1 _____________________________________________________________
4
Most multiple attribute goal oriented linear models, the third approach
simulating agrarian innovation, are based on either the neo-classical economic or the innovation-diffusion paradigm [1]. Models based on these paradigms simulate the rate of innovation as induced by exogenous factors and characteristics of farms, and by the technological innovation as proposed by research and extension [9]. In these empirical models, the probability of change is based on a function assuming that farmers make decisions upon utility maximisation [123]. The models calculate the rate of innovation or explore the choice among several competing alternatives, such as plant varieties [32]. These utility maximisation models miss many of the key driving forces by ignoring farmers’ family objectives [154], and specific cultural factors (Beckford, 1984, cited by [71] p140). Moreover, they incorporate a large extent of uncertainty by making assumptions on critical management decisions by farmers [144] and fail to explain the variation in patterns of adoption and the adaptation by farmers of the innovations [71]. In short, especially classical models assuming utility maximisation do not fit with the new paradigm on the process of agricultural innovation, as they are not based on all farmers’ motives and drives but mostly on exogenous observations.
Models based on fuzzy logic allow to incorporate expert (i.e., farmers) knowledge and to consider gradual judgments, i.e. a certain extent of adoption. Fuzzy or indistinct, is the opposite of crisp that refers to the precise and decisive nature that classical models claim to have. Fuzzy set theory [169] allows computing with words and can provide a more powerful tool to model human reasoning than classical models [158]. By using fuzzy (gradual) concepts defined by linguistic values that can be valid to different degrees, fuzzy logic models (FLMs) can better mimic the ways humans argue, are able to manipulate knowledge as well as quantitative and qualitative information, and allow multiple truth’ values (in contrast to the Boolean 0-1 logic). Moreover, FLMs allow decision-making in case of incomplete information, enable handling of difficult problems more efficiently than conventional methods, and can deal with interdependence between variables and conflicts of interest [29]. Most fuzzy logic models are designed for machine control purposes, e.g. for chemical process industry and consumer electronics [83]. They were also successfully used in assessing irrigation performance by accounting the appreciation of individual farmers [64]. Kacprzyk & Fedrizzi [80] described the use of fuzzy sets in multi-person decision-making models. The ‘fuzzy reasoning mechanism’ can generate a range of solutions [147], just like farmers shape one technology into various techniques. For mentioned reasons, the fuzzy multiple attribute decision-making models are considered a good alternative for the goal oriented linear models based on the multiple attribute utility theory [56].
_______________________________________________ General Introduction
5
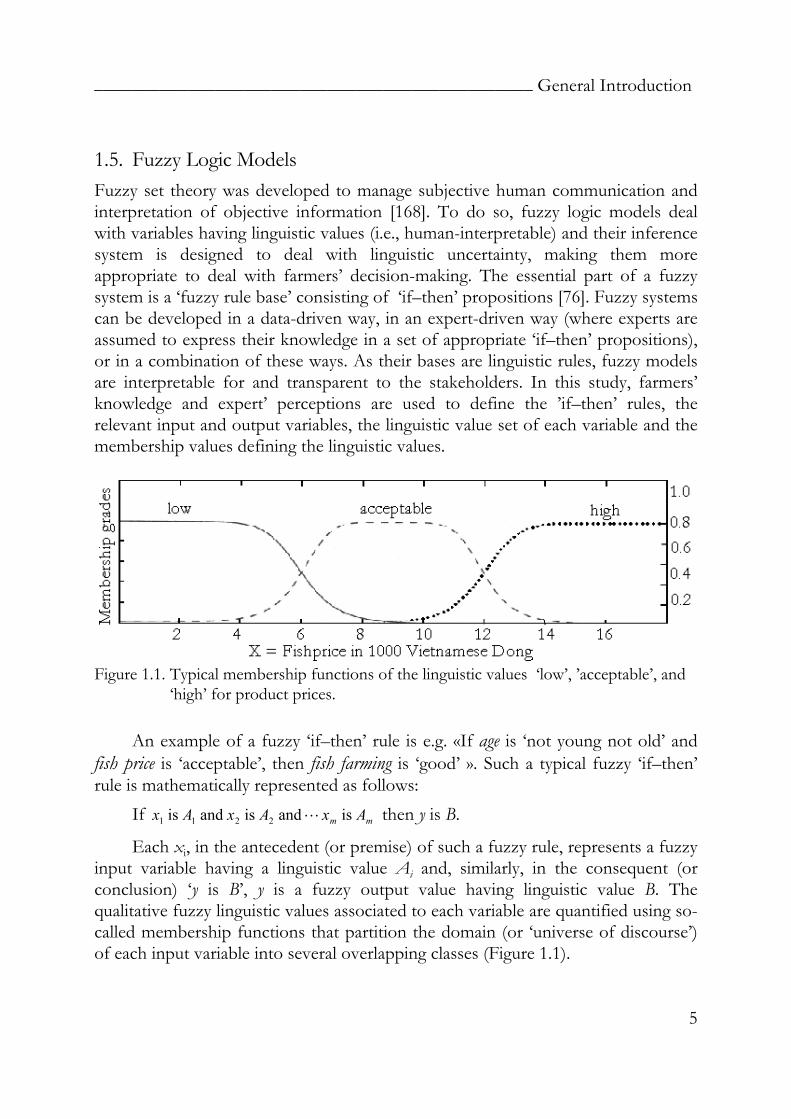
1.5. Fuzzy Logic Models Fuzzy set theory was developed to manage subjective human communication and interpretation of objective information [168]. To do so, fuzzy logic models deal with variables having linguistic values (i.e., human-interpretable) and their inference system is designed to deal with linguistic uncertainty, making them more appropriate to deal with farmers’ decision-making. The essential part of a fuzzy system is a ‘fuzzy rule base’ consisting of ‘if–then’ propositions [76]. Fuzzy systems can be developed in a data-driven way, in an expert-driven way (where experts are assumed to express their knowledge in a set of appropriate ‘if–then’ propositions), or in a combination of these ways. As their bases are linguistic rules, fuzzy models are interpretable for and transparent to the stakeholders. In this study, farmers’ knowledge and expert’ perceptions are used to define the ’if–then’ rules, the relevant input and output variables, the linguistic value set of each variable and the membership values defining the linguistic values.
Figure 1.1. Typical membership functions of the linguistic values ‘low’, ’acceptable’, and ‘high’ for product prices.
An example of a fuzzy ‘if–then’ rule is e.g. «If age is ‘not young not old’ and
fish price is ‘acceptable’, then fish farming is ‘good’ ». Such a typical fuzzy ‘if–then’ rule is mathematically represented as follows: If is and is and is 2211 mm AxAxAx L then y is B.
Each xi, in the antecedent (or premise) of such a fuzzy rule, represents a fuzzy input variable having a linguistic value Ai and, similarly, in the consequent (or conclusion) ‘y is B’, y is a fuzzy output value having linguistic value B. The qualitative fuzzy linguistic values associated to each variable are quantified using so-called membership functions that partition the domain (or ‘universe of discourse’) of each input variable into several overlapping classes (Figure 1.1).

Chapter 1 _____________________________________________________________
6
For fuzzy logic modelling the rule base, i.e. the collection of fuzzy rules describing a system, is integrated in a computing framework based on the concepts of fuzzy set theory: the fuzzy inference system (Figure 1.2). The basic structure of the fuzzy inference system (FIS) consists of four components: 1/ a ‘fuzzification module’ which a determines the membership degrees of the input values in the antecedent fuzzy rules, 2/ a rule base with ‘if–then’ rules and related membership functions 3/ an ‘inference engine’ applying algorithms on the rule base and the input data to determine the degree of fulfilment of the output variable, and 4/ a ‘defuzzification module’ which transforms the fuzzy output into a crisp output value (Figure 3.2, page 44). For machine control purposes the fuzzy output of these models is defuzzified, or decoded, into one crisp solution, most commonly by calculating the centroïd of area [76].
Fuzzy inference systemInput variables Output variable(s)
Rule base of variables
Figure 1.2. General architecture of a Fuzzy Inference System (FIS): using the membership
functions (MF) a fuzzifier determines the ‘degree of fulfilment’ of the antecedent fuzzy sets and the crisp inputs are transformed into fuzzy sets (=fuzzification=encoding) that through fuzzy inference with the composed rule base aggregate a fuzzy output. Using the MF from the output variable(s) the defuzzifier transposes the fuzzy output in a crisp output (=defuzzification =decoding). For a description of mathematical principles see Jang et al. [76].
1.6. Statement of the problem Especially in industrialised countries, farmers have specialised and abandoned mixed systems, notwithstanding its assumed advantage for sustainability. In a developing country such as Vietnam we observed a trend toward diversification. A better understanding of farmers’ decision-making towards integrated farming and its implication in models simulating agrarian development is needed, to be able to support the adoption of the more sustainable IAAS. Fuzzy logic set theory might offer a tool.

_______________________________________________ General Introduction
7
The present study analyses this development in Vietnam, in an attempt to
elucidate farmers’ motivations which enabled this change from mono-crops to integrated farming. The questions we try to answer are: (a) What were farmers’ perceptions, motivations, and decisions during the rapid
change-over to integrated systems in Vietnam? (b) Can we model the farmers’ decision-making with fuzzy logic? (c) Can we improve our understanding of the motivations to integrate various
components in the farming practises? Our underlying assumptions were that: (a) An actor centered approach allows assessing farmers’ perception of the pros and
cons, motivations, and decision-making on the integration of the various components of livestock, fish, and crop systems;
(b) Modelling farmers’ decision-making concerning changes in these complex integrated systems with fuzzy set logic allows eliciting their motivations.
After this first chapter, this thesis analyses the Vietnamese farmers’ perceptions, motives, and drives for the integration of various components into their family farm, chapter 2. In the third chapter we present a relatively simple fuzzy model simulating the integration of aquaculture in the farming system of the Mekong Delta (Figure 1.3). The 10 steps of the methodological framework that was developed are thoroughly described in chapter 4. In chapter 5 the calibration and validation of a fuzzy simulation model of the decision-making on the composition of IAAS farms in the Mekong Delta are discussed, as well as the sensitivity of the model to the various farmers’ drives and motives. A general discussion, exploring, among others, the possibilities to apply the model in other regions or in decision-support tools, concludes this dissertation.

Chapter 1 _____________________________________________________________
8
Figure 1.3. The Mekong Delta is located south of Ho Chi Minh City in Viet Nam (for
details see figure 3.1).

9
CHAPTER 2
FARMERS’ MOTIVES
FOR AGRICULTURE DIVERSIFICATION
AND ITS’ CONTRIBUTION TO LIVELIHOODS
IN THE MEKONG DELTA
Published as:
Roel H. Bosma, Cao Quoc Nam, Henk M.J. Udo, Johan A.J. Verreth, Leontine E. Visser, 2006. Asian Journal of
Agriculture and Development, Vol.2, 1&2, pp 49-66,
and complemented with Table 2.6 and related comments published in: Roel H. Bosma, Cao Quoc Nam, Henk M.J.
Udo, Johan A.J. Verreth, 2007. Assessing farmers’ motives for livelihood diversification in the Mekong Delta: household life-course, virtual farm size, and index of integration. In: Zijpp AJ
et al. (Eds), 2007. Fish Ponds in Farming Systems. Wageningen Academic Publishers, pp 261-269.
Chapter 2 ________________________________________ Motives for diversification
10
Abstract
Although specialisation is the global trend in agriculture, integrated farming systems have emerged in Vietnam. An important motive was the desire to improve the livelihoods and the diet of the nuclear families having a life-course of five phases. Off-farm diversification was especially important for a new household. At the onset of expansion, the new mothers replaced off-farm with homebound activities. During expansion the farmers increased virtual farm size by keeping more livestock; during accumulation they invested in land or education, and during consolidation old couples adjusted farm activities to their labour capacity. Livestock, including fish, was essential for livelihood. The distribution of goats instead of cattle by credit or by ‘passing-on-the-gift’ was far more effective for poverty alleviation.
Technological innovations on the cultivation of rice and fruits, and the breeding of fish were essential for change. The improved food security and reduced cash income from rice after the 1986 reforms pushed farmers to take risks. The farm area and the number of component farm activities providing cash determined the level of cash income from agriculture. Farms with at least four flows of biomass between components earned more, demonstrating that real integration improved profits. A minimum area of land in, or close to, the homestead, and know-how are required for an effective integration of components.
Keywords:
Mixed farming, intensification, household, life-course, aquaculture.

11
2. Farmers’ motives for agriculture diversification and its contribution to livelihoods in the Mekong Delta
2.1. Introduction In the more industrialized countries, a trend towards specialisation in agriculture was observed during the second half of the last century. Specialisation is often considered equal to intensification and to a higher efficiency of labour and land, but usually requires more capital. However, there is concern for the ecological, economic and social sustainability of specialized farming. For the increasing global population, it is essential to improve the efficiency of nutrient use for securing sustainable food production. Mixed crop-livestock and livestock-fish-crop systems may have the potential to maintain an ecosystem’s healthy functioning and enable it to absorb not only the shocks to the natural resource base [72, 128], but also those brought about by sudden changes in the economic environment [95]. Inversing the trend is not an easy task, given that specialized systems generally generate higher labour efficiency, but might be feasible if integration proves to be more profitable.
Contrary to the global trend of specialisation, farming systems integrating aquaculture and agriculture have emerged in Asian countries like Vietnam [94, 128]. Within the past three decades, the Vietnamese family farms in the Mekong Basin have been transformed from self-sufficient systems producing mainly rice for marketing to integrated agriculture-aquaculture farming systems (IAASs), producing and marketing a large variety of products [109]. The existing literature describes the systems but does not answer the question as to what motivated the Vietnamese farmers to integrate various components in their system. Most authors stopped short of determining whether this diversification was a mere accumulation of components without synergy, or if these components were really integrated through an exchange of wastes, thus enabling an increase of income. The identification of the factors that have driven farmers’ decision-making in the Mekong Delta (MD) since the war ended in 1976 could be a first step toward formulating strategies for diversification in other regions. In this paper we analyze, using the livelihood capital asset framework, the driving forces and motives that led to the integration of farm components, and assess the contribution of the various farm components to their livelihood.
2.2. Methodology The sampling procedures we followed the triangulating principles of Participatory Rural Appraisal (PRA), meaning that findings are cross-checked and compared by

Chapter 2 _____________________________________________________________
12
using at least three sets of contexts [33]. This approach assumes that by considering opinions from three distinguishable groups in three different contexts, a good overview of the variability and possibilities is obtained.
As a farmers’ decision to adopt an innovation can only be evaluated if the exogenous pre-conditions allow the technology, we chose for our sample two agro-ecological zones appropriate for livestock-fish-crop systems in the MD, namely, the fresh water alluvial zone (delta), and the hill and upland zone (hills). Moreover the sample had to contain users, as well as non-users, that either respond or not to the criteria of the potential user group [131]. We retained three hamlets of an existing sample representing the agro-ecological variation in the delta; these were selected for having a land-use policy allowing the development of integrated systems [122]. In the hill zone, mainly located in the districts Tri Ton and Tinh Bien along the border with Cambodia, we retained three hamlets where rain-fed agriculture predominates irrigated cropping. Hamlets are the smallest administrative unit in Vietnam and government offices are at the village level.
We interviewed 144 farmers in 6 hamlets; in each hamlet 24 were selected through stratified random sampling based on the following wealth rankings: poor, intermediate and well-off (Table 2.1). This stratification links well to the existing practise wherein each Vietnamese village has a classification of its resident families in at least three categories of well-being in accordance with the pro-poor policy [21]. For the delta hamlets, we used an existing list in which we discarded a class of very rich residents who were mostly traders. In the hills, the lists of the village security department were submitted to three knowledgeable resource persons who, as a first step, discarded non-farmers from the list. A household was assigned to the category in which at least two out of the three persons classified them; the few cases classified in three different categories were ranked as medium. When the original selection fell short of the required number due to absences or errors in classification, we completed the list by conducting another round of random sampling or by filling up the lots with a qualified neighbour in the same category.
Besides the interviews, we surveyed the literature to gather needed data. During on-farm interviews with the head of the household or his wife, we drew a resource flow diagram, collected some standard farm characteristics, and gathered information on changes since the establishment of their farm. The household was defined as the number of persons living and eating at the farm; we distinguished the non-working members from the active young, adult and old members. Open-ended questions, which addressed the farmers’ motivations for changes in the composition of his production system or for the integration of components in the system, focused on the process rather than the outcome [92, 112].

_______________________________________________ Motives for diversification
13
Table 2.1. List of hamlets in the sample and their population stratified according to class. Location Numbers in classes Agro-
ecol. zone province district village hamlet poor medium well-off
House-hold size
**
O Mon Thoi Long Thoi My 127 (7) 195 (12) 70 (5)
5,8 Tam Binh Song Phu Phu Dien 70 (6) 170 (14) 42 (4) 4,1
Fresh water alluvial
Can Tho
Cai Be Thien Tri My Hung 77 (5) 191 (13) 99 (6) 4,9
Tri Ton Le Tri An Thanh* 25 (3) 91 (11) 90(10) 4,4 Phu Hiep * 27 (8) 56 (13) 9 (3) 6,3
Upland with hills
An Giang Tinh Bien
,, An Phu ,, Phu Hoa * 8 (2) 65 (18) 14 (4) 5,8
Note: The numbers in parentheses correspond to the number of persons interviewed. * We included only the households engaged in agriculture. ** This refers only to the interviewed households.
The duration of the initial interview per household, which was conducted between February and May 2004, was restricted to two hours and concentrated on a limited number of changes. The other changes, if any, were documented in a second series of interviews that we held in August 2004, when we also asked farmers to rate their knowledge of the most frequent farm activities and to rate the importance they gave to a rice-field for food security, both on a scale of 1 to 5.
A series of interviews in a hamlet ended with a meeting to collect supplementary information from individual farmers and to focus on specific topics. The group of farmers was asked to rank activities according to the required labour, capital or knowledge and we asked them for information to help us trace the historical development of prices or margins for various components. Pairs of farmers also established ‘if–then’ rules which consisted of the conditions they believed should be met before undertaking a specific activity such as planting a specific crop or raising livestock. These conditions centred on various components such as the land area and quality, water, savings, family labour and market. These were rated using the following linguistic terms: very bad/low (không ảnh hưởng); bad/low (ảnh hưởng rất ít ); acceptable (trung bình); good (khá nhiều); and very good (tốt rất nhiều). The linguistic values were converted into numerical value using a classification grid, averaged, and the obtained numerical values were transposed back into linguistic values using the original grid (Table 2.4).
Farm characteristics, descriptive information, and the reasons for the change and integration of components were entered in a database using the program MS-Excel®. The extent of the integration of various components was quantified by

Chapter 2 _____________________________________________________________
14
assigning the value 1 to each flow between two components: e.g., when rice bran was fed to pigs, a value 1 was attributed to the flow field-livestock; when manure was returned to the field, the total value became 2. The cumulated values represented an Indicator for the Integration of Components (IIC).
Financial information was collected based only on the net cash income from the farm components, either in local currency (VND1) or in the local gold standard (Cay2). We did not ask the farmers to quantify the contribution to home-consumption, as we considered the recall method over a long period less reliable, and also because a large variety of products were available on most farms.
Table 2.2. The capital assets for analysis of livelihoods Capitals Description Natural The natural stock from which resource flows are derived (e.g. water, wildlife) Social The social resources (networks, membership of groups, relationships of trust,
access to wider institutions) upon which people draw in pursuit of livelihoods Human The skills, knowledge, ability to labour and good health needed Physical The basic infrastructure (shelter, water, energy and communications) and the
production equipment and means which enable people to pursue livelihoods Financial The financial resources available to people (whether savings, supplies of credit
or regular remittances or pensions) and providing different livelihood options. Source: Adapted from [31] and [144].
The net cash income was distinguished as coming from: on-farm activities (CAF), livestock (CIL), and off- and non-farm activities (CON). For analytical purposes we also derived the number of Components contributing to Cash Income (CCI). Statistical analysis, comprising means and standard error of mean, frequency distributions, the non-parametric Spearman’s rank correlation coefficient (rho), and univariate analysis of variance, was done using SPSS®-12.0 [149]. To analyze the qualitative data we used the livelihood capital assets framework [2] which considers five capitals, namely: natural, social, human, physical and financial (Table 2.2).
1 VND=Vietnamese dong; kVND=1,000 VND; mVND = 1,000,000 VND. 1st quarter 2004: 1 US$ = 15,500 VND; 1 Euro = 18,500 VND. 2 1 Cay = 10 Chi = 1.4 Ounce; Value development: 1 Cay = 2.5 mVND (1976), 3 (1983), 4 (1991), 4.5 (2001), 5.5 (2002), 7.5 (2004).
_______________________________________________ Motives for diversification
15
2.3. Results
2.3.1. Natural Capital In the delta of the MD the natural resources are derived from land, its forests and water. The land use is mainly determined by the flooding period, the possibility to manage the water level, the attribution of land user rights, and the farm size.
The MD is located within a tropical monsoon climate zone with one rainy season. Seasonally, all its lowlands are flooded for two to six months with water levels between 0.3 to 3 meters, depending on the year and location (various authors in [164]). The effects of the diurnal tides of the South China Sea are felt in the river and waterways, up to the Cambodian border. Upon the construction of a network of waterways in the lower reaches of the Mekong after 1840, people settled along or on the raised borders of the waterways, mostly building a wooden house with raised floor. The waterways, its tides and the yearly flood imposed on their livelihood practises. For the choice of their homestead, the rural people in the delta of the MD still give a higher priority to access to a waterway than to a road. To construct dry land for a homestead in the seasonally flooded fresh water alluvial zone, in the swamps, or in the rice-field, people excavate soil, thereby creating a pond. These ponds are suitable for undertaking aquaculture because it naturally attracts fish after the retreat of the floodwater.
To restrict the effects of flooding and tides and to allow the management of water for irrigation and multiple-cropping seasons, dams were built after 1976. The nature of the IAAS that developed depended on the physical conditions, that is, intensive fruit and low-input fish culture on fertile soils with low flood levels, semi-intensive fruit / medium-input fish systems on less fertile soils with medium flood levels, and extensive fruit / high-input fish systems on less fertilized soils with high monsoon flood levels [110]. If the infrastructure for water management did not allow sufficient immerging and draining, the soils acidified and fertility went down dramatically [156].
In the hills, the land quality varied considerably between farms and hamlets; only 57% of the farmers also had access to lowland fields. About 25% of the upland farms had homesteads on loamy soil and easy access to underground water welling after removal of the upper loamy layer, while most had only shallow sandy soils, and thus needed concrete water reservoirs. The former planted three or four crops a year, while latter could plant only cashew trees on the sandy soils, plus one other crop if the slope had more favourable conditions. The sandy or shallow soil could be a reason for not having a fishpond [17]. In the hills some ponds were used mainly to store water for livestock and orchards [ibid.].

Chapter 2 _____________________________________________________________
16
0
2
4
6
1975 1980 1985 1988 1990 1995 1997 1999 2000 2004Year
Cay
/ co
ng delta lowland rice orchard Cai Beorchard Tam Binh hills lowland rice hills upland rice orchard An Phuorchard An Thanh forest upland
Figure 2.1. Price development of various types of land in the Delta and Upland villages of
the Mekong Delta (Cay/cong = value in 1.4 Ounce of gold per 0.1 ha).
Since 1992 the government has attributed land to the farmers cropping it; against payment of a fee for registration and measurement, they could obtain either a red (owner) or a green (user) certificate. Green certificates were given for land having communal interest, e.g. forest. Holding a green certificate for forest plots required farmers to bring land use in line with regulations; e.g. in the MD, land more than 30 meters above sea-level had to be planted with perennial crops like timber and fruit trees to prevent massive deforestation and subsequent erosion.
Gradually a liberalized land market developed; the access to land became dependent on capital availability, and the prices of land increased (Figure 2.1). The sudden increases in land prices were due to policy changes (mango/fruit export after 1990), improved water management (construction of a dam after 1999 in Cai Be and Tam Binh), or new technologies (e.g., artificial stimulation of mango flowering after 2000 in An Phu but not in An Thanh, causing a difference in the value of orchards). Due to demographic pressure of the Kinh (see below) and multiple-cropping options in the hills, the prices for upland fields became higher than those of the irrigated rice-fields that stay flooded for several months.
Notwithstanding the relatively recent occupation of the MD, the average farm size was small: 1.0 ±1.8 ha in the delta and 2.1 ±2.3 ha in the hills (Table 2.3). Due to demographic growth in the delta, the area of the homesteads had shrunk significantly such that neighbouring households agreed not to raise pigs because of the stench it caused. The average area of the homesteads in the hill zone was about twice the size of those in the delta, except for An Thanh where most families lived on roadside plots that were allocated to them after the war with Cambodia in 1978.

_______________________________________________ Motives for diversification
17
Table 2.3. Average sizes of farmlands, and fishponds, and the distance from homestead to fields, main roads and main market for the products
Size (ha) Distance (km) between homestead and
home-stead lowland upland total Pond
(m2 ) low land
up land
mar- ket
field &road
Thoi My 0.21 0.71 0.92 234 (22) 1.0 9.1 2.3 Phu Dien 0.18 0.83 0.94 570 (23) 0.3 10.9 2.5 My Hung 0.20 0.40 0.60 274 (23) 0.7 3.6 1.6 An Thanh 0.27 1.43 (14) 0.60 (17) 1.68 597 ( 3) 1.3 (14) 3.9 (17) 2.0 0.4 Phu Hiep 0.56 0.63 (12) 1.76 (16) 2.01 242 ( 9) 0.2 (12) 1.2 (15) 1.6 0.3 Phu Hoa 0.57 1.67 (15) 1.21 (17) 2.62 427 ( 4) 3.2 (15) 1.7 (17) 2.4 0.6 Average 0.33 0.87 0.80 1.62 360 1.5 1.3 4.9 1.3 Note: The numbers in parentheses refer to the number of farms. If no number is
indicated, then the total is 24.
In the hills, the Khmer, who were the original inhabitants, mainly owned the lowlands while the Kinh or ethnic Vietnamese occupied the uplands. After the war, the Khmer population thinned due to emigration, and the resettlement of the Kinh along the hillside roads boosted the cultivation of the uplands. Our sample contained only two Khmer households, as we selected hamlets where rain-fed agriculture predominated irrigated cropping.
Very often the poorest rural households did not have enough land and made most of their income from non- and off-farm activities; some did not consider themselves as farmers, though the resource persons classified them as such. The total land area was positively correlated with the total cash income (rho=0.35; p<0.01) and with various household characteristics: in the delta with the households’ labour availability, as well as its life-course (rho=0.3; p<0.05), and in the hills with the household size (rho=0.3; p<0.05). The findings on the delta support the data of [122] which explained the variation in per capita income by the total cultivated area of the household.
2.3.2. Social Capital Social capital refers to the major networks, groups, relationships of trust, and wider institutions of society upon which people draw in pursuit of livelihoods. These include the family, the neighbours, the network of traders, and the political structures. The national land-use policy affected the temporal and spatial spread of

Chapter 2 _____________________________________________________________
18
innovations, and middlemen emerged as important after the 1986 ‘Doi Moi’ reform of the central economy.
The farmers traced about half of the changes in their farming systems to an information source. The most important sources for information were relatives and neighbours: 16% and 19%, respectively, while the media and extension services accounted for 7.5%, and friends, for 5%. People relied mostly on local social networks for price information; they considered the prices given by the media as not applicable to their locality.
Local government support and intervention structures for agriculture depended upon the national land use policy plan. The land-use policy supported the creation of IAAS with the mix of aquaculture, orchards, livestock and rice in the delta, and the combination of cattle, crop and orchard systems in the upland hamlets. Until recently, the extension services in the hills did not include agents specialized in aquaculture. Notwithstanding the land-use policy, farmers in the hills introduced aquaculture, and subsequently the extension and credit services became more attuned to the farmers’ needs.
After 1994, the Poverty Alleviation Program supported households classified as poor; poor households did not have to pay school fees and were given access to credit with low interest rates. We could not confirm the commonly-held observation that this had led to larger family sizes among the poor: the correlations between number of children and the wealth index or income were not significant. In the hills, goats were included in the pro-poor land-use package through the initiatives of an NGO. Such induced chronological differences caused technologies to have different impacts in the districts and their hamlets [122].
Between 1979 and 1990, the incentives given to farm households were directed towards achieving self-sufficiency within cooperative units numbering 10 to 12 family farms; moreover, the marketing for most products was either restricted to the local markets (e.g. vegetables) or state-regulated (e.g. pigs, rice and clothing). This policy of enforced cooperativism bred a general distrust of cooperative marketing.
Before 1976 the farmers used middlemen only for trading pigs. Between 1976 and 1986, for access to legal markets outside the village, farmers depended on the middlemen to undertake the administrative procedures needed for the transport of products. Gradually middlemen imposed themselves in most commercial chains and at present most produce from farms in the MD reach the market through middlemen who determine a price and collect produce from the farm. Since most farmers felt that doing the paperwork and dealing with the bureaucracy would cost them too much time and money, given that the quantity of their products was not big, they increasingly relied on middlemen who they believed were more

_______________________________________________ Motives for diversification
19
knowledgeable about these administrative procedures, especially when for export. This system favoured the integration of a large numbers of small producers in the global market.
2.3.3. Human capital Three sets of factors affected the valuation of human capital: the household life-course, education and knowledge, and the importance given to the rice-field for food security. The mean size of the nuclear families varied somewhat between hamlets, but the averages of the delta and the hills were equal (Table 2.3). The household size was positively correlated to the off-farm and non-farm income (rho=0.3; p<0.05). In the hills, off-farm labour was available for three months only and the demand was high for 21 days during rice harvest; the opportunities for earning from non-farm activities were limited.
Household life-course Farmers repeatedly mentioned the following drives for innovation: improving income and diversifying the diet, both mainly for the well-being of children. These can be analyzed in the context of the five phases of the household life-course, namely: preparation, creation, expansion, accumulation, and consolidation, which in our sample accounted for 3%, 1%, 49%, 28% and 19%, respectively.
In the local language, the step from preparation to creation is referred to as separation. At separation most couples already have children, explaining the low frequency of households in the creation phase.
Text block 1: Raising ducks, a risky livelihood strategy for the landless in the MD
Raising ducks for eggs was one of the livelihood strategies of landless households. An enclosure of nets on a public dike kept the ducks together at night and a bedding of straw prevented the eggs from breaking; unlike hens, ducks may lay eggs in an unprotected place. The flock-size for intensive production varied from about 500 to 5000 ducks. Landless households could start small and once the flock grew bigger, they could hire a youngster to help them raise these ducks, while developing other activities themselves.
Farmers knew raising ducks was risky; diseases may kill all ducks of a flock within a few days. Three farmers in our sample sold land to reimburse credits for raising ducks. However, even 3 months after the avian influenza and the “stamping out”, farmers with insufficient alternatives to earn an above-average income but with experience in raising ducks took out huge loans to restart.

Chapter 2 _____________________________________________________________
20
During the preparation phase, a new couple stays in the household of the husband’s parents until the next son marries; then the first married couple separates from the family and creates its own household. During the period of cohabitation, the young couple prepares their future by developing off-farm or non-farm activities, to accumulate savings. If the parents or the parents-in-law had accumulated enough fields, they could give land to the young couple at the creation of their household. After the young couple leaves the husband’s parental household, most young families exploit the available resources through the optimal diversification of activities: non-farm, off-farm, and on-farm, whether requiring land or not. For landless couples who are creating a new household, the alternative would be to pursue non-farm and off-farm livelihood opportunities, like raising ducks (Text block 1).
Normally, young couples raise both chickens and ducks and, if sufficient capital is available, also pigs to produce food for home-consumption, to employ family labour, and to earn cash. The timing of the cash income would depend on the type of livestock raised. Ducks are cheaper than chickens and could be sold after three months, providing cash income in the short term. Chickens could be sold after six months providing medium-term cash. Raising a pig would be like saving money: each day one puts in a small investment and once the pig is sold, one would have accumulated a large sum, mostly with interest. Table 2.4. The ‘if–then’ rules guiding farmers’ choice of a specific activity (limited list);
average of rating lists from 20 pairs of farmers. If land area,
and land quality,
and water availability,
and savings,
and labour,
and market,
then I :
Good good good good acceptable * plant rice acceptable good low acceptable acceptable acceptable plant cassavaacceptable good acceptable acceptable acceptable acceptable plant corn Good good good acceptable good acceptable plant vegies acceptable acceptable bad acceptable acceptable Good plant cashewGood good acceptable good acceptable excellent plant citrus acceptable acceptable good acceptable low Good fatten fish Small low acceptable acceptable low Good raise chickenacceptable low good acceptable acceptable Good raise ducks Small low good good low Good raise pigs acceptable low acceptable good acceptable Good raise goats acceptable low acceptable good acceptable excellent raise cattle * The average of the pairs was ‘good’, but during a validation meeting farmers
contradicted this, reasoning out that the irrigated fields need to be cultivated anyway to prevent crowding by weeds.
_______________________________________________ Motives for diversification
21
The livestock is kept in small numbers: as long as their number is small they
could feed themselves by scavenging and with the available residues or resources the farmer could collect himself without supplementary investment. Keeping small numbers of different animals which shared the same type of feeds would still generate enough profits because those small numbers need only a small investment. Focusing on one type of livestock would require more animals in order to earn the same amount of cash income, and greater capital investments in, for example, housing and feeding to make an intensive system possible.
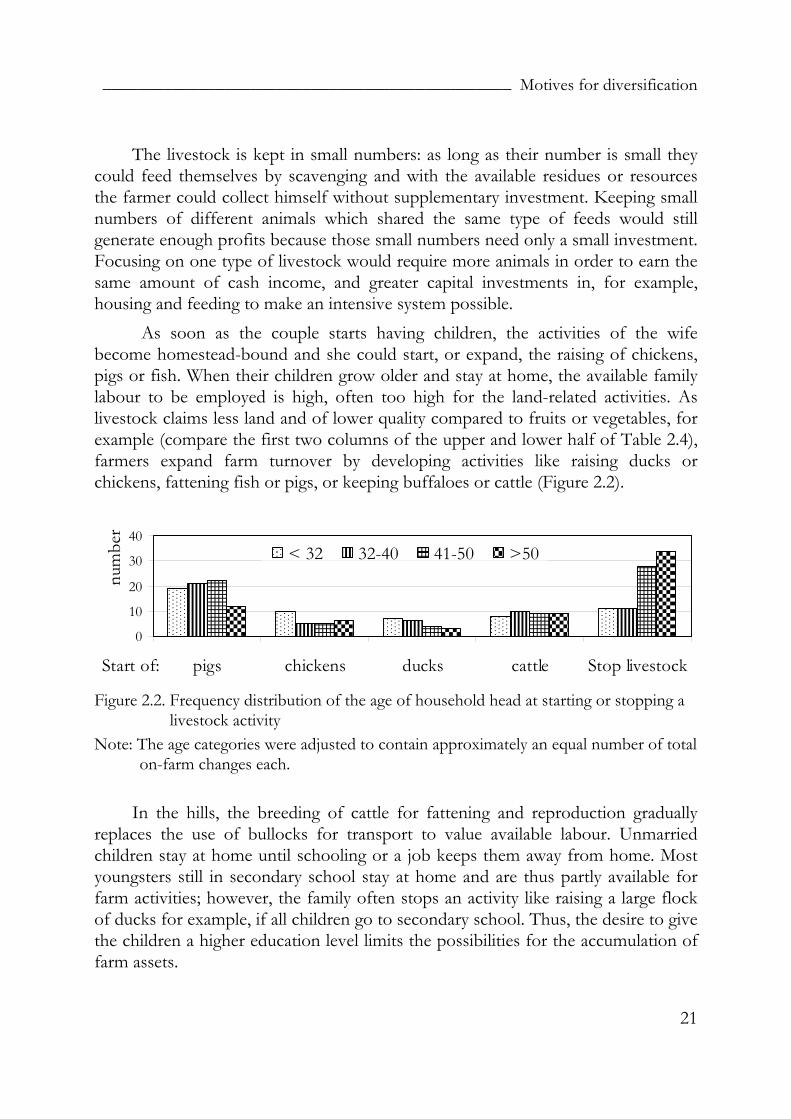
As soon as the couple starts having children, the activities of the wife become homestead-bound and she could start, or expand, the raising of chickens, pigs or fish. When their children grow older and stay at home, the available family labour to be employed is high, often too high for the land-related activities. As livestock claims less land and of lower quality compared to fruits or vegetables, for example (compare the first two columns of the upper and lower half of Table 2.4), farmers expand farm turnover by developing activities like raising ducks or chickens, fattening fish or pigs, or keeping buffaloes or cattle (Figure 2.2).
0
10
20
30
40
pigs chickens ducks cattle Stop livestockStart of:
num
ber
< 32 32-40 41-50 >50
Figure 2.2. Frequency distribution of the age of household head at starting or stopping a
livestock activity Note: The age categories were adjusted to contain approximately an equal number of total
on-farm changes each.
In the hills, the breeding of cattle for fattening and reproduction gradually replaces the use of bullocks for transport to value available labour. Unmarried children stay at home until schooling or a job keeps them away from home. Most youngsters still in secondary school stay at home and are thus partly available for farm activities; however, the family often stops an activity like raising a large flock of ducks for example, if all children go to secondary school. Thus, the desire to give the children a higher education level limits the possibilities for the accumulation of farm assets.

Chapter 2 _____________________________________________________________
22
Until recently, farmers intended to accumulate enough land for each of their children to be able to create a family farm. If farming represented the major opportunity for youngsters after primary school, the expanded farm turnover generated capital that was used to invest in rice-fields thus increasing real farm size. After ‘Doi Moi’, the possibilities for education and for non-farm employments increased and some parents invested in the education of their children instead of land; farmers also invested in houses in major villages and cities. Both investments at first contributed to family livelihood and later served as wedding dowry, i.e. starting capital for the newly-created families of the children.
In principle, the youngest son stays at the parental homestead and has to take care of the parents. If the youngest married son lives with his parents, it is hard to classify the family farm in one of the five phases. The parents adjust the farming system to their labour and capital capacity if: 1) the land size of the family is insufficient for both the parents and the household of the youngest son, and 2) the son finds permanent employment in a non-farm activity at a far distance from the parental homestead. In such cases the parents stop raising livestock (Figure 2.2) and replace their rice-field or other annual crops with an orchard or a fishpond which requires a smaller area and less labour input (Table 2.4). According to the farmers’ ranking, the labour demand for fruit is lower than for vegetables and rice but higher compared to most livestock and fish. The number of independent older couples seemed to increase because parents wanted their children to leave agriculture and thus invested in their education. Table 2.5. Farmers’ ranking for increasing level of knowledge and experience needed for
different farm activities, in three upland and three lowland villages. Village Know-how needed → little → → → → much → Thoi My * Rice cattle pigs Chickens fish orchard ducks**/goatsPhu Dien Rice pigs chickens fish/orchard goats cattle ducks** My Hung Rice orchard pigs Fish chickens ducks** (cattle/goats) An Thanh Cattle rice orchard Pigs fish ducks** Phu Hiep cattle/rice orchard chickens Pigs goats ducks** fish Phu Hoa cattle/rice orchard chickens pigs/goats ducks** fish * The one person with a lot of experience in fruit thought it easy compared to pigs,
chickens and fish and insisted on its ranking like My Hung; most farmers raised cattle or buffalo in the past.
** Laying ducks; ducks for meat were mostly ranked equal to chickens extensively raised.

_______________________________________________ Motives for diversification
23
Formal education and know-how Know-how on a farm activity was a decisive factor in opting to start or not to start a component. “I practised it on our parents’ farm” was a frequent answer to the question of why one chose to start a farm activity. This was also reflected in the farmers’ ranking (Table 2.5). The formal education level of the farmer population has been changing: the older the household head, the lower his formal education level (rho= -0.21, p<0.05). The formal education level of the household head was positively correlated to the IIC (rho=0.25, p<0.01) and the CAF (rho=0.3, p<0.01).
Due to the frequent introduction of new species, the farmers in the delta ranked fruit farming more difficult, but the farmers in the hills considered aquaculture and raising ducks more difficult: in the delta, almost every farmer bred fish or ducks (Figure 2.5). This was confirmed by the slightly higher frequency of insufficient know-how of aquaculture as a reason not to breed fish in the hills [17].
Breeding fish in latrine ponds for home-consumption was ranked even less difficult. Most farmers just stocked the fish; if the fish got sick they let them die and replaced them with new fingerlings, as their knowledge on fish diseases was limited. Not all hill-zone farmers were aware of the possibility to fatten fish in the rainy season (Text block 2), as is common practise in the uplands in the north of Vietnam [21]. However, farmers rated information as low as 5th on a list of seven factors driving farmers to adopt aquaculture in the delta [110].
The level of know-how needed for raising chickens, ducks, and pigs was ranked high, not because more experience was required, but because it was risky compared, for example, to raising cattle, notwithstanding that farmers knew most diseases (Table 2.5). Cattle-raising was recently introduced in the delta. According to the farmers, cattle are more frequently attacked by diseases than the buffaloes they raised in the past, explaining the higher ranking in Tam Binh. Relatively more farmers in the hills raised very large flocks of ducks in the nearby irrigated areas;
Text block 2: Solving the water constraint to improve the livelihood.
The lack of water did not prevent an elderly couple in Phu Hoa with a small homestead and orchard from breeding fish. When complementing their income with off-farm labour in rice fields became too heavy, they gradually switched to trading fish. The basket of fish bought from the fishermen also contained small fish in excess of their own needs. The old man dug a 6 m2 hole in his sandy soil, brought clay to reduce leaching, and complemented rain water with water he carried from a well. After some years he used a plastic sheet to reduce leaching from his small pond. During the wet season they raised the small fish and some extra fingerlings to marketable size and earned nearly VND 20.000 per day. The man acquired the know-how from radio, television and by inquiring from other farmers.

Chapter 2 _____________________________________________________________
24
this could explain why the farmers in the hills rated the need for family labour for raising ducks significantly higher than those in the delta: high (3.6) and low (2.7), respectively (p=0.05).
The state provided information and innovations to the farmers through the media and their research and extension services. Training topics were related to the land-use policy. The poor farmers had limited access to the media but some picked up ideas during their travels (sometimes because of military or community services), and visited friends to acquire specific knowledge for new farm components.
Figure 2.3. Trend of market prices for rice, broken rice, rice-bran and pig, and the gross margin for pigs.
Rice-field and food-security For people living in the Vietnamese Mekong Delta, rice was and still is the main staple crop. Until recently, having a rice-field was the first step in the creation of a new household because it guaranteed food security. Surplus production was sold to pay inputs and to obtain cash. Until 1986 Vietnam had imported rice, but the construction of dikes for water-management and the new rice technologies have allowed the cultivation of three rice crops a year. Between 1989 and 1995, the price competitiveness index for rice decreased by an annual rate of 5.5% [73] and in 1994 the government purchased huge quantities of rice to support the farm-gate price [90]. Since 1996, exports have been allowed and an acceptable farm-gate price for rice has been set in accord with the global rice market. At present the farm-gate price for rice is above the level of 1995 (VND 1.500 to VND 2.000 per kilogram), but it dropped to as low as VND 800/kg in 1998 and 1999, thus forcing several
-1
0
1
2
3
4
1990 1995 1996 1997 1998 2000 2001 2002 2003 2004
Year
VN
D
pigs (x millionVND/100kg)GM/100kg pig (x million VND)ricebran (x 1000VND/kg)broken rice (x1 000VND/kg)rice (x 1000VND/kg)

_______________________________________________ Motives for diversification
25
farmers to sell land to reimburse short-term loans they incurred to finance inputs for rice cultivation.
The continuous availability of rice in the market at the relatively less fluctuating prices since 1989 (compared to pigs, for example, Figure 2.3) and the level of their production reduced the farmers’ preoccupation to produce rice on-farm as a means to provide for their family’s food security. This change was demonstrated in the negative correlation between the importance given to rice and the cash income derived from fruits (rho = - 0.28, p<0.05).
Figure 2.4. Farmers’ ratings on the importance of a rice-field for food security.
In the hills the importance of a rice field was lower than in the delta because farmers relied more on other staple crops for food security (Figure 2.4). In the delta, for more than half of the farmers, the link between rice and food security was still a very important factor in their decision-making. Others maintained the minimum area of rice-field to secure food provision and took more risks with other activities, thereby transforming most of their rice-fields into ponds or dike-ditch systems. Having one’s own rice-field was not important for 5% only and this comprised the specialized breeders and producers.
Table 2.6. The percentage of farmers that intensified or increased one of the mentioned on-farm activities since 1976 and since 1995.
Period Pigs chickens brood-fish fish-pond orchard 1976-2004 13 11 17 38 32 1995-2004 8 11 13 26 18
Though the number of farmers producing rice or fruit either for home-
consumption alone or for both marketing and home-consumption hardly changed over the past 10 years, about half of all farmers intensified one or more activities over the past 30 years. The frequency of intensification was higher since 1995 compared to the period between 1975 and 1994 (Table 2.6). Over the past 30 years one third of the farmers replaced part of the rice-field with an orchard. The number of farmers raising fish increased only slightly, but close to 40% of the
015304560
low medium high very high
% deltahills

Chapter 2 _____________________________________________________________
26
farmers intensified fish production either through using artificial brood-stock or increasing the total pond-area. The intensification of the chicken production was entirely realised after 1995.
2.3.4. Physical Capital The availability of waterways and roads to markets, of dams for the management of water, and of neighbours’ activities affected the valuation of physical capital in the pursuit of livelihood. We did not consider the individual distribution of production equipment in our analysis.
The importance of the distance between the field and the road or waterway was reflected, for instance, in the prices for orchards in O Mon: the orchards on the border of a waterway or at the roadside have a higher market value than the orchards within the field. Though middlemen collected the products mostly in bulk, to get the best price farmers could transport their produce to the main road or a nearby market. In the delta most transport went by boat; thus distance to the road was not as important. In the hills the distance to the road affected the number of farm components positively (rho = 0.25, p<0.05), indicating a higher tendency toward self-sufficiency.
According to our sample, neither the distance between the fields and the homestead or the road, nor the distance to the market affected the income. But for the delta area, differences in the management of IAAS farms in the three districts were significantly related to the distance of farms to main markets [122]. In the delta, farmers rated the presence of outlet markets second, while the presence of traders and fish processing companies was rated as having the lowest impact among seven factors driving farmers to adopt aquaculture [110].
The possibility of cultivating three crops a year in the delta was a relatively more recent development in Tam Binh (1997) compared to O Mon (1983) and Cai Be (1986). Consequently, rice still occupied 70% of the cropland in Tam Binh while it was about 50% in Cai Be and O Mon [120], also because soil in Tam Binh was less fertile and more prone to acidification [110]. Rice production had become less attractive for at least three reasons: the double- and triple-rice technologies improved family food security, the gross margins of triple rice were lower than double rice due to the high costs of inputs [109], and they failed to realize profits when market prices dropped due to oversupply.

_______________________________________________ Motives for diversification
27
As the irrigated fields needed to be cropped to maintain their value3, farmers looked for alternatives; at first they replaced the third rice crop with vegetables, but finally they replaced all three rice crops. The farmers who resorted to the latter transformed part of their rice-fields into ponds, orchards or ditch-dike systems to produce fruit and fish species which fetched good prices in the market.
Farmers produced marketable fruits on raised beds or embankments that gradually developed into ditch-dike systems; the ditches provided water for irrigation and contained fish, either naturally retained or stocked [90, 128, 142]. Also in the hill zone, close to canals and to roads in irrigated areas, farmers constructed ditch-dike systems.
The changes made by farmers could also be induced by their neighbours if the latter’s innovations changed the physical conditions. For example, in An Thanh, a widow replaced the annual cassava with the perennial bamboo some years after her neighbour had planted Melaleuca trees and her narrow plot was shaded all day; the first bamboo became marketable in three years’ time. Another example: a farmer in O Mon transformed the rice-field near his homestead into a ditch-dike system as the water management was adjusted to the fruit production of his neighbours, making irrigation for three rice-crops no longer possible.
2.3.5. Financial Capital The type of crop, the market opportunities, and the availability of credit affected the financial resources that provided livelihood options. Less then 5% of the households profited from regular remittances, pensions, or irregular remittances; the last were often used to invest in new farm components.
In the emerging market economy, the cropping of rice alone was disadvantageous compared to the IAAS wherein fruits and vegetables were grown, and livestock raised, aside from planting rice. With rice alone, one could earn cash only one to three times a year, thus failing to meet one’s need for cash on a regular basis; also the rice-field could be too small or the yield too low to earn the cash needed. Orchards planted with several species provided a more regular cash income and mostly with higher gross margins. This was reflected in the price development of land in the uplands, especially since the chemical stimulation of the flowering of mango was introduced after 1998: since 2001 the price of land for orchards had become higher than for lowland irrigated rice-fields (Figure 2.1).
3 If they did not use the irrigated field, it would be too difficult to get rid of the weeds for a next crop; also, needing food anyway, they planted rice.

Chapter 2 _____________________________________________________________
28
A good market was a condition for the development of new activities like fish or fruit farming (Table 2.5), but not a major condition for cultivating rice on the irrigated fields, for keeping ducks or chickens in small numbers, or raising fish in latrine ponds. One farmer replaced all his fruit trees within three years after planting, and then concentrated on another type of fruit; unfortunately, the market prices of the particular species he chose dropped also dramatically.
The ready availability of capital was essential for most farm components (Table 2.2). Lending among relatives and friends was frequent, mostly without interest, and with no collateral required. Loans from banks for agriculture have only become available since 1992 when the introduction of land certificates gave land a collateral value. In 2003 the collateral value of the red certificate was VND10 million (US$645) and the green certificate was valued half of the red. Most institutional credit for farmers was available for activities related to the land-use policy or to the poverty alleviation program. Short-term loans for crop inputs were available from banks, input providers, and traders. For some years, specialised services provided inputs like fertilizer or animal feed and collected the produce, both for a contractual price that often included an interest rate close to the one asked by private money lenders. Private money lenders did brisk business and were charging at least triple the interest rate of the banks. To solve the capital constraint for aquaculture, several farmers had provided soil for the construction of a road or a homestead.
2.3.6. Contribution of Farm Components to Livelihoods The wealth ranking was corroborated by a positive correlation of the three classes of well-being with the total net cash income (rho=0.4; p<0.01). The rank of well-being was also related to the family farms’ total land area (rho=0.43; (p<0.01) and to the CAF (rho=0.4; p<0.01).
Mean household cash income was slightly higher than VND 18 million/year (i.e. 0.64 US$.day-1.person-1). In the delta, 58 % of the families earned from both CAF and CON, compared to 36% in the hills; average CAF and CON were close to 12 and 6 mVND.yr-1, respectively (i.e. 0.32 and 0.16 US$.day-1.person-1). The most important contribution to cash income for close to 70% of farmers in the hills came from fruits, while for almost 80% in the delta it came from rice (Figure 2.5). More than half of the farmers also earned cash income from raising chickens, for example, but for most, the profit was negligible. Almost half of the interviewed farmers raised pigs but for only 8% was it a substantial contribution to cash income (>15 kVND.day-1, >0.95 US$.day-1.person-1). In the delta the average contribution of fruits to cash income was about the same as that of pigs, fish, or crops other than rice. The level of cash income derived from ruminants and ducks

_______________________________________________ Motives for diversification
29
demonstrated an effect of specialisation: the few farmers keeping cattle in the delta or ducks near the hills had high cash returns from this component.
Legend: C : % of farmers doing the activity; CC: % earning cash from this component; CCI: the income earned from the activity (in 100.000 VND). Figure 2.5. The percentage distribution of farmers and incomes earned from the activities
undertaken in the delta and hills of the Mekong Delta.
Livestock allowed farmers to expand the farm turnover without increasing farm size, and was essential for poverty alleviation. On average, the income from livestock, including fish, formed close to 1/3 of the total net cash income; it contributed 64% and 32% to CAF, respectively in the delta and the hills. For the average five-person household, this amounted to US$ 1 to 2 day-1. According to farmers, the availability of family labour was important in the decision to start or to stop raising livestock, but the income from livestock was not correlated to household size or the number of adults. Negative or low margins were the most general reason for stopping a farm activity or changing the type of crop (Text block 3). The farmers raising pigs to obtain manure for fish were reluctant to stop when the profit margins from pig fattening dropped since the income from fish compensated for the losses. These farmers bought concentrates for the pigs only; the manure fertilized the pond and they had no need of cash for other feed input.
Farmers could build up a livestock component through own capital investment, credit, sharing, or ‘passing on the gift’4. For the share-holder, sharing was a way to start raising cattle, goats or pigs without capital investment and for the share-owner it was a way to earn interest without investing in labour. For the share-owner, sharing was lucrative: one of them in the hills made an interest of approximately 50 %.yr-1 after his investment in goat raising. For the shareholder, sharing beef cattle to fatten could be profitable if the fattening period was short, 4 Heifer International was one of the sponsors of this program.
020406080
100
rice crops fruit fish pigs chickens ducks ruminants
VND 100.000delta C delta CC delta CCI hills C hills CC hills CCI

Chapter 2 _____________________________________________________________
30
but sharing cattle for reproduction should be recommended only for those having other regular cash-generating activities and supplementary labour, like the adolescent members of the household. For the poorest, building up a cattle herd by sharing or credit proved to be a losing proposition; their meagre finances usually forced them to sell the cow even before it begot a calf. Out of eight farmers in the hills starting to raise cattle through sharing or credit, five stopped: two of the latter needed to reimburse the credit and three needed additional capital. Worse, one still had a loan to pay, yet did not have cattle in his possession. Those who raised chicken, pigs or goats did not experience these difficulties to the same extent.
2.3.7. Farm Diversification: Cumulate or Integrate The average number of farm components (NC), the IIC and the CCI were all significantly higher in the delta than in the hills: respectively 5.5 versus 3.8; 4.5 versus 2.5; and 3.7 versus 2.7 (p<0.001). The CCI was positively correlated to the rank of wealth (rho=0.4; p<0.01) in both delta and hills, and to the NC and the IIC in the delta only (rho=0.3, p<0.01). In the delta both IIC and CCI correlated significantly to the CAF (rho=0.3; p<0.01), but in the hills the CAF was correlated significantly only to the CCI (rho=0.3; p<0.05).
In the delta the distance to the lowland fields affected the IIC negatively (rho= -0.2, p<0.05), and in the hills the distance to the upland fields affected the CCI and the IIC negatively (rho= -0.3, p<0.05). Only in the delta were the correlations between the farm area, on the one hand, and the IIC and CCI on the other, significantly positive (rho=0.3, p<0.01); meaning that the very small farmers turned to specialized tasks. The positive correlation (rho=0.3, p<0.01) between the size of the homestead and the IIC in the hills confirmed that integration needed a minimum area of land in, or close to, the homestead. Indirectly this shows that the availability of labour and transport equipment limited an effective integration through the exchange of wastes.
Text block 3: The pig cycle.
In the past four years, 23% of the interviewed farmers stopped raising pigs due to low margins. The gross margins from pig fattening have fluctuated dramatically (Figure 2.3). The last dip was related to a decline in the market price for un-slaughtered pig from 14,000 to 8,000 VND/kg when the export market to China did not expand at the same rate as the number of large commercial producers in Vietnam. Prices remained fair after 2000 but the margins hardly recovered as the cost for the piglets of improved breeds remained high. Prices recovered after the aviary influenza of 2003, but the gross margin stayed low as the prices for rice-bran and commercial feeds increased about 30%.

_______________________________________________ Motives for diversification
31
0.05.0
10.015.020.0
NC-delta IIC-delta CCI-delta NC-hills IIC-hills CCI-hills
million VND <2 3 4 >=5 Figure 2.6. Average yearly cash income from agriculture as a function of the number of
components (NC), the indicator for integration of components (IIC), and the number of components contributing to cash income (CCI). Note: Cases were grouped to obtain at least n=5 in each category.
The total farm area and the CCI explained the variation in CAF significantly.
The NC and CCI determined two clusters of CAF: 15.2 ±1.6 and 10.0 ±1.2 x10⁶ VND.yr-1 (981 US$.yr-1 and 645 US$.yr-1, respectively). In general farms having at least three CCI performed better (Figure 2.6). Especially in the delta, farms with an IIC of 4 and higher earned more cash. In the delta some farmers who specialized generated a high income; however these farmers need more cash for their livelihoods.
The farmers in the delta exploited all possible means to cumulate farm components; e.g. the houses of ducks and chickens were constructed above the fishpond where the manure was recycled; furthermore vegetables were grown in or above the pond. However, raising ducks did not mix well with ditch-dike systems: when the ducks tried to catch the fish in the ditches they destroyed the narrow dikes; they needed a special pond for their exclusive use.
Housing the poultry increased the risk of theft; this risk was very low if the adult chickens stayed in the homestead trees, and the ducks on the water, overnight. Farmers said that they increased the number of components for an optimal use of the small area of land available. They recycled farm residues as much as possible; e.g. the rice straw could be used not only to feed ruminants but also to cultivate mushrooms.
The most frequent integration in the delta was the recycling of human waste: to prevent spreading through flood and tides, the use of latrine ponds to breed catfish was widely practised notwithstanding the legal restrictions of using human waste to fertilize ponds. Manure-fertilized ponds were also more popular in the delta. The proposed use of excreta to feed animals was not accepted by the Hieu Nghia Buddhists who formed part of the population in the uplands. Research is needed to quantify the risk for disease transmission to secure this source of income and sustainable waste management [26].

Chapter 2 _____________________________________________________________
32
2.4. Discussion and conclusions We did not include in the foregoing analysis the contribution to home-consumption of the various farm components, nor did we ask the farmers how much cash they needed for family nutrition. A baseline study of 80 farm households in the three delta villages showed that home-consumption plus other non-cash contribution to income was on average 16% only [120]. As a family farm having less components would need more cash for family nutrition, our conclusion on the positive relationship between the number of components and the net cash income from agriculture would even be reinforced. Some farmers claimed that IAAS used resources more efficiently than mono-cultures, but very often the additional components were not integrated effectively through the exchange of wastes but were a mere accumulation of components. In the delta, a high index for integration was positively correlated to the level of well-being and the income from agriculture, but was limited by the size of the homestead and the distance to the fields in the hills. The total number of components and the components providing cash determined two clusters of gross income from agriculture in which income from livestock, including fish, composed close to 2/3 and 1/3 in the delta and hills, respectively.
The infrastructures for water management and the services related to land use policy, affected the chronology of the innovations according to the districts. The improved rice food security changed the farmers’ reference frame and pushed farmers to take risks and to engage in activities in which they had less know-how. In the delta area farmers intensified the fish production in the available ponds and transformed rice-fields in ditch-dike systems for fish and fruit. The technological innovations of rice, fruit and fish were essential for the development of integrated systems in the MD, partly contradicting Netting [105] who stated that scientific and technological innovations were not the crucial causal factors in the development of intensive agriculture.
Data showed that the distribution of cattle by credit or sharing arrangements was not an effective instrument for the resource-poor to build a sustainable livestock component. The short reproduction cycle, the large litter size, and the low individual value makes sharing or “passing on the gift” of pigs or goats a more appropriate strategy for poverty alleviation.
Stirrat [150] criticized the reductionistic use of social capital within the livelihood approach, but we used this factor to analyze the social resources affecting change and diversification. In a comparable framework of analysis such as the agri-family system [12], these fall within the categories of ‘broker agents’, ‘instrumental network’, and ‘access to sources of support’.

_______________________________________________ Motives for diversification
33
The livelihood framework helped us to identify the importance of the household life-course in the decision-making. Clearly, decision-making was not a one-time event but a process [12], and mostly embedded in a pathway [23] that was obstructed by political structures, natural disasters and diseases, especially for the resource-poor, but at the same time also offered oases of opportunities.
After ‘Doi Moi’, the large variety in farm compositions resulted from the valuation of the available resources/capitals through the agency of the individual actors [93]. Though the political context in the Mekong Delta was particular, the fact that the Khmer in the hills zone did not grasp the same opportunities as the Kinh in that area shows also that the social context affects the actors’ motives.
As concluded by Ellis [51], diversification is a heterogeneous social and economic process, following a wide range of pressures and possibilities. The most mentioned motive for the on-farm innovations was the desire to improve family well-being. As borne by the findings, the household life-course determined the labour and subsequently the capital availability to engage in more market-oriented activities. Farmers’ choice of a new component to add to their livelihood activities was motivated by know-how and market opportunities; educated farmers were more innovative, as found by [39]. After the reforms starting in 1986, on-farm diversification was triggered by the low market price of rice, the improved possibilities of product marketing and off-farm labour [120], and the freedom of farmers to develop activities of their own choice. The marketing system of middlemen enabled the integration of small farmers to participate in the global market of fruits and fishes.
In nuclear families, the phases of creation, expansion, accumulation, and consolidation confer to the household life-course (Chayanov, as cited by [118]), as well as to the livelihood strategies [111, 174]. The phenomenon of young couples living with the husbands’ family may be explained differently by anthropologists; in our study we distinguish this as a phase of preparation towards establishing an independent household since the cohabitation only starts after marriage to allow the young couple to save money. Off-farm diversification was important for all households from preparation until expansion, but for the resource-poor, it was a necessity at all times. In the expansion phase the farmers increased the farm turnover by keeping more livestock, and in a later phase they accumulated their savings either in land, houses or the education of their children. The MD farmers diversified on-farm activities to increase food production and maximize the cash income from their limited area. This on-farm diversification and the effective integration of components affected income positively, but needed know-how, and a minimum area of land in, or close to, the homestead.

35
CHAPTER 3
ASSESSING AND MODELLING
FARMERS’ DECISION-MAKING ON
INTEGRATING AQUACULTURE INTO AGRICULTURE
IN THE MEKONG DELTA
Published as: Roel H. Bosma, Le Thanh Phong, Uzay Kaymak, Jan van den Berg, Henk
M.J. Udo, Martinus E.F. van Mensvoort and Le Quang Tri, 2006 Assessing and modelling farmers’ decision-making on integrating
aquaculture into agriculture in the Mekong Delta. Netherlands Journal of Agricultural Science, Vol.53, 3&4, 281-300.
Chapter 3 ______________________________ Integrating aquaculture into agriculture
36
Abstract
Contrary to the global trend of specialisation within agriculture, the rice-based Vietnamese production systems have diversified into integrated agriculture–aquaculture systems. Economic liberalization in 1986 resulted in an explosive increase in rice production and a rapid diversification. This paper describes the history and dynamics of these systems in the Mekong Delta, and the farmers’ decision-making in this process. Subsequently, we use fuzzy logic to simulate farmers’ decisions to opt for no aquaculture or one of four fish-production systems: waste-fed, pellet-fed, rice–fish, and ditch–dike, i.e., fish–fruit. In a reaction to changing market opportunities the farmers developed these systems either from the depressions left after building a homestead or after raising dikes to improve irrigation and drainage for rice and fruit trees.
The decision-making was simulated in a two-level hierarchy decision-tree. The first layer handles the farmer’s production preferences for rice, fruit or fish, with composed variables for land, water, labour, capital and market. The second layer simulates the choice between five options: no fish, and the four alternative fish-production systems. The model allowed a farmer to practise different aquaculture systems at the same time. The fuzzy model simulation predicted the frequency distribution of fish production systems fairly accurately, but performed poorly when classifying individual farmers. To improve the accuracy of the simulation, additional rules can be specified and more factors considered for each product by adding a third layer to the decision-tree and replacing the composed variables with fuzzy rules.
Keywords:
Fish, fuzzy logic, motives, change, diversification.

Chapter 3 _______________________________________________________
37
3. Assessing and modelling farmers’ decision-making on integrating aquaculture into agriculture in the Mekong Delta
3.1. Introduction Farming systems integrating agriculture with aquaculture (IAAS) are expected to make farmers’ livelihoods more sustainable. With such systems the components in the farm’s nutrient cycle are used more efficiently [75, 128]. Nutrient losses are reduced, as manure and other farm waste are used to fertilize the fish pond; the pond sediments are subsequently used to fertilize the crops of which the residues can in turn be used as fodder for the livestock. Globally, agricultural research and development focus primarily on high-input technologies requiring high capital investment; e.g. most new crop varieties and animal breeds only perform well under high-input conditions. However, the financial capital available to small-scale farmers is often insufficient to enable them to adopt such technologies. And if the farm components are not in equilibrium, even if farmers do adopt the technology, there may be significant nutrient losses, thus reducing ecological and financial sustainability [128]. To enlarge the potential of IAAS’s contribution to sustainable livelihoods the INREF5 Programme for Optimisation of Nutrient Dynamics and Animals for Integrated Farming (POND) studied: (1) breeding of fish that perform well in low-cost production environments, and (2) optimizing the nutrient recycling at farm level. The results of the first POND experiments on the interaction between genotype and environment suggest that the context in which the fish are raised does indeed dictate their growth performance [37]. Moreover, the growth rates of fish in the low-cost environment (ponds fertilized with poultry manure) nearly matched those of fish fed with high-cost pellets [104].
The two innovations mentioned above can increase IAAS’s potential contribution to sustainable farmer livelihoods. Whether this potential is achieved depends on what options are available for farmers and what decisions individual farmers make. In order to analyse farmers’ decisions about changing and adopting technologies it may be necessary not only to assess the resource utilization context [71], but also to run model simulations, as done e.g. by Batz et al. [9] and Cashwell et al. [32]. If used individually neither method can entirely elucidate and quantify the process. Most current modelling methods are unsatisfactory because they assume that farmers’ decisions are based solely upon utility [144]. These models do not
5 Interdisciplinary Research and Education Fund of Wageningen University.

Chapter 3 _______________________________________________________
38
match the new constructivist sociological approach towards rural development, which places the individual farmer at the centre of agricultural innovations [93]. To go beyond utility and to respect other farmers’ motives we propose an alternative approach based on fuzzy logic modelling that can deal with subjective farmer statements, through ‘if–then’ statements. Fuzzy models can also cope with non-probabilistic forms of uncertainty and incorporate expert (i.e., farmer’s) knowledge (Zadeh, 1965, cited in [76]). Moreover, they can generate a range of solutions [147] similar to the process by which farmers shape one technology into various techniques [71]. In this paper we describe how we tested the applicability of the approach using fuzzy systems for simulating farmers’ decision-making.
The Mekong Delta (MD) in Vietnam is a good example of a region where many farmers have diversified their production systems into IAASs. Within the past 30 years, many farming systems in Vietnam have emerged from the state-controlled monoculture of rice for the market and other complementary produce destined for subsistence use. A range of new rice-based integrated systems has evolved, with many variations in terms of crop/fish/livestock integration and market orientation [128, 142]. Because increased diversification in Vietnam has happened relatively recently, we collected the data to build a decision-making model by asking farmers to recount the evolution of their practises. In this paper we attempt to elucidate farmers’ motives for diversifying into IAAS by (1) describing the history and changes of the IAAS in the MD, (2) establishing which factors account for farmers’ decisions to integrate aquaculture with agriculture in the delta and surrounding hills, and (3) applying fuzzy logic modelling to simulate farmer decision-making about fish production systems.
3.2. Methodology
3.2.1. Choosing the case study sites The MD can be divided into seven agro-ecological zones (Figure 3.1). In order to assess the factors influencing the increased integration of farming components, we identified the zones where IAASs were appropriate. Livestock–fish–crop systems are found mostly in the freshwater alluvial zone (delta) and to a lesser extent in the hills and uplands zones (hills), where rain-fed agriculture predominates over irrigated cropping. In the other zones, crop and/or livestock farming is governed mainly by periodic flooding.
The predominant ethnic group in the delta lowlands is the Kinh, who practise Buddhism. In this area, the official land-use policy promotes the integration of fruit, fish, pigs and poultry into farming systems dominated by rice. The uplands

_________________________________ Integrating aquaculture into agriculture
39
are inhabited by the Kinh and a Khmer group of Cambodian origin. Some of the upland people practise a particular form of Buddhism prohibiting them from feeding faeces to farm animals and fish. The official land-use policy for the upland region focuses on the production of fruit, timber and cattle and this has led to the neglect of aquaculture’s potential. Recently, however, in response to the increasing number of farmers starting fish production, the ‘People’s Committee’ has started support programmes on aquaculture.
Figure 3.1. The agro-ecological zones of Vietnam’s Mekong Delta; adapted from [142].
3.2.2. Data collection and processing In 2004, farmers’ motives for implementing IAASs were assessed through semi-open interviews in the delta (February) and uplands (March). The reason for including the uplands was to capture the differences between the two farming
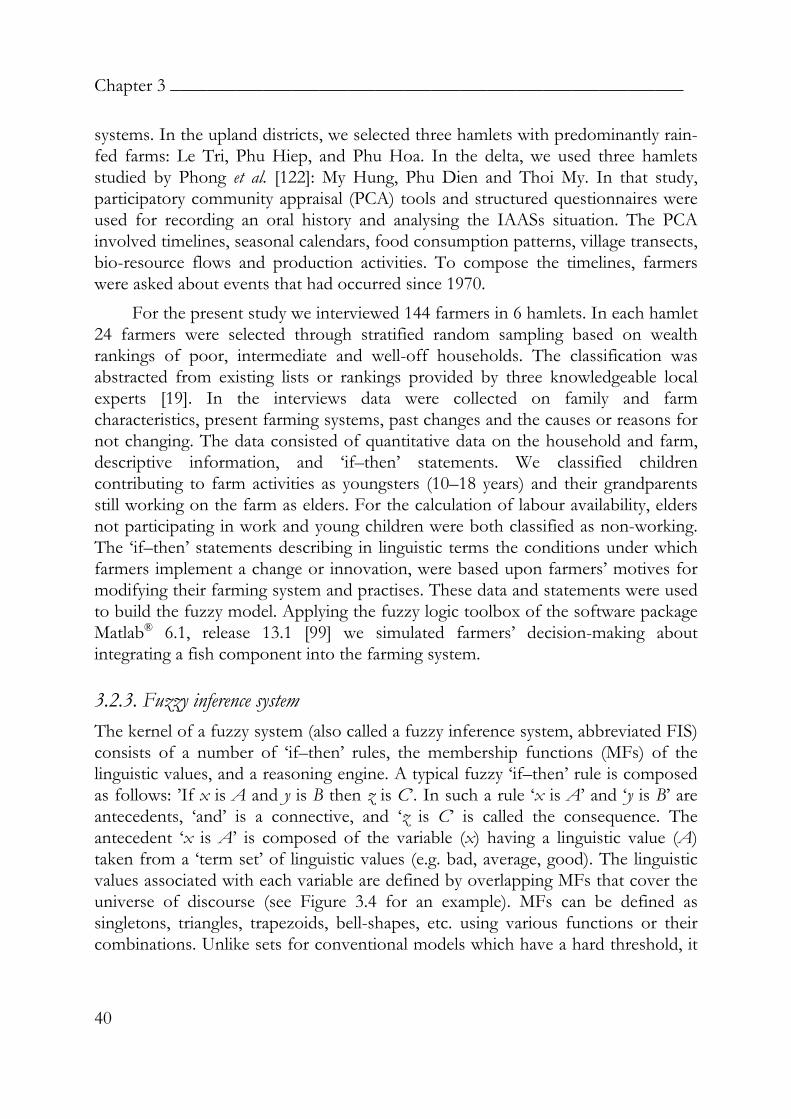
Chapter 3 _______________________________________________________
40
systems. In the upland districts, we selected three hamlets with predominantly rain-fed farms: Le Tri, Phu Hiep, and Phu Hoa. In the delta, we used three hamlets studied by Phong et al. [122]: My Hung, Phu Dien and Thoi My. In that study, participatory community appraisal (PCA) tools and structured questionnaires were used for recording an oral history and analysing the IAASs situation. The PCA involved timelines, seasonal calendars, food consumption patterns, village transects, bio-resource flows and production activities. To compose the timelines, farmers were asked about events that had occurred since 1970.
For the present study we interviewed 144 farmers in 6 hamlets. In each hamlet 24 farmers were selected through stratified random sampling based on wealth rankings of poor, intermediate and well-off households. The classification was abstracted from existing lists or rankings provided by three knowledgeable local experts [19]. In the interviews data were collected on family and farm characteristics, present farming systems, past changes and the causes or reasons for not changing. The data consisted of quantitative data on the household and farm, descriptive information, and ‘if–then’ statements. We classified children contributing to farm activities as youngsters (10–18 years) and their grandparents still working on the farm as elders. For the calculation of labour availability, elders not participating in work and young children were both classified as non-working. The ‘if–then’ statements describing in linguistic terms the conditions under which farmers implement a change or innovation, were based upon farmers’ motives for modifying their farming system and practises. These data and statements were used to build the fuzzy model. Applying the fuzzy logic toolbox of the software package Matlab® 6.1, release 13.1 [99] we simulated farmers’ decision-making about integrating a fish component into the farming system.
3.2.3. Fuzzy inference system The kernel of a fuzzy system (also called a fuzzy inference system, abbreviated FIS) consists of a number of ‘if–then’ rules, the membership functions (MFs) of the linguistic values, and a reasoning engine. A typical fuzzy ‘if–then’ rule is composed as follows: ’If x is A and y is B then z is C’. In such a rule ‘x is A’ and ‘y is B’ are antecedents, ‘and’ is a connective, and ‘z is C’ is called the consequence. The antecedent ‘x is A’ is composed of the variable (x) having a linguistic value (A) taken from a ‘term set’ of linguistic values (e.g. bad, average, good). The linguistic values associated with each variable are defined by overlapping MFs that cover the universe of discourse (see Figure 3.4 for an example). MFs can be defined as singletons, triangles, trapezoids, bell-shapes, etc. using various functions or their combinations. Unlike sets for conventional models which have a hard threshold, it

_________________________________ Integrating aquaculture into agriculture
41
can be seen from the MFs in Figure 3.4 that fuzzy sets can take account of gradual changes and have fuzzy boundaries.
Figure 3.2. The fuzzy inference of two rules (see text section Fuzzy Inference System for
explanations).
The reasoning engine of the FIS proceeds in 5 steps (Figure 3.2, in which the numbers in the black circles refer to the steps below): 1. The fuzzifier, or the fuzzification module, determines the membership degree of
the data (x and y) input to the MFs. 2. The degree of fulfilment (μ) of each rule is computed from the degree of
membership using fuzzy logic operators; we used the minimum operator. 3. The combined degree of fulfilment is calculated using a t-norm (β) which, if the
minimum operator is used (this is the commonest approach), recapitulates in truncating the smallest section of the graph.
4. The degree to which the rules are fulfilled are aggregated, using the maximum operator.
5. The defuzzification module (or defuzzifier) calculates a ‘central of gravity’ or ‘centroid of area’ to change the fuzzy solution into a crisp decision.

Chapter 3 _______________________________________________________
42
Figure 3.4. Simulation framework for farmer’s decision-making. On the left: the inputs for the first layer of three Fuzzy Inference Systems (FIS). In the centre: their respective outputs, i.e., the inputs for the second-layer FIS. On the right: the output from the second-layer FIS.
3.2.4. Constructing the fuzzy model The FIS of the simulation model was built in six steps (adapted after [76]): 1. The decision-making process was represented in a two-level decision-tree (Figure
3.4) in which the first layer consisted of three FISs for estimating the degree to which a given farmer tends to produce rice, fruit or fish. The outputs of this layer, together with another variable termed the ‘farmer’s reference frame’ (see below), were fed into the fourth FIS, which formed the second layer.
2. When defining the input variables, we used the criteria the farmers considered to be central to the decisions they made (see section 3.3.1. Dynamics of IAASs).
3. Data from the structured part of the semi-open interviews generated inputs for the fuzzification, i.e. encoding of crisp in fuzzy values, and supported the formulation of the linguistic value sets and the associated MFs for each variable.
4. The farmer’s motives and statements collected during the interviews guided the composition of the fuzzy ‘if–then’ rules. We began by composing an extensive rule base for each FIS, including all possible combinations of the variables and linguistic values (e.g. 5 variables, each with 3 values, yielding 53 = 125 rules). Taking ‘don’t care’ rules into account reduced the rule explosion. An example of a ’don’t care’ rule is ‘If Water is bad then No fish’. So if the value of the variable Water is bad the values of the other variables do not affect the decision, and therefore it is permissible to reduce the rule base.
Inputs Layer 1 FIS Layer 2 FIS
Fishfarmingsystem
Fish
Fish market
Fruit
Rice
Land
Fruit market
Rice market
Farmer's reference frame
Labour
Capital
Water

_________________________________ Integrating aquaculture into agriculture
43
5. The second layer rule base of the decision tree contained multiple rules with the same antecedent and different consequences, which implies that farmers could adopt different fish production systems simultaneously. The consequences were represented as a discrete set of possible non-overlapping alternatives, to account for the multiple outcomes, i.e one farmer practising several systems. The fuzzy output of the second layer could have a value between 0 and 1; a farmer was assumed to adopt a particular production system if the membership for that output was larger than 0.5 [18].
6. The model was fine-tuned and calibrated by comparing the preliminary outputs with the real situation, and by manually adjusting the rules and the MF parameters to obtain optimal fit between the observed systems and the model estimates.
Initially, the parameters for the MFs of the linguistic values for the input variables were set at quartile values calculated from the dataset, e.g. 1st quartile = low; 2nd and 3rd quartiles = acceptable, and 4th quartile = good. For the fine-tuning, the magnitude of the five output variables was compared with the individual cases with the fish production system as practised on-farm. After identifying inconsistencies, the fine-tuning was done by shifting the thresholds of bad, acceptable and good for the MFs of the first-layer FIS input variables for the products (Figure 3.4). This change resulted in a larger or smaller centre value in the output, thereby increasing or reducing the probability of a specific system being implemented.
Figure 3.4. The adjusted MFs of the input variable water for the FIS of rice, fish and fruit. The vertical axis represents the degree of membership, and the horizontal axis represents water availability.
We report the details of the MFs for the input variables in the second part of
the Results section, after presenting the dynamics of the IAASs. The model was

Chapter 3 _______________________________________________________
44
validated through a comparative simulation of the fish production systems practised in the MD uplands and delta. We then analysed the resulting set of rules.
3.3. Results
3.3.1. Dynamics of IAASs in the Mekong delta
Historical background Human recent settlement in the Mekong Delta was favoured by the construction of a network of waterways from 1840 onwards. Later, the French colonial administration improved road access into the delta and people constructed linear settlements on the raised borders of the waterways [142]. Rural life on and around the waterways is still dominated by the diurnal tides from the South China Sea [19]. The annual monsoon flood lasts between 2 and 6 months and may inundate the land by up to 3 m, depending on the particular year and location [164].
The livelihood of the people living in the delta centred on fishing and irrigated, rainfed and/or floating rice crops. In the second half of the 20th century the economic development and livelihood patterns of the local people were strongly affected by wars and a centralized economic system. Between 1945 and 1976 the rural population followed a survival strategy, but the construction and dredging of waterways continued, laying the foundations for new development.
Changes since 1976 In all three delta districts studied the timeline showed the same major events (Figure 3.5). However, chronological differences in the key events caused technologies to have different impacts in districts and their hamlets (Phong et al., 2004). In some areas, major state investments in dikes and dams preceded the application of double or triple rice-cropping.
Household production activities were strongly affected by the introduction of new technologies, the construction of canals and dikes, the ‘Doi Moi’ market reforms, and wide commodity price fluctuations. From 1976 to 1992, farm households were stimulated to achieve self-sufficiency within co-operative units comprising 10 to 12 family farms. The marketing of most products was either restricted to the local area (e.g. perishables, such as vegetables) or regulated by the state (e.g. pork, rice and clothing). The ‘Doi Moi’ was a legal reform of the centrally planned economy, liberating trade, industry and services. It laid the foundations for land reform in which collective agriculture was abandoned.

_________________________________ Integrating aquaculture into agriculture
45
Figu
re 3
.5. T
rend
s in
agric
ultu
re d
urin
g th
e pe
riod
1972
–200
2 fo
r Cai
Bè, T
am B
inh
and
O-M
on d
istric
ts
in
the
Mek
ong
Delt
a, V
ietna
m.

Chapter 3 _______________________________________________________
46
After 1992, land tenure was individualized and the land was designated either for agriculture by awarding a ‘red certificate’ or for forestry by a ‘green certificate’. These certificates not only conferred on the user the right to use the land as collateral, but also aimed to bring land use within a regulatory framework governed by land use policies. Farmers with a green certificate for forest plots had the obligation to bring their land use practises in line with regulations. Gradually, as the land market liberalized, land prices rose and access to land became dependent on the market.
16 16
6
16
15 5
28
26
0
10
20
30
Homestead Consumption Waterstorage
Resource Income
% DeltaUpland
Figure 3.6. Frequency distribution of the first two reasons farmers in the delta and upland
areas of Vietnam’s Mekong Delta gave for installing a fish pond.
Farmers’ reference frame Rice is the main staple crop in Vietnam and in the Mekong Delta in particular. Surplus production is sold to pay for farm inputs and support household needs. In chapter 2 [19] we report how the adoption of water management practises, rice varieties, and rice technologies that allowed two – and later three – crops per year, improved the household’s food security, affected the market price of rice, and made land available for other uses. The improved food security achieved through rice production plus the low but stable prices and liberalized market for rice influenced the farmers’ decision-making. Some farmers became less fixated on growing rice to ensure household food security. The motives for making changes to the farming system were also related to the farm household labour cycle and availability of labour. The desire to improve income and/or the availability of food for the household, especially to ensure the well-being of the children, was important. Older couples with no children to take over the farm tended to produce labour-saving fruit and fish instead of rice. Most farmers were aware of the potential benefits of IAAS: risk spreading, a more even distribution of cash-generating opportunities, and more efficient resource use (Figure 3.6).

_________________________________ Integrating aquaculture into agriculture
47
A low level of know-how sometimes hampered the inclusion of a new component in the farm, as shown in the fish-raising example (Figure 3.7). In our survey, the only way we scored farmers’ knowledge was by recording the formal education they had completed. However, we found that the farmers’ propensity to try new technologies did not correlate solely with education level [110]. In the villages, most of the transfer of know-how on feeding fish and on new fish species for aquaculture was through the extension services and television. Poorer farmers’ access to media was limited, but those who travelled – sometimes for government (military) service – picked up ideas, could visit friends and acquire specific knowledge. Farmers rarely said that ‘lack of knowledge’ was one of the top two major constraints to the adoption of a fish-farming system.
Farm characteristics The village transects in the delta mostly showed homesteads with a pigsty and poultry pen, surrounded by fish ponds, orchards, a vegetable garden and a rice field [122]. The average farm area was 1.0 ha in the delta (SD 1.8) and 2.1 ha in the uplands (SD 2.3). Most of the rice fields were at some distance from the homestead. The rice field was a source of food and cash for the family and of crop residues that could be used as livestock fodder. Other feed sources for pigs, poultry and fish came from the garden: weeds, and vegetable and fruit waste. After the fish had been harvested, the enriched sediment was removed from the pond bottom and applied as topdressing around the trees in the orchard. In addition, the fish pond could supply water to irrigate the fruit trees and feed for pigs and poultry, such as water spinach, snails, or crabs. Most wastes and excreta were recycled on-farm [122]. Farmers optimized the use of their resources by using the pig manure to fertilize the fish pond. In the uplands the homesteads tended to be further away from the fields, paddies, forests and orchards, making it more difficult to integrate the farm components effectively [19].
2 0 0 3 0 215
9 8 6 3
58
0
15
30
45
60
Capital Water Soil quality Land area Distance Know-how
%Delta Upland
Figure 3.7. First and second constraints to integrating a fish pond in farming systems of
Vietnam’s Mekong Delta, as mentioned by farmers; ‘Distance’ refers to the distance between the probable location of the fish pond and the homestead.

Chapter 3 _______________________________________________________
48
In the delta, aquaculture started off with existing ponds, canals and ditches and the self-recruited natural fish left after floods had receded. These fish were abundant until about a decade ago and were mostly raised without any inputs, but now almost all farmers have enhanced production by stocking with cultured fish and giving supplementary feeding. In the delta, 97% of the farmers interviewed raised fish, compared with only 25% in the uplands. The pond or ditch area varied from 6 m2 to 3000 m2 with an average of nearly 350 m2. In the delta, at least 30% of the farms had more than one pond. The sample did not include farmers raising fish in netted enclosures or on boats in canals. In the delta about 40% of the farms were raising fish in ponds originally not meant for that purpose; in the uplands this figure was 25%. In the uplands some ponds were used mainly to store water for livestock and orchards. In the lowlands of the delta the ponds were the depressions left after soil was removed to raise the ground level for a house or for farming. In swampy areas it was traditional to build homesteads on raised mounds, not only to avoid flooding but also because of the scarcity of wood needed for houses with a raised floor. Fruit trees also need to be grown on raised land, to avoid waterlogging.
Development of IAAS When rice cropping was no longer remunerative, the farmers turned to substitution and/or complementary activities, i.e., fish farming, fruit orchards, vegetable growing and livestock rearing. They increased the number of farm components to optimize the use of their limited resources and diversify production for the market. Phong et al. [122] recorded 16 different rice-based systems in combination with horticulture, upland crops, livestock, fish pond, or biogas. Almost 60% of the farms in the delta comprised the four main components: garden, livestock, fish and rice; over 90% comprised at least two (Figure 3.8). Some of the rice fields were converted directly into fish ponds; sometimes farmers gradually built a network of dikes and ditches, using the dikes for upland crops or trees and the ditches for raising fish [90, 128, 142]. Figure 3.8. Frequency distribution of farms according to the number of components in the farming system, in 3 districts of the fresh water alluvial zone in Vietnam’s Mekong Delta in 2002. Based on data from [121].
7%13%
20%
27%
33%1 2
3 4
5

_________________________________ Integrating aquaculture into agriculture
49
In the delta, over half of the farmers who started to raise fish concurrently developed land for fruit orchards; one third of them did so using ditch–dike or ‘raised bed’ systems. In some cases the transition was related to neighbours’ land-use practises, not only because of the diffusion pattern of the innovation, but also because of the changes in water management resulting from local decisions to abandon paddy rice. In the uplands, the major reason for not having a fish pond was related to the unavailability of water during the dry season and/or inappropriate conditions: sandy or shallow soils (Figure 2.7). Other main reasons for not having a fish pond were insufficient assets, e.g. capital, and insufficient access to the land (the risk of theft and bird predation increased with the distance between homestead and fish pond).
The vast majority of fish ponds recycled farm waste: household and market waste, rice bran and excreta from humans, pigs, chickens and ducks. In the delta, 77% of the fish ponds recycled residues, compared with 65% in the uplands (Figure 3.9). Four major types of fish-feeding systems were distinguished: (1) extensive low-input systems, (2) farm-waste feeding systems, (3) systems supplemented by external inputs of feed (e.g. pellets or market waste), and (4) rice–fish systems. Feed regimes were not mutually exclusive: for example, fish waste could be used in conjunction with pellets. Latrine ponds and manure-fertilized ponds were more popular in the delta, not only because of the water level in the delta but also because of a religious taboo in the uplands [19]. In all three districts, fish farming could be based on high, moderate or low input levels, depending on market demand and level of technology. The practise was related to land use differences but distance to market was also important: 6.6 km for O Mon, 13.8 km for Tam Binh and 15.6 km for Cai Beh [122]. For the model we retained 4 main fish-production systems: (1) ponds with waste-fed fish, (2) ponds with (partially) pellet-fed fish, (3) fish raised in the ditches of fruit-oriented IAAS (ditch–dike), and (4) rice–fish systems.
11
25
611
51 1 27 10
0
46
01020304050
Low input Latrine Manure Pellets Rice bran Rice–fish
NumbersDelta Upland
Figure 3.9. Main feed resources of fish production systems in the alluvial fresh water delta
and the uplands of the Vietnamese Mekong Delta [17].

Chapter 3 _______________________________________________________
50
3.3.2. Fuzzy logic modelling The first step in the fuzzy logic modelling of farmers’ decision-making was to build a fuzzy simulation model based on a set of input variables that reflected farmers’ reasoning and output variables representing the causality of farmers’ decisions. This preliminary model was limited to simulating the frequency distribution of fish production systems in the delta and the uplands of the MD. Five alternative modelled outputs were considered: no fish, and the four fish-production systems mentioned above.
The input variables The potential constraints to the expansion of aquaculture mentioned by the farmers were know-how, water, capital, labour and three land-related factors (Figure 3.7). In the model, these constraints were each represented by one parameter calculated from several variables. Next to these constraints the model considered the effect of market prices and of the farmers’ willingness to change.
The farmers’ reference frame [114] was used as a proxy for the farmers’ willingness to change and for the know-how of farmers. This reference frame was based on four variables that we assumed determined farmers’ decisions: (1) the psychological attachment to the rice field, (2) educational level, (3) number of children, and (4) age. The psychological attachment to rice as a key to food security was represented by a value of –1 if the farmers had increased rice production for domestic consumption or expressed an interest in doing so, and by +1 if they had not. Education was rated from 0 to 5, where 0 represented no schooling and 5 a college education. The two variables most determining changes in the IAAS during the four stages of the household life-cycle were the number of children and age. The number of children was counted as real numbers and age implemented as: (10/age).
The availability of water for a pond depends on proximity to a waterway or source of surface water or groundwater, the soil water retention quality, and water level management options. These factors were also reflected in farmers’ land use, as improved water management possibilities enhanced multi-cropping and high-value fruit orchards [19]. The index for water was therefore derived from a land quality index (LQI). The land suitability was classified into a LQI of nine classes, with land suitable for the most intensive production being assigned to class 1 and the extremely acid sulphate soils being assigned to class 9 (Acid sulphate soils also make fish production difficult if drainage possibilities are limited.) Homesteads consisting solely of an area with a house and farm buildings were classified as 10. In practise it meant that the linguistic values for Water were: good if water was easily available all year after pond excavation, acceptable if water was available most of the year, and poor if access to water was difficult even in the wet season.

_________________________________ Integrating aquaculture into agriculture
51
The availability of land for a fish pond was related to the homestead area and upland fields where LQI < 6, and to the number of lowland irrigated rice crops per year near the homestead. Irrigated land was taken into account only if the distance to the homestead was less than 400 m and if LQI < 3.
Regarding labour, farmers most frequently mentioned the availability of family labour in a specific age category as the factor that determined production changes or innovations [19]. The index for labour was derived from the weighted number of family members in the age categories: adult –0.25 × non-working + 0.5 × youngster + 0.75 × elder. In the model the availability of capital was assumed to depend on the capacity to save and on the access to credit. The capacity to accumulate savings depends partly on income, which was related to the total area of land (rho = 0.43; see [19]). Access to bank credit depends on the area of land with a red or green certificate, and on family-owned equipment or on other assets. Combining both these considerations, the index for capital availability was derived from the area of land with red and green certificates, with the area with a green certificate counting for half. It should be noted that this ignored the frequent accessing of credit from relatives – for which no collateral was required – and from traders for inputs like fertilizer and feed.
The farm-gate prices of fish, fruit and rice were expressed as price indices with values ranging from 0 to 1. A value of 0.1 was assigned when a low relative price was an argument for changing the farming system, 0.9 when a high price level was an argument for changing practises and 0.5 when the price was stable during the period of the change. When the product price was not important enough to induce changes in the farming system, a neutral value in the fuzzy inference system was used.
Figure 3.10. Actual en simulated numbers of farmers with fish production systems. Sample size: 144 of whom 57 produced no fish and the rest had 115 ponds.
0
25
50
75
No fish Waste-fed Ditch–dike Rice–fish Pellet-fed
Numbers Sample VMD SimuVMD
Sample delta SimuDelta
Sample upland SimuUpland

Chapter 3 _______________________________________________________
52
Performance and analysis of the fuzzy model The preliminary fuzzy model for farmers’ decision-making predicted the
number of farmers raising fish reasonably accurately, but the simulation of the frequency distribution of fish production systems in the MD was less satisfactory (Figure 3.10). The fuzzy simulation predicted that 62 of the 144 farmers would not raise fish. The actual number was 57, an accuracy of 91% for predicting whether a farmer does or does not raise fish. In calculating the error, 4% were missed positives, i.e., farmers who had implemented the system but were not as such identified, and 5% were the missed negatives, i.e., farmers who were not implementers but could have been according to the rules of the model. Table 3.1. Cross-tabulation rates in percentages for individual cases of observed and
estimated fish production systems. Observed cases Estimated cases Total No fish Other No fish 37 3 40 Other 7 53 60
Total 44 56 100 Waste-fed Other Waste-fed 32 16 48 Other 10 42 52
Total 42 58 100 Ditch–dike Other Ditch–dike 6 10 16 Other 12 72 84
Total 18 82 100 Rice–fish Other Rice–fish 0 4 4 Other 5 91 96
Total 5 95 100 Intensive Other Intensive 1 10 11 Other 15 74 89
Total 16 84 100 The prediction of the choice for a specific fish production system was less
accurate. The simulation underestimated the number of waste-fed ponds in the delta by about 15% and overestimated their number in the uplands by about 40%. The number of ponds in ditch–dike systems was overestimated in general by about 50%, mostly due to a large overestimation for uplands. The frequency of pellet-fed

_________________________________ Integrating aquaculture into agriculture
53
ponds was generally overestimated by 40%; the underestimation for the upland was smaller than the overestimation for the delta.
The model’s success rate in classifying individual farmers according to their fish production system was below 50% (Table 3.1). The model specifically failed to predict the few individual farmers who adopted rice–fish or intensive pellet-fed fish production systems. This indicates that the rules predicting these systems should be evaluated further in order to improve the model’s performance.
The numbers of rules in the FISs for estimating the production levels of fish, fruit and rice were 27, 21 and 34, respectively, and the rule base for the fish production system contained 384 rules (see e.g. the rule base for fish in Table 3.2). An analysis of the rules that were most decisive for the classification revealed that for raising fish or planting fruit trees, low capital availability was a constraint and an acceptable market price a condition. However, these factors did not prove important for decisions to grow rice [19]. Poor availability of water was a constraint to starting fish or fruit activities, but poor access to land did not restrict fish farming, though it did limit the growing of rice or fruit trees. Table 3.2. The list of the applied rules for the Fuzzy Inference Systems in the first layer of
the decision model determining the likelihood of fish farming (FF). 'if W is bad, then FF is bad'; 'if W is fine and L is fine and C is low, then FF is bad'; 'if W is fine and L is fine and C is fine and M is fine and P is fine, then FF is fine'; 'if W is fine and L is fine and C is fine and M is fine and P is good, then FF is good'; 'if W is fine and L is fine and C is fine and M is good and P is fine, then FF is fine'; 'if W is fine and L is fine and C is fine and M is good and P is good, then FF is good'; 'if W is fine and L is fine and C is good and M is fine and P is fine, then FF is fine'; 'if W is fine and L is fine and C is good and M is fine and P is good, then FF is good'; 'if W is fine and L is fine and C is good and M is good and P is fine, then FF is fine'; 'if W is fine and L is fine and C is good and M is good and P is good, then FF is good'; 'if W is fine and L is bad and C is good, then FF is fine'; 'if W is good and L is bad, then FF is good'; 'if W is good and L is fine and C is fine, then FF is good'; 'if W is good and L is fine and C is good, then FF is good'; 'if W is good and L is good, then FF is good'; Key: W=water; L=land; C=capital; M=labour; P=fish market. fine = acceptable
In order to elicit the farmers’ reasons for integrating complementary production components into their farming system and further develop IAAS, the model needs to be extended. We think of at least four adjustments:

Chapter 3 _______________________________________________________
54
The number of waste-fed ponds in the uplands was overestimated because the religious taboo on using manure as feed was not considered. Besides, both the underestimation of waste-fed ponds in the delta and the overestimation of pellet-fed ponds might be explained by farmer preference for pig-fattening concentrates and subsequent use of the manure to fertilize the ponds. These aspects can probably be accounted for by inserting the variable Farmers’ reference frame in the FIS for each product separately.
The use of a three-level scale for subsistence rice production preferences hardly affected the variable for the farmers’ reference frame. It would be better to rate farmers’ preferences on a scale of 1–5: very high, high, medium, low, and very low. The price index for changes in the fish production system apparently performed well. However, it strongly directed the simulation results and did not capture commodity market price fluctuations. To address this, the model simulations could be repeated with different price levels.
The fuzzy model overestimated the likelihood of ditch–dike systems in the uplands, possibly because of the favourable conditions therefore fruit production. In fact, most farmers raising fish in the uplands have insufficient water to create ditch–dike systems and do not need drainage canals or dikes to avoid waterlogging of the land on which fruit trees are grown. The fruit trees varied between the uplands and the delta: mango trees predominated in the uplands, but longan (Euphoria longan) and citrus were common in the delta [121]. To address this discrepancy, different factor demands related to the type of product should be included in the model.
3.4. Discussion and conclusions In Vietnam, small scale IAAS seem a logical starting point for the development of a socially, ecologically and financially sustainable agriculture on family farms lacking resources or with few opportunities outside agriculture. In view of the abundant rice production, with low and stable prices, and guaranteed family food security, rural households engaged in other farm activities to earn cash. Most farmers in the MD produce fish to improve their livelihoods and to diversify their sources of food and cash income. In the delta, where ponds were often available for other reasons and ditches became available when farmers started growing fruit trees, fish make efficient use of resources and waste from other land-use components of the family farm. This is reflected in the high frequency of waste-fed systems. Those promoting aquaculture improvements in Vietnam through the widespread adoption of innovations need to appreciate the role of fish in recycling waste [25]. The overestimation of the frequency for the ditch–dike and waste-fed systems in the hills might also indicate that aquaculture has the potential for further expansion.

_________________________________ Integrating aquaculture into agriculture
55
While farmers in the uplands of North Vietnam cope with temporal water shortages by producing fish in short seasonal rain-fed cycles [21], many of the upland farmers in our sample still believe that aquaculture is only feasible in the delta, where water is available all year round.
Fuzzy logic modelling enabled us to satisfactorily simulate the decision whether a farmer does raise fish or not. However, for some systems the individual classification rate of farmers and the frequency distribution in the delta or uplands were unsatisfactory. The simulation of the spatial dynamics of land use in the Philippines yielded a satisfactory fit, varying between 65% and 85% [159]. We obtained an average fit of 91% for the decision to raise or not to raise fish, but an error of about 400% for the ditch–dike system in the hills. The error is relative, given that Nhan et al. [110] have estimated that only one quarter of the available ditch–dike systems in the delta are effectively used for raising fish for market purposes; i.e., the ditch–dike systems are available but farmers do not stock fish. Psychologists consider that people’s decisions are the outcome of complex and unobservable mental processes that researchers are still trying to elucidate [77]. This is probably also reflected in the low individual classification rate for e.g. the infrequent rice–fish system: many farmers may have conditions suitable for the rice–fish system but only a few are actually using it, and we were unable to simulate their reasoning with the present rule base and decision model. The rule base and the data sets used were rudimentary and have scope for improvement in terms of individual farmer knowledge and experience; this should reduce errors and increase the classification rate. Moreover, though using composed variables allowed a simple simulation model to be developed; this may have dramatically decreased the fuzzy character of the reasoning.
We made this fuzzy model to simulate farmer decision-making about adopting four aquaculture systems in the Vietnamese part of the Mekong Delta. Whether a fuzzy logic model can be used to explore the possibilities of fish production in other regions can be discussed only after the simulation has been refined by replacing the composed variables with a third level of FISs, including more factors for each product, and specifying additional rules for the farmers’ reference frame.
57
CHAPTER 4
A METHODOLOGY FOR DESIGNING
FUZZY LOGIC MODELS TO SIMULATE
FARMERS' DECISIONS ON INTEGRATED
AGRICULTURE–AQUACULTURE SYSTEMS
Submitted to:
Agriculture Systems, November 2007:
Roel Bosma, Jan van den Berg, Uzay Kaymak, Henk Udo , Johan Verreth

Chapter 4 _______________________ Design fuzzy models of decision-making
58
Abstract
The scientific literature describing expert-driven fuzzy logic models that simulate human decision-making rarely gives details on the methodology applied. This paper describes a methodological framework of ten steps for which the main data sources are individual expert’s drives, motives and context. To test the approach we simulated decision-making on the composition of mixed farming systems in the Mekong Delta, Vietnam.
Except for model implementation, the steps were recursive, implying that during the development process it may be necessary to return to earlier steps. The model conceptualisation, selection of variables, model structuring, definition of linguistic values and membership functions were essentially based on approaches from the socio-technical regime analysis and the livelihood asset framework, using a small sample. A larger sample was used to augment the database for training and validation. The minimum sample size should depend on the frequency of the individual events within the problem area: the fewer the events the larger the sample size needed.
The resulting fuzzy logic model consists of a transparent hierarchical tree architecture composed of several fuzzy inference systems in three layers. In order to obtain the desired degree of sensitivity to each of the variables, it was necessary to have up to five linguistic values for some of the input variables and the output variables in the intermediate layers of the HFS. The hierarchical model structure of several fuzzy inference sub-systems mimicked human decision-making, limited complexity and was transparent. This may allow the stakeholder to be involved in developing a user-friendly decision-support tool, which requires an 11th step.
Key words: Fuzzy models, Expert systems, Decision-making, Agriculture, Aquaculture.

59
4. A methodology for designing fuzzy logic models to simulate farmers' decisions on integrated agriculture–aquaculture systems
4.1. Introduction Sustainable development in agriculture can be enhanced by technology, context and social factors. Decision-making (DM) on innovations that involve several actors with different motives and drives, usually entails considering multiple criteria. Whereas most mathematical models that simulate agricultural development are based upon the paradigm of utility maximisation [9, 144, 154], recent approaches in rural development consider farmers to be the major actors in shaping the development trajectory [92]. Human DM is a complex, imperfectly understood phenomenon, but is certainly much more than just utility maximisation [59, 123, 155]. In a recent overview of crop–livestock simulation models it was recognised, for example, that the household’s stage of development and its effect on strategic DM have not been sufficiently considered in model development [154]. In this chapter we take up the challenge of simulating human DM, as alternative models are needed to mimic the DM process for the development of sound decision-support tools.
In this context, fuzzy multiple-attribute models are considered an alternative to the multiple-attribute utility theory [56]. Fuzzy set theory [169] allows computing with words and can provide a more powerful tool for modelling complex human reasoning than classical multiple-goal linear programming models [158]. Fuzzy logic models (FLMs) allow multiple truth’ values (in contrast to the Boolean (0-1) logic), can better mimic the ways humans argue, and are able to manipulate knowledge, as well as quantitative and qualitative information by using fuzzy linguistic values defined by gradual functions. Moreover, FLMs allow DM in the case of incomplete information, enable difficult problems to be handled more efficiently than conventional methods, and can deal with interdependence between variables and conflicts of interest [29]. FLMs have become popular in technical systems, e.g. machine control, but a considerable number of applications have also been reported in human DM, including for the evaluation of sustainable agricultural development [13]. FLM applications based on expert systems (ESs) have evolved since the mid-1960 [88]; in the latter reference 165 published articles were reviewed, six of which relating to rule based and knowledge-based ESs in agriculture. Since 1960, some 30 papers in the journal “Computers and Electronics in Agriculture” and some 20 papers in “Agricultural Systems” have referred to approaches based on fuzzy logic; five of these papers were cited by Liao [88]. The fuzzy approach is more
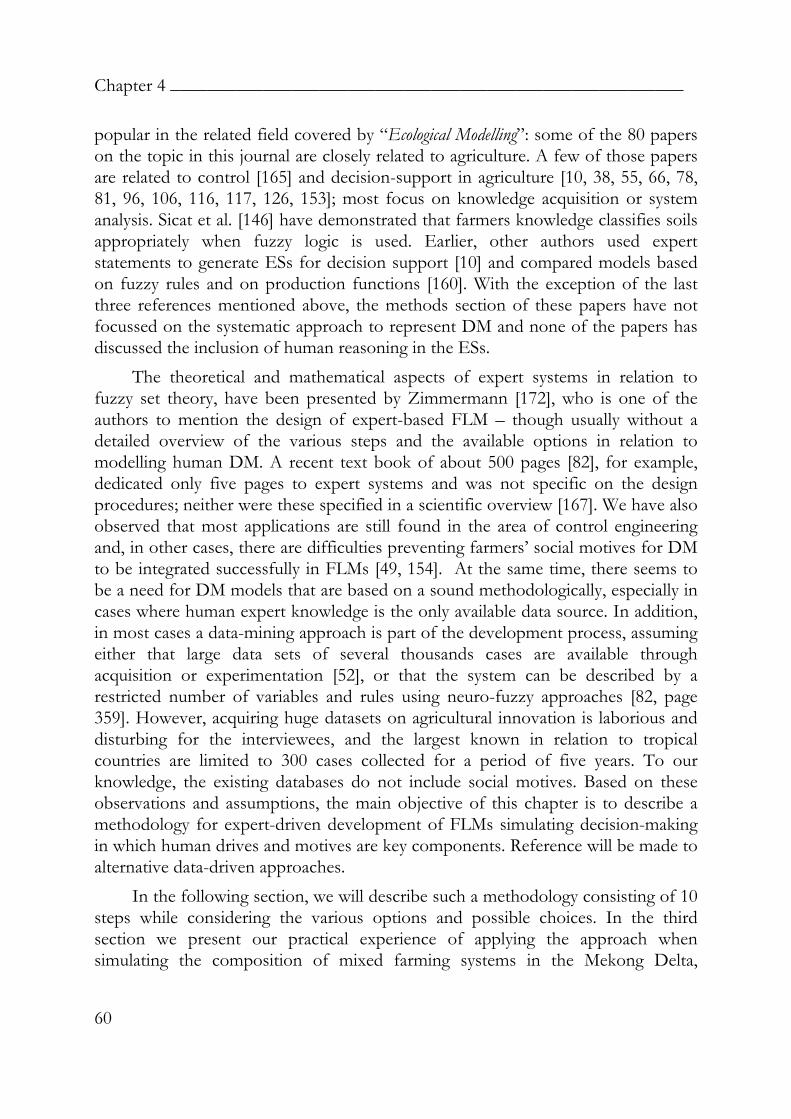
Chapter 4 _______________________________________________________
60
popular in the related field covered by “Ecological Modelling”: some of the 80 papers on the topic in this journal are closely related to agriculture. A few of those papers are related to control [165] and decision-support in agriculture [10, 38, 55, 66, 78, 81, 96, 106, 116, 117, 126, 153]; most focus on knowledge acquisition or system analysis. Sicat et al. [146] have demonstrated that farmers knowledge classifies soils appropriately when fuzzy logic is used. Earlier, other authors used expert statements to generate ESs for decision support [10] and compared models based on fuzzy rules and on production functions [160]. With the exception of the last three references mentioned above, the methods section of these papers have not focussed on the systematic approach to represent DM and none of the papers has discussed the inclusion of human reasoning in the ESs.
The theoretical and mathematical aspects of expert systems in relation to fuzzy set theory, have been presented by Zimmermann [172], who is one of the authors to mention the design of expert-based FLM – though usually without a detailed overview of the various steps and the available options in relation to modelling human DM. A recent text book of about 500 pages [82], for example, dedicated only five pages to expert systems and was not specific on the design procedures; neither were these specified in a scientific overview [167]. We have also observed that most applications are still found in the area of control engineering and, in other cases, there are difficulties preventing farmers’ social motives for DM to be integrated successfully in FLMs [49, 154]. At the same time, there seems to be a need for DM models that are based on a sound methodologically, especially in cases where human expert knowledge is the only available data source. In addition, in most cases a data-mining approach is part of the development process, assuming either that large data sets of several thousands cases are available through acquisition or experimentation [52], or that the system can be described by a restricted number of variables and rules using neuro-fuzzy approaches [82, page 359]. However, acquiring huge datasets on agricultural innovation is laborious and disturbing for the interviewees, and the largest known in relation to tropical countries are limited to 300 cases collected for a period of five years. To our knowledge, the existing databases do not include social motives. Based on these observations and assumptions, the main objective of this chapter is to describe a methodology for expert-driven development of FLMs simulating decision-making in which human drives and motives are key components. Reference will be made to alternative data-driven approaches.
In the following section, we will describe such a methodology consisting of 10 steps while considering the various options and possible choices. In the third section we present our practical experience of applying the approach when simulating the composition of mixed farming systems in the Mekong Delta,

_______________________________ Design fuzzy models of decision-making
61
Vietnam. In the fourth section we evaluate some aspects of the proposed methodology and we state our main conclusions.
4.2. Including individual motives into fuzzy logic models The kernel of the FLM we refer to is a fuzzy inference system having four modules to identify a crisp output value for a given set of input values (Chapter 1, Figure 1.2). These four modules perform the following three tasks: (1) fuzzification of crisp input values, (2) fuzzy inference using a rule base of ‘if–then’ rules and membership functions, and (3) defuzzification into a crisp output value.
The scientific literature provides several descriptions of the procedures needed to develop FLMs, but authors indicate different main stages and focus on their field of interest. For example, Babuska [7] indicated three stages to construct FMs, in brief: choose the fuzzy inference system; choose mathematical operators; develop rules and membership functions (MFs). For modelling ecosystems, Salski [141] extended this three-stage approach with determination of model structure, calibration and validation. The procedure for developing FLM control applications proposed by Emami et al. [52] is separated into three stages which are subsequently specified. (1) The determination of the reasoning mechanism refers to choosing the mathematical operators of the inference system. (2a) The identification of the system’s structure needs input selection, definition of input MFs, rule generation and definition of output MFs. (2b) The identification of the systems’ parameters includes two steps: tuning the MFs and adjusting the inference parameters. (3) The modelling part includes four steps: definition of the experimental set-up, definition of test plan and data acquisition, data processing and data selection, and comparison with the analytical model. The various steps of this three-stage approach are partly an extension of the seven stages described by Jang et al. [76], who also distinguish the following three that were not considered specifically in the nine steps of Emami et al. [52]: determine the linguistic terms associated with each variable; design a collection of fuzzy ‘if–then’ rules and check the model’s validity. Some of those approaches are not detailed, and others are incomplete; some do not mention the recursive nature of model development and while mentioning the others are not specific on the feedback loops that are needed in practise. In light of the above, we describe a 10-step approach and specify the reasons for the feedback loops in the development process (Figure 4.1).
Below, in the first paragraph on each step we briefly describe the step and its goal or the resulting state in the modelling process, and in the following paragraph we describe the corresponding activities to be performed and the reasons for feedback known beforehand. We included the decisions on the reasoning mechanism in the implementation step.

Chapter 4 _______________________________________________________
62 Fi
gure
4.1
. The
10
step
s pro
pose
d fo
r the
dev
elopm
ent o
f a fu
zzy-
logi
c m
odel
of so
cial d
ecisi
on-m
akin
g (D
M) w
ith (l
eft)
the
goal
o
f eac
h st
ep, (
cent
re) t
he a
ctiv
ities
to b
e pe
rfor
med
and
(rig
ht) t
he g
oal o
r the
resu
lting
stat
e in
the
mod
ellin
g pr
oces
s.
_______________________________ Design fuzzy models of decision-making
63
4.2.1. Conceptualisation of the DM problem In order to model an individual problem in a real-world, ill-structured, decision environment, an analysis must be performed according to a well-defined objective [86]. This step, can be considered identical to the problem analysis or conceptualisation as described extensively for company acquisition [101] and to the definition of experimental set-up for the design of the control systems [52]. The goal of this analysis is to conceptualise the DM problem, i.e., to describe the types of decisions to be simulated and the specific domain for which the DM model is supposed to hold, while taking account of the relevant stakeholders. This includes the assemblage of concepts that the actors in the DM process use in their reasoning, which is presumed to be context- and actor-specific [93]. The analysis should deliver information that enables the selection of relevant input and output variables and the identification of the structure of the system, i.e., expert knowledge in the form of patterns of causes and consequences and the heuristics relating them [63].
Thus to make the DM processes explicit, we need to identify the stakeholders’ personal context, their options, choices and general ways of reasoning. The conceptualisation can be done through literature study, domain expert consultation, actor identification, collection of qualitative and quantitative information, stakeholder consultation, and – if large dataset are available –statistical analysis. The information needed can be collected by observing and interviewing actors in the field. To be able to design a generic model, information needs to be collected in a range of contexts, and the methods for sampling, data collection, and analysis need to be standardised. Social scientists studying rural development and technology adoption use, among others, the socio-technical regime analysis [71] and technographic studies [133], both based on semi-open interviews. The analysis of the socio-technical regime considers e.g. the embedding of technology in society, the agency of stakeholders and institutions, the chaotic trajectories of technology development, the information networks, and the farmer’s reference frame.
4.2.2. Selection of input and output variables The goal of the second step is to define the variables of the input–output model, in which the domain of the output variable(s) describes the possible outcomes of the decision and the domain of the input variables describes the possible values that the input variables can take. The identified variables must be operational, i.e. possible to qualify as a linguistic value or to quantify with a crisp value. Together they determine the decision: O = f ( I ), where O is usually a one-dimensional decision

Chapter 4 _______________________________________________________
64
variable having a discrete (finite) number of possible decision values and I is a multi-dimensional input vector.
Using the results of the first step, the relevant DM factors and their relationships need to be identified, bearing in mind the modelling goals. In agreement with Emami et al. [52], the output categories are defined first, because input variables are relevant in relation to the outputs. The input variables can be derived through knowledge elicitation or in the exceptional case of a large dataset being available, through data mining. Feature extraction is needed to make e.g. the motivational variables operational. Knowledge is elicited using domain experts, who may use a variety of IT tools – though the knowledge acquired remains subjective [5]. In our proposed approach the data can be used for statistical analysis or data-driven learning as a feedback after composing the database. For social DM, the input variables can be identified through correlations using statistical analysis and through elicitation of causalities using theories on e.g. the classical economic production factors, human behaviour [123, 132], farm management styles [12], and rural livelihood analysis [2].
4.2.3. Identification of the structure of the fuzzy system The goal of this step is to identify an FLM structure that mimics the decision-making process. The process is composed of a large number of input and output variables and its domains have a high number of clauses. Models of such processes are exposed to the curse of dimensionality – i.e. when the variables become very numerous, the number of rules needed increases exponentially [145]. The proliferation of rules can be managed by reducing complexity: decomposing the FLM, simplifying the rule base, and reducing dimensionality (ibid.).
To develop generic ESs, the structure is identified by eliciting the experts’ reasoning, the aim being to design a structure that presumably mimics the DM process and is logic-based and knowledge-transparent [140]. Experts in panels may have diametrically different opinions on how to structure the FLM; in such cases, one might consider developing a multi-fuzzy model where the final decision is made using a weighted voting procedure [6]. Structure identification can lead to clustering of variables but also to the decomposition of features making it necessary to collect supplementary information. If the structure is unsatisfactory, it may be worthwhile either using a data-driven approach, in order to identify the most straightforward and simple structure [28], or to using pruning procedures [70, page 270]. Straightforward data-driven approaches bring the risk of neglecting decision-making pathways and reducing transparency, especially when the databases are small [65]. On the basis of the experience with neural networks [60], it is advisable

_______________________________ Design fuzzy models of decision-making
65
to deal with complex systems by decomposing them, by choosing an overarching structure of various FISs before data-mining.
As human DM is frequently analysed and guided with hierarchical decision-trees, the natural choice is to use a hierarchical fuzzy system (HFS). Its transparency is one of the reasons the hierarchical tree is the basic tool for problem analysis in the Logical Framework Approach used in development cooperation [e.g. 113]. HFSs have three advantages for modelling real-world problems: interpretability, accuracy, and dimensionality reduction. HFSs are superior to the standard FLM in overcoming the curse of dimensionality, as they decompose the extensive rule base into smaller decision matrixes that are easier to compose without errors [85, 87, 91, 171, 173]. The use of a HFS may significantly reduce the number of rules needed [87].
4.2.4. Determination of the linguistic term sets FLMs deal with expert opinions through a natural language interface for the variables [168]. Zadeh [170] introduced the following notions as possibilities for the fuzzy representation of the variables: fuzzy linguistic truth values, fuzzy predicates and predicate modifiers, fuzzy quantifiers, and fuzzy probabilities. The goal is to define for each input and output variable (defined in steps 2 and 3), a corresponding linguistic term set. To maintain the interpretability of the FLM, the linguistic term sets need to be in line with the conceptualisation performed in first step.
The choice of the linguistic terms of input and output features can be based either on standards (in industry e.g. to various degrees of heating in a washing machine in relation to the water fill and temperature needed), or to be left to domain experts so that the model users, e.g. managers or policy makers, are able to interpret [101]. Using multiple predicates and modifiers increases the complexity of FLMs, but this can be solved by superposing proximate MFs to reduce the number of linguistic values: this is especially needed after data-mining [145]. In order to be able to decide on the number of linguistic values, it may be necessary to collect more information.
4.2.5. Determination of the membership functions In this step, the fuzzy character of the linguistic expressions of both the input and output variables is defined in terms of membership functions (MFs). The results of this step are parameterised MFs representing the initial, prototypical tendencies in the universe of discourse of each of the variables. In general the span of the MFs should cover the data dispersion [101]. The type of function chosen depends on the

Chapter 4 _______________________________________________________
66
procedures of parameter identification and the character of the variable. Smooth functions, e.g. Gaussian, are required for the automated determination of parameters by data-based gradient descent learning [e.g. 53] and for the automated fine-tuning [67]. Moreover, smooth functions reduce the model’s sensitivity, i.e. increase the overlap of the membership functions and thus the model’s fuzzy character [172].
For ESs, the fuzzy partition should be based on the distribution and characteristics of the data itself and/or on automated methods based on unsupervised clustering [65]. Medasania et al. [103] give an overview of automated membership generation techniques. Recently others have described the transition interval estimation method [42] and direct measurement by experts [157]. For manual procedures, as we propose, MFs can be chosen from available libraries of specialised software and initial values of parameters can be determined by trial and error, using e.g. medians or quartiles of the data as a starting point. For each variable, the aggregated surface area of the MFs has to cover the space of discourse of the graph. If the final MFs cover almost the same area in the universe of discourse, the related linguistic values may be matched and redefined.
4.2.6. Construction of a collection of fuzzy if–then rules The goal of this step is the definition of a rule base, i.e. a collection of the fuzzy ‘if–then’ rules, specifying the prototypical behaviour of the system under study. A typical fuzzy ‘if–then’ rule is composed as follows: ‘If x is A and y is B and … then z is C ’. A rule should be deductively adequate, i.e. the expression must allow itself to be solved by inference; if the representation is too expressive it will be more difficult to focus the inference [8]. Important properties of rule bases are completeness, consistency and non-redundancy, as well as simplicity. Simplicity or compactness refers to the number of rules and the number of variables in the rules and when the systems are complex, might be at odds with completeness and consistency. Although FLMs can deal with incompleteness and inconsistency of the ES through its fuzzy reasoning mechanism, in most cases experts intend to be complete.
Composing a complete rule base of complex problems might be beyond the experts’ capacity, especially as our understanding of the real world is incomplete [57]. However, experts tend to be rational and might not reveal inconsistency even though it exist in reality [162]. On the other hand, one might also have to deal with inconsistency between multiple experts; one way of solving this is through fuzzy evaluation [42]. Data-driven approaches tend to reveal restricted rule bases, but if the original database has a limited scale, the rule base might be incomplete. It was

_______________________________ Design fuzzy models of decision-making
67
for that reason that Guillaume and Magdalena [65] proposed an integrative method to design compact and non-redundant, but consistent, rule bases.
A fuzzy rule base base for ESs can be composed directly by domain experts [e.g. 117], derived from experts’ opinions or panels [chapter 5 in: 41], or derived by data-mining [e.g. 74]. In principle, fieldwork should reveal all prototypical cases, the rule base defined by domain experts should contain all relevant rules, and the rules should be checked by stakeholders in a participatory process. To simplify the rule base it is preferable to limit the number of alternative rules, e.g. by using constraints. Successful data-mining requires a large database, as if smaller databases are used exceptional cases may be missed. All methods of rule base composition can lead to redundant rules, but these can be pruned by means of automated procedures. In relation to agricultural development, we are especially interested in the few individuals who are innovators [47], and therefore all prototypical cases need to be included. If after adjusting membership parameters during training (see 2.9) some prototypical cases are not revealed among the consequences, the rule bases should be adjusted. The final rule base will be achieved after model validation when non-firing rules can be eliminated (see 2.10).
4.2.7. Database composition Databases of cases relating to the models objective are needed to train and validate a model (see 4.2.9 and 4.2.10). The database should be large enough to train and to validate the rule based system. Separate databases can also be used for training and for validation (see 4.2.10). As a result, the variables for each individual case in the sample are concretised through data. Either the identified variables must be operational, or operational features need to be extracted or processed. A preliminary set of data may have been collected for the problem analysis; if a small sample was used, more cases need to be identified and more data collected.
Four phases are distinguishable in the composition of a database: sampling, data collection, data cleaning and data pre-processing. Pre-processing might be needed after model simplification or to make the collected data congruent with the linguistic reasoning. Processing refers specifically to calculating one variable from several primary factors; feature extraction refers e.g. to the classifications on the basis of available information (see 4.3.7). Data for technical applications are often collected during experiments; data for ESs can be collected from long-term records, expert panels, observations or interviews. Collecting data from experts can be a laborious process, which is also an imposition if it does not benefit to the interviewed experts directly. Therefore most studies on social change and adoption of innovations in rural agriculture use small samples, such as we propose for the conceptualisation. In the latter case, for the training and validation of the model
Chapter 4 _______________________________________________________
68
supplementary cases need to be identified and complementary data collected at any time between the selection of the variables and the implementation of the model.
4.2.8. Implementation As well as the choice of software, the implementation involves choosing the fuzzy inference system, the type of t-norm to calculate the degree of membership, and the type of t-conorm to determine the combined degree of fulfilment for each rule (Chapter 3, Figure 3.2). Determining the combined degree of fulfilment, or firing strength, stands for truncating the section of the output’s membership function that represents the space of discourse occupied by the specific rule’s output. The goal is to identify an inference system that maintains both the transparency and the uncertainty of the reasoning in the intermediate layers of the HFS.
Two main types of FIS are available for the reasoning mechanism of the inference: Mamdani and Takagi–Sugeno–Kang (TSK) models [76]. TSK models are very appropriate for use in data-driven procedures (ibid.) and are mainly used in direct control applications and simplified models [82, page 128]. TSK models deliver a crisp output for each set of rules, which is a disadvantage if one wants to use the fuzzy outputs at the intermediate layers of HFS to maintain the advantage of dealing with uncertainty, and at the final stage to check the model’s sensitivity. Mamdani fuzzy models are popular in low-level direct control but also very appropriate for high-level hierarchical control systems and ESs (ibid.).
In fuzzy inference, the degree of compatibility (μ) of each variable with rule antecedent is computed (Figure 2). Then, the degrees of compatibility are combined into a degree of fulfilment of the rules. The combined degree of fulfilment is calculated using a t-norm (β ). One of the following four methods can be used to compute the degree of fulfilment: minimum, algebraic product, bounded product and drastic product. Both Zimmermann [173] and Bellman & Giertz [11] consider the min-operator a natural choice for the inference of rules and MFs related to fuzzy ‘and ’ rules. Subsequently, in Mamdani, t-conorms are used to calculate the firing strength of the aggregated set of rules. The degree to which the combined rules are fulfilled is mostly calculated by taking the union of the rules output using the maximum operator, after which the fuzzy output may be decoded. Methods used to defuzzify or decode the fuzzy output in a crisp decision are the calculation of centroid of the area, bisector of area (centre of gravity), and mean, smallest or largest of maximum [76], of which the most popular are the centroid of area and the centre of gravity.
Various software programs are available for the implementation of fuzzy logic inference procedures, especially when using data-mining and learning. Libraries with functions are not widely available for implementing FLMs in spreadsheets or

_______________________________ Design fuzzy models of decision-making
69
programming languages. The fuzzy logic toolbox of the software we used overcomes these limitations and has good visualisation tools [99]. Before proceeding with the next step, calibration and fine-tuning, it is advisable to check that there are no mistakes in the database, the rule base or in other aspects of the model [152].
4.2.9. Calibration and fine-tuning Model calibration or training is needed to fit the model, i.e. to obtain an optimal fit between the model estimates and the result of the decision-making process being studied, represented by an original dataset. Model training is done through calibration and fine-tuning – either manually or automatically. In this step automated training does not change the rule base; adjusting the rule base is part of the manual training procedure. Automated training mostly uses algorithms to reduce the error rate by adjusting the parameters of the MFs in subsequent iterations. Automated procedures have also been proposed for fine-tuning [67]. For manual calibration and fine-tuning, face validity is checked after each subsequent model run, by comparing the model output against the real-world outcome [148]. To optimise the fit, the parameterised MFs and the rules are adjusted [76].
Manual calibration entails running the model on a training dataset (see 4.2.10) for a range of values for all variables, checking on face validity, and then is adjusting and checking the model. In FLM, optimal membership of the linguistic functions is also determined through fine-tuning, i.e. by adjusting of the model to maximise fit for individual cases. The model can be manually adjusted vis-à-vis the rules, the number of linguistic values, and the parameters of the MFs at all layers of the HFS. The procedures are repeated until a satisfactory fit is obtained, i.e. until the face validity of the model output and calibration data is optimal. The model’s performance may be checked using classification rates and sensitivity analysis (see 4.2.10) and further improvements implemented before proceeding with validation.
4.2.10. Validation and performance assessment In addition to face validation, Sorensen [148] distinguished validation and operational validation, also called testing; the goal of both is to confirm the model’s accuracy. Validation is the process of determining that the model developed through training performs similarly when applied to a comparable database. Operational validation refers to testing the model in real-world situations or in repeated experiments. Models intended for decision support should be tested on the future users. Sensitivity analysis is considered necessary before deciding on the model’s fitness for general applicability [152]. However, as the automated methods

Chapter 4 _______________________________________________________
70
of sensitivity analysis that fit non-linear, non-monotonic models are considered to be not interpretable by the model-users [130], we used another method.
In simulation, soft computing, and machine learning, the results of training are usually validated against another, but comparable, dataset for the first validation. For testing, the model needs to be run on another dataset. If only one database is available, it can be split into separate datasets for training, validation and testing [70]. The validation set is used to confirm the model’s accuracy while the test set is used to determine its fidelity of the model. A typical division is 50%, 25%, and 25% respectively (ibid.), but a training data set may contain between 50% to 90% of the original dataset, depending on the total sample size. The testing of models supporting decision-making should involve the main stakeholders, farmers and policy-makers, in a participatory process. To support validation and testing, the model’s performance is assessed using sensitivity analysis, and errors or individual classification rates (ICR). In the case of modelling farmers’ DM, the ICR of the positives is the quotient of the confirmed number of farmers practising a specific activity on the actual number of farmers practising this activity; the ICR of the negatives is identical but is for non-practising farmers (see 3.10). The overall ICR calculates the rate of all confirmed cases on the total number of cases.
The objectives of a sensitivity analysis are to assess the effects of (small) input changes on the output (data used for model calibration, and to inform the user), and to determine the optimal space of the parameter for future calibration studies [4]. Data can be obtained by running the model several times for a range of values for the crucial variables. We transposed the series of results for each variable into an MS-Excel® spreadsheet [45] to calculate the first derivatives. The first derivatives were averaged and presented as a percentage indicating the relative sensitivity of the output to a specific input variable. If validation or operational validation does not give satisfactory results, one should return to the process of calibration, including adjustment of rules, linguistic values and membership functions’ parameters. If validation and testing produce satisfactory results, non-firing rules should be eliminated from the rule base and the validation procedure should be subsequently confirmed.
4.3. Applying the approach for decisions on farm composition In the following sections we describe the application of the framework for modelling DM on farm composition in the Mekong Delta (MD). We located our case in Vietnam because contrary to the global trend of specialisation, here the family farms have diversified. As our objective was also to assess the role of motives other than economic utility, we opted for a minimum sample size and manual model development.

_______________________________ Design fuzzy models of decision-making
71
4.3.1. Conceptualisation of farmers’ decision-making The problem assessment consisted of four phases: literature study, conversations with domain experts to assess the general history of integrated agriculture–aquaculture farming systems (IAAS) in the MD, a field study to collect information for assessing farmers’ motivations (see 3.7), and a data analysis. As the goal was to assess farmers’ motives and drives to diversify the activities in their family farm, we used methods of socio-technical regimes analysis of rural livelihoods [112], on a limited number of farmers.
The first step of the interview was to draw a farm map, after a walk through the homestead and its neighbouring fields, together with the farmer. After testing the interview procedures we decided to collect data on 10 farm activities and off-farm labour. To assess the variables relevant for the DM we used the framework of rural livelihoods assets considering natural, physical, human, financial and social assets [31].
4.3.2. Selection of input and output variables In line with the objective of our study, the output variables for the model were the 10 main farm components. The semi-open interviews on the changes in farm composition and the data analysis revealed constraints, drives and motives for choosing one or more of these activities. For each of these factors, operational variables were identified (left-hand side of Figure 4.2). For the factor ‘land’ we had to consider three categories: homestead, upland, and irrigated land, each supporting different activities of the Vietnamese farmers.
The correlation analyses on the completed database revealed that the farm diversification and component integration were affected by various farmers’ motives and drives [19]. The effective integration of farm components related to six variables, among which the farmer’s motivation to integrate. The latter motivation can be made operational by asking individual farmers to rate the importance of integration, or by an index of integration representing the number of flows between the farm’s components. We extracted the index of integration by counting the flows on the farm map [20].
The farmers’ opinions confirmed the results known from the literature [110, 121] on the variables influencing the economic opportunity to practise a component. The attitude towards risk was extracted from the information collected [20], but can also be quantified using valuation methods [22]. However, the level of know-how on an activity also influenced the decision whether or not to practise a component. The livelihood analysis revealed that the farmers’ preference of having their own rice-field to guarantee food security affected their decisions with regard

Chapter 4 _______________________________________________________
72
to land-uses other than rice. Supplementary data collection was needed to make both these variables operational: a first feedback loop.
4.3.3. Identification of the hierarchical structure of fuzzy inference systems The modeller decomposed the farmers’ reasoning characterised by the identified variables. The open interviews revealed that the farmer can perform an activity if none of the production factors is constraining and if the opportunity for the product is promising. Most of these features are determined by several variables. If both the factors and opportunity for a product are favourable the farmer may decide to practise the component if he is motivated to do so. This leads to a hierarchically structured model of three layers that is presumed to mimic the DM process (Figure 4.2). As the manual decomposition delivers a transparent structure, the capability of the modeller to empathise with the experts’ reasoning for mimicking the DM process can be strengthened by obtaining the participation of stakeholders. During the conceptualisation of the DM in an HFS, supplementary variables were identified, for which feature extraction and data collection were needed.
The HFS had five subsets: the primary production factors, the product opportunities, the product options, the farmer’s reference frames (FRFs), and the final output layer. The family-related motives for change were inferred in an FRF for diversification; the other FRF was composed of the variables related to the integration of farm components. In agreement with Lee et al. [87] the FRFs were inferred in the first layer but fed directly into the third layer of the HFS (Figure 4.2). This solution overcomes the constraint of meaningless inputs and outputs in the intermediate layers of HFS, thus maintaining the advantage of transparency of the decision-tree structure allowing participation of stakeholders.
The evaluation of the effect of structuring the model on rule reduction is not straightforward, as the individual FISs have different numbers of variables and variables have different numbers of values (Table 4.1). Moreover some variables are implemented several times (e.g. in the second layer, capital and labour are each implemented ten times). Following Lee et al. [87], if each variable in the HFS had two values, a flat structure of 46 variables would need 246 or more than 7x10¹³ rules. If each variable in the 1st and 2nd layer had three linguistic values and the 12 variables in the 3rd had two values, a complete rule base of our HFS would have 15*(34 ) + 3*(37 ) + 1*(212 ) = 3645 + 21870 + 4096 = 29,611 rules (See 4.3.10 for the final number of rules).

_______________________________ Design fuzzy models of decision-making
73
Inputs FIS-layer-1: Production factors & FIS-layer-2: FIS-layer-3: Product’s opportunities & FRF Product options Farming system
Com
pone
nts i
n fa
rmin
g sy
stem
Rain duration
Opportunity to make profit from nine
other products
Age head household
Capital
Water
Labour
ha homestead
ha lowland
ha upland
LQI homestead
LQI lowland
LQI upland
Rain amountFlood durationFlood depth
Distance market
Distance lowland
Distance upland
Water source
Value upland
Value lowland
Value homestead
ha green certificateha red certificateRank well-being
Risk-taking behaviour
Household labour
Know-how product Market price product 2
Opportunity to make profit from
growing rice
Option to grow wet rice
Option for nine other products
Index for Integration
Rank rice food security
Farmer's reference frame for integrationRank formal education
Household life-course Farmer's reference framefor diversificationChildren & young
Cost of specific input 1
1: Cost for piglets only; 2: for chickens and ducks the prices of eggs and broilers were considered.
Figure 4.2. Simplified structure of the hierarchical fuzzy model simulating farmers’ decision-making on their farm composition: left-hand column showing the input variables for 18 first-layer Fuzzy Inference Systems; extreme right shows the output (the third layer).
Legend: FRF = farmer reference frame; ha = hectare; LQI = land quality index; dotted line = input variables for the farmers’ references frames; dashed line = ditto for the production factors; solid line = ditto for opportunity to make a profit.

Chapter 4 _______________________________________________________
74
Figure 4.3. An example of how increasing the number of linguistic values for an intermediate output from 3 to 4 affects on the range of the final output.
4.3.4. Determination of the linguistic term sets For the linguistic terms in the first layer we referred directly to those used by farmers or in the ratings. Farmers mostly used three to five predicate modifiers e.g.: very bad, bad, acceptable, good, and very good. Other predicates farmers used were: small/large, close/far. Not all linguistic levels were implemented for every variable: having in mind the necessity to restrict complexity, the modeller reduced the number of term sets as far as possible without losing sensitivity.
Using two linguistic values in the intermediate layers of the HFS was the modeller’s starting point. However, to maintain sensitivity and to obtain optimal fit during calibration, more terms were needed, for four reasons: (1) To define a constraint while maintaining variation in the remaining section of
the space of discourse. (2) To define a rule base in which the effects of all the inputs were distinguishable
and non-confounded (Table 4.2). Among the intermediate outputs of the first layer, for example the availability of capital needed four levels, while the opportunity to produce rice even needed five levels (Table 4.1). The number of values of the input variable impacts upon the range of values the output can take (Fig. 4.3).
(3) To obtain acceptable effects of the variation in the original variables the intermediate inputs for the 2nd layer, e.g. for capital, needed three linguistic levels, while we attributed only two levels to all other inputs for this layer (Table 4.1). Among the inputs of the first layer, four linguistic levels were needed to describe the quality of the water source, so as to be able to distinguish the good water availability in some upland soils from the excellent water availability in the floodplain (lowland in the delta).
0 0.5 1 1.5 2 2.5 3 3.5 4 4.5 50.36
0.38
0.4
0.42
0.44
0.46
Index for component integration (CIindex)Ave
rage
cen
tre o
f gra
vity
(ACG
)
ACG for duck with 4 linguistic outputs for FRF of integrationACG for duck with 3 linguistic outputs for FRF of integration

_______________________________ Design fuzzy models of decision-making
75
Table 4.1 An overview of the 28 fuzzy inference systems (FIS), with the number of input and output variables, the number of linguistic terms (LT) used, and the initial number of fuzzy rules (777) and the final number (668) after trimming the non-firing rules.
Number of: Fuzzy rules
Level in
system Title of FIS
input
variablesLinguistic
terms initial final output vars.
LT
1 Value of irrigated land 5 4x2, 1x3 32 25 1 3 1 Value of upland 5 4x2, 1x3 26 8 1 3 1 Value of homestead 4 3x2, 1x3 17 6 1 3 1 Labour availability 2 2x3 9 9 1 3 1 Capital availability 4 3x2, 1x3 24 18 1 4 1 Water availability 5 4x2, 1x4 28 6 1 3 1 Opportunity for rice 3 1x2, 2x3 16 16 1 5 1 Opportunity for fruits 3 1x2, 2x3 18 15 1 4 1 Opportunity for cattle/goats 3 1x2, 2x3 18 18 1 4 1 Opportunity for fish/veg./crops 3 1x2, 2x3 18 18 1 3 1 Opportunity for pigs 5 2x2, 3x3 44 38 1 4 1 Opportunity for ducks 5 2x2, 3x3 62 54 1 3 1 Opportunity for chickens 5 2x2, 3x3 34 34 1 3
1-2 FRF for diversification 3 2x2, 1x3 10 10 1 3 1-2 FRF for integration 7 4x2, 3x3 28 19 1 4 2 Option to crop a rice field 8 6x2, 2x3 76 76 1 3 2 Option to grow upland crops 8 7x2, 1x3 21 21 1 2 2 Option to produce vegetables 7 7x3 43 36 1 3 2 Option to produce fruit 7 6x2,1x3 21 21 1 3 2 Option to produce fish 7 4x2,3x3 21 21 1 3 2 Option to produce ducks (eggs) 7 3x2,4x3 21 21 1 3 2 Option to raise cattle 7 5x2, 2x3 21 20 1 3 2 Option to raise goats 6 4x2,2x3 8 8 1 3 2 Option to raise chickens / pigs 5 2x2,3x3 13 12 1 3 3 Components in the farming
system 12 8x2, 4x3 81 72 1 11
(4) To be able to simulate the synergetic effect between two activities, e.g. pigs or
fruit on the one hand and fish on the other, some of the intermediate inputs of the 3rd layer had three linguistic levels. For the product options having no or little synergetic effect with other products, we attributed two linguistic levels.

Chapter 4 _______________________________________________________
76
Tabl
e 4.
2. T
he ru
le ba
se fo
r Cap
ital
need
ing
3 in
put v
alues
for W
ellbe
ing i
n or
der t
o di
stin
guish
con
sequ
ence
s
and
4 o
utpu
t valu
es to
pre
vent
the
dom
inat
ion
of th
e ef
fect
of
Risk
taki
ng.
Inp
uts
: W
ellbe
ing[0
4]:
poor
, zm
f[1 1
.5],
med
ium
, pim
f[1 1
.5 2
.5 3
], ric
h, sm
f[2.5
3];
Risk
taki
ng[0
5];
low
, zm
f[1 3
]; hi
gh, s
mf[1
3]);
Redb
ook[
0 10
]: sm
all, z
mf[0
.2 0
.5],
large
, sm
f[0.2
0.5
]; G
reenb
ook[
0 5]
; sm
all, z
mf[0
.5 1
]; la
rge,
smf[0
.5 1
]; O
utp
ut
Capit
al [0
1];
bad,
zm
f[0.2
0.3
]; fin
e, pi
mf[0
.2 0
.3 0
.5 0
.6],
good
, pim
f[0.5
0.6
0.8
0.9
], ex
celle
nt, s
mf[0
.8 0
.9];
1=
'if w
ellbe
ing
is po
or a
nd re
dboo
k is
small
and
gre
enbo
ok is
small
and
risk
taki
ng is
low
, the
n ca
pita
l is b
ad';
2=
'if w
ellbe
ing
is po
or a
nd re
dboo
k is
small
and
gre
enbo
ok is
small
and
risk
taki
ng is
hig
h, th
en c
apita
l is b
ad';
3=
'if w
ellbe
ing
is po
or a
nd re
dboo
k is
small
and
gre
enbo
ok is
larg
e an
d ris
ktak
ing
is lo
w, t
hen
capi
tal i
s bad
'; 4
='if
well
bein
g is
poor
and
redb
ook
is sm
all a
nd g
reen
book
is la
rge
and
riskt
akin
g is
high
, the
n ca
pita
l is f
ine';
5
='if
well
bein
g is
poor
and
redb
ook
is lar
ge a
nd g
reen
book
is sm
all a
nd ri
skta
king
is lo
w, t
hen
capi
tal i
s bad
'; 6
='if
well
bein
g is
poor
and
redb
ook
is lar
ge a
nd g
reen
book
is sm
all a
nd ri
skta
king
is h
igh,
then
cap
ital i
s fin
e';
7=
'if w
ellbe
ing
is po
or a
nd re
dboo
k is
large
and
gre
enbo
ok is
larg
e an
d ris
ktak
ing
is lo
w, t
hen
capi
tal i
s bad
'; 8
='if
well
bein
g is
poor
and
redb
ook
is lar
ge a
nd g
reen
book
is la
rge
and
riskt
akin
g is
high
, the
n ca
pita
l is f
ine';
9
='if
well
bein
g is
med
ium
and
redb
ook
is sm
all a
nd g
reen
book
is sm
all a
nd ri
skta
king
is lo
w, t
hen
capi
tal i
s bad
'; 10
='if
well
bein
g is
med
ium
and
redb
ook
is sm
all a
nd g
reen
book
is sm
all a
nd ri
skta
king
is h
igh,
then
cap
ital i
s fin
e';
11=
'if w
ellbe
ing
is m
ediu
m a
nd re
dboo
k is
small
and
gre
enbo
ok is
larg
e an
d ris
ktak
ing
is lo
w, t
hen
capi
tal i
s fin
e';
12=
'if w
ellbe
ing
is m
ediu
m a
nd re
dboo
k is
small
and
gre
enbo
ok is
larg
e an
d ris
ktak
ing
is hi
gh, t
hen
capi
tal i
s fin
e';
13=
'if w
ellbe
ing
is m
ediu
m a
nd re
dboo
k is
large
and
gre
enbo
ok is
small
and
risk
taki
ng is
low
, the
n ca
pita
l is f
ine';
14
='if
well
bein
g is
med
ium
and
redb
ook
is lar
ge a
nd g
reen
book
is sm
all a
nd ri
skta
king
is h
igh,
then
cap
ital i
s exc
ellen
t';
15=
'if w
ellbe
ing
is m
ediu
m a
nd re
dboo
k is
large
and
gre
enbo
ok is
larg
e an
d ris
ktak
ing
is lo
w, t
hen
capi
tal i
s fin
e';
16=
'if w
ellbe
ing
is m
ediu
m a
nd re
dboo
k is
large
and
gre
enbo
ok is
larg
e an
d ris
ktak
ing
is hi
gh, t
hen
capi
tal i
s exc
ellen
t';
17=
'if w
ellbe
ing
is ric
h an
d re
dboo
k is
small
and
gre
enbo
ok is
small
and
risk
taki
ng is
low
, the
n ca
pita
l is f
ine';
18
='if
well
bein
g is
rich
and
redb
ook
is sm
all a
nd g
reen
book
is sm
all a
nd ri
skta
king
is h
igh,
then
cap
ital i
s goo
d';
19=
'if w
ellbe
ing
is ric
h an
d re
dboo
k is
small
and
gre
enbo
ok is
larg
e an
d ris
ktak
ing
is lo
w, t
hen
capi
tal i
s fin
e';
20=
'if w
ellbe
ing
is ric
h an
d re
dboo
k is
small
and
gre
enbo
ok is
larg
e an
d ris
ktak
ing
is hi
gh, t
hen
capi
tal i
s goo
d';
21=
'if w
ellbe
ing
is ric
h an
d re
dboo
k is
large
and
gre
enbo
ok is
small
and
risk
taki
ng is
low
, the
n ca
pita
l is g
ood'
; 22
='if
well
bein
g is
rich
and
redb
ook
is lar
ge a
nd g
reen
book
is sm
all a
nd ri
skta
king
is h
igh,
then
cap
ital i
s exc
ellen
t';
23=
'if w
ellbe
ing
is ric
h an
d re
dboo
k is
large
and
gre
enbo
ok is
larg
e an
d ris
ktak
ing
is lo
w, t
hen
capi
tal i
s goo
d';
24=
'if w
ellbe
ing
is ric
h an
d re
dboo
k is
large
and
gre
enbo
ok is
larg
e an
d ris
ktak
ing
is hi
gh, t
hen
capi
tal i
s exc
ellen
t';

_______________________________ Design fuzzy models of decision-making
77
4.3.5. The parameterised membership functions For the MFs, we referred to standards available in the software library. To account for the multiple outcomes, i.e. one farmer practising several activities simultaneously, the consequences of the third layer were represented as a discrete set of possible alternatives.
Table 4.3. Four examples of the linguistic values and the MFs’ parameters at the intermediate layers (compare numbers in left and right columns). One example of equivalent values (Labour) and other examples of shifting the values in order to calibrate the model. Two examples of a different numbers of inputs and outputs at the intermediate layer: an increase for Capital to maintain sensitivity and a decrease for Ricefield to reduce the number of rules needed.
Output of first layer Input for second layer Labour = var (output, labour,[0 1]); Labour = mf (bad, zmf,[0.2 0.4]); Labour = mf (fine, pimf,[0.2 0.4 0.6 0.8]); Labour = mf (good, smf,[0.6 0.8]);
Ricefield = var (input, labour,[0 1]); Ricefield = mf (bad, zmf,[0.2 0.4]); Ricefield = mf (fine, pimf,[0.2 0.4 0.6 0.8]); Ricefield = mf (good, smf,[0.6 0.8]);
Capital = var (output, capital,[0 1]); Ricefield =var (input, capital,[0 1]); Capital = mf (bad, zmf,[0.2 0.8]); Ricefield =mf (bad, zmf,[0.1 0.2]); Ricefield =mf (fine, pimf,[0.1 0.2 0.5 1]); Capital = mf (good, smf,[0.2 0.8]); Ricefield =mf (good, smf,[0.5 1]); Output of second layer Input for third layer Ricefield = var (output, ricefield,[0 1]); Iaas = var (input, rice,[0 1]); Ricefield = mf (bad, zmf,[0.1 0.2]); Iaas = mf (bad, zmf,[0.3 0.7]); Ricefield = mf (fine, pimf,[0.1 0.2 0.5 0.6]); Ricefield = mf(good, smf,[0.5 0.6]); Iaas = mf (good, smf,[0.3 0.7]); Fish = var (output, fish,[0 1]); Fish = mf (bad, zmf,[0.2 0.4]); Fish = mf (fine, pimf,[0.2 0.4 0.6 0.8]); Fish = mf (good, smf,[0.6 0.8]);
Iaas = var (input, fish,[0 1]); Iaas = mf (bad, zmf,[0.4 0.45]); Iaas = mf (fine, pimf,[0.4 0.45 0.7 0.8]); Iaas = mf (good, smf,[0.7 0.8]);
To take account of the continuous character of most input variables and to
mimic the normal distribution of most human behaviour made operational by non-continuous ratings, we represented the linguistic values by smooth curves. For the MFs of the input variables and the intermediate output variables, in accordance with Jang et al. [76] we used either: (1) a combination of the asymmetrical polynomial spline-based curve open to the left (z -curve) or to the right (s -curve), or (2) a combination of these z - and s - curves with a Pi -curve that is zero at both extremes with a rise in the middle. The Pi -curve is derived from the z -MF and s -

Chapter 4 _______________________________________________________
78
MF; the 4 parameters defining the complementary Pi -MF correspond with those of the z - and s -curves, or (3) a combination of two sigmoidal functions, one open to the left, and the second open to the right. We applied two complementary sigmoidal functions when a high input value corresponded to a low linguistic appreciation.
Assuming that most human behaviour has a standard distribution, initially the parameters for the MFs of the linguistic values for the continuous input variables of the z -, s - and Pi -curves were set at quartile values calculated from the dataset, e.g. 1st quartile = low; 2nd and 3rd quartiles= acceptable and 4th quartile = good. Initially, the variables related to rating or classifications were attributed two complementary MFs, either a z - and an s -curve, or two sigmoidal functions, having equivalent parameters. Initially the parameters of the MFs for the linguistic values of the intermediate outputs and the corresponding inputs for the next layer were set at identical values (e.g. labour, Table 4.3). To reach the required degree of model sensitivity and a satisfactory level of output performance, the parameters were adjusted during calibration and fine-tuning.
Table 4.4. Example of a rule base (farmers’ opportunity to make a profit from raising cattle) with a constraint (1).
1='if pricattle is low, then proficattle is bad'; 2='if market is far and know-how is low and pricattle is high, then proficattle is low'; 3='if market is far and know-how is high and pricattle is high, then proficattle is fine'; 4='if market is close and know-how is low and pricattle is high, then proficattle is fine'; 5='if market is close and know-how is high and pricattle is high, then proficattle is good’; Note that the rule base implemented was different.
4.3.6. Determination of the fuzzy rules Taking account of farmers’ statements, and the results of the empirical and statistical analysis of the collected information, the modeller designed the ‘if–then’ rules of the various FISs. If domain knowledge could not be transposed into a limited number of rules, the modeller took a complete rule base as a starting point and reduced the number of rules by trimming. The ultimate consequence of trimming can be a constraint. Whenever possible we reduced the rule explosion by straightforward definition of a constraint for a variable (Table 4.4). Note that the other linguistic values for this variable needed to be included in the remaining rules, as otherwise the constraint was not considered. This limited trimming; e.g. the first 2 rules in Table 4.2 indicate an opportunity for trimming as the consequence of the 2 values of risk-taking is equal, but trimming could be applied only if this was generalised over the rule base and the low value replaced by a constraint, as has

_______________________________ Design fuzzy models of decision-making
79
been done in Table 4.4. The rule composition led to a different number of rules for each FIS.
In the third layer, the consequence of the series of rules for each of the activities was always affirmative. To account for the multiple outcomes, i.e. one farmer practising several components, the third-layer rule base contained some rules with the same antecedents but different consequences; hence, the system had multiple outputs. If in the third layer an input with three linguistic values was used, a simple antecedent rule was composed with the high linguistic value and a positive consequence for the product (e.g. ‘If option fruit is good, then fruit is yes’). In most other rules of the third layer, one or both of the FRFs needed to be good if a component was to be applied (e.g. ‘If option fish is bad, and option pig is good, and FRF for integration is high, then fish is yes’). If rules were adjusted during calibration, a feedback loop to the linguistic values was often required, especially to obtain the expected degree of sensitivity.
4.3.7. Composing the database In 2004 we interviewed 144 households for model conceptualisation and put the data in an MS-Excel® file. The subsequent analysis and the identification of input variables and of a model structure representing the DM process revealed that data for seven variables had not been collected during the first round of interviews. During a second round of interviews, complementary and supplementary data and ratings for two variables were collected. Data to make five other variables operational were extracted from the information: e.g. the phase of household life-course was derived from age household head and the household composition. From the household composition we calculated two other variables: number of children and youngsters, and availability of household labour.
For correct inference in the software, the database should not contain empty fields for missing values. The software encoded empty fields from the database in a set of letter codes that was considered during inference. Empty fields in the datasheet occurred mainly on the distances and on know-how and were filled in using statistical procedures. For each case the database contained 46 variables.
4.3.8. Implementation For the reasons mentioned above, we applied Mamdani with the min–max operators, respectively, using the fuzzy logic toolbox of Matlab®7 [99]. The fuzzy outputs of the FISs in the first and second layers were fed directly into the FISs of the second and third layers of the hierarchical tree, respectively. The fuzzy output of the third layer could have a value between 0 and 1; a farmer was assumed to

Chapter 4 _______________________________________________________
80
have a particular component if the membership for that output was larger than 0.5 [18].
The FISs of the FRFs were parsed together with the FIS of the first layer, although their outputs were fed into the third layer (Figure 4.2). If the rule base with its membership functions and linguistic terms, the database, and the model procedures are thoroughly verified, previous steps need not to be revisited. To facilitate manual calibration and fine-tuning, we also calculated the centre of gravity for each of the fuzzy inference systems.
4.3.9. Calibration and fine-tuning For training we randomly sampled 48 cases from the delta database; sampling was weighted for the rank of well-being. Given the limited number of cases, especially for some activities, we applied manual procedures. For calibration we ran the model for a range of values for all variables, to observe the model’s sensitivity. To check face validity during calibration, we compared the simulation results to the number of farmers practising the components in the given year.
For calibration and fine-tuning we referred to the values and distribution of both the centre of gravity of the fuzzy output of every FIS of the intermediate layers and the output of the third layer (Figure 4.2). To obtain fit, the rules were adjusted and the parameters of the MFs were shifted to the left or the right for the variables both at the basic and intermediate levels of the HFS (Table 4.3). This process is somewhat similar to gradient-based search, an automated procedure. Individual fine-tuning was done for those output variables for which the estimated number of farmers practising at an aggregated level did not reach a desired level of fit. Manual fine-tuning allowed insight in the process to be maintained while it was necessary to adjust the MF parameters and rules in order to maximise fit. Fine-tuning was most needed for the activities with a small number of practising farmers, e.g. only 2 farmers with ruminants were represented in the training dataset.
4.3.10. Model validation and testing For validation, the computerised model was applied to the data of the 24 remaining delta farms (validation dataset), and for testing, the model was applied to the hill dataset and to historical data on market prices and farm composition in the delta. The results of the tests for changing market context and the hills will be described in the next chapter. After face validation, the model’s performance was calculated as ICRs: ICR of positives ={(npositives-type I errors)/npositives} and ICR of negatives= {(nnegatives-type II errors)/nnegatives}.

_______________________________ Design fuzzy models of decision-making
81
Table 4.5. The actual and simulated numbers of farmers cropping rice and raising ruminants after initial calibration and after adjusting for rice fields on the training dataset, and after calibration and fine-tuning for ruminants on the validation dataset, and ICRs of positives, i.e. the fit of the individual simulation of the practising farmers.
Initial calibration Adjusted calibration Dataset Rice Ruminants Rice Ruminants Training Actual number 39 2 39 2 (n = 48) Simulated number 39 2 40 2
ICR of positives 0.95 0.5 92 0.0 Testing Actual number 21 4 21 4
(n = 24) Simulated number 16 1 20 4 ICR of positives 0.71 0.0 92 0.5
After adjusted calibration, the number of simulated cases for rice increased from 16 to 20 and the ICR of positives increased from 71% to 92%; for ruminants the total number of simulated cases increased from 3 to 6 while the average ICR increased from 15% to 33 %.
Validation on the small separate dataset showed that for rice and ruminants
the numbers of practising farmers was to low, as were the ICRs (Table 4.5). This was solved by readjusting the parameters for rice. Fine-tuning for ruminants on the validation dataset gave an ICR of 50%, but for the training dataset the number simulated was low and no individual fit was obtained. The training data set was not representative as the smaller dataset for testing contained twice as many farmers raising ruminants. We fine-tuned for the ruminants on the validation set, thus reducing it to a training dataset for ruminants. As a result, for the pooled training and testing dataset, the simulation of numbers was optimised and the ICR of the positives increased from 15% to 33 % for ruminants.
Table 4.6. The individual classification rates (ICRs) of positives, negatives and overall
(%), and the performance rate (square root of the product of ICRs of positives and negatives) for the aggregated delta dataset (all practising farmers).
Rice Fruit Fish Pigs Ducks Chickens RuminantsICR of positives 92 83 79 64 53 68 33 ICR of negatives 67 50 60 47 89 23 92 Overall ICR 88 81 78 60 67 60 88 Performance rate 0.75 0.59 0.61 0.44 0.50 0.33 0.32
Focussing on the positive ICR, i.e., reducing the type I errors, resulted in large
type II errors, which is a commonly observed trade-off. Therefore calibration and fine-tuning should address the reduction of both error types (Table 4.6). The

Chapter 4 _______________________________________________________
82
model’s performance indicated by the overall ICR was too optimistic, as it approached the best of the ICR of positives or negatives. Therefore we calculated a performance rate: the square root of product of the ICRs of the positives and the negatives: √[{(npos-type I errors)/npos}*{(nneg-type II errors)/nneg}]. The overall performance for the aggregated dataset of the delta varied from bad (<0.5) to good (>0.75), but was satisfactory for most components (Table 4.6).
We tested the model on the same dataset with other price levels and on a dataset of the hill districts (See chapter 5). After model testing, the elimination of the non-firing rules reduced the total number of rules from 777 to 668. Non-firing rules for all price levels and their subsequent product opportunities were maintained. Testing on the hill dataset showed that the model was context–specific because for most activities the number of practising farmers was either largely underestimated or overestimated, and the overall performance varied from very bad to unsatisfactory.
4.4. Discussion and conclusions The application of the framework showed that the development of FLMs for DM purposes is a recursive process and not a waterfall approach. In practise it turns out that previous steps need to be revisited, with the exception of the implementation step, and that several activities take place in parallel, instead of strictly sequentially. The development process does indeed require feedback loops as shown in the left-hand part of Figure 4.1. Below we discuss specifically the problem analysis, the structure, the manual procedures, and some challenges, before concluding.
The problem analysis using a field survey was crucial for determining the variables and the structure of the FLM simulation of farmers’ DM. Although we checked the interview guidelines on a small sample and entered the information while in the field, during the conception of the hierarchical decision-tree and after data analysis more variables in the DM process were identified. Consequently, the data collection was iterative in the sense that we returned to the field to collect information on these variables. Before collecting a complete dataset for model validation it is therefore advisable to construct the model based on a socio-technical analysis of a sample of intermediate size, containing all typical cases. The sample size will depend on the variation in the cases: for each typical case enough data need to be available; e.g. for the delta a dataset was available with enough cases for pigs but not for ruminants, while the opposite was true for the hill dataset. The smaller the relative number of events, the larger the sample size needed.

_______________________________ Design fuzzy models of decision-making
83
The inference of the output of the FRFs in the third layer only is identical to the solution presented by Lee et al. [87] to reduce rules in HFS. In particular cases, this procedure overcomes the constraint of meaningless outputs and inputs in the intermediate layers of the HFS. Intermediate outputs and inputs without a physical meaning would make it hard for experts to design a rule base. For methods of rule definition in HFS that are based on computer learning, this problem is solved by calculating intermediate mapping variables [87]. In the case we presented, at the intermediate layers the fuzzy outputs of the first and second layers of the HFS were directly input in the second or third layers of the HFS. The fuzzy outputs were interpretable for each individual case by calculating the centre of gravity separately. The reduced complexity and the transparency may allow experts to build HFS in consultation with stakeholders. The challenge is to design a structure where the outputs and respective inputs of the intermediate layers have a logical meaning.
The manual procedures for rule base definition, calibration and fine-tuning were complex and remain subjective; an alternative might be the integrative method of rule selection [65]. The simple model developed first [20] was also submitted to an automated procedure using gradient descent optimisation [53]. This procedure accurately predicted the farmers practising the waste-fed fish production system, but both the practises of mixed fruit–fish (ditch–dike) and of rice–fish systems were underestimated. For fully automated procedures more data are needed to assess all typical cases that can be considered during manual procedures using less data. Ekasingh et al. [50] used 300 cases for data-driven approaches. Collecting the required information from over 300 farmers not only imposes on these farmers, mostly without bringing them any benefit, it is also a costly and time-consuming exercise. At this stage of the development of the approach, we used expert knowledge only, but ideally the rule base should be submitted to the scrutiny of the main stakeholders in the process. Engaging farmers in the development of the tool allows them to learn, which they consider a benefit [48, 69, 114]. Therefore such decision support tools should be developed in a participatory approach, needing an 11th step to develop the user-friendly interface [82].
To obtain sensitivity, for example to price changes, the number of linguistic values needed to be increased up to five for some intermediate output variables. This might limit the use of fuzzy sets for models exploring long-term changes by running the models for a large range of input values, as it would increase model complexity.
Fuzzy systems have been used in combination with linear simulation models: for example to model crop planning [107] and landuse change [84]. Explorative models tend to aggregate technical data to the regional scale, skipping the farm level [e.g. 61], as the farm level introduces too much variation due to complex human

Chapter 4 _______________________________________________________
84
behaviour The proposed fuzzy model could be used to integrate motivational variables of DM at farm level into linear models supporting strategic policy decision-making.
We conclude that developing a fuzzy logic based expert system to support decision-making requires a recursive process of 11 steps, though we did not describe the 11th step needed for developing an appropriate user interface. We recommend carrying out a socio-technical analysis on a sample of limited size to identify the input and output variables, the inference structure, the linguistic term sets, the MFs and the rule base. Then the database can be completed for calibration, fine-tuning, validation, and application. The minimum sample size will depend on the frequency of the individual events within the problem area.

85
CHAPTER 5
USING FUZZY LOGIC MODELLING
TO SIMULATE MEKONG DELTA
FARMERS’ DECISION-MAKING ON
DIVERSIFICATION AND INTEGRATION
Submitted to:
Agricultural Ecosystems and Environment, in November 2007
Roel Bosma, Uzay Kaymak, Jan van den Berg, Henk Udo, Johan Verreth

Chapter 5 _____________________________________ Motives for integration
86
Abstract
Though economists are beginning to recognise that motivations other than ‘utility maximisation’ might guide human decisions, most bio-economic models of farmland still do not include basic human motivations. We assess whether farmers’ family-related motivations can be included in a fuzzy logic model of their decision-making on the composition of mixed farming systems in the Mekong Delta, Vietnam. The decision-making process was mimicked in a three-layer hierarchical architecture of several fuzzy inference systems. The model includes 3 operational variables for family motives related to farm diversification, as well as main production factors through 23 variables, farmers’ appreciation of market prices and individual farmers’ know-how of 10 activities. We describe and discuss the model validation and testing on two data sets: one collected from 72 farmers in the delta and the other collected from 72 farmers in the hills.
The individual classification rates of the model in the delta turned out to be good for the land-based activities but poor for the livestock activities. The model’s performance on the dataset of the hills was much poorer, indicating that the model was context-specific. When variables for family motivations were included the model’s accuracy at simulating the number of farmers likely to be practising a component improved slightly. The simulated number of farmers cropping rice was highly sensitive to the importance farmers attached to cropping a rice field for food security. The model’s sensitivity to the motivational variables determining diversification and integration was of the same magnitude as its sensitivity to market prices and farmers’ know-how of the activities, but less than its sensitivity to labour, capital and land endowment.
Key words: Hierarchical fuzzy models, diversification, households, farming systems, Vietnam.

87
5. Using fuzzy logic modelling to simulate Mekong Delta farmers’ decision-making on diversification and integration
5.1. Introduction Farming systems range from specialised to mixed systems, with input intensity varying from high to low. Farmers in the industrialised countries especially are likely to specialise, yet several studies have shown that mixed crop–livestock and livestock–fish–crop systems have more potential to maintain eco-systems’ functions [72], to absorb shocks to the natural and economic environment [95], and to improve livelihood options [19].
To support the decision-making (DM) of policy-makers for the sustainable development of agriculture, researchers develop multiple-attribute goal-oriented computer models. Most computer models simulating agricultural development are solely based upon the paradigm of utility maximisation [9], but more recent approaches in rural development view farmers as the major actors in shaping the development trajectory [92]. It has been argued that in order to include motivations other than farmers’ utility maximisation, a good alternative to the multiple-attribute utility theory is to use fuzzy multiple-attribute decision-making models [56]. Fuzzy set theory [169] allows computing with words and can provide a more powerful tool for modelling complex human reasoning than classical models [158]. Fuzzy logic decision-making has become popular in technical systems, e.g. machine control, and an increasing number of applications are reported in ecological modelling and agricultural decision-making settings [13]. In a recent study, data-mining was used fairly successfully to simulate the crop choices of about 300 farmers in Thailand in two seasons [50]. However even that model failed to integrate the social dimensions successfully [49]. In our study we therefore set out to include farmers’ social drives and motives for integrated agriculture–aquaculture farming systems (IAASs) in a simulation model using fuzzy logic.
Although specialisation is the global trend in agriculture, in the last 30 years IAASs have emerged in Vietnam [94, 128]. In the Mekong Delta (MD) in particular, the adoption of technologies that have allowed two – and more recently three – rice crops per year has improved household’s food security and gradually made land available for farmers to invest in other activities, especially when the market price of rice is low [19]. Some of these activities have been closely integrated for reasons of synergy or lack of space, and mixed systems have emerged: fruit–fish, rice–fish, pigs–fish [128, 142]. As increased diversification in Vietnam is a relatively recent phenomenon, farmers’ motives and drives can still be collected by asking farmers to recount the evolution of their practises [19].

Chapter 5 _______________________________________________________
88
In previous papers we analysed empirically the contextual drives and social motives for the on-farm diversification in the MD [19, 20], and described in detail the methodological approach used to develop a fuzzy logic simulation model of the MD farmers’ DM process [15]. That work confirmed that fuzzy logic models (FLM) can generate a range of solutions by using a set of non-overlapping output functions [147]. Using a hierarchical fuzzy systems (HFS) we explored the possibility of using FLM for the simulation of the number of farmers’ practising a particular fish production system [20]. In this two-layer HFS, the input in terms of individual farmers’ know-how and motivation was limited, as was the fuzzy character of the reasoning because the main factors were represented by variables calculated in a spreadsheet instead of by fuzzy inference systems (FIS).
In the present chapter the main objectives are to test whether including farmers’ family motivations in a model simulating their DM process, affects the result of the simulation, and to assess the factors favouring on-farm diversification and integration. After briefly presenting our methodology, we will describe and discuss the results of a FLM simulating the composition of mixed farms in the Mekong Delta.
5.2. Methodology We used a 10-step procedure to develop the FLM: (1) analysis of the decision-making problem, (2) selection of relevant output and input variables, (3) definition of the model’s structure, (4) determination of the linguistic terms associated with each variable, (5) determination of the membership functions (MFs), and (6) determination of the fuzzy if–then rule base, (7) data collection and composition of the database, (8) model implementation and control, (9) calibration and fine-tuning, (10) validation and testing of the computerised model [15]. Below we merely summarise steps 4 to 6 and 8 in the section ‘the fuzzy inference system’, and we give details of steps 1, 7, 9 and 10. Methodological aspects of steps 2 and 3 will be mentioned in the next section ‘Problem analysis and data collection‘, while details will be handled in the ‘Results’ section.
5.2.1. Problem analysis and data collection The problem analysis consisted of four phases: literature study; conversations with domain experts in order to become familiar with IAAS in the MD; a field study to assess farmers’ motivations for diversification and integration; and a data analysis. Our objective was to assess farmers’ motives and drives to practise particular activity and to integrate it into their family farm (as noted in the Introduction above). Therefore, to collect data in the field, we referred to methods of socio-

_____________________________________________ Motives for integration
89
technical analysis of rural livelihoods [71, 112]. We collected data in two distinct areas of the MD: the delta proper (the fresh water floodplain) and the hills (hills and uplands zone). In both areas, integrated farming systems are practised but the agro-ecological conditions are different [164]. In 2004 we conducted semi-open interviews in three hamlets in the delta and three in the hills. In each hamlet, 24 farmers were selected from available lists of farming households, using stratified random sampling based on wealth rankings of poor, intermediate and well-off households [34].
To establish trust, we started each semi-open interview by accompanying the farmer on a walk through the homestead and its neighbouring fields. After this, we mapped the farm together with the farmer, recorded its physical resources (e.g. location of fields, distances, areas, products, number of harvests per year, duration and depth of flooding) and collected data on the family composition, the present farming components and the components’ internal and external relations in a resource flow diagram (see [110] for an example). The open part of the interview followed: it dealt with past changes in farm composition, the motives, or conditions under which farmers implement a change or innovation, and – if applicable –, the farmer’s motives for not applying other components. Subsequently, data were elicited on the distance to the input and output markets, and the net income generated from each component over the past year. After a test of the interview procedures we decided to collect financial data for 10 farm household activities: irrigated field, orchard, upland, aquaculture, pigs, chickens, ducks, goats, large ruminants (buffalo, cattle), and off-farm labour.
All data were recorded on maps and in MS-Excel® spreadsheets in the form of quantitative data and qualitative information (brief farm history and decision rules for the changes). To assess the variables relevant for the decision-making we used the capital assets framework of rural livelihoods [31] and performed correlation analyses on the data [19]. After assessing the output and input variables we designed a three-layer HFS to mimic the farmers’ reasoning.
5.2.2. The fuzzy inference system We applied the Mamdani inference, using the minimum–maximum operators for computing the degree of membership of the rule antecedents, the degree of fulfilment of the rules, and the combined rule output. The fuzzy outputs of the FISs in the first and second layers were fed directly into the FISs of the second and third layers of the hierarchical tree, respectively. The number of linguistic values for the inputs of the second and third layer was not related to those of the previous layer but determined by the need to prevent domination by one of the other inputs [15].

Chapter 5 _______________________________________________________
90
To mimic the multiple outcomes, i.e. one farmer practising several components, the output was represented by a discrete set of possible alternatives and by repeated rules having the same antecedents but different consequences. The fuzzy output of the third layer could have a value between 0 and 1; a farmer was assumed to have a particular farm component if the membership for that output was larger than 0.5 [18]. We also calculated the centre of gravity of the output of every FIS and used these as indicators during calibration. We implemented the model in Matlab®7 using the Fuzzy Logic toolbox [99].
5.2.3. Database composition We pre-processed data for some variables in the original spreadsheet and subsequently transferred all data for the operational variables to another spreadsheet. If a plot of upland or a ditch–dike based orchard bordered on the homestead both were considered part of the homestead. Land that flooded seasonally was classified as irrigated; flood level and duration were collected individually.
The availability of household labour was derived from the weighted number of family members living on-farm in the following age categories: adult - 0.25 × non-working + 0.5 × youngster + 0.75 × elder; because the effort that people can deliver varies according to age and a non-working person (e.g. baby) reduces the availability of the adults. Children contributing to farm activities were classified as youngsters; grandparents still working on the farm were classified as elders. Grandparents and children not participating in work were classified as non-working.
We used the three categories of well-being as indicators for capital endowment and also for income, because they correlated significantly with the farm income [19]. Land with a “red certificate” (which attributes owner rights) had a collateral value that was double that of land with a green certificate (which attributes user rights and confers obligations) [ibid.].
The selection of variables and the model’s structuring revealed that after the first round of interviews, data for seven variables were lacking. During a second round of interviews in 2005, we collected data on two of theses variables by asking the farmers to rate their preference for having their own rice-field for food security and their know-how on the various farming activities, on a Likert scale of 1 to 5 [98]. The other five variables (soil quality, water availability, index for integration, stage in household life-course and risk behaviour) were derived from the dataset collected during the first interviews. The soils were classified into 10 categories [20]. Nine sources of water were ranked in order of diminishing availability: river, primary and secondary canal, natural source, seasonal river, rainwater reservoir,

_____________________________________________ Motives for integration
91
permanent well, deep well or bore-hole, and shallow well. To represent the farmers’ tendency to integrate several farm components, we derived an index for the integration of farm components from the bio-resource flow diagram. From the available data on the household’s marital status and its age composition we determined the stage of each household’s life-course [19]. Using the data recorded on the source of credit and the activity it was used for, we classified each household’s risk-taking behaviour, using six categories: none, relatives’ loan, bank loan, input providers, private money lenders or high risk credit.
Table 5.1. Product’ prices** applied (x1000VND, per kg or head for livestock (except pigs).Model run Rice Crops Fruit Fish Veg Duck Hen Egg Pig Piglet Lrum Goat
1995 1.05 0.26 1.3 7.8 2.6 9.2 13.1 0.65 10450 260 650 701997 1.34 0.45 2.2 8.9 4.5 11.2 16.8 0.78 16810 450 1120 1101999 1.46 0.73 3.1 8.4 6.3 13.6 18.8 0.94 9400 840 1570 1602003* 2.10 1.0 4.0 8.0 6.0 15.0 18.0 0.80 10000 800 2000 200Crop= crop other than rice; Veg= vegetables; Lrum = Large ruminants (cattle, buffalo). * Year of calibration and validation. ** The prices for 1995, 1997 and 1999 were transformed into real values for 2003 by
correcting for inflation. Annual inflation in Vietnam was close to 3% in 2003, 0.8% in 2002, -1.7% in 2000, 4 % in 1999 and 1998, and estimated at 4% from 1995 to 1997.
In the FISs of product’s opportunity (see 5.3.1 paragraph 2), the distance we
implemented between the farm and the input or output market was the same for all products, though in reality this distance differed for some products. The opportunities to raise pigs, ducks and chickens were related to two types of product and the know-how and prices were represented by both specialisations: fattening and reproduction (offspring or egg). A high price for eggs was always a positive incentive for raising ducks or chickens. A high price for piglets was positive if the farmer’s know-how on breeding was good, but negative if the farmer had little know-how and piglets were an input he had to buy. For pigs we therefore used the market price of piglets to represent the cost of input. Pigs were an exception, for none of the other activities we applied the cost of an input. The market prices applied were equal for all farmers: the average of the farm gate prices for the various product categories (Table 5.1). The past prices collected during the open interviews were adjusted to real values, using the inflation rates acquired from the Faculty of Economics of Can Tho University.
In the available dataset, the financial outputs for goats and large ruminants were pooled due to their low frequency; the model included separate estimates of

Chapter 5 _______________________________________________________
92
both for future use. The garden component was included because of its growing interest among Vietnamese farmers and also to enable the model to be used on other datasets. However, the estimates of the number of farmers with a vegetable garden could neither be calibrated nor validated, because the benefits of these gardens had been included in those of the irrigated land and thus in the delta had become incorporated in the category “rice-field”, for this reason we have not included these results in this paper. In the delta proper the vegetables grown for cash were indeed cropped on the irrigated lowland as a third crop, after two crops of rice in the same year, while in the hills, the vegetables were grown if a good source of water was available.
5.2.4. Calibration and fine-tuning For calibration, i.e. achieve optimal fit between model result and real world situation, we used a training dataset. Fine-tuning is the calibration for individual cases and aims at maximising fit. The training dataset of 48 cases was randomly sampled from the delta dataset of 72 farmers; sampling was weighted for the frequency distributions for the rank of well-being.
To guide manual calibration we used face validation: i.e., we compared the model’s output with the number of farmers practising the component in reality [148]. To take account of the farming systems’ traditional economic feature, we used two thresholds for face-validation: the lower threshold was the number of farmers earning cash income from a component and the upper threshold was the total number of farmers practising that component. The difference between the thresholds are the households that consume all the produce of the component themselves or that did not sell a ruminant during the period in question. Whenever a result fell between the two thresholds, without appreciably affecting the fit of other outputs, we deemed the output to be as a realistic fit.
For the first calibration and the subsequent fine-tuning we used product prices from 2003 (Table 5.1). To guide the optimisation of fit we observed the model’s sensitivity by consecutively running the model for a range of values for the prices of each product and for the other variables [4]. For each of the output variables a graph was composed for the averages of the centres of gravity and of the number of practising farmers for each activity. We optimised face validity by shifting the MF’s parameters, adjusting the rules if shifting the parameters did not lead to a desired result, and if needed by adjusting the number of linguistic values, to obtain sensitivity and to make the model’s implementation perform according to rational expectations. Output variables for which the simulated number of practising farmers did not fall between the two thresholds after calibration were individually fine-tuned using the training dataset.

_____________________________________________ Motives for integration
93
5.2.5. Validation and testing Validation is the process of determining that the model developed through training performs equivalently when applying it on a comparable database. Testing refers to an operational validation of the model in real world situations or in repeated experiments [152]. To validate the model we ran it on the remaining 24 cases of the delta dataset. We tested it on two datasets: the delta dataset with prices for previous years and the hill dataset. In principle the model should not be adjusted after the first validation on the comparable dataset; however, due to the small size of the datasets, the non-availability of other data, and the skewed representation of some of the activities in the training and validation data we felt it necessary to make some adjustments before testing the model. For years other than 2003 the farm history only revealed the total number of farmers practising a component, and only one threshold (all-practising) was used for performance verification.
To verify our hypotheses the model was run for a range of values of the variables most related to the thesis’s objective, i.e. inclusion of the farmers' social reference frames (FRFs). To test the influence of their inclusion the model was also run without implementing FRFs for innovation and integration in the third layer of the HFS.
The performance of the model was checked for face validity and quantified by calculating individual classification rates (ICRs) and overall error. The ICR of the positives is the quotient of the correctly classified number of farmers practising a specific activity on the number of farmers’ actually practising this activity : (={npositives-type I error}/npositives). The ICR of the negatives is this quotient for non-practising (={nnegatives-type II error}/nnegatives). The model’s performance is best evaluated by the performance rate (Chapter 4, table 4.6), which is calculated as the square root of the product of the ICRs: √[({npositives-type I errors}/ npositives) * ({nnegatives-type II errors}/ nnegatives)].
After eliminating the non-firing rules, we quantified the model’s sensitivity using the sum of the first derivatives. We ran the model on the pooled dataset for all decimal values of the various variables, calculated the centres of gravity, the components practised by each farmer, and the average number of components each individual farmer was estimated to practise. We used the pooled dataset of delta and the dataset of the hills because other data were not available; a more accurate procedure would be to use another comparable dataset. The series of results for each variable was transposed to an MS-Excel® spreadsheet [45] to calculate the first derivatives ( ∂ ) for the average number of components a farmer practises (∂NC). The first derivatives were averaged (∑∂NC/n) and presented as a percentage indicating the relative sensitivity of the output to a specific input variable.

Chapter 5 _______________________________________________________
94
5.3. Results The open-ended interviews on the changes in farm composition revealed that farmers practise one or more of the 10 activities if they need to for food security, if they have the required land, water source, capital, and labour at their disposal, if they have the know-how, and/or if they consider the marketability of the product promising. Most of these features are determined by several variables, e.g. the availability of capital depends on the area of land, the other assets and the risk-taking behaviour. If both the factors and the opportunity for a product are favourable the farmer may decide to practise only one, or several components depending on his personal context, his vision on the relationship between the components, and on his motives. For each of these decision factors several explanatory variables were identified (Chapter 4, Table 4.2). As a result, the farmers’ DM is represented by a three-layer hierarchical tree with five subsets: the primary production factors, the product opportunities, the product options, the FRFs and the final output layer (Figure 5.1, for details see Figure 4.2).
Figure 5.1. The simplified structure of the hierarchical fuzzy system used to model the
farmers’ decision-making on farm composition.

_____________________________________________ Motives for integration
95
5.3.1. The hierarchical decision-tree The farmers frequently mentioned two motives for change or innovation: improving income and diversifying the diet, both mainly for the well-being of their children. Therefore we used the number of young children as an operational variable. Older farmers with no successors change the farming system to reduce the labour requirement. In the model these driving forces were inferred in the farmer reference frame (FRF) for diversification that comprised three operational variables: the number of young children in the household, the age of the household head, and the stage in the household life-course [19]. The FRF for the integration of farm components related to six variables: the distance between the fields and the homestead, the area of the homestead, the farmers’ level of education, and the index for integration calculated from the number of flows between the farm components [ibid.]. The FRFs were inferred in the first layer but implemented in the third layer of the HFS (Figure 5.1). In the first layer, the variables related to the production factors and the products’ opportunities were inferred and in an intermediate layer each product’s opportunity was related to all of the production factors in a FIS to establish whether or not the farmer has the option to practise the component in question.
The economic drives for innovation were assessed through the individual product opportunities. Farmers’ opinions confirmed the results reported in the literature [121], that four variables influence the economic opportunity to practise a component: distance between the farm and the market, cost of inputs and market price of the produce, and the farmer’s know-how on the component. It will be recalled that with the exception of piglets, we did not apply the cost of an input. We applied the prices per kg of product and are aware that the latter prices do not reflect the net margin of the component. Our justification for using this approach is that for crops grown and livestock raised, the farmers are aware of the price level that resulted in break-even or a profit, or caused financial losses.
The availability of labour related to two variables: the household labour and the capacity to hire labour which was determined by the level of income. The availability of capital did indeed depend on the collateral value of the land owned, the rank of risk-taking behaviour, and the level of income. In the data base the level of income was represented by the rank of well-being.
The farmers’ preference for having their own rice-field for food security affected their decisions about land-uses other than rice. Most Vietnamese farmers farm scattered plots, each with its own characteristics relating to e.g. soil quality, water availability, and thus supporting different types of activities; we took this variation into account by using three categories of land: homestead, upland, and irrigated land. The FIS of the homestead contained four input variables: its area, its

Chapter 5 _______________________________________________________
96
soil quality, the duration of the rainy season(s) and the amount of rainfall. In addition to the variables applied for the homestead, the FIS for the upland contained the distance from the plot to the homestead. The FIS of the irrigated land also had five variables, as was the case for the upland FIS, but the two factors related to the rainfall were replaced by the duration of the flooding and the flood depth, both of which restrict the period the land can be used. The water availability related to five variables: the duration of both rainy season and flooding, the amount of rain and the depth of flooding, and the source of the water.
Figure 5.2. Example of the result of a sensitivity analysis of changes in the rank of well-being on the number of farmers practising an activity. The effect on raising cattle and goats was also strong but is not included in the graph.
5.3.2. Face validation As a result of the interrelationships between the activities in the rule base of the third layer, the adjustment of parameters and rules for some of the products had consequences on the fit of one or more other products, making manual calibration and fine-tuning a recursive procedure. To obtain face validity, calibration started by adjusting the MFs parameters so that the model would perform according to the expected reactions on the various factors, prices, ratings and rankings. Sensitivity analysis revealed that changes in price levels and other parameters produced unrealistic outputs in the conceptual model. Antagonistic reactions might be acceptable if induced by the rule base, for example the decreasing number of farmers keeping duck for higher levels of well-being was balanced by a shift to more farmers raising chickens (Figure 5.2). In other cases, however, the rule base and the number of linguistic values of the variables had to be adjusted in order to make the model perform according to expectations. Upon face validation, fine-tuning was needed to obtain realistic outputs for rice fields, orchards, fishponds, pigs and – especially – ruminants.
0 0.5 1 1.5 2 2.5 3
20
40
60
Rank of well-being
Num
ber o
f far
mer
s Pig
Duck
Chicken
Orchard
Fishponds

_____________________________________________ Motives for integration
97
To obtain gradual sensitivity to changes in an input value, the universe of
discourse of most of the input and output variables had to be partitioned using more than two linguistic values. Using two linguistic values for the first layer input, mostly resulted in a shift at only one point (Chapter 4, Figure 4.3). The need to define rules with distinguishable consequences for each of the input variables determined how many linguistic values were created for the output variables (Chapter 4, Table 4.2 and 4.3). If there were too few linguistic values for the consequence, the impact of a particular input variable could be dominated by other input variables, resulting in contradictory trends for the first variable. In any case, increasing the number of values for the input improved the sensitivity of the model output. Table 5.2. The ICRs (in %) of the positives, for the model after adjusted calibration for
rice fields on the training dataset and calibration and fine-tuning for ruminants on the validation dataset.
Dataset Rice Fruit Fish Pigs Ducks Chickens RuminantsTraining Cash 92 84 85 76 56 69 0 All practising 92 81 77 71 63 71 0 Validation Cash 95 90 91 62 50 58 50 All practising 90 87 83 50 39 61 50
5.3.2. Validation and performance assessment On average, the ICRs of the positives of the training dataset reached values above 90% for growing rice, but for the non-ruminant livestock components it was close to 70%. After fine-tuning with the training data, one out of the two farmers raising ruminants could be captured. The first validation on the small separate dataset showed the numbers for rice and ruminants were too low, as were the ICRs. For the case of rice this was solved by readjusting the parameters. The small validation dataset contained twice as many farmers raising ruminants; therefore the output for ruminants was fine-tuned using this dataset. The model’s performance after the adjustments, are presented in Table 5.2. The type I errors for rice were similar in the training and validation (90%), but in the training set they were higher for pigs, ducks and chickens, while in the validation set they were higher for fruit, fish, and ruminants (Table 5.2).

Chapter 5 _______________________________________________________
98
For the pooled training and validation datasets, the number of farmers raising ruminants was slightly overestimated (Figure 5.3). The model’s estimate of the number of farmers practising the other components was intermediate in the range of farmers engaged in the activity also for cash and of all practising farmers. With the exception of the estimates generated for farmers raising fish and chickens, the simulated numbers were close to the number of farmers practising the component to generate cash income.
0
25
50
75
Rice Fruit Fish Pigs Ducks Chickens Ruminants
farm
ers (
n) Actual-cashActual-allSimulated
Figure 5.3. The simulated number of farmers engaging in a given activity (Simulated)
versus the actual numbers of all farmers engaging in the activity (Real-all) and those generating cash income (Real-cash), for the 72 farmers in the delta.
Except for ducks and ruminants, the ICRs of the negatives were lower than
the ICRs of the positives: i.e. error type II was larger than error type I on the pooled delta dataset (Table 5.3). Both ducks and ruminants were less frequently raised to generate cash (Figure 5.3). The overall classification, i.e., the identification of the individual farmers engaged in (or not engaged in) a specific activity, were on average above 80% for the land-based activities (rice, fruits and fish) and close to 70% for the livestock activities. The ICRs of the positives were about the same for the land-based activities and the livestock activities, except for ruminants. The performance rate of model fit was good for rice (0.75), satisfactory for fruits and fish (close to 0.6), unsatisfactory for ducks and pigs (just below 0.5), and poor for chickens and ruminants (below 0.4). Table 5.3.
The ICRs of positive and negative, the overall classification (%) and the performance rate for the aggregated delta dataset (all practising farmers).
Rice Fruit Fish Pigs Ducks Chickens RuminantsICR of positives 0.92 0.83 0.79 0.64 0.53 0.68 0.33 ICR of negatives 0.67 0.50 0.60 0.47 0.89 0.23 0.92 Overall classification 88 81 78 60 67 60 88 Performance rate 0.75 0.59 0.61 0.44 0.50 0.33 0.32

_____________________________________________ Motives for integration
99
Figu
re 5
.4. C
ompa
rison
of t
rend
s in
the
% o
f far
mer
s pra
ctisi
ng th
e co
mpo
nent
act
ually
[16]
, and
the
sim
ulat
ed %
for t
he p
rice
levels
in fo
ur sp
ecifi
c ye
ars (
Chick
= c
hick
ens;
Rum
i = c
attle
and
goa
ts).
020406080100
Rice
actu
alRi
cesim
uFr
uit
actu
alFr
uit
simu
Fish
actu
alFi
shsim
uPi
gac
tual
Pig
simu
Duc
kac
tual
Duc
ksim
uCh
ick
actu
alCh
ick
simu
Rum
iac
tual
Rum
isim
u
%19
9519
9719
9920
03

Chapter 5 _______________________________________________________
100
5.3.3. Testing An operational validation for various price levels showed an overestimation of
the positive trend for the number of farmers raising ruminants and chickens, and slight underestimations of the number of farmers having a fruit orchard, and raising fish and ducks (Figure 5.4). The stagnating number of farmers cropping rice and fruits was not well simulated: the model showed lower numbers of farmers cropping rice and fruit in the past while in reality these stayed stable.
The simulated number of farmers fattening fish and raising chickens was lower and the recent rising trend was not represented. In reality, the number of farmers raising pigs also increased, yet the simulation showed a decreasing trend. According to the simulation, the number of farmers keeping ducks fluctuated, while in reality a steady increase was observed.
Table 5.4. The real and simulated numbers of all practising farmers, the ICRs of the positives and overall performance rate for the model application to hill dataset.
Rice Fruit Fish Pigs Ducks Chickens RuminantsNumbers Actual all 34 56 18 20 14 60 34 Simulated 42 59 45 34 6 55 16 ICR positives 0.58 0.83 0.61 0.49 0.07 0.75 0.17 Performance rate 0.38 0.48 0.27 0.37 0.06 0.29 0.13
The operational validation on the available test set, i.e. the hill farms dataset,
showed underestimates of the number of farmers raising ducks and ruminants, but slight overestimates for those having orchards, and large overestimates for cropping rice, and raising fish and pigs (Table 5.4). The ICR of the positives was poor for ducks, ruminants, and pigs and satisfactory to good for rice, fish, chickens and fruits. The performance rate was low for all activities.
5.3.4. Index of rice field for food security The sensitivity to the rating of the importance of having one’s own rice field for food security was strong ( 47%), and comparable to the sensitivity to price and know-how for cattle (Table 5.8), but limited to a specific range of the index. The average rating of this index (rated by the farmers themselves from 1 to 5) was 4.3 for the delta and 3.9 for the hills. For an index below 3 the simulated number of farmers having rice fields was around 25, and this number more than doubled if the index was above 3.5 (Figure 5.5). A high index reduced the number of farmers having fruit orchards, raising pigs, ducks or chickens only slightly.
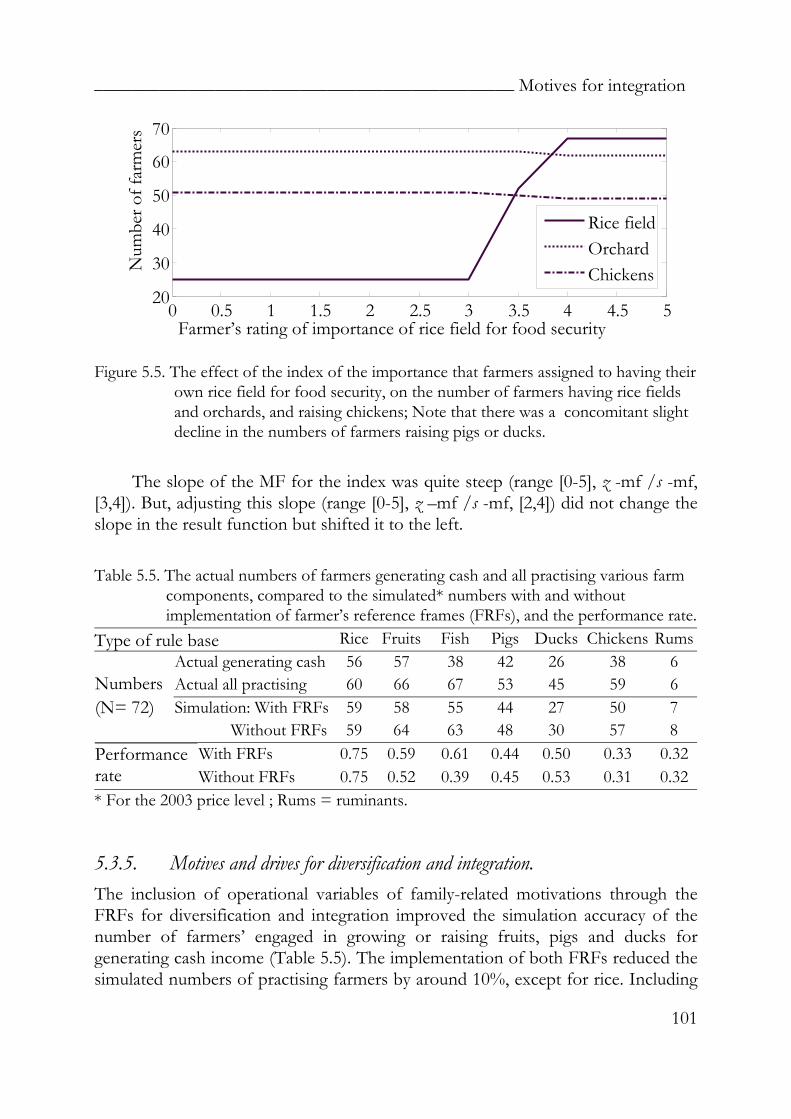
_____________________________________________ Motives for integration
101
Figure 5.5. The effect of the index of the importance that farmers assigned to having their own rice field for food security, on the number of farmers having rice fields and orchards, and raising chickens; Note that there was a concomitant slight decline in the numbers of farmers raising pigs or ducks.
The slope of the MF for the index was quite steep (range [0-5], z -mf /s -mf,
[3,4]). But, adjusting this slope (range [0-5], z –mf /s -mf, [2,4]) did not change the slope in the result function but shifted it to the left. Table 5.5. The actual numbers of farmers generating cash and all practising various farm
components, compared to the simulated* numbers with and without implementation of farmer’s reference frames (FRFs), and the performance rate.
Type of rule base Rice Fruits Fish Pigs Ducks Chickens RumsActual generating cash 56 57 38 42 26 38 6 Actual all practising 60 66 67 53 45 59 6 Simulation: With FRFs 59 58 55 44 27 50 7
Numbers (N= 72)
Without FRFs 59 64 63 48 30 57 8 With FRFs 0.75 0.59 0.61 0.44 0.50 0.33 0.32Performance
rate Without FRFs 0.75 0.52 0.39 0.45 0.53 0.31 0.32* For the 2003 price level ; Rums = ruminants.
5.3.5. Motives and drives for diversification and integration. The inclusion of operational variables of family-related motivations through the FRFs for diversification and integration improved the simulation accuracy of the number of farmers’ engaged in growing or raising fruits, pigs and ducks for generating cash income (Table 5.5). The implementation of both FRFs reduced the simulated numbers of practising farmers by around 10%, except for rice. Including
0 0.5 1 1.5 2 2.5 3 3.5 4 4.5 520
30
40
50
60
70
Farmer’s rating of importance of rice field for food security
Num
ber o
f far
mer
s
Rice fieldOrchard Chickens

Chapter 5 _______________________________________________________
102
the FRFs improved the overall performance rate for fruit and fish in particular; the performance for rice, pigs, chickens and ruminants was hardly affected. Table 5.6. The sensitivity of the number of components practised to the three variables
in the FRF diversification and to the variables household (hh) labour and rank of well-being, expressed as the relative change (%), and the range of the variables.
Age head of household (hh)
Phase in the hh life-course
Number of children in hh
hh labour
Rank of well-being
% -0.6 8.9 18.4 49.3 66.0 Range 25 – 75 1-5 0-5 1-7.5 1-3
The model’s sensitivity to the three operational variables of family motivations
from the FRF for diversification – number of child and young, phase in the life-course, and age of household head – was small compared to the sensitivity to the availability of household labour (Table 5.6). The availability of household labour is strongly related to the first two variables mentioned. The sensitivity to the attitude to risk-taking was 7%; which was higher than sensitivity to the age of the household head, but intermediate to the sensitivity to the household life-course and the level of education (Table 5.7). Note that the sensitivity of the number of components practised by a farmer to the rank of well-being was more important than the total sensitivity to the availability of family labour and to the total sensitivity of the three operational variables of family motivations from the FRF for diversification. Table 5.7. The sensitivity of the number of components practised to the five variables
determining the FRF of integration, expressed as the relative change (%), and the range of the variables.
Area (ha) homestead
Area (ha) lowland
Distance lowland homestead
Index of integration
Level of education
% 57.4 0.8 -2.0 11.4 5.8 Range 0-3 0-3 0-5 1-5 1-5
As for the variables determining the FRF for integration, the sensitivity to the index of integration was double that of the level of education, while the sensitivities to area of lowland and distance between lowland and homestead were close to zero or slightly negative, respectively (Table 5.7). However, the impact of those variables was dominated by the sensitivity to the area of the homestead. This sensitivity could be direct or indirect because this variable was also implemented in a FIS for land.

_____________________________________________ Motives for integration
103
0 1 2 3 4 50
20
40
60
80
Rank of know-how
num
ber o
f far
mer
s
Rice fieldCattleFishpondDuck eggGoat
Farmer’s rating of their own know-how
Table 5.8. The sensitivity of the model, expressed as relative change in the number of farm components practised (%) to the market prices of the products resulting from the various activities and to the ratings of know-how.
Activity Product price
Know- how Activity Product
price Know-
how Pigs (fattening) 23 17 Rice 28 9.7 Piglets (breeding) 10 8.3 Fruits 0.4 0 Ducks 30 0 Fish 0.8 32 Chickens 1 0 Cattle 19 53 Duck eggs 31 Goat 23 16 Chicken eggs 23 1.4
The sensitivity to the market prices was high for some of the individual
activities (ducks, rice, pigs, goats, cattle), but very low for fruit, fish, chickens and chicken eggs (Table 5.8). The sensitivity of the number of components practised to the farmers’ rating of know-how on fruits, ducks, broilers, and laying hens was very low. The sensitivity of the predicted number of components to farmer’s know-how on raising ruminants, keeping ducks for eggs, and fattening pigs and fish was higher compared to the sensitivity of the predicted number of components to the farmer’s know-how on rice (Figure 5.6). Mostly, the effect on the individual activity was reflected in the total number of components that each farmer practised. However, the sensitivity to the rating of know-how of the centre of gravity for fruit was higher (19%) than for e.g. pigs (17%), but this rating of know-how did not affect the number of farmers having a fruit orchard, nor the number of components practised. Figure 5.6. The effect of their
rating of know-how on the number of farmers practising one of the mentioned components.

Chapter 5 _______________________________________________________
104
5.4. Discussion and conclusions Our results have demonstrated that fuzzy logic allows more individual motives of farmers to be taken into account than just utility maximisation, though the effect of the inclusion was still dominated by the classical production factors. Such an inclusion might also extend the learning by stakeholders, policy makers and experts when associated with model development [42, 69, 115]. Based on the results of the sensitivity analysis, we identified the main factors affecting farmer’s DM. Below we discuss the results, in particular referring to the variables selected and to the sensitivity analysis, and the improvements to consider.
5.4.1. Variables and sensitivity The most decisive for the model output were the classical production factors: labour, capital and land endowment. However, the model’s sensitivity to the operational variables for farmers’ family motivations, and to farmers’ ratings of know-how on the components, was of the same magnitude as the sensitivity to the product’s market price. This implies that the reliability of models simulating farmers’ DM can be improved by considering not only utility maximisation but also farmer’s individual know-how and operational variables of his family-related motivations.
The traditional economic characteristic of farmers practising a component either exclusively for home consumption or for both this and cash income had two consequences. First, the simulation of the effect of market prices was weak; i.e. in reality, farmers may continue practising an activity notwithstanding a low market price. The latter is reflected in several aspects of the validation with historical prices: e.g. the model simulated lower numbers of farmers cropping rice and fruit in the past, while in reality these stayed stable. The number of farmers practising a component for cash was probably not as constant as the number of all practising farmers shown in Figure 5.4. Since 1995, overall half of the farmers have intensified or increased their existing activities: in the delta, 26 % of the farmers have expanded the area of fruit trees and 18 % the area of fish ponds, 8% have increased the number of pigs and 11% are raising more chickens [22]. Such expansions were mainly due to the farmers’ intention to earn (more) cash from a component. Secondly, it remains a challenge to simulate whether a farmer with a small diversified farm will use e.g. his fruit-trees, fish, chickens or ducks to generate cash income or merely for home-consumption.
_____________________________________________ Motives for integration
105
Avian influenza also caused the non-simulated increase in fish farming and poultry keeping and the decrease in egg prices. Contrary to expectations, the avian influenza epidemic of 2003 was not reflected in a reduction of the numbers of farmers raising chickens. Instead, farmers in the delta reacted by investing in fish, pigs and some even in poultry, hoping for an exceptional increase of prices and benefits [119].
The poor performance of the model in predicting farmers raising ruminants, chickens, ducks, or pigs may be due to the rule base not including all the farmers’ motivations to keep these animals. For example, chickens and ducks are important for home consumption especially when receiving guests, for offering to friends and at ceremonies [69], while pigs are important for recycling on-farm waste and produce valuable manure. In general, the institutional context, e.g. the availability of training and extension, was not represented in the model we proposed, though it was implicitly included in the individual farmer’s know-how.
5.4.2. Improvements to consider The index of integration used in the FRF for integration was derived from the actual bio-resource flows on the farms. This might have greatly influenced the results, but the effect of implementing the FRF was low and the effect of this index was dominated by the size of the homestead. New versions of the model should be refined by replacing this index with a rating by individual farmers. The attitude to risk-taking should also be rated by farmers themselves, in stead of extracted from secondary data. In future versions of the model, actual distances to various product markets should be implemented.
According to the MD farmers, the most crucial contextual variable for agriculture after natural disasters and credit availability is the market price of the products [121]. It was for this reason that the first step of the sensitivity analysis focussed on the product prices; however, a control of the effect of all factors was needed to make the model perform according to modellers’ expectations. The number of farmers keeping ducks was mostly underestimated except for 1999 (Figure 5.4) when the price of eggs was high (Table 5.1). We did not do a separate sensitivity analysis for the price of eggs. Had we done so the underestimation of the number of farmers keeping ducks might have been prevented; this confirms the necessity of doing a sensitivity analysis for all factors included, before deciding on the model’s fidelity and before starting operational validation [152].
In the model, the farmers’ opinions on the profitability of market prices for the product was implemented, not a cost factor (except for piglets). Although the farmers’ awareness of the break-even price in a particular year with a particular technology and a set of input and output prices remains valid, the use of only the

Chapter 5 _______________________________________________________
106
product price is a weakness of the model. The inclusion of the price for piglets demonstrated the feasibility of applying input prices and prevented the model from predicting that all farmers would stop raising pigs at the price level of 1995, or from predicting that most farmers would raise pigs in the future. The fall in the number of farmers raising pigs due to the low price around 1999 was overestimated, while the increase of 2003 was underestimated. The higher actual increase in 2003 was an effect of expectations that prices for pig would improve due to the avian influenza. The decrease in pig keeping that was actually observed after 2003, was due to an increase in the price of the main input: rice-bran (an effect of the so-called pig cycle). This is strong grounds for integrating the price of outputs and the cost of crucial inputs for all products in new versions of the model.
The overall classification rates for the land-based activities in the delta (between 78% and 88%) were comparable to those acquired from a linear simulation of land use in the Philippines and Malaysia – 65% to 85% [159] – but lower than those from a fuzzy logic model developed by data-mining in North Thailand – 86% to 96% [50]. Simulating the correct number of practising farmers for a particular context is simpler than improving the classification of individual farmers, especially for small numbers of practising farmers, as shown by the case of the ruminants. For the hill farms dataset a specific calibration would improve the model’s performance though for some activities the results will remain weak because certain aspects have not been included in the model: e.g. the aversion by some of the hill farmers – on religious grounds – to keeping pigs and to recycling manure in the fishpond [19]. This confirms that models of a decision-making process should be context-specific [102]. An option might be to compose a database of delta and hills cases together and to adjust the rule base after collecting data on personal attitude. Of such a database, 50% can be used for training, 25% for validation and the last 25% for testing [70]. However, this might prove insufficient as some people will not practise an activity out of respect for others or for fear of sabotage (a case of which was reported by one of the 18 farmers farming fish in the hills).
Moreover, the overall performance of the model was lower for the activities with few practising or non-practising farmers. For example, for the case of ruminants the output after fine-tuning on the training dataset contrasted with the output after fine-tuning on the smaller validation dataset but containing twice as many farmers raising ruminants (Chapter 4). The minimum sample size should take account of the frequency of the individual events within the problem area: the fewer the events, the larger the sample size must be.

_____________________________________________ Motives for integration
107
5.4.3. Conclusions Using farmer reference frames so as to include individual motives in a model of farmers’ decision-making slightly improved the simulation accuracy for the number of farmers that are likely to be practising a component. Whether or not a farmer diversifies his farm and integrates these components depends mainly on the availability of household labour, the farmer’s rank in terms of well-being, and the area of the homestead, in decreasing order. Variables such as, in decreasing order, the number of young children, index of integration, level of education, phase in the life-course, attitude to risk-taking, and age of household head have much less impact. The model’s sensitivity to variables determining the farmers’ reference frames and to farmers’ ratings of their know-how, was of the same magnitude as its sensitivity to the product’s market price. This suggests that models simulating farmers’ adoption of technology that do not include farmers’ motives and know-how might be less reliable than generally concluded.
The satisfactory classification rates of the land-based activities for the MD show that hierarchical fuzzy logic models can be a convenient method of simulating farmers’ DM, while using only farmers’ awareness of too low, breakeven and profitable product prices. Including the cost of crucial inputs might improve the model’s performance. The model’s poor performance for the livestock components indicates that individual motives for keeping the various species need to be better integrated into the model. The poor performance for the application on the hill farms dataset indicates that fuzzy logic models need to be context-specific if a high fidelity is required.

CHAPTER 6
GENERAL DISCUSSION
AND
CONCLUSIONS

109
6. General discussion and conclusions
Views on both the innovation process and the sustainability of farming are subject to a paradigm shift: rural development shifted towards more participatory approaches and science recognised the disadvantages of specialised systems. However, while development support services focus on farmers as main decision-maker, in common computer models farmers’ motives are solely represented by ‘utility maximisation’. Moreover, specialisation in agriculture stays the dominant trend, yet scientific reports state the advantages of integrated farming for sustainability [16, 72, 95]. For the above reasons this thesis focused on the modelling of farmers motives in their decision-making regarding mixed farming.
The most common computer models of natural resource management in relation to farming are based on linear programming (for an overview see [114] p21-37). In these linear models farmers’ motives are represented by ‘utility maximisation’, which does not converge with new approaches in rural development considering farmers as major actors [137]. Explorative models tend to aggregate technical data to the regional scale, neglecting decision-making at farm level, as this would introduce too much variation [e.g. 61]. The recently developed multiple agent systems are an exception, but these models focus on natural resource management on community level. Reconsidering the research questions, the goal of this thesis was to verify three hypotheses: (1) farmers’ motivations can be integrated into a simulation model, (2) fuzzy logic provides a suitable tool for modelling the decision-making process of farmers, and (3) fuzzy logic can improve our understanding of farmers’ decision-making towards integrated farming.
In this chapter we discuss the extent to which we may accept or reject these hypotheses and the possibilities to improve and use a fuzzy logic model of decision-making. The following sections will start with a summary, the first three sections discuss the conclusions regarding the hypotheses and next three sections elaborate upon possibilities to improve the proposed approach and model, and upon the utility to develop tools supporting decision-making in rural development. In the last section we give the general conclusions.
6.1. Modelling farmers’ motivations In the last 30 years, the context in the Mekong Delta (MD), Vietnam, offered farmers the opportunity to diversify their holdings. The inclusion in the fuzzy model of their motivations for raising livestock was incomplete, but the model’s sensitivity to the operational variables of farmers’ motives was higher than the sensitivity to product’s prices. The approach showed that family motivations can, and should be, included in frameworks simulating farmers’ decision-making.

Chapter 6 ____________________________________________________________
110
Using literature and data collected on-farm we analysed the households’ livelihoods and motives to change in two agro-ecological zones of the MD where farms integrating crop-livestock-fish can be found (Chapter 2). The average farm size varied between less than 1 ha and slightly more than 2 ha according to the zone. Such small areas are the result of manual land-clearing and cropping technologies, and of population growth. Traditionally, the family farms have a mixed character focussing on household autonomy and guaranteeing food security by cropping rice [90]. The available financial capital limited the number of components and most of the activities were hardly sufficient to guarantee households’ livelihood needs, except for seasonal excesses of products such as fish, fruits, rice or eggs.
The introduction of short cycle rice cropping technologies (started in 1970), the opening to the global market (1986), and the attribution of user certificates for the land (1992) offered farmers the opportunity to innovate. The most important motivation for the on-farm innovations was, and still is, the wish to improve family livelihood. In chapter 2 we concluded that the availability of labour and, subsequently, capital to engage in more market-oriented activities is related to the five phases of the nuclear families’ household life-course [19]. Young couples save money by developing off-farm or non-farm activities. When starting a family of their own they begin raising chickens, pigs or fish, and keep more livestock to employ available labour of older children. They invest the accumulated capital in land or the children’s education. Old couples, without children on-farm, engage in activities demanding less labour.
These dynamics in both context and household, the increase in the number of farm activities on a small land holding, the restricted availability of capital for external inputs, and the availability of on-farm wastes furthered the development of integrated farming systems. Integrated Aquaculture Agriculture Systems (IAASs) including fruit orchards and fish ponds, for example, are recent introductions [94], but the use of various wastes to feed pigs and poultry is an ancient practise. Having this reference frame the farmers tend to recycle on-farm household and farm wastes as much as possible considering the farm characteristics, the availability of household labour, and their know-how and motivation. Thus, in the proposed hierarchical model of several fuzzy inference systems, the individual motivations for diversification were materialised using three variables: age of household head, household life-course, and number of young children. The five operational variables for the tendency to integration were: farmers’ education, index of integration, distance homestead-lowland fields, distance homestead-upland fields, and area of the homestead, of which the last three were more physical. A constraint to diversification was that most households considered cropping rice themselves for food security important. The accuracy of the model slightly improved when these operational variables of individual farmers’ motives were included but their impact on the model’s result was limited. The model output

_________________________________________________ General discussion
111
was mainly determined by the classical production factors: land, labour and capital, but the sensitivity to most variables of farmers’ motives was higher than the sensitivity to product’s prices. The model’s performance for the land-based activities was satisfactory to good, but poor for the non-land-based livestock activities.
For humans, Reiss distinguished a total of 16 basic motivations [132]. In relation to agriculture the individual motives, values, goals or objectives were clustered by three authors [all three cited by 58]. From the three universal needs: biological ones, the need for social interaction and for survival/welfare, Schwartz [143] derived 10 values related to behaviour which he clustered in two bipolar dimensions: ‘openness to change’ versus ‘conservation’ and ‘self-enhancement’ versus ‘self-transcendence’. Gasson [59] recognised six dominant values associated with farming (security; money; status and prestige; working with people; service to others; using abilities and aptitudes; being creative and original), and clustered a total of 20 values in: instrumental, social, expressive and intrinsic goals. Among 135 goals, Chulef et al. [40] distinguished intrapersonal or individual, interpersonal general social, and interpersonal family-related social ones. The family-related goals (family, marriage, sex and romance) are missing from the other two lists while both romance and the desire to raise children are distinguishable basic motivations according to Reiss [132]. As marriage and raising children were also important in the decision-making of farmers in the MD (chapter 2), we included such motives in our model. Dutch and US farmers considered the non-economic (family-related) goals at least as important for their decision-making than the economic motives [14, 44]. Among farmers in New Zealand, family values were also important in distinguishing farm styles [54]. The reliability of frameworks that do not include family motivations to analyse farmers decision-making, such as the one assessing entrepreneurial behaviour of Dutch dairy farmers [14], can therefore be improved.
Besides income and saving, motives such as independence, status, and acceptance were important for job satisfaction of fishermen in Alaska and New England [124, 125]. Social motives determined whether or not they would continue or start fishing again [ibid.]. In our model, motives such as status and acceptance were not included, as they were not mentioned by farmers, which might be due to the political strategy supporting equity [30]. Keeping livestock is also related to social and religious functions of the animals [134]; in Ethiopia five social functions were distinguished for chickens: mystical ceremonies, religious festivities, hospitality (meals for guests), giving gifts, alerting households to sunrise [68]. In Vietnam, the last three functions are also associated with poultry though the latter is mostly related to geese’s capacity to warn for intruders. To include more motives related to those functions in the model farmers will have to rate the importance they attribute to these functions.

Chapter 6 ____________________________________________________________
112
6.2. Fuzzy logic modelling of farmers’ decision-making Using a recursive approach we developed fuzzy logic models of farmers’ decision-making to simulate the frequency distribution of fish production systems and of the components on the farms. The average individual classification rates of farmers engaged in land-based activities was above 80% and for the livestock activities close to 60%. These figures show that fuzzy logic is a suitable tool to model farmers’ decision-making. A comparative study is needed to confirm if fuzzy logic models including several individual motivations will perform better than linear models using solely ‘utility maximisation’ as farmers’ motive.
To acquire experience with fuzzy modelling, in chapter 3, we developed a pilot model simulating farmers’ choice for a specific fish production system. In the pilot hierarchical fuzzy system (HFS) of two layers, the classical production factors were represented as composed variables, instead of fuzzy rule bases, thus reducing the fuzziness of the system. The first layer handled the farmer’s production preferences for rice, fruit or fish, with composed variables for land, water, labour, capital and market. The second layer simulated the choice between five options: no fish, and the four alternative fish-production systems. The frequency distribution of most fish production systems was simulated accurately, but the classification of individual farmers, especially with regards to the rice-fish system, was poor.
Using the knowledge acquired in chapter 2 and 3, we developed a more definitive linguistic fuzzy logic model that integrated motivations next to the natural, physical, financial and human assets. The decision-making process was mimicked in a three layered HFS. In this structure the individual motives and drives of farmers were represented by farmers’ reference frames [71, 114]. The HFS had five subsets of several fuzzy inference systems (FIS) each having their own rule base: six production factors, ten product opportunities, ten product options, two farmers reference frames (FRFs), and the final output layer. In the first layer we inferred the variables of the production factors and product opportunities; the results of these were combined in the second layer to define product options, which were inferred with the FRFs in the third layer to obtain the final output. To obtain optimal fit during calibration, a relatively high number of linguistic values were needed to maintain the variation of the original inputs, to simulate the synergetic effect between two activities, and to define both constraints and distinguishable and non-confounded consequences (outputs), and the need to simulate the synergetic effect between two activities.
We calculated individual classification rates (ICRs) to evaluate the model’s performance. The ICRs of the positives (= farmers practising a specific activity) and of the negatives (= farmers not practising a specific activity) indicated a lower performance for the activities with a smaller number either of practising or of non-

_________________________________________________ General discussion
113
practising farmers, and for the non-land-based activities. Generally model numerical performance is measured through error type I (missed positives) and II (missed negatives). The performance was best evaluated by the square root of the product of both these rates: √[{(npositives-type I errors)/npositives}*{(nnegatives-type II errors)/nnegatives}]. This overall performance rate for rice is 0.75 but is below 0.6 for all other components, showing that the individual classification of farmers by models remains a challenge.
Especially the classification of farmers raising livestock to diversify their activities was poor. The on-farm innovations have a dual character: diversification (engaging in other activities) and intensification (increasing the extent or the intensity of an activity). On mixed farms intensification also occurs through increased integration of the components. The household life-course, the number of children and young and the age of the household head, are all related to the variable household labour availability, a common variable in linear simulation models. Chapter 2 showed that one of the exponents of the mentioned variables is raising livestock, which allows a virtual increase of the farm: the higher turn-over is accomplished without increasing land size. The model performed better for the land-based activities compared to the non-land based livestock activities; the activities needing a long term investment in land have been called ‘hard-to-change’ and the livestock components ‘easy-to-change’ [121]. All livestock can be sold from one day to another, but the rice field, fruit orchard and fish pond are long term investments that a farmer cannot just stop, although he can change the intensity. E.g. a farmer may buy fingerlings to fatten fish for the market one year while raise the self recruited wild fish only in the next. The decision to start, or to stop, with livestock is related to various factors: availability of household labour, willingness to deal with risk, know-how, availability of or need for cash, and social factors mentioned above [19]. Most are individually motivated factors of which some may be subject to rapid change (physical health) or difficult to assess in current models.
6.3. Motives for integrated farming Whether or not a farmer integrates farm components depends, in decreasing order, on household labour, well-being, area of homestead, number of young children, index of integration, level of education, phase in the life-course, attitude towards risk, and age of household head. Future research is needed to assess if the domination of the classical production factors over the operational variables for farmers’ motives and the index of integration is due to their importance in the decision-making or inherent to the model structure.
In the three-layer HFS, farmers’ individual rating of the importance of growing rice themselves was implemented in the FIS ‘option to grow wet rice’ (Figure 4.2). This

Chapter 6 ____________________________________________________________
114
FIS included also the availability of land, water, labour and capital, and the market opportunity for rice. We quantified the model’s sensitivity using the first derivative of the effect on the centre of gravity, on the number of farms practising a component and on the average number of components practised. The sensitivity of simulating the number of farm components, to the variables cropping rice themselves for food security, phase in the household life-course and number of children and young, was higher than the sensitivity to product prices. However, the first three were low compared to the sensitivity to household labour, well-being, and area of homestead; the last was at least three times higher than index of integration and level of education. The variables of the classical production factors: land, labour and capital, were implemented in the first layer of the HFS. It would be challenging to test whether the domination of these three factors is due to their importance in the decision-making or inherent to the model structure. Therefore the present model needs to be compared with a model integrating the explanatory and operational variables at other levels in the model’s structure (see 6.5).
Both diversification and intensification of activities are related to component integration. IAASs can be a mere accumulation of components without effective integration if the waste of the various components is not exchanged. In the delta, a high index of integration, measured as the number of flows, was positively correlated to well-being and to the income from agriculture. In the hills the limited size of the homestead and the distance to the fields were constraints to effective integration. The findings in chapter 2 confirmed Vietnamese farmers’ claim that IAASs use resources more efficiently than mono-cultures and that their know-how is limiting efficient integration of components [110]. We did not assess the individual farmers’ know-how or motive with regard to the effective integration of components, but extracted an index from available information. The index of integration used in the FRF for integration was derived from the actual bio-resource flows on the farms. Although, using this derived ranking might have strongly directed the results, the sensitivity of the model to this ranking was weak and dominated by other variables such as land size. A personal rating should replace this index in updated models.
6.4. Modelling farmers’ decision-making with fuzzy logic The hierarchical tree structure seems appropriate to model decision-making, and maintains transparency needed for stakeholder involvement. Modelling decision-making can be done with automated procedures but, to prevent collecting huge databases, the composition of the rule base needs to be completed manually to include exceptional cases. The sample size should take account of the frequency of the individual events in the problem area: the fewer the events, the larger the sample size must be.

_________________________________________________ General discussion
115
We structured the decision-making process in a HFS for five reasons: (1) The hierarchical structure represents a decision tree used to mimic, unravel or guide human decisions and was proven valuable to capture human decision-making within a computer [28]; (2) HFS are superior to standard fuzzy models in overcoming the curse of multidimensionality [87, 91, 171]; (3) Fixing the important generalisations in a hierarchical structure allowed a better overview of the rules thus creating a consistent model for the finite-size delta dataset; (4) An extensive rule base for our problem area, including all possible combinations of the variables and linguistic values, would need 246 (more than 7x10¹³) rules if each variables in the HFS had two linguistic values; a rule base too huge for a manual check on consistency. After eliminating the non-firing rules the proposed HFS had less than 700 rules, including the non-firing rules for other product price levels. (5) The hierarchical tree decomposes the system into several smaller decision matrixes which might offer better possibilities to interact with stakeholders when developing a decision support tool. This interaction with stakeholders is important during the development of decision support tools [161]. At this experimental stage of the study, stakeholder involvement was not considered since we focussed on the fundamental research question whether motivations can be modelled. Farmers’ active participation in developing a decision-support tool can focus on the identification of the input and output variables, the validation of the hierarchical structure, the definition of the rule base and the testing of a user interface (see 6.6).
An initial socio-technical analysis on a sample of intermediate size enabled us to identify the input and output variables, model structure, linguistic values and membership functions. After collecting complementary data, we calibrated and fine-tuned the model using manual procedures in order to keep an insight into the process. Mazlack [100] argued that automated model structuring and rule definition by data-mining tends to ignore causalities in the rule base. For automated procedures huge databases are needed and obtaining databases of the nature we discuss is very elaborate; not to speak of the disturbance caused to the interviewed people. Experts and modellers can complete the automated procedure to determine a complete rule base [65], especially when using a relatively small database. This integrated procedure allows to maintain prototypical cases for innovators and stragglers, characteristic for agricultural change processes [47]. The inclusion of these cases is crucial because policy makers are interested in the development of tools to stimulate innovations. Moreover, donors’ willingness to fund research on computer based decision tools will be higher if these tools provide information for all groups of farmers, including the stragglers and poor.

Chapter 6 ____________________________________________________________
116
6.5. Improving the model The good individual classification rates for land-based activities confirm that hierarchical fuzzy models are a convenient tool of simulating farmers’ decision-making. Next to aspects mentioned above, the model can be further improved e.g. by asking farmers themselves to rate several variables, by standardising the soil classification, by including cost of inputs and by focussing on generation of cash. Future research could test a model integrating family motivations in a higher layer of the HFS, and experiment with coupling linear models to fuzzy logic models.
The overall individual classification rates for the land-based activities in the delta (between 78% and 88%) were comparable to those acquired from a linear simulation of land use in the Philippines and Malaysia [159], but lower than those from a fuzzy model of crop choice simulation in North Thailand [49]. Though these results confirm that our model structure and rule base simulate farmers’ decision-making, the model can still be improved on aspects mentioned in the sections above and in the paragraphs hereafter.
Although the classification of soil quality seemed satisfying for the proposed models [chapter 3 and 5], improvements are needed to capture local differences. In the agro-ecological zones of the MD, the land use is mainly determined by the possibilities of water management, the diurnal tides, the flooding period, the sedimentation, the risk of acidification, and the intrinsic soil quality. In the pilot model the last three were captured in one ranking, while these factors can strongly affect farmers’ options and choices [110]. In an on-going study, a ranking of soil quality by individual farmers themselves did not capture regional differences either [108]. A ranking of soil quality should thus be understood by farmers and refer to an existing scale which captures the local and regional differences.
The farming systems we modelled had traditional economic features: farmers could practise activities for home-consumption only, or for this plus cash income generation. Considering this characteristic, to check face validity for calibration we referred to two thresholds: the lower was the number of farmers earning cash income from the components and the upper was the number of all farmers practising the component. The difference between both thresholds are the households that consumed all produce of the component themselves or did not sell any, e.g. a ruminant, during the period considered. This created a bias that could have been prevented by choosing, for example the lower threshold because the market integrated components are our main interest. However, we did not do so as for past years the data on cash income were not available. Farmers are also most interested in advice on new components generating cash: a baseline study of 80 farm households in the delta showed that home-consumption plus other non-cash contribution to income was on average only 16% [121]. Classification rates were

_________________________________________________ General discussion
117
about similar for both thresholds and thus using the lower threshold would not change the conclusions on the main hypotheses of this thesis.
Notwithstanding the validity of using farmers’ awareness of the breakeven price in a particular year with a particular technology and set of input and output prices, we consider the quasi absence of input costs a weakness of the model. A generic model should include changes in the general production context which might require many linguistic values and become complex due to the subsequent rule explosion. Explorative linear models for simulation at system level tend to aggregate technical data to the regional scale, as is the custom in climate models [27]. For system analysis, models tend to skip the farm level, as was also done by e.g. Gimona et al. for grasslands [61], and ignore the complex interaction with human behaviour [166]. Decisions on the resolution of the aggregation level can have huge implications [27]. Various studies have also coupled fuzzy sets to linear models, e.g. to explore land use scenarios in Indonesia a fuzzy model provided input for a multiple goal linear model [84]. In future studies, the output of production functions could be fed to a fuzzy model of decision-making and fuzzy models could be used to integrate farmers’ decision-making into explorative linear models.
The FIS ‘option to crop a rice field’ was located in the 2nd layer of the HFS (Chapter 4, Figure 4.2). The FIS of the FRFs were inferred in the first layer for technical reasons related to the software, but the output was implanted in the 3rd instead of the 2nd layer (Figure 4.2). Moreover, in the 3rd layer we formulated only affirmative consequences for the outputs (e.g.: if fishpond is ‘acceptable’ and FRF-diversification is ‘high’, then IAAS includes ‘fishpond’). Using the FRFs to formulate negative consequences either in the 2nd or the 3rd layer might strengthen their effect (e.g.: if .. and .. and .. and fish is ‘acceptable’ and FRF-diversification is ‘low’, then fishpond is ‘bad’). Inferring the FRFs in the 1st and implementing in the 3rd layer only, allows to overcome the constraint of meaningless inputs and outputs in the intermediate layers of HFS [87]. In a HFS, the decision-making process is decomposed in several smaller decision matrices easier to use in interaction with stakeholders, if the intermediate outputs are transparent. In the interface of a decision-support tool the variables of the FRFs, if positioned in the first layer of the HFS, can be replaced by farmers’ characteristics, ratings and preference rankings. In this sense, the FRFs represent farmers’ individual mind-set vis-à-vis diversification and integration of the components that a farmer can choose, considering the available household’s capitals and the product opportunity. One might argue that the paradigm shift was too small to create any effect due to the implementation in the 3rd layer only, and integrating the social motivations more strongly in the rule base or in a higher layer of the HFS, remains a challenge for future research. Another model structure could be developed after using

Chapter 6 ____________________________________________________________
118
quantitative comparative analysis [129, 135] to rank the input variables in order to decide on the level of their implementation in the HFS.
6.6. Decision support At present the context in which farmers operate is very dynamic, and farmers have demonstrated to be flexible as maintaining sustainability is a continuous learning process. Developing computer-based decision support tools for farmers’ strategic choices is time-consuming while farmers need cost-effective learning tools. Fuzzy logic offers an opportunity to integrate farmers’ motivations in the tools to support learning of researchers and policymakers.
Farmers in IAAS have demonstrated to be very flexible, and tools supporting decisions on their natural resource management need to cope with this continuous learning. In management of agriculture enterprises three horizons of decisions are distinguished: strategic, tactical, and operational. Most computer based decision-support tools use linear programming and mainly focus on strategic decision-making for policy making. Models to support strategic decisions at farm level have also been developed [e.g. 48, 151], but most focus on tactical [e.g. 6, 69], and operational [e.g. 55, 117] level. The question remains whether decision-support tools based on fuzzy logic alone can be useful to support decisions of policy makers and of farmers?
According to McIntosh et al. [102], models can become valid decision support tools for planning if they 1/ integrate social and natural drives 2/ are flexible, i.e. allow to change the system composition and the inter-component relationship, 3/ can address changing issues at farm level, as well as a changing context, and 4/ are ‘tools to think with’ rather than ‘to learn from’. We demonstrated that social motives can be integrated into a model using fuzzy logic, and we discussed the feasibility to address the changing market context. In the present model the system composition is flexible but the inter-component relationships are defined in the rule bases; making these relationships interactive through an interface is not feasible in the present model structure. To address the changing issues at the farm level and to be interactive, an interface needs to integrate other variables allowing the farmers to make choices on e.g. labour input and capital investment. Then still, to what extent can models support farmers’ decision-making?
Some innovating farmers are interested in the choice of particular crops and to enable this for the case we analysed, a more complex model and a larger database are needed. The simulation of choices of 300 farmers in North Thailand, with a data-mining approach using a C4.5 decision-tree algorithm, generated decisions relating to around 30 crops [50]. In the MD, farmers may choose among

_________________________________________________ General discussion
119
a dozen different species of fruits, fish, and upland crops, next to rice, pigs, chickens, ducks, cattle, and goats; the total number of options would be above 40 including the typical mixed systems such as rice-fish, or livestock-fish. In Vietnam, farmers react very fast to market opportunities, e.g. the export of catfish increased from 140,000 tonnes in 2005 to nearly 290,000 tonnes in 2006 and is expected to reach 1 million tonnes in 2007 [79]. In such a context, it is not farmers who need a strategic decision support tool but policy makers concerned about environmental consequences of such a development. Whereas farmers need practical support tools for operational decisions on, e.g., the sustainable management of the fishpond on their integrated farms, or for tactical decisions on, e.g., the choice between buffaloes, cattle or goats.
At present, most decision support tools developed by agriculture science focus on sustainable land use systems, although sustainability is not a fixed state but an emergent property of farming systems [163]. Maintaining sustainability is a continuous process of learning as every change induces a new condition that we need to manage or study [3]. Farmers can innovate and learn fast if they are offered opportunities. This continuous learning and changing makes explorative modelling a hazardous enterprise: one cannot predict what farmers will learn, nor in the context of IAASs, to which activity they will give priority. For example, in the MD the reaction of some farmers to the Avian Influenza were surprising: their investments in poultry did not decrease but increase because they expected to profit from high prices due to shortage of poultry meat on the market [119]. They could not anticipate the reactions of consumers fearing their health due to the zoonotic effects; even current models could not have predicted this reaction.
Above we argued that more motivations need to be assessed and cost factors integrated in order to simulate farmers’ decisions related to their choices. Strategic and tactical decisions remain personal and can be guided, among others, by training to increase farmers’ know-how, and by ‘passing on the gift’ programmes to provide the financial asset. Models might not really be needed to support these decisions at farm level. However, participating in the development of models gives stakeholders, including farmers, an opportunity to learn [48, 69, 114]. Model development mostly includes only a small group of farmers [69], and scaling up has not yet been successful in developing countries. Our experience confirms that models of decision-making should be context specific [102]. Even the farming systems of the agro-ecological zones in the MD are hard to capture in one model (this thesis, chapter 5). We join van Paassen [114] in her conclusions that the design of models for natural resource management including the farm level, is a learning tool for scientists especially. While easy to handle, models need to be adapted regularly to emerging learning needs of stakeholders which will make them money, time and expertise consuming learning devices. In the context of the new paradigm

Chapter 6 ____________________________________________________________
120
of joint learning within a dynamic environment, scientists, extension agents and farmers need simple, flexible and cost-effective learning tools. If computer based models, whether using linear mathematics or fuzzy set theory, offer such tools needs to be assessed. Motives, other than utility maximisation, have been neglected in developing such tools. We demonstrated that hierarchical fuzzy models offer an opportunity to integrate family motivations into models of farmer’s decision-making in a transparent way that can facilitate their participation.
6.7. Conclusions This thesis aimed to test three hypotheses. We confirmed the first and second hypotheses by demonstrating that motivations of farmers can be made operational and integrated into a model using fuzzy logic and that such models simulate satisfactory farmers’ decision-making for the land-based farm components. As for the third hypothesis: fuzzy logic assisted in ranking the variables of farm diversification and integration that were identified by literature surveys, expert consultations, on-farm collection of information, and data analysis.
Model development is a long process that perhaps can deliver tools for learning and strategic decision support to scientist and policy makers, while farmers need tools to support operational and tactical decisions. The development of a decision support tool based on a hierarchical fuzzy model requires a recursive process of at least 11 steps and the association of the stakeholders. The performance of the proposed model could be improved by including: cost appreciation of all crucial inputs, farmers’ motivations related to the choice to raise livestock, and farmers’ ratings of the importance of integration, of risk behaviour and of soil quality based on existing classifications.
In the Mekong Delta farm diversification and integration are inspired by the availability of labour, capital and land, the number of young children, the index of integration, the household life-course, and the education of the household head, in decreasing order. The household life-course and young children are operational variables for two basic family motivations: romance and the desire to raise children. The choice of the farm component further depends on the specific know-how and market opportunity, having both a lower impact on the model’s result than e.g. the number of young children. Therefore models simulating farmers’ decision making should include family-related motivations.

121
REFERENCES 1. Adesina, A.A. and M. Zinnah, 1993. Technology characteristics, farmers perceptions, and adop-
tion decisions: a tobit model application in Sierra Leone. Agricultural Economics, 9(297-311). 2. Allison, E.H. and F. Ellis, 2001. The livelihood approach and management of small-scale
fisheries. Marine Policy, 25: p. 377-388. 3. Andel, J.v., 2004. Tussen theorie en werkelijkheid: oneindige wetenschap. Afscheidscollege.
Rijks Universiteit Groningen; Van Denderen bv. pp. 24. 4. AscoughII, J.C., T.R. Green, L. Ma, and L.R. Ahjua, 2005. Key criteria and selection of
sensitivity analysis methods applied to natural resource models, in MODSIM 2005, Int. Congress on Modelling and Simulation. Melbourne p. 2463-2469.
5. Asseldonk, M.A.P.M.v., 1999. Economic evaluation of information technology applications on dairy farms, PhD-thesis, Wageningen University, pp. 123.
6. Azadi, H., M. Shahvali, J.v.d. Berg, and N. Faghih, 2007. Sustainable rangeland management using a multi-fuzzy model: how to deal with heterogeneous experts' knowledge. Journal of Environmental Management, 83(2): p. 236-249.
7. Babuska, R., 1997. Fuzzy modelling and identification, PhD-thesis, Delft University. 8. Baldwin, J., T. Martin, and B. Pilsworth, 1998. Knowledge representation, in: E.H.
Ruspine, P.P. Bonissone, and W. Pedrycz (Eds), Handbook of fuzzy computation. Bristol and Philadelphia, Institute of Physics Publishing. pp. F1.1:1-18.
9. Batz, F.J., K.J. Peters, and W. Janssen, 1999. The influence of technology characteristics on the rate and speed of adoption. Agricultural Economics, 21: p. 121-130.
10. Beck, H.W., P. Jones, and J.W. Jones, 1989. SOYBUG: An expert system for soybean insect pest management. Agricultural Systems, 30: p. 269-286.
11. Bellman, R. and M. Giertz, 1973. On the analytic formalism of the theory of fuzzy sets. Information Sciences, 5: p. 149-156.
12. Benneth, J.W., 1980. Management style: a concept and a method for the analysis of family-operated agricultural enterprise, in P.F. Barlett (Ed.), Agricultural decision making: anthropological contributions to rural development. New York: Academic Press. pp. 203-237.
13. Berg, J.v.d., 2004. Fuzzy methodologies for evaluating sustainable development. in Contemporary Applications of the Mathematical and Computer Sciences to Development Problems. Lagos, Nigeria, ICMCS p. 91-116.
14. Bergevoet, R.H.M., C.J.M. Ondersteijn, H.W. Saatkamp, C.M.J.v. Woerkum, and R.B.M. Huirne, 2004. Entrepreneurial behaviour of dutch dairy farmers under a milk quota system: goals, objectives and attitudes. Agricultural Systems, 80: p. 1-21.
15. Bosma, R.H., J.v.d. Berg, U. Kaymak, H.M.J. Udo, and J.A.J. Verreth, submitted. A methodology for designing fuzzy logic models to simulate farmers' decision in integrated agriculture aquaculture systems. Agricultural Systems.
16. Bosma, R.H., N.Q. Cao, H.M.J. Udo, and J.A.J. Verreth, 2007. Assessing farmers’ motives for livelihood diversification in the Mekong Delta: household life cycle, virtual farm size, and index of integration, in: Fish Ponds in Farming Systems, A.J.v.d. Zijpp, et al. (Eds), Fish Ponds in Farming Systems. Wageningen Academic Publishers. pp. 261-269.

References ___________________________________________________________
122
17. Bosma, R.H., Q.N. Cao, P.D. Minh, H.M.J. Udo, and J.A.J. Verreth, 2004. Motivation of farmers in the Vietnamese Mekong Delta (VMD) for the integration of various components on their family farm. in New Dimensions and Challenges for Sustainable Livestock Farming. 11th AAAP congres. Kuala Lumpur, Malaysia, AAAP p. 419-422.
18. Bosma, R.H., U. Kaymak, J.v.d. Berg, and H.M.J. Udo, 2005. Fuzzy modelling of farmer motivations for integrated farming in the Vietnamese Mekong Delta, in 14th IEEE International Conference on Fuzzy Systems. Reno (Nevada, USA) p. 827-832.
19. Bosma, R.H., C.Q. Nam, H.M. Udo, J.A. Verreth, and L. Visser, 2006. Agriculture diversification in the Mekong Delta: farmers' motives and contribution to livelihoods. Asian Journal of Agricultural Development, 2(1&2): p. 49-66.
20. Bosma, R.H., et al., 2006. Assessing and modelling farmers’ decision-making on integrating aquaculture into agriculture in the Mekong Delta Farmer. Netherlands Journal of Agricultural Sciences, 53(3/4): p. 281-300.
21. Bosma, R.H., et al., 2003. Financial and social benefits of new forage technologies in Mindanao, Philippines and Tuyen Quang, Vietnam. Centro Internacional Agricultura Tropical. p. 92.
22. Brons, J.E., 2005. Activity Diversification in Rural Livelihoods, PhD-thesis, Wageningen University, pp. 153.
23. Bruijn, M.d. and H.v. Dijk, 2004. "Pathways" and "Habitus": two frameworks for the analysis of decision-making in high-risk environments: CERES Summerschool, Nijmegen.
24. Bruijn, M.E.d. and J.M.W.v. Dijk, 1999. Insecurity and pastoral development in the Sahel. Development and Change, 30(1): p. 115-139.
25. Brummett, R.E. and B.A. Haight, 1996. Research-Development Linkages. Report of the Expert Consultation on Small-scale Rural Aquaculture, Fisheries Report 548 (FIRI/R548). Rome, FAO. pp. 147-169.
26. Bunting, S.W., 2004. Wastewater aquaculture: perpetuating vulnerability or opportunity to enhance poor livelihoods? . Aquatic Resources, Culture and Development, 1(1): p. 51-75.
27. Bussel, L.v. and F. Ewert, 2007. Personal communication, 12 June, Wageningen University. 28. Cai, J., J. Durkin, and Q. Cai, 2005. CC4.5: cost-sensitive decision tree pruning, in: A.
Zanasi, C.A. Brebbia, and N. Ebecken (Eds), Data Mining VI: Data Mining, Text Mining and their Business Applications. Southampton, Wessex Institute of Technology. pp. 239-245.
29. Carlsson, C. and R. Fuller, 1996. Fuzzy multiple criteria decision making: Recent developments. Fuzzy Sets and Systems, 78: p. 139-153.
30. Carlsson, F., P.K. Nam, M. Linde-Rahr, and P. Martinsson, 2005. Are Vietnamese farmers concerned with their relative position in society? Department of Economics, Gothenburg University. p. 18.
31. Carney, D., 1998. Implementing the sustainable rural livelihoods approach. Sustainable Rural Livelihoods. London, DFID. pp. 3-23.
32. Caswell, M., K. Fuglie, C. Ingram, S. Jans, and C. Kascal, 2001. Adoption of agricultural practices: Lessons learned from the US Department of Agriculture Area Studies Project. Agricultural Economic Report No 792, USDA, Washington DC. pp110.
33. Chambers, R., 1994. The origins and practice of Participatory Rural Appraisal. World Development, 22(7): p. 953-969.

_______________________________________________________ References
123
34. Chambers, R., 1994. Participatory Rural Appraisal (PRA): analysis of experience. World Development, 22(9): p. 1253-1268.
35. Chambers, R., 1994. Participatory Rural Appraisal (PRA): challenges, potentials and paradigm. World Development, 22(10): p. 1437-1454.
36. Chambers, R. and G. Conway, 1992. Sustainable rural livelihoods: practical concepts for the 21st century. IDS discussion paper 296. Brighton Sussex UK. pp.29.
37. Charo-Karisa, H., M.A. Rezk, H. Bovenhuis, and H. Komen, 2004. Effects of rearing conditions on low-temperature tolerance of nile tilapia juveniles. VIth International Symposium on Tilapia in Aquaculture, September 12-16, 2004. Manilla, Philippines.
38. Cheng, Z., D.J. Horn, R.K. Lindquist, and R.A.J. Taylor, 1996. Fuzzy analysis for a greenhouse spider mite management system. Ecological Modelling, 90: p. 111-121.
39. Chi, R.T.N. and R. Yamada, 2002. Factors affecting farmers' adoption of technologies in farming system: a study in Omon district, Can Tho Province, Mekong Delta. in: Development of new technologies and their practice for sustainable farming systems in the Mekong Delta. Can Tho, JIRCAS-CTU-CLRRI-SOFRI p. 392-398.
40. Chulef, A.S., S.J. Read, and D.A. Walsh, 2001. A hierarchical taxonomy of human goals. Motivation and Emotion, 25(3): p. 191-232.
41. Cornelissen, A.M.G., 2003. The two faces of sustainability: fuzzy evaluation of sustainable development, PhD-thesis, Wageningen University, pp. 183.
42. Cornelissen, A.M.G., J.v.d. Berg, W.J. Koops, M. Grossman, and H.M.J. Udo, 2001. Assessment of the contribution of sustainability indicators to sustainable development: a novel approach using fuzzy set theory. Agriculture, Ecosystems & Environment, 86: p. 173-185.
43. Costa-Pierce, B.A., 2002. Ecological Aquaculture, the evolution of the bleu revolution. pp.400.
44. Coughenour, C.M. and L.E. Swanson, 1988. Rewards, values and satisfaction with farm work. Rural Sociology, 53(4): p. 442-459.
45. Crouch, S., 1998. CEM333: Using Excel to find 1st and 2nd derivatives. Accessed: 03-08-2007, at: http://www.cem.msu.edu/~cem333/POTTITR.html.
46. Defoer, T., S. Kanté, T. Hilhorst, and H.D. Groote, 1995. Analysing the diversity of farmers’ strategies. LEIA Newsletter, 11(2): p. 9-11.
47. Deutschman, P.J. and O.F. Borda, 1995. Communication and adoption patterns in an Andean village, San José, Costa Rica, Programa Interamericano de Informacion Popular, 1962, in: Rogers (Ed.), Communication and Innovation. pp. 253-256.
48. Doppler, W. and A. Floquet, 1999. A participatory livelihood planning approach: Farmers participation in modelling and optimisation procedures. in: Renard G. S. Krieg, P Lawrence, M. von Oppen (Eds), Farmers and scientists in a changing environment: assessing research in West Africa, regional workshop, INRAB & Univ. Hohenheim Cotonou, Benin, February 22-26. Margraf Verlag Weikersheim Germany p. 407-418.
49. Ekasingh, B.S. and R.A. Letcher, 2005. Successes and failures of attempts to embed socio-economic dimensions in modelling for integrated natural resource management: lessons from Thailand. in: MODSIM 2005, Melbourne: p. 1-10.
50. Ekasingh, B.S., K. Ngamsomsuke, R.A. Letcher, and J.M. Spate, 2005. A data-mining approach to simulating land use decisions: modelling farmer's crop choice from farm

References ___________________________________________________________
124
level data for integrated water resource management. in: International Conference on Simulation and Modelling. Nakorn Pathom (Thailand) p. 335-344.
51. Ellis, F., 1998. Household Strategies and Rural Livelihood Diversification. The Journal of Development Studies, 35(1): p. 1-38.
52. Emami, M.R., A.A. Goldenberg, and I.B. Türksen, 2000. Fuzzy-logic control of dynamic systems: from modelling to design. Engineering Application of Artificial Intelligence, 13: p. 47-69.
53. Erp, S.v. and P. Pauwe, 2006. Data driven optimisation of a hierarchical fuzzy system on farmer decision making, BSc-thesis, Erasmus University, pp. 68.
54. Fairweather, J.R. and N.C. Keating, 1994. Goals and management styles of New Zealand farmers. Agricultural systems, 44: p. 181-200.
55. Fisher, P.R., R.D. Heins, N. Ehler, and J.H. Lieth, 1997. A decision-support system for real-time management of Easter Lily (Lilium Iongiflorum Thunb.) scheduling and height - I. system description. Agricultural Systems, 54(1): p. 23-37.
56. Fodor, J., P. Perny, and M. Roubens, 1998. Decision-making models. in: E.H. Ruspine, P.P. Bonissone, and W. Pedrycz (Eds), Handbook of Fuzzy Computation. Bristol and Philadelphia, Institute of Physics Publishing. pp. F5.1-14.
57. Gaines, B.R., 1976. Fuzzy reasoning and the logics of uncertainty. in: Multiple-Valued Logic, Proc. 6th international symposium. Logan, Utah, United States. IEEE Computer Society Press, p. 179-188.
58. Garforth, C. and T. Rehman, 2005. Review of literature on measuring farmers’ values, goals and objectives (Research project EPES 0405/17). University of Reading, School of Agriculture, Policy and Development. p. 35.
59. Gasson, R., 1973. Goals and values of farmers. Journal of Agricultural Economics, 24: p. 521-542.
60. Geman, S., E. Bienenstock, and R. Doursat, 1992. Neural networks and the bias/variance dilemma. Neural Computation, 4: p. 1-58.
61. Gimona, A., R.V. Birnie, and A.R. Sibbald, 2006. Scaling up of a mechanistic dynamic model in a GIS environment to model temperate grassland production at the regional scale. Grass and Forage Science, 61: p. 315-331.
62. Gladwin, C.H., 1980. A theory of real-life choice: applications to agricultural decisions. Agricultural decision-making: Academic press. pp. 45-85.
63. Glancy, W.J., 1985. Heuristic classification. Artificial Intelligence, 27(3): p. 289-350. 64. Gowing, J., A. Tarimo, and O. El-Awad, 1996. A rational method for assessing irrigation
performance at farm level with the aid of fuzzy set theory. Irrigation and Drainage Systems, 10: p. 319-330.
65. Guillaume, S. and L. Magdalena, 2006. Expert guided integration of induced knowledge into a fuzzy knowledge base. Soft Computing - A Fusion of Foundations, Methodologies and Applications, 10: p. 773-784.
66. Gupta, A.P., R. Harboe, and M.T. Tabucano, 2000. Fuzzy multiple-criteria decision making for crop area planning in Narmada river basin. Agricultural Systems, 63: p. 1-18.
67. Gürocak, H. and A.d. SamLazaro, 1994. A fine-tuning method for fuzzy logic rule bases. Fuzzy Sets and Systems, 67: p. 147-161.

_______________________________________________________ References
125
68. Hailemichael, A., 2007. How resource poor households value and access poultry; village poultry keeping in Tigray, Ethiopia. Agricultural Systems, forthcoming.
69. Hailemichael, A., 2007. Village poultry in Ethiopia, PhD-thesis, Wageningen University, pp. 178.
70. Hastie, T., R. Tibshirani, and J. Friedman, 2001. The elements of statistical learning; data mining, inference and prediction. Springer series in statistics: Springer. pp. 533.
71. Hebinck, P., 2001. Maize and socio-technical regimes. in: P. Hebinck and G. Verschoor (Eds), Resonances and Dissonances in Development. Royal van Gorcum, Netherlands. pp. 119-128.
72. Holling, C., 1995. Sustainability: The Cross-scale Dimension. in: M. Munasinghe and W. Shearer (Eds), Defining and Measuring Sustainability. IBRD/WB, Washington DC. pp. 65-76.
73. IFPRI, 1995. Rice Market and Monitoring and Policy Options Study. Statististical Publishing House Hanoi.
74. Jagielska, I., 2003. A rough sets / neural network approach to knowledge discovery for the development of decision support systems. in: X. Yu and J. Kacprzyk (Eds), Applied decision support with soft computing. Heidelberg: Springer. pp. 127-148.
75. Jamu, D.M., 2003. Identification of sediment processes regulating Nitrogen use efficiency and retention in Integrated Aquaculture/Agriculture Systems: Worldfish Centre, Malawi. p. 43.
76. Jang, J.-S.R., C.-T. Sun, and E. Mizutani, 1997. Neuro-Fuzzy and Soft Computing. MatLab Curriculum Series. Upper Saddle River, Prentice Hall. pp. 614.
77. Johnson-Laird, P.N. and E. Shafir, 1993. The interaction between reasoning and decision making: an introduction. Cognition: Int. Journal of Cognitive Science, 49(1-2): p. 1-9.
78. Jones, D. and E.M. Barnes, 2000. Fuzzy composite programming to combine remote sensing and crop models for decision support in precision crop management. Agricultural Systems, 65: p. 137-158.
79. Josupeit, H, 2007. Vietnamese Pangasius: 1 million tonnes to be reached this year. Globefish. 20-08 2007, at: www.globefish.org/index.php?id=3684&easysitestatid=1451297236
80. Kacprzyk, J. and M. Fedrizzi, 1990. Multipersons decision making models using fuzzy sets and possibility theory. Kluwer Academic Publishers. pp. 346.
81. Kaloudis, S., A. Tocatlidou, N.A. Lorentzos, A.B. Sideridis, and M. Karteris, 2005. Assessing wildfire destruction danger: a decision support system incorporating uncertainty. Ecological Modelling, 181: p. 25-38.
82. Karray, F.O. and C. deSilva, 2004. Soft computing and intelligent systems design, theory, tools and applications. Hallow, England: Pearson, Addison Wesley pp. 470.
83. Kaymak, U., R. Babuska, and H.R.v. Nauta-Lemke, 1998. A fuzzy logic system for steady-state security analysis of power networks. Journal of intelligent and fuzzy systems, 6: p. 345-359.
84. Kok, J.-L.d., G. Engelen, R. White, and H. Wind, 2006. Modeling land-use change in a decision-support system for coastal-zone management. Environmental Modelling and Assessment, 6: p. 123-132.
85. Lacrose, V. and A. Titli, 1997. Fusion and hierarchy can help fuzzy logic controller designers. in: Fuzzy Systems 1997, 6th IEEE Int. Conf. Barcelona. IEEE p. 1159-1165.

References ___________________________________________________________
126
86. Law, A.M. and M.G. McComas, 2001. How to build valid and credible simulation models. in Proc. of the 2001 Winter Simulation Conference: IEEE p. 22-29.
87. Lee, M.-L., H.-Y. Chung, and F.-M. Yu, 2003. Modelling of hierarchical fuzzy systems. Fuzzy Sets and Systems, 138: p. 343-361.
88. Liao, S.-L., 2005. Expert system methodologies and applications - a decade review from 1995 to 2004. Expert systems with applications, 28: p. 93-103.
89. Lightfoot, C., O.J.d. Guia, and F. Ocado, 1988. A participatory method for systems-problem research: rehabilitating marginal uplands in the Philippines. Experimental Agriculture, 24: p. 301-309.
90. Linh, N.V., 2001. Agricultural Innovation: Multiple grounds for technology policies in the Red River Delta of Vietnam, PhD-thesis Wageningen Univeristy, pp. 200.
91. Liu, P. and H. Li, 2005. Hierarchical TS fuzzy systems and its universal approximation. Information Sciences, 169: p. 279-303.
92. Long, N., 2001, Development Sociology - Actor Perspectives. London / New York: Routledge. pp. 394.
93. Long, N. and J.v.d. Ploeg, 1994. Heterogenity, actor and structure towards a reconstitution of the concept of structure. in: D Booth (Ed.), New directions in social development. London, Longman. pp. 62-89.
94. Luu, L.T., 1992. The VAC system in northern Vietnam. Farmer-proven Integrated Agriculture Aquaculture: a technology information kit. Los Banos: IIRR & ICLARM. pp. 183.
95. Luu, L.T., 1999. Small-scale aquaculture in rural development - trends and constraints. in: Report of the Asia-Pacific Fishery Commission Ad hoc Working Group of Experts in Rural Aquaculture. Bangkok, Thailand. FAO. p.120.
96. Mahaman, B.D., H.C. Passam, A.B. Sideridis, and C.P. Yialouris, 2003. DIARES-IPM: a diagnostic advisory rule-based expert system for integrated pest management in Solanaceous crop systems. Agricultural Systems, 76: p. 1119-1135.
97. Mango, N.A.R., 2002. Husbanding the Land. Agrarian development and socio-technical change in Luoland, Kenya, PhD-thesis, Wageningen University. pp.322.
98. Matell, M.S. and J. Jacoby, 1971. Is there an optimal number of alternatives for Likert scale items? Study I: Reliability and viability. Educational and Psychological Measurement, 31: p. 657-674.
99. Mathworks, 2004. Fuzzy logic toolbox (version 2) for use with Matlab. Natick, USA: The Mathworks Inc.
100. Mazlack, L.J., 2005. Causality in an inherently ill defined world. in: Nikravesh M., L.A. Zadeh, and J. Kacprzyk (Eds). Mining Fuzzy Association Rules: An Overview Heidelberg: Springer. p. 449-546.
101. McCloskey, A., R. McIvor, L. Maguire, P. Humphreys, and T. O'Donnell, 2006. A user-centred corporate acquisition system: a dynamic fuzzy membership functions approach. Decision Support Systems, 42(1): p. 162-185.
102. McIntosh, B.S., P. Jeffrey, M. Lemon, and N. Winder, 2005. On the design of computer-based models for integrated environmental science. Environmental Management, 35(6): p. 741-752.

_______________________________________________________ References
127
103. Medasania, S., J. Kimb, and R. Krishnapuram, 1998. An overview of membership function generation techniques for pattern recognition. International Journal of Approximate Reasoning, 19(3-4): p. 391-417.
104. Muendo, P.N., et al., 2004. Sediment accumulation in fish ponds: its quantity and quality as a crop fertilizer. 7th Asian Fisheries Forum, November 2004. Penang Malaysia. p.297.
105. Netting, R.M., 1993. The Technology and Knowledge of Intensive Farm Practices. in Netting (Ed), Smallholders, Householders: Farm Families and the Ecology of Intensive, Sustainable Agriculture. Oxford: Blackwell. pp. 28-57.
106. Nevo, A. and I. Amir, 1991. CROPLOT, an expert system for determining the suitability of crops to plots. Agricultural Systems, 37: p. 225-241.
107. Nevo, A., R. Oad, and T.H. Podmore, 1994. An integrated expert system for optimal crop planning. Agricultural Systems, 45: p. 73-92.
108. Nhan, D.K. and R. Bosma, on-going. Analysis of the adoption potential of rice-fish systems in the Mekong Delta.
109. Nhan, D.K., N.T. Duong, M. Verdegem, and L. Duong, 2003. Towards Agricultural Diversification and Rural Poverty Alleviation - Development of Agri-Aquaculture farming in the Mekong Delta, Vietnam. Technological and Institutional Innovations for Sustainable Rural Development, Deutscher Tropentag 2003. Klartext GmbH, Gottingen.
110. Nhan, D.K., et al., 2007. Integrated freshwater aquaculture, crop and livestock production in the Mekong Delta, Vietnam: determinants and the role of the pond. Agricultural Systems, 94: p. 445-458.
111. Niehof, A., 2004. The significance of diversification for rural livelihood systems. Food Policy, 29: p. 321-338.
112. ODG, 2001. Methods Manual for Fieldwork. DFID, Norwich. p. 35. 113. Örtengren, K., 2003. The Logical Framework Approach - A summary of the theory behind the
LFA method. SIDA, Stockholm. p. 40. 114. Paassen, A.v., 2004. Bridging the gap: computer model enhanced learning for natural
resource management in Burkina Faso. PhD-thesis Wageningen University, pp. 219. 115. Paassen, A.V., R.P. Roetter, H.V. Keulen, and C.T. Hoanh, 2007. Can computer models
stimulate learning about sustainable land use? Experience with LUPAS in the humid (sub-)tropics of Asia. Agricultural Systems, 94: p. 874-887.
116. PalharesdeMelo, L.A.M., D.J. Bertioli, E.V.M. Cajueiro, and R.C. Bastos, 2001. Recommendation for fertilizer application for soils via qualitative reasoning. Agricultural Systems, 67(1): p. 21-30.
117. Pelta, D.A., J.L. Verdegay, and J.M. Cadenas, 2003. Introducing SACRA: a decision support system for the construction of cattle diets. in: X. Yu and J. Kacprzyck (Eds), Applied decision support with soft computing, Vol. 124. Heidelberg: Springer. pp. 391-401.
118. Perz, S.G., 2001. Household demographic factors as life cycle determinants of land use in the Amazon. Population Research and Policy Review, 20: p. 159-186.
119. Phong, L., H. Udo, J. Jansen, R. Bosma, and A.v.d. Zijpp, 2007. Resilience of smallholders: impact of Avian Influenza on mixed farming systems in the Mekong Delta, Vietnam. in: Camus et.al. (Eds.), 12th AITVM, Does control of animal infectious risks offer a new international perspective? Mont Pellier, 20-23 August p. 383-387.

References ___________________________________________________________
128
120. Phong, L.T., forthcoming. Changes in Integrated Agriculture-Aquaculture Systems: What is the balance in sustainability? PhD-thesis Wageningen University.
121. Phong, L.T., et al., 2007. Trends in IAA-systems in the VMD: From Specialization, to Diversification and Intensification. Asian Journal of Agriculture and Development.
122. Phong, L.T., et al., 2004, Understanding integrated agriculture-aquaculture systems in the Mekong Delta, Vietnam. The 11th Animal Science Congress, Asian-Australian Association of Animal Production Societies. Kuala Lumpur, Malaysia. 423-425.
123. Plous, S., 1993, The psychology of judgement and decision making: Mc Graw-Hill, pp120. 124. Pollnac, R.B. and J.J. Poggie, 1988. The structure of job satisfaction among New England
fishermen and its application to fisheries management policy. American Anthropologist, New Series, 90(4): p. 888-901.
125. Pollnac, R.B. and J.J. Poggie, 2006. Job satisfaction in the fishery in two Southeast Alaskan towns. Human Organization, 65(3): p. 329-339.
126. Prasada, V.S.S. and S.D. Gupta, 2007. Photometric clustering of regenerated plants of gladiolus by neural networks and its biological validation. Computers and electronics in agriculture.
127. Prein, M., 2002. Integration of aquaculture into crop-animal systems in Asia. Agricultural Systems, 71: p. 127-146.
128. Prein, M., R. Oficial, M. Bimao, and T. Lopez, 1998. Aquaculture for Diversification of Small Farms within Forest Buffer Zone management: an exemple from the Uplands of Quirino Province, Philippines. in: P. Edwards, Little D.C., and D. H. (Eds), Rural Aquaculture. Chiang Mai, Thailand, CAB International. pp. 97-110.
129. Ragin, C.C., 2006. Set relations in social research: Evaluating their consistency and coverage. Political Analysis, 14: p. 291-310.
130. Ravalico, J.K., H.R. Maier, G.C. Dandy, J.P. Norton, and B.F.W. Croke, 2005. A comparison of sensitivity analysis techniques for complex models for environmental management. in MODSIM 2005, Congress on Modelling and Simulation. Melbourne p. 2533-2539.
131. Reece, J. and J. Sumberg, 2003. More clients, less resources: towards a new conceptual framework for agricultural research in marginal areas. Technovation, 23: p. 409-421.
132. Reiss, S., 2004. Multifaceted nature of intrinsic motivation: the theory of 16 basic desires. Review of General Psychology, 8(3): p. 179-193.
133. Richards, P., 2003. Technography: notes on methods. WU, Technology and agrarian development p. 8.
134. Riethmuller, P., 2003. The social impact of livestock: A developing country perspective. Animal Science Journal, 74: p. 245-253.
135. Rihoux, B., 2003. Bridging the gap between the qualitative and quantitative worlds? A retrospective and prospective view on Qualitative Comparative Analysis. Field Methods, 15(4): p. 351-365.
136. Röling, N., 2003. From causes to reasons: the human dimension of agricultural sustainability. International Journal of Agricultural Sustainability, 1(1): p. 73-88.
137. Röling, N.G., 1996. Towards an interactive agricultural science. Journal of Agricultural Education and Extension, 4: p. 35-48.
138. Röling, N.G. and M.A.E. Wagemakers, 1998. A new practice: facilitating sustainable agriculture. in: N.G. Röling and M.A.E. Wagemakers (Eds), Facilitating sustainable

_______________________________________________________ References
129
agriculture.: Cambridge University Press. pp. 3-22. 139. Rouchier, J., F. Bousquet, M. Requier-Desjardins, and M. Antona, 2001. A multi-agent
model for transhumance in North Cameroon: comparison of different rationality to develop a routine. J. Economic dynamics and control 25: p. 527-599.
140. Ruspini, E.H., P.P. Bonissone, W. Pedrycz (Eds), 1998. Handbook of Fuzzy Computation (cited from Introduction of chapter Fuzzy models). Bristol and Philadelphia: Institute of Physics Publishing. p. C.1.: 1-10.
141. Salski, A., 1992. Fuzzy knowledge-based models in ecological research. Ecological Modelling, 63: p. 103-112.
142. Sanh, N.V., V.T. Xuan, and T.A. Phong, 1998. History and future of farming systems in the Mekong Delta. in: V.T. Xuan and S.E. Matsui (Eds), Development of farming systems in the Mekong Delta of Vietnam. Ho Chi Minh City Publishing House. pp. 16-80.
143. Schwartz, S.H., 1992. Universals in the content and structure of values: Theoretical advances and empirical tests in 20 countries. Advances in Experimental Social Psychology, 25: p. 1-65.
144. Scoones, I. and C. Toulmin, 1998. Soil nutrient balances: what use for policy? Agriculture, Ecosystems and Environment, 71: p. 255-267.
145. Setnes, M., 2001. Complexity reduction in Fuzzy Systems, PhD-thesis, Delft University of Technology. pp.258.
146. Sicat, R.S., E.J.M. Carranza, and U.B. Nidumolu, 2005. Fuzzy modeling of farmers’ knowledge for land suitability classification. Agricultural Systems, 83: p. 49-75.
147. Silvert, W., 1997. Ecological impact classification with fuzzy sets. Ecological Modelling, 96: p. 1-10.
148. Sorensen, J.T., 1990. Validation of livestock herd simulation models: a review. Livestock Production Science, (26): p. 79-90.
149. SPSS-12. Statistical Package for Social Sciences. 150. Stirrat, R., 2004. Yet another ‘magic bullet’: the case of social capital. Aquatic Resources,
Culture and Development, 1(1): p. 25-33. 151. Stroosnijder, L. and T.v. Rheenen, 2001. Agro-silvo-pastoral land use in Sahelian
villages. Advances in Geo-ecology, Vol. 33. Reiskirchen, Germany. pp.408. 152. Thacker, B.H., et al., 2004. Concepts of Model Verification and Validation. Accessed: 29-
01-2007, at: www.osti.gov/energycitations/servlets/purl/835920-Yl8Ow3/native/ 835920.pdf.
153. Thomson, A.J. and I. Willoughby, 2004. A web-based expert system for advising on herbicide use in Great Britain. Computers and electronics in agriculture, 42: p. 42-49.
154. Thornton, P.K. and M. Herrero, 2001. Integrated crop-livestock simulation models for scenario analysis and impact assessment. Agricultural Systems, 70: p. 581-602.
155. Tracer, D.P., 2003. Selfishness and fairness in economic and evolutionary perspective: an experimental economic study in Papua New Guinea. Current Anthropology, 44(3): p. 432-438.
156 Tri, L.Q., 1996. Developing management packages for acid sulfate soils based on farmer and expert knowledge: Fieldstudy in the Mekong Delta, Viet Nam. PhD-thesis, Wageningen University, pp. 200.
157. Türksen, I.B., 2002. Type 2 representation and reasoning for CWW. Fuzzy Sets and

References ___________________________________________________________
130
Systems, 127: p. 17-36. 158. Türksen, I.B., 2004. A foundation for CWW: Meta-linguistic axioms. in: Fuzzy
information 2004 (NAFIPS '04): IEEE p. 395-400. 159. Verburg, P.H., et al., 2002. Modelling the spatial dynamics of regional land use: the CLUE-S
model. Environmental Management, 30(3): p. 391-405. 160. Wagner, P., 1993. Techniques of representing knowledge in knowledge-based systems.
Agricultural Systems, 41: p. 53-76. 161. Walker, D.H., 2002. Decision support, learning and rural resource management. Agricultural
Systems, 73: p. 113-127. 162. Weisbrod, J., 1998. A new approach to fuzzy reasoning. Soft Computing, 2(1): p. 89-99. 163. Woodhill, J. and N. Röling, 1998, The second wing of the eagle: the human dimension in
learning our way to more sustainable futures. in: N. Röling and M. Wagemakers (Eds), Facilitating sustainable agriculture. Cambridge University Press. pp. 46-72.
164. Xuan, V.T. and S. Matsui (Eds), 1998. Development of farming systems in the Mekong Delta of Vietnam. JIRCAS 1998, Can Tho. Saigon Times Group, Vietnam Asia Pacific Economic Center, Ho Chi Min City Publishing House. pp. 318.
165. Yang, C.-C., S.O. Prasher, J.-A. Landry, and H.S. Ramaswamy, 2003. Development of a herbicide application map using artificial neural networks and fuzzy logic. Agricultural Systems, 76: p. 561-574.
166. Young, O.R., et al., 2006. A portfolio approach to analysing complex human-environment interactions: institutions and land change. Ecology and Society 11(2) 31. http://www.ecologyandsociety.org/vol11/iss2/art31/.
167. Yu, X. and J. Kacprzyk, 2003. Applied Decision Support with Soft Computing. Berlin, Springer Verlag.
168. Zadeh, L.A., 1965. Fuzzy sets. Information and Control, 8: p. 338-353. 169. Zadeh, L.A., 1975. The concept of a linguistic variable and its application to approximate
reasoning-II. Information Sciences, 8: p. 301-357. 170. Zadeh, L.A., 1978. Fuzzy sets as a basis for a theory of possibility. Fuzzy Sets and Systems,
1: p. 3-28. 171. Zeng, X.-J. and J.A. Keane, 2005. Approximation capabilities of hierarchical fuzzy systems.
IEEE Transactions on Fuzzy Systems, 13(4): p. 656-659. 172. Zimmermann, H.J., 1987. Fuzzy sets, decision making and expert systems. Boston
Dordrecht Lancaster, Kluwer Academic Publishers. pp.335. 173. Zimmermann, H.J., 1991. Fuzzy set theory and its applications. Boston, Kluwer. pp.
399. 174. Zoomers, E.B.A., 1999. Linking livelihood strategies to development. Amsterdam,
KIT-Press. pp. 89.
131
SUMMARY
Views on innovation in farming systems are subject to a major paradigm shift and extension services started using more participatory approaches since the 70ties of the last century. As yet, in common mathematical models of farming systems, farmers’ motivation is merely represented by ‘utility maximisation’, and those models exploring natural resource management tend to aggregate technical data from field to regional scale, neglecting decision-making at farm level. The goal of this thesis was to verify three hypotheses: (1) farmers’ individual motivations can be integrated into a computer model, (2) fuzzy logic provides a suitable tool to model farmers’ decision-making process since it can be used to model linguistic information, and (3) this modelling can improve our understanding of farmers’ decision-making towards mixed farming. We used approaches from the socio-technical regime analysis, the livelihood framework, statistical analysis and computational intelligence, to conceptualise a fuzzy logic model of farmers’ decision-making to integrate farm components. We collected information and gathered data at 72 farm households in three villages of the fresh water alluvial delta and of the hill districts of the Mekong Delta, Vietnam.
Globally, farmers tend to specialise and abandon integrated farming systems, notwithstanding its advantages for sustainability, but the rice-based Vietnamese production systems have diversified into integrated agriculture–aquaculture systems. An important motive for diversification was the desire to improve the livelihoods and the diet of the nuclear families. The strategies related to diversification varied along the nuclear families’ life-course having 5 stages. Off-farm diversification was especially important for a new household. At the onset of expansion, the new mothers replaced off-farm with homebound activities. During expansion the farmers increased virtual farm size by keeping more livestock; during accumulation they invested in land or education, and during consolidation old couples adjusted farm activities to their labour capacity, especially if no successor was on-farm. The farm area and number of farm components providing cash determined the level of cash income from agriculture, being highest for farms with four effective flows of biomass between components. Livestock, including fish, was essential for livelihoods. The distribution by credit or by ’passing-on-the-gift’ of goats, with a short reproduction cycle, a high reproduction rate and a low individual value, instead of cattle, was far more effective for poverty alleviation.
To go beyond utility and to respect other motives farmers have, we tested the use of fuzzy logic models dealing with subjective statements through ‘if–then’ rules. The scientific literature describing expert-driven fuzzy logic models that simulate

Summary _____________________________________________________________
132
decision-making is usually not exhaustive on the methodology applied. To our knowledge fuzzy models integrating human motivations related to farmers’ decision-making, have not been developed. We described and tested a recursive process of 10 steps to develop a hierarchical fuzzy model of human decision-making. Model conceptualisation, variables selection, model structuring, definition of linguistic values, membership functions and rule base were essentially based on around 60% of the data. A larger sample was used to augment the database for calibration and validation; statistical analyses of the data revealed correlations that motivated changes in the model structure and rule base. The model’s performance was measured using individual classification rates.
As a pilot we simulated farmers’ decision-making to opt for no aquaculture or one of four fish-production systems: waste-fed, pellet-fed, rice–fish, and ditch–dike, i.e., fish–fruit. In a reaction to changing market opportunities the farmers developed these systems either after building a homestead, or after raising dikes to improve irrigation and drainage for rice and fruit trees. The decision-making was simulated in a two-level hierarchical decision-tree. The first layer handled the farmer’s production preferences for rice, fruit or fish, with composed variables for land, water, labour, capital and market. The second layer simulated the choice between five options: no fish, and the four alternative fish-production systems. The model allowed practising different aquaculture systems at the same time. The fuzzy model simulated the frequency distribution of most fish production systems accurately, but performed poorly when classifying individual farmers. Using composed variables in the first layer of this pilot decreased its fuzziness; replacing the composed variables with fuzzy rules adds a third layer to the decision-tree.
The proposed improvement was tested by mimicking the decision-making of farmers on their farm composition in a three-layer hierarchical architecture of fuzzy inference systems. Next to technical variables, operational variables representing social motives were implemented in two farmer’s reference frames for integration and for diversification. Next to those, we inferred: attitude towards risk and towards rice food security, main production factors through 17 variables, farmers’ appreciation of market prices and individual farmers’ know-how of 10 activities (rice, fruit, fish, vegetables, upland-crops, large ruminants, goats, pigs, chickens and ducks).
The individual classification rates of the model in the delta were excellent for the land-based activities but low for the livestock activities. More individual motivations need to be assessed to simulate farmers’ drives and motives for integrated farming, especially in relation to the choice of keeping livestock. The model performance on the historical price levels was good, but testing the model on a dataset of the hills showed that the model was context-specific. The sensitivity

________________________________________________________ Summary
133
of the simulated number of farmers cropping rice, to farmers’ rating of importance of having a rice field for food security, was high and affected also fruit and fish. The sensitivity of the model to the social variables determining the diversification and integration was of the same magnitude as sensitivity to market prices and know-how of the activities, but smaller than its sensitivity to labour, capital and land endowment. Farm models that do not include family-related motivations might be less reliable than generally suggested.
The model development was not a straightforward 10 step process: feedback loops were needed after several steps. Developing the model into a decision support tool requires the involvement of the stakeholders, which will increase the recursive nature of the process; the conception of a user interface requires an 11th step. The three layered hierarchical structure, composed of several Mamdani-based fuzzy inference systems, was transparent and thus appropriate for involvement of stakeholders. Sample size for model development should consider the least frequent component. In order to obtain the desired degree of sensitivity to each of the variables, it was necessary to attribute up to five linguistic values, also for some of the input and output variables in the intermediate layers of the HFS; this will make explorative fuzzy models very complex.
Maintaining sustainability of farming systems requires flexibility and continuous learning. As the context in which farmers operate is very dynamic and developing computer based decision support tools for natural resource management is a long process, their development seems more appropriate as learning tools for researchers and policy makers than as strategic decision support tools for farmers.
This thesis demonstrated that the motivations of farmers can be integrated in a model using fuzzy logic and that such models simulate their decision-making. In the Mekong Delta farm diversification and integration are driven by the household labour, rank of well-being, area of the homestead, number of young children, index of integration, household life-course, and level of education and age of household head, in decreasing order. The choice of a component depends strongly on their assets, on their specific know-how and on market opportunities.

134
SAMENVATTING
De inzichten ten aanzien van het vernieuwingsproces van agrarische bedrijven zijn onderhevig aan een paradigma verandering en sinds enkele decennia gebruiken voorlichtingsdiensten meer participatieve methoden. Desalniettemin wordt in wiskundige modellen van bedrijfssystemen de motivatie van de boeren veelal alleen meegenomen als “nut maximalisatie”, en laten modellen die landgebruik op een grotere schaal simuleren de beslissingen op bedrijfsniveau buiten beschouwing en aggregeren de technische gegevens van veld naar regionale schaal. Het doel van dit proefschrift was om drie hypothesen te toetsen: (1) individuele motivaties van boeren kunnen in computer modellen worden opgenomen, (2) ‘fuzzy logic’ is geschikt om het beslissingsproces van boeren te modelleren omdat het taalkundige informatie verwerkt, en (3) een dergelijk model kan ons begrip van de beslissingen van boeren met betrekking tot gemengde bedrijfssystemen verbeteren. We gebruikten methoden van sociaal-technische regime analyse, levensonderhoud strategieën, wiskundige statistiek en de rekenkundige mogelijkheden van de computer, voor het ontwerpen van een ‘fuzzy logic’ model van het beslisproces van boeren om een meerdere componenten in hun bedrijf op te nemen. We verzamelden informatie en gegevens van 144 boerenhuishoudens in drie dorpen in de delta en drie in het heuvel district van de Mekong Delta, Vietnam.
Terwijl wereldwijd boeren specialiseren en de gemengde bedrijfssystemen laten voor wat ze zijn, met hun voordelen ten aanzien van duurzaamheid, zijn in Vietnam de op rijst gebaseerde bedrijfssystemen gediversifieerd tot geïntegreerde landbouw–visteelt systemen. Een belangrijk motief voor deze diversificatie is de wens om de levensomstandigheden en het dieet van de nucleaire huishoudens te verbeteren. De strategieën van diversificatie varieerden met de stadia van de gezinslevensloop van de nucleaire huishoudens. Voor nieuwe huishoudens is inkomsten diversificatie van buiten het landbouwbedrijf belangrijk, maar een aanstaande moeder vervangt deze door woonstee gebonden activiteiten. Zodra de kinderen kunnen meewerken wordt de virtuele bedrijfsomvang vergroot door meer vee te houden en de gegenereerde winst wordt geïnvesteerd in land of onderwijs. De ouderen kiezen activiteiten die passen bij hun werkkracht, vooral als er geen opvolger op het bedrijf is. Het landoppervlak en het aantal bedrijfscomponenten dat bijdraagt aan het geldelijke inkomen, bepalen de hoogte van dit inkomen uit het bedrijf. Het geldelijke inkomen is het hoogste op bedrijven met vier stromen van uitwisseling van biomassa tussen de bedrijfscomponenten. Vee en vis zijn van wezenlijk belang voor het levensonderhoud. Het stimuleren van het houden van geiten i.p.v. koeien, is veel effectiever voor armoede bestrijding, vanwege de korte cyclus, de worpgrootte en de lage individuele waarde.

____________________________________________________ Samenvatting
135
‘Fuzzy logic’ modellen gebruiken ‘als ..., dan’ regels om met subjectieve
uitspraken te rekenen en lijken mede daarom geschikt om motivaties te simuleren. De literatuur over ‘fuzzy logic’ modellen die beslissingen van experts simuleren, beschrijven de toegepaste methodiek veelal niet uitgebreid. Voor zover ons bekend zijn er geen ‘fuzzy logic’ modellen ontwikkelend die basale menselijke motivaties m.b.t. beslissingen simuleren. Daarom beschrijven we een methodologie van 10 stappen voor het ontwikkelen van een ‘fuzzy logic’ model van een beslissingproces. De conceptie van het model, de selectie van variabelen, de structurering van het model, de definitie van taalkundige waarden, bijbehorende lidmaatschapsfuncties en van de verzameling regels, was gebaseerd op ongeveer 60% van de gegevens. De analyse van de gegevens en de conceptie van het beslismodel leidden tot veranderingen in de modelstructuur en de verzameling regels. Voor het afstemmen en valideren van het model zijn meer gegevens verzameld.
Als test simuleerden we de keuze van boeren voor geen, en een of meerdere van de vier volgende visproductie systemen: voeren met afval, voeren met krachtvoer, rijst-vis, en fruit-vis. Als reactie op een veranderende markt hebben boeren deze systemen ontwikkeld ofwel na het verhogen van de woonstede, of na het verhogen van de dijken om irrigatie en drainage van rijstplanten en fruitbomen te verbeteren. Het beslisproces is gesimuleerd met een hiërarchische beslisboom van twee lagen. De eerste laag simuleerde de voorkeuren voor de productie van rijst, fruit of vis, m.b.v. samengestelde variabelen voor land, water, arbeid, kapitaal en de markt. De tweede laag simuleerde de keuze tussen vijf opties: geen vis en de vier alternatieve visproductie systemen. Boeren kunnen meerdere systemen tegelijk hebben. De simulatie van frequentie verdeling van de meeste visproductiesystemen was vrij precies, maar het model was minder goed in de classificatie van individuele boeren. Het gebruik van de samengestelde variabelen in de eerste laag van dit test model verminderde de vaagheid in de modellering; het vervangen van deze samengestelde variabelen met ‘fuzzy logic’ regels maakt een derde laag in de beslisboom nodig.
De voorgestelde verbetering is getest door het simuleren van de beslissing van boeren met betrekking tot hun bedrijfssamenstelling in een hiërarchische structuur met drie lagen van ‘fuzzy logic’ systemen. Behalve technische variabelen, zijn diverse sociale motieven meegenomen via ‘fuzzy logic’ referentie kaders van boeren ten aanzien van diversificatie en integratie. Daarnaast zijn in het model opgenomen: houding t.a.v. investeringsrisico en t.a.v. rijst voor voedselzekerheid, de productie factoren d.m.v. 17 variabelen, de waardering van marktprijzen en de kennis en kunde van individuele boeren’ m.b.t. 10 activiteiten (rijst, vis, fruit, groenten, droge landbouw gewassen, runderen, geiten, varkens, kippen en eenden).

Samenvatting __________________________________________________________
136
De individuele classificatie van boeren in het model voor de delta was uitstekend voor de landgebonden, maar laag voor de veehouderij activiteiten. De prestatie van het model m.b.t. de historische gegevens was goed, maar de test op gegevens van de heuveldistricten liet zien dat het model context specifiek was. De gevoeligheid van het gesimuleerde aantal van rijst verbouwende boeren voor het belang dat deze hechten aan een rijstveld voor de voedselzekerheid, was hoog en beïnvloedde ook fruit en vis. Meer individuele motivaties, vooral met betrekking tot de keuze van het houden van vee, dienen te worden meegenomen in een model om de motivaties en andere beweegredenen van boeren voor gemengde bedrijfssystemen te simuleren. De gevoeligheid van het model voor de sociale variabelen was van dezelfde grootte als de gevoeligheid voor de marktprijzen van de producten en voor kennis en kunde t.a.v. de activiteiten, maar kleiner dan de gevoeligheid voor arbeid, kapitaal and landbezit. Daarom zijn modellen die familie gerelateerde motivaties niet meenemen zijn minder betrouwbaar dan gesuggereerd.
Het ontwikkelen van het model was niet een rechtstreeks proces van 10 stappen: terugkeren naar eerdere stappen was vaak nodig. Het ontwikkelen van een hulpmiddel bij beslissingen verhoogt het aantal terugkeerlussen omdat betrokkenen moeten worden geraadpleegd en maakt een 11de stap nodig voor het ontwerpen van de gebruikers ‘interface’. De hiërarchische structuur van drie lagen samengesteld uit sub-systemen met ‘fuzzy’ regels, was transparant en dus geschikt om betrokkenen te raadplegen. De steekproef voor het ontwikkelen van een model moet gebaseerd worden op het aantal van de minst voorkomende gebeurtenis. In de intermediaire lagen van het model waren tot vijf taalkundige waarden nodig voor sommige input en output variabelen om de gewenste graad van gevoeligheid te verkrijgen; dit zal het gebruik van ‘fuzzy logic’ voor verkennende modellen complex maken.
Het blijvend duurzaam ontwikkelen van landbouw bedrijfssystemen vereist flexibiliteit en voortdurend leren. De context waarin boeren werken is zeer dynamisch en het ontwikkelen van computer hulpmiddelen voor beslissingen t.a.v. het gebruik van natuurlijke hulpbronnen is een lang proces. Vanwege die twee redenen lijkt het ontwikkelen van dergelijke modellen meer geschikt voor leren door wetenschappers en beleidsmakers dan om strategische beslissingen van boeren te ondersteunen. Sociale motivaties van boeren kunnen worden geïntegreerd, en hun beslissingen gesimuleerd met ‘fuzzy logic’ modellen. In de Mekong Delta worden diversificatie en integratie gedreven door, in afnemende belangrijkheid: beschikbare arbeidskracht, inkomenspositie, oppervlak van land en woonstede, het aantal jonge kinderen (als maat voor een sociaal motief), een index van integratie, het stadium in de gezinslevensloop, het opleidingsniveau en de leeftijd van het gezinshoofd. De keuze van een component hangt sterk af van de beschikbare hulpbronnen en van de specifieke kennis en kunde, en markt kansen.

137
BRIEF BIOGRAPHY OF ROEL H. BOSMA
Born on 8 May 1953 in the hamlet Finkebourren, commune Doniawerstal, province Fryslân, the Netherlands, Roel followed his elementary and primary school in Sint Nicolaasga, also after the family had moved to Spannenburch. From this hamlet in the village of Tsjerkgaest he frequented the secondary school in Bolswert until 1972, when he moved to Wageningen. Still, he kept in touch with ‘it heitelân’ to skate in winter and to keep the village’s summer festival going, with his mates. Roel was active in various student associations and coached rowing teams. He was in Ivory Coast (Korhogo) for his internship and a thesis. In 1979 he graduated MSc in Tropical Animal Husbandry at Wageningen University (WU).
After graduation, he served 18 years in two West Africa countries on long term contracts for the Dutch volunteers (SNV), the University of Groningen, the Royal Tropical Institute (KIT), and the Dutch ministry of Development Cooperation. In Burkina Faso he lived in the villages Markoye and Toma, and with his household in the towns Ouagadougou and Koudougou; in Mali they stayed in Sikasso. He acquired experience with participatory development of livestock husbandry, dairy development, farmers training, farming systems research and university education. All along he edited sector development plans for Dutch embassy, published results of research and development in a book and in refereed journals, and presented results at congresses. In 1999 he returned to the Netherlands with his former spouse, a son and a daughter. At present he lives in Bennekom, Netherlands, with his son and at times his daughter.
From 2000 to 2003, he had short term contracts at the WU chairgroup Animal Production Systems to assist in the development of new courses and at the CIAT-office in Los Baños to assess the socio-economic benefits of new forage technologies in Indonesia, Philippines and Vietnam. Since January 2003, he is researcher at the WU chairgroup Aquaculture and Fisheries, where he managed the INREF-POND and POND-LIVE projects. He was the corresponding co-editor of the book ‘Fish-ponds in Farming systems’, putting the results of the mentioned projects in a broader context. In June 2003 he started his PhD research at the WIAS graduate school with fieldwork in the Mekong Delta, Vietnam. At present he manages the NUFFIC/NPT/Ben/183 and WU/INREF-RESCOPAR projects, for which he travels frequently to Benin, Indonesia and Vietnam, and is occasionally available for consultancies.

Authors’ biography ________________________________________________
138
List of authors' publications (non related to this thesis)
Books van der Zijpp AJ, JA.J Verreth, Le Quang Tri, MEF van Mensvoort, RH Bosma, MCM
Beveridge (Eds), 2007. Fish ponds in farming systems. Wageningen Academic Publishers, 311pp.
Bosma RH, K Bengaly, M Traoré, ACW Roeleveld, 1996. L’élevage en voie d’intensification. Synthèse de la recherche sur les ruminants dans les exploitations agricoles mixtes au Mali-sud. KIT, Amsterdam; IER, Mali, 202pp.
Papers in peer-reviewed journals Verdegem MCJ & RH Bosma, forthcoming. Water withdrawal for brackish and inland
aquaculture and options to produce more fish in ponds with present water use. Water Resource Management.
Phong L.T., H.M.J. Udo, M.E.F. Van Mensvoort, R.H. Bosma, L.Q. Tri, D.K. Nhan, A.J. vd Zijpp, forthcoming. Trends in IAA-systems in the VMD: Diversification, Specialization and Intensification. Asian Journal of Agriculture and Development.
Nhan DK, LT Phong, M Verdegem, LT Duong, RH Bosma, DC Little, 2007. Integrated freshwater aquaculture, crop and livestock production in the Mekong Delta, Vietnam: determinants and the role of the pond. Agricultural Systems 94: 445-458.
Bosma RH, HFJ Savelkoul, K Frankena, T Baars, E Laarakker, 2006. Dairy herd health, impedance on six acupuncture points and immune response factors in milk: a pilot study. Short communication in: Livestock Production Science 99 (2006) 285-290.
Verdegem MCJ, RH Bosma, JAJ Verreth, 2006. Reducing water use for animal production through aquaculture. Water Resources Development, 22 (1) 101–113.
Sidibé M, H Boly, T Lakouetené, P Leroy, RH Bosma, 2004. Characteristics of peri-urban dairy herds of Bobo-Dioulasso (Burkina Faso). Trop. Animal Health & Prod. 36 (1) 95-100.
Bosma RH, M Bos M, S Kanté, K Kébé, W Quak, 1999. The promising impact of ley introduction and herd expansion on soil organic matter content in Southern Mali. Agricultural Systems, 91, 1-15.
Bosma RH & MZ Bicaba, 1997. Effect of addition of leaves from Combretum aculeatum and Leucaena leucocephala on digestion of Sorghum stover by sheep and goats. Small Ruminant Research 24 (1997) 167-173.
Bosma RH, A Dembele, I Kanté, 1997. Contribution de la stabulation saisonnière des bovins à la durabilité du système de production agricole du Mali Sud. Sécheresse 8, 7-12.

________________________________________________ Authors’ biography
139
Bicaba ZM, RH Bosma, G Macon, SM Saba, SJ Zoundi, 1986. Etude de la croissance compensatrice chez des zébus au Burkina. Analyse comparative après divers degrés de sous-nutrition. Rev.Elev.Méd.Vét.Pays Trop, 39 (3-4) 415-420.
Chapters in books, papers/abstracts in conferences proceedings, and revues Bosma RH & Syafei Sidik, 2007. Aquaculture or failed goldrush: situation analysis of the mangrove
ecosystem and the related community livelihoods in Muara-Badak, Mahakam delta, East Kalimantan Indonesia. WAS-APA, Hanoi, 5-8/08.
Phong LT, HMJ Udo, J Jansen, RH Bosma, AJ van der Zijpp, 2007. Resilience of smallholders: impact of Avian Influenza on mixed farming systems in the Mekong Delta, Vietnam. In: Camus E, et al 2007. Proc. of 12th AITVM, Mont Pellier, France, pp 383-387.
Bosma RH, RHR Bijnens, D Harting, Tran Thanh Be, 2007. Extension services and market integration of small farmers: case studies of INVE and VN-Dutch Lady in Viet Nam. In: Zijpp AJ et al., 2007, pp253-259.
Verreth JAJ, RH Bosma, MCM Beveridge, Le Quang Tri, MEF van Mensvoort, AJ van der Zijpp, 2007. Strategies to enhance the role of fishponds on farming systems. In: Zijpp AJ et al., 2007, pp295-303.
Arjinkit C, RH Bosma, Danai Turongrouang, D Little, MCJ Verdegem, 2006. On-farm trials of improved nursing and fattening sex-reversed gift tilapia in Sisaket province, Northeast Thailand. WAS 2006, Firenze 5-10 May.
Bosma RH, LC Zongo, Aïssata Sané, Chantal Zoungrana, A Soudré, 2004. Comparaison participatoire de trois méthodes d'engraissement des porcs dans les provinces du Sanguié et du Boulkiemdé au Burkina Faso. Livestock Research for Rural Development, Vol. 16, Art.#10. Retrieved 5-12 2004, http://www.cipav.org.co/lrrd/lrrd16/2/bosm1602.htm.
Bosma RH, R Serme, LR Zongo, 1999. La production ovine dans les provinces du Bulkiemdé et du Sanguié (Burkina Faso) : diagnostic participatif et expérimentation paysanne. In: Renard G, S Krieg S, P Lawrence et M von Oppen: Farmers and scientist in a changing environment, Proc. Conf. 22-26 February Bénin.
Bosma RH, K Bengaly, CBH Meurs, D Diabaté, B Sanogo, S Bagayoko, 1996. The role of monitoring cattle and small ruminant productivity in livestock diagnostic studies: Southern Mali. In : Roeleveld ACW et A van den Broek, 1996. Focussing livestock systems research. KIT/Amsterdam, DRSPR/IER/Sikasso, Mali.
Bosma RH, Dioura H, Bagayogo S, Bengaly K, 1996. Analyse économique et facteurs d’adoption de la complémentation des boeufs de traction au Mali. Ann Zootech (1996) 45, Suppl, 133. Proc. IVth Inter-national Symposium on the Nutrition of Herbivores (ISNH), Montpellier, 11-16 September 1995.

Authors’ biography ________________________________________________
140
Bosma, RH, Bagayogo S, 1996. L'addition des tourteaux de coton dans les blocs mélasse-urée. Ann. Zootech (1996) 45, Suppl, 123. Proc. IVth ISNH, Montpellier, 11-16/09/1995.
Bosma RH, H Dioura, S Bagayogo, 1996. Analyse économique et facteurs d’adoption de la complémentation et de la stabulation saisonnière des boeufs de traction au Mali-Sud. 2nd Symp. Int. de l’Ass. Africaine de Recherche sur les Systèmes de Production, la Vulgarisation et la Formation, 20-23 August, Ouagadougou.
Bosma RH, Bengaly M'pie, T Defoer, 1993. Pour un système de production durable : augmenter le bétail. Le rôle des ruminants au Mali-Sud, dans le maintien du taux de matière organique dans les sols. In : Powel JM, S Fernandez-Rivera, TO Willams, C Renard, 1995. Livestock and sustainable nutrients cycling in mixed farming of Sub-Saharan Africa. Conf. Proc., ILCA, 22-26 November 1993, Addis Abeba.
Meurs CBH, RH Bosma, WML Berckmoes, K Bengaly, 1993. Le diagnostic de l'élevage caprin au Mali-sud : Analyse des résultats et de la méthodologie. In Ayeni AO and Bosman HG. Goat Production in the Humid Tropics. Proc. workshop Ile-Ife, 6-9 July, 1992. pp 138-145.
Fomba B & RH Bosma, 1994. Introduction des soles fouragères de Stylosanthes hamata dans les exploitations agricoles au Mali-sud. In: Leeuw PN de, MR Mohamed-Saleem, AM Nyamu. Stylosanthes as a forage and fallow crop. Proc. Workshop in Kaduna, 26-31 Oct. 1992.
Bosma RH, 1986. Une tentative de démocratisation du Service d'Elevage (vétérinaire villageois bénévole). Vraagbaak/Source TA, vol.14 (2) 17-26.
Main reports Bosma RH, RL Roothaert; P Asis, J Saguinhon, LH Binh, VH Yen, 2003. Economic and
social benefits of new forage technologies in Mindanao, Philippines and Tuyen Quang, Vietnam. CIAT Working Document No. 191. CIAT, Los Baños, Philippines, 92pp.
Bosma RH, RL Roothaert, Ibrahim. 2001. Economic and social benefits of new forage technologies in East Kalimantan, Indonesia. CIAT Working Doc. No. 190. CIAT, Los Banos, Philippines, 61pp.
Bosma RH, N Wit, R van der Scheer, 1989. Culture Attelée au Burkina Faso: Bilan et Perspectives. Amb. Roy. Pays Bas, Ouagadougou.
Bosma RH & G van der Land (ed), 1988. Reflexions sur le secteur Elevage au Burkina Faso. Ambassade Royale des Pays Bas, Ouagadougou.

141
TRAINING
AND SUPERVISION PLAN
OF THE GRADUATE SCHOOL WIAS

Completed Training and Supervision Plan ____________________________________
142
Name GroupDaily supervisorSupervisor(s) Prof. Dr. J. VerrethCo-supervisors Dr. ir. J. van den Berg and Dr ir. Uzay Kaymak AdvisorProject term from 01-09-2003 until 2007Submitted Octobre 2003
Year ECTS2003 1.52004 1.5
3.0
2003 0.62003 0.62004 0.92004 0.920052005 0.92006 0.62006 0.62006 0.92007 0.6
2003 0.3Linking Participatory Practice and Governance – Challenges for a Learning Society, IAC 2003 0.3
2002 0.5
2003 1.0
2003 1.0
2004 1.0
2005 1.0
2005 1.0
2006 1.0
2006 1.0
2006 1.0
2006 0.5
2007 1.015.0Subtotal International Exposure
Motivation of farmers in the Vietnamese Mekong Delta to integrate aquaculture in their production system. Poster at 11th AAAP, 5-9 Sept. Kuala Lumpur.
Bosma, Cao Quoc Nam, Udo and Verreth, 2004. Don't accumulate but integrate farm components for higher profits. Oral at AHAT-BSAS, Khon Kaen, 14-18 Nov.
Benefits of New Forage Technologies for Sustainable Land Use and Poverty Allevation. ETH Zurich 27-29 april 2005, Abstracts parallel Sessions, p46.
Trade matters: the export of dairy products to Burkina Faso and Tanzania. 'Biodiversiteit an Internationale Handel', Both Ends & IUCN, Den Haag, 26-03
Assessing farmers’ motives for livelihood diversification in the Mekong Delta: household life cycle, virtual farm size, and index of integration. Can Tho, 2006.Using fuzzy logic to simulate the composition of farming systems in the Mekong Delta, Orally presented at 4th ISTAP, Yogyakarta, 8-9 November 2006.
Aquaculture or failed goldrush: analysis of the mangrove ecosystem and the community livelihoods in Mahakam delta, Indonesia. WAS-APA, Hanoi, 5-8 August
Subtotal Basic Package
Dynamics of smallholder farming with particular emphasis on Kenya Highlands
AHAT-BSAS International Conference, 15-18 November 2005, Khon Kaen, ThailandFishponds in Farming Systems held in Can Tho City, 28-30 April 20064th ISTAP, Yogyakarta, 8-9 November 2006
Seminars and workshops
Scientific Exposure (conferences, seminars and presentations)
Water and Food Forum, Vientiane, 12-17 November 2006
ARD: European Responses to Changing Global Needs, ETH Zurich 27-29 april 2005
Dr. ir. Henk Udo
Certificate Septembre 2007
Training and Supervision Plan Graduate School WIASRoel H. BOSMAAquaculture and Fisheries
Prof.Dr.ir. L. de Visser
Water withdrawal for brackish and inland aquaculture and options to produce more fish in ponds with present water use. Water and Food Forum, Vientiane, 12-17/ 11
International conferences
11th Int. Conf. of Australian Asian Animal Prod. Societies, Malaysia, 30/ 08-3/ 097th Asian Fisheries Forum in Penang, Malaysia, November 30 to December 4, 2004
Integrated Irrigation and Aquaculture in West Africa, Bamako, 4-7/ 11/ 2003Aquaculture and Urbanisation in Africa, DFID, Abbassa, Egypt, 29/ 09 – 1/ 10 2003
WIAS Introduction Course (mandatory, 1.5 credits)The Basic Package
Course on philosophy of science and/ or ethics (mandatory, 1.5 credits)
Dairy cattle, not only FPCM. Introducing western breeds in LDCs, DIO/ VSF, 24-10
Prospering from Dynamic Growth, Asian Pacific Aquaculture, 5-8 August, Hanoi
WUR networks and the role of Inref-Pond in Integrated Irrigation Aquaculture in West Africa; FAO/ WARDA workshop, Bamako, 4-7 November 2003.Adoption of Livestock-Fish-Crop Systems: Simulating Farmers’ Motivations in Viet Nam and Exploration for Sub-Saharan Africa; DFID, Abbassa, Egypt.
Presentations

_______________________________ Completed Training and Supervision Plan
143
Year ECTS
2004 0.9
Advanced Statistics (Design of Animal Experiments), 21-23 September 2005 2005 1.0Media training for PhD students 2005 1.0Advanced Regression analysis, Centre of Biostatics University Utrecht, 28-29/ 09 2006 0.6Longitudinal data and repeated measurements, Centre of Biostatics UU, 19-20/ 10 2006 0.6
2003 3.07.1
2004 2.22003 0.6
Scientific publishing, an introduction 2004 0.33.1
2003 6.0Endnote introduction (31-03-2006) and advanced (12/ 10/ 2006) 2004 0.3
2002 4.010.3
2003 2.0
2003 1.0
2002 1.52003 1.5
Cyrus Magiria 2006 1.5
2004&6 1.08.5
2006 6.02007 1.0
on-going 4.011.058.0
In-Depth Studies (minimum 6 credits, of which minimum 4 at PhD level)
Organisation of seminars and courses
Course Techniques for Scientific Writing, CENTACourse Supervising MSc thesis work (advised when supervising MSc students)
Advanced statistics courses (optional)
MSc level courses (only in case of deficiencies)Computional Intelligence (FEW2077) Erasmus UniversiteitSubtotal In-Depth Studies
Education and Training Total (minimum 30, maximum 60 credits)
Symposium INREF-POND (April 2006) and proceedings (March 2007)
Membership of boards and committeesWorkshops and web forum: Climate change and West Africa, 5-04 and 8-05
Board Stichting NEDWORC (2004-2005) and Vereniging NEDWORC (2003 - Subtotal Management Skills Training
Gonny van HelvoirtSupervising MSc theses Plant Dier Mens Milieu, Biological Production Systems
Management Skills Training (optional)Subtotal Didactic Skills TrainingSustainable Food Security: Aquaplaya
Debby de Groot and Shirley van de Ven
Tutorship
Supervising practicals and excursions
Didactic Skills Training Lecturing
WISI - experimenting new diagnostic parameters for dairy cattle health
CERES summerschool: Exploring the Future of Resource Dynamics, 28-06 to 2-08Disciplinary and interdisciplinary courses
Plant Dier Mens Milieu, Analyse Bedrijfssystemen, Biological Production Systems, Issues & Options, Sustainable Food Security
Research Skills TrainingPreparing own PhD research proposal
Special research assignments (apart from PhD project)
Subtotal Research Skills Training
Subtotal Professional Skills Support Courses
Professional Skills Support Courses (minimum 3 credits)

144
ACKNOWLEDGEMENTS
I wish to thank the farmers and Village People Committees of An Phu, An Thanh, Cai Be, O Mon and Tam Binh for their kind collaboration and hospitality. I am obliged to Mr. Cao Quoc Nam and Mr. Phan Minh Duc, from Can Tho University, Vietnam, for assisting in the fieldwork and interviewing the farmers. I also acknowledge Dr. Le Quang Tri, Dr. Tran Thanh Bê, Dr. Dang Kieu Nhan and ‘teacher’ Le Thanh Phong from Can Tho University for their advice and support in organizing the field work. Joy Burroughs advised on the English of chapters 2, 3, 4 and 5, and Hillary van der Starre of the other sections.
The field-work of this study was funded by the INREF-POND programme from the Interdisciplinary Research and Education Fund (INREF) of Wageningen University. INREF-POND and the European Commission, through the related POND-LIVE project (ICA4-CT2001-10026), funded part of the time spent on modelling, editing, and presenting the papers. We gratefully acknowledge Dr. Hans Komen and Dr. Marc Verdegem, initiators of the INREF-POND and POND-LIVE projects for their trust and assistance.
Mijn dagelijkse begeleider, Henk Udo, heeft een grote rol gespeeld in mijn leerweg aan de Wageningen Universiteit; al tijdens mijn MSc studie deed ik een vak bij hem en ik ben hem dankbaar voor zijn ondersteuning en aanmoediging. Vele anderen hebben een rol gespeeld, voor tijdens en na mijn loopbaan in West-Afrika; laat mij in het bijzonder de namen vermelden van: Alice Toé, Gerard Slenders, Hans en Marike van Binsbergen, Govert Bus, Paul Kleene, Margo Kooijman, Lex Roeleveld, Boly Djaye, Jean S. Zoundi, Lamoussa Zongo, Nico en Rita de Ridder, Herman van Keulen, Henk Mol, Ruerd Ruben, Jaap van Bruchem, en Akke van der Zijpp. Mijn hartelijke dank gaat ook naar de kollega’s van Dierwetenschappen, Aquacultuur en Visserij en met name naar mijn promotor Johan Verreth, en ‘last but not least’, naar de co-promoteren Jan van den Berg en Uzay Kaymak: zonder jullie begrip en inzet was het misschien een echte ‘deadline’ geworden.
Sûnder it begrip en de leafde fan soan Eelke en dochter Laetitia, brourren, susters, sweagers en skoansusters, freonen en freondinnen wie’t fêst net slagge om my sa faak ôf te sluten by de kompjûter. Myn tankberens giet foaral út nei myn mem Yfke en myn ferstoane heit Eelke, man fan Spannenburch; se hawwe faak begryp toand en my altyd stipe en leafde joun.