USING EARTHQUAKE SCIENCE TO PREDICT EARTHQUAKE HAZARDS AND REDUCE EARTHQUAKE RISKS: USING WHAT WE...
36
USING EARTHQUAKE SCIENCE TO PREDICT EARTHQUAKE HAZARDS AND REDUCE EARTHQUAKE RISKS: USING WHAT WE KNOW AND RECOGNIZING WHAT WE DON’T Seth Stein Department of Earth & Planetary Sciences Northwestern University [email protected] http://www.earth.northwestern.edu/people/seth/ Export/CEA
-
Upload
raina-swindall -
Category
Documents
-
view
215 -
download
0
Transcript of USING EARTHQUAKE SCIENCE TO PREDICT EARTHQUAKE HAZARDS AND REDUCE EARTHQUAKE RISKS: USING WHAT WE...
USING EARTHQUAKE SCIENCE TO PREDICT EARTHQUAKE HAZARDS AND
REDUCE EARTHQUAKE RISKS:
USING WHAT WE KNOW AND RECOGNIZING WHAT WE DON’T
Seth SteinDepartment of Earth & Planetary Sciences
Northwestern [email protected]
http://www.earth.northwestern.edu/people/seth/Export/CEA

Sources

WE CAN HAVE AS MUCH SEISMIC SAFETY AS WE WANT TO PAY FOR
But it takes resources away from other needs
Need to understand earthquake hazards and risks to decide what to do
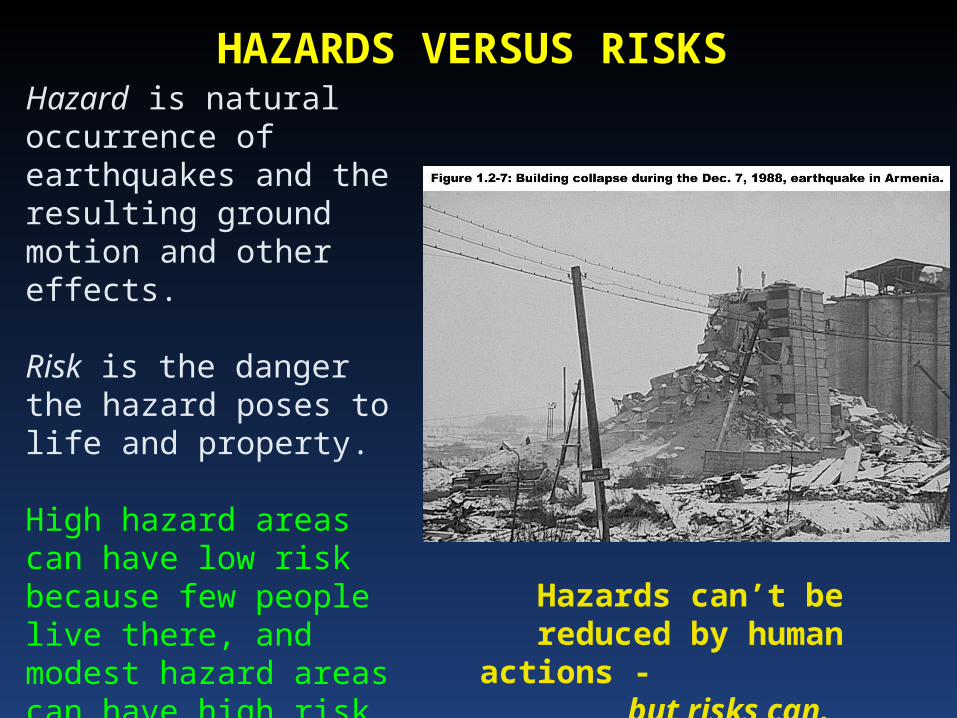
Hazard is natural occurrence of earthquakes and the resulting ground motion and other effects.
Risk is the danger the hazard poses to life and property.
High hazard areas can have low risk because few people live there, and modest hazard areas can have high risk due to large populations and poor construction.
Hazards can’t be reduced by human actions -
but risks can.
HAZARDS VERSUS RISKS

Newman et al., 2001
Seismic hazard - predicted shaking - is not something we
measure or know
We define it on policy grounds
We predict it based on what we think happened in the
past and what will happen in the future
Different assumptions predict
very different hazards

$100M seismic retrofit of Memphis hospital, removing nine floors,
bringing it to California standard
Does this make sense?
How can we help society decide?
Mitigating hazard (reducing risk) from earthquakes or other natural disasters involves economic and policy issues as well as scientific
and engineering ones.

Systems Analysis for Hazard Mitigation
What’s the hazard?What do we know & not know?
What are we trying to accomplish?What strategies are available?
What are the costs & benefits of each?What is an optimum strategy given
uncertainty?
Our goal is to decide how much is enough.
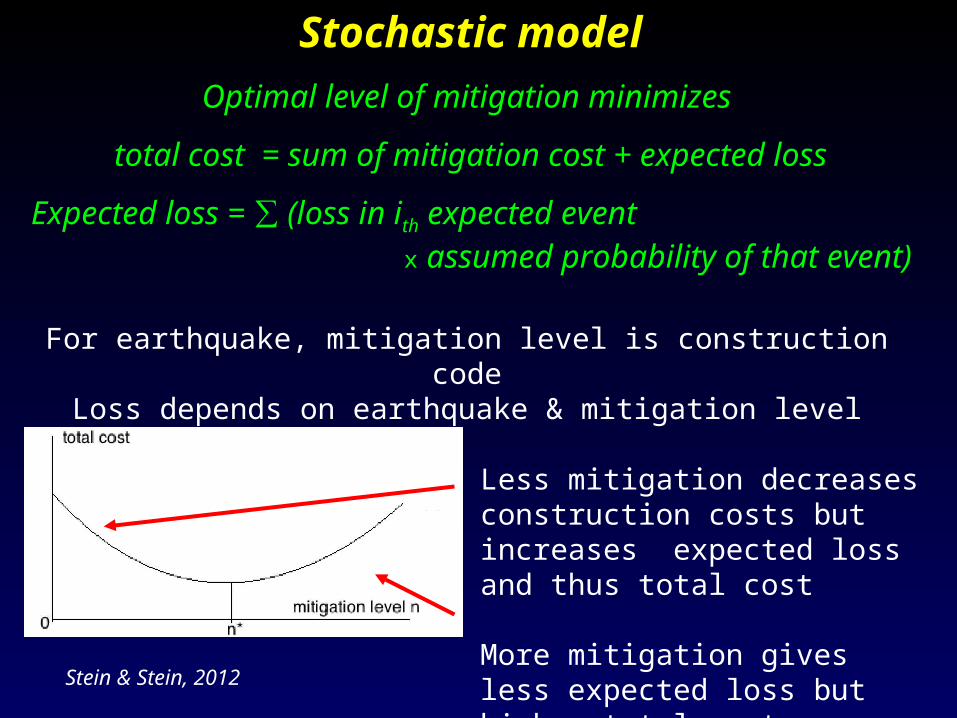
Stochastic model
Optimal level of mitigation minimizes
total cost = sum of mitigation cost + expected loss
Expected loss = ∑ (loss in ith expected event x assumed probability of that event)
Less mitigation decreases construction costs but increases expected loss and thus total cost
More mitigation gives less expected loss but higher total cost
Stein & Stein, 2012
For earthquake, mitigation level is construction codeLoss depends on earthquake & mitigation level
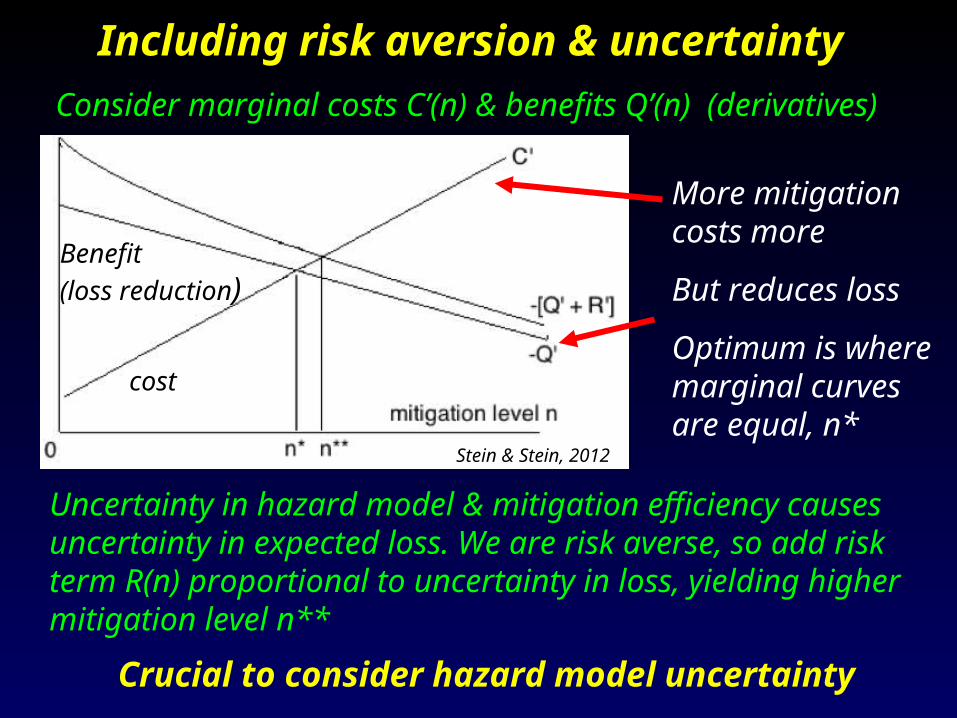
Including risk aversion & uncertainty
Consider marginal costs C’(n) & benefits Q’(n) (derivatives)
More mitigation costs more
But reduces loss
Optimum is where marginal curves are equal, n*
Uncertainty in hazard model & mitigation efficiency causes uncertainty in expected loss. We are risk averse, so add risk term R(n) proportional to uncertainty in loss, yielding higher mitigation level n**
Crucial to consider hazard model uncertainty
cost
Benefit
(loss reduction)
Stein & Stein, 2012

QUESTIONS:
1) Why is predicting earthquake (or other natural) hazards so hard?
2) How does the challenge differ between plate boundary, plate boundary zone, and intraplate earthquakes?
3) What are the difficulties in hazard mapping?
4) What are the issues in cost-effective hazard mitigation policy?
Some US experience may be useful in China
TOPIC 1:
Why is predicting earthquake (or other natural) hazards so hard?

We have learned a lot about earthquakes, but
In general, we have not done well at short-term predictions (narrow window
in space and time)
We do better at long-term forecasting, because of the wider window in space
and time, but often fail

WANT TO AVOID
False negative - unpredicted hazard
Fail to identify & prepare for real hazard
False positive - overpredicted hazard
Waste resources, public loses confidence

PREDICTING HAZARDS IS HARD BECAUSE
Scientific issues
- The earth is complicated
-There’s a lot we don’t know
Human issues
- Often we know less than we think we do
- We interpret data to fit wrong models
PREDICTING HAZARDS IS HARD BECAUSE
Scientific issues
- The earth is complicated
-There’s a lot we don’t know
- No adequate theory
- Rare events
- Short time history

Bulge was an artifact of errors in referring the vertical
motions to sea level via a traverse across the San
Gabriel mountains.
Davidson et al 2002
USGS director McKelvey expressed his view that a great earthquake would occur in the area possibly within the next decade that might cause up to 12,000 deaths, 48,000 serious injuries, 40,000 damaged buildings, and up to $25 billion in damage.
PALMDALE BULGE UPLIFT
1975
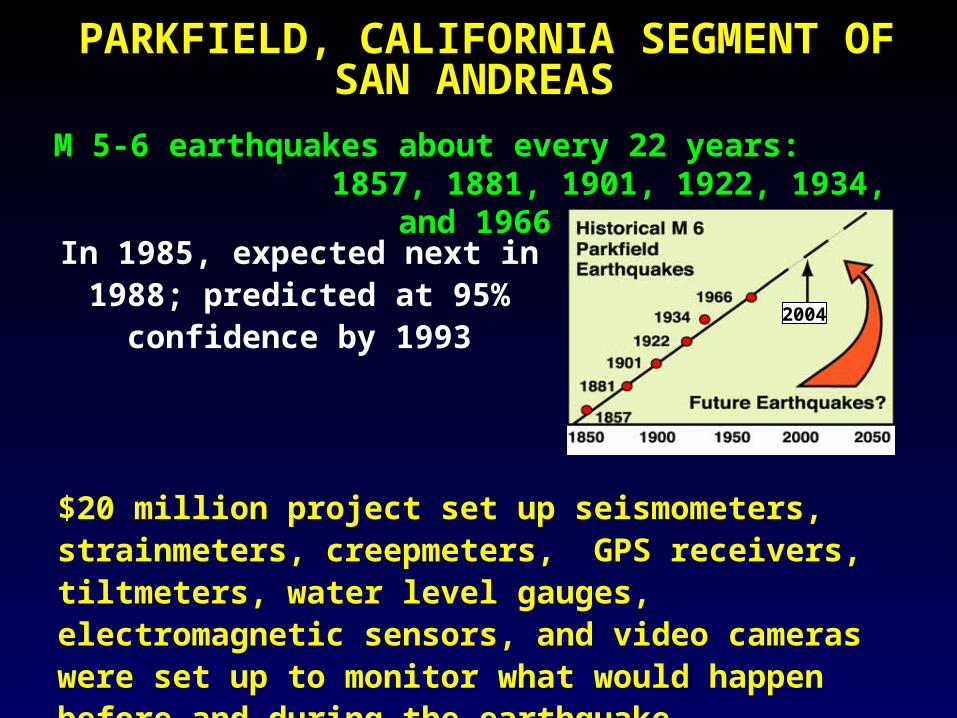
PARKFIELD, CALIFORNIA SEGMENT OF SAN ANDREAS
In 1985, expected next in 1988; predicted at 95% confidence by
1993
M 5-6 earthquakes about every 22 years: 1857, 1881, 1901, 1922, 1934, and 1966
2004
$20 million project set up seismometers, strainmeters, creepmeters, GPS receivers, tiltmeters, water level gauges, electromagnetic sensors, and video cameras were set up to monitor what would happen before and during the earthquake.

In 1985, expected next in 1988; predicted at 95% confidence by
1993Didn’t occur till 2004
(16 years late)
Poor statistics: shifted 1934 event to improve fit & hence reduce uncertainty
2004

So far, no clear evidence for observable behavior before earthquakes.
Maybe lots of tiny earthquakes happen frequently, but only a few grow by random process to large earthquakes
In chaos theory, small perturbations can have unpredictable large effects - flap of a butterfly's wings in
Brazil might set off a tornado in Texas
WHY SHORT-TERM PREDICTIONS DO POORLY

AAA simple
example of chaos
Consider a system whose evolution in time
is described by the equation
x(t+1) = 2x(t)2-1
Runs starting off at time t=0 with slightly
different values, x(0) = 0.750 and x(0) = 0.749, yield curves that differ significantly within a
short time.
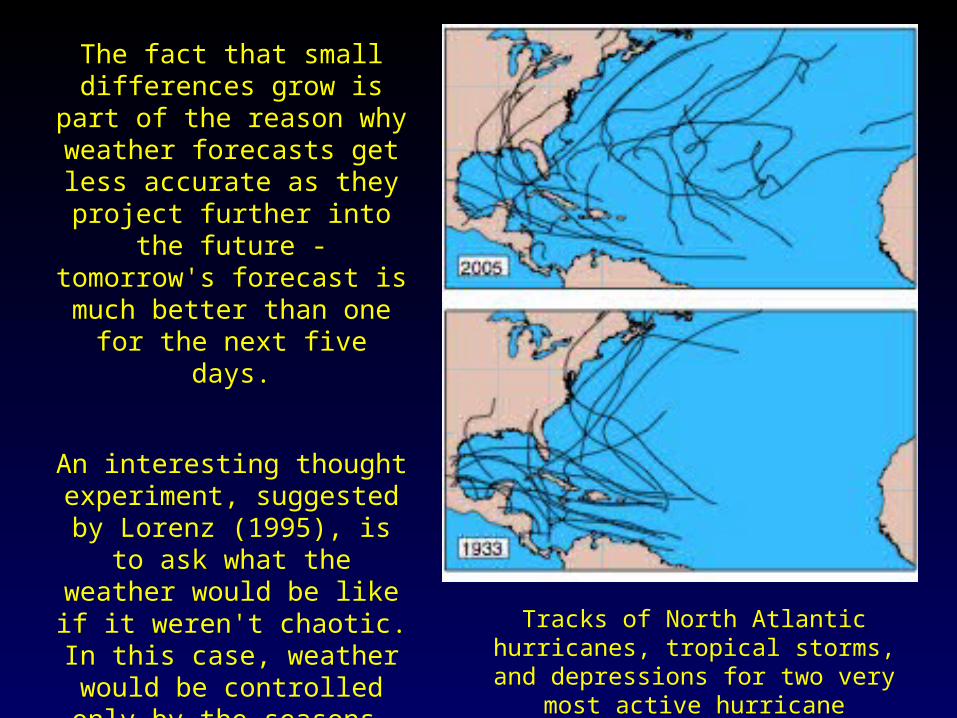
The fact that small differences grow is part of the reason why
weather forecasts get less accurate as they project further
into the future - tomorrow's forecast is much better than one
for the next five days.
An interesting thought experiment, suggested by Lorenz (1995), is to ask what the weather would be like if it weren't chaotic.
In this case, weather would be controlled only by the seasons, so
year after year storms would follow the same tracks, making planning to avoid storm damage easy. In reality, storms are very
different from year to year
Tracks of North Atlantic hurricanes,
tropical storms, and depressions for two very most active hurricane seasons
If there’s nothing special about the tiny earthquakes that happen to grow into large
ones, the time between large earthquakes and their locations are highly variable and nothing
observable happens before them.
If so, earthquake prediction is either impossible or nearly so.
“It’s hard to predict earthquakes, especially before they happen”
WHY SHORT-TERM PREDICTIONS DO POORLY
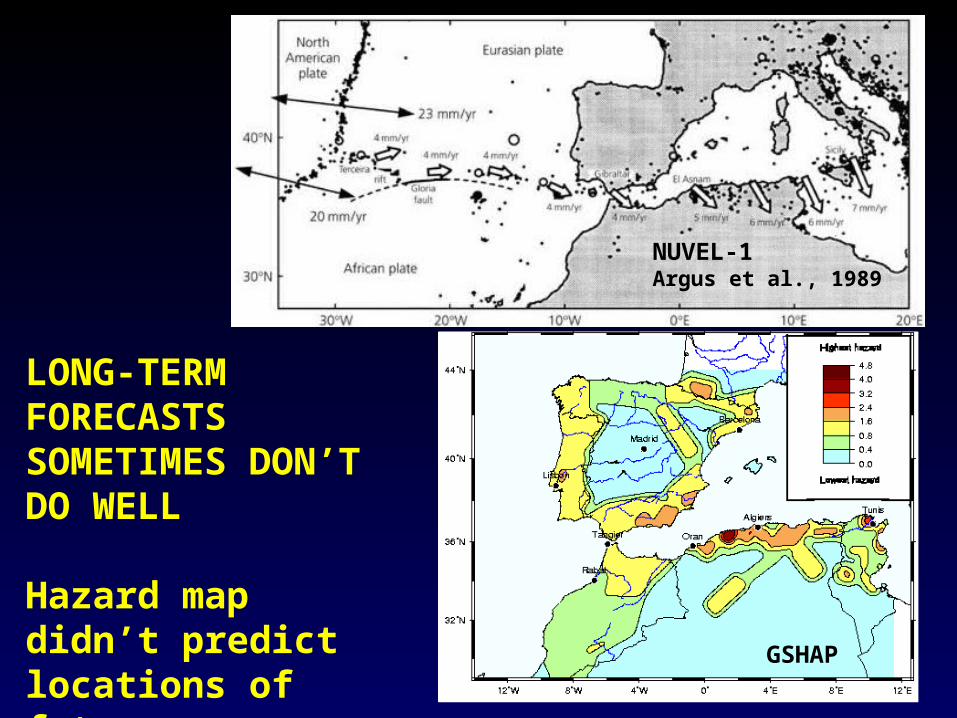
LONG-TERM FORECASTS SOMETIMES DON’T DO WELL
Hazard map didn’t predict locations of future earthquakes
GSHAP
NUVEL-1Argus et al., 1989

GSHAP 1998
NUVEL-1Argus et al., 1989
2004
2003
LONG-TERM FORECASTS SOMETIMES DON’T DO WELL
Hazard map didn’t predict locations of future earthquakes

Years # of recurrence events time100 1 100
500 11 45
1000 20 50
2000 35 57
3000 56 54
4000 73 55
5oW 10oE Latitude
M > 7
PROBLEM: HAZARDMAP BASED ON LAST EARTHQUAKES
When recurrence time is long,short record
shows apparent
seismic gaps & high hazard
zones even if hazard
is uniformSwafford & Stein, 2007
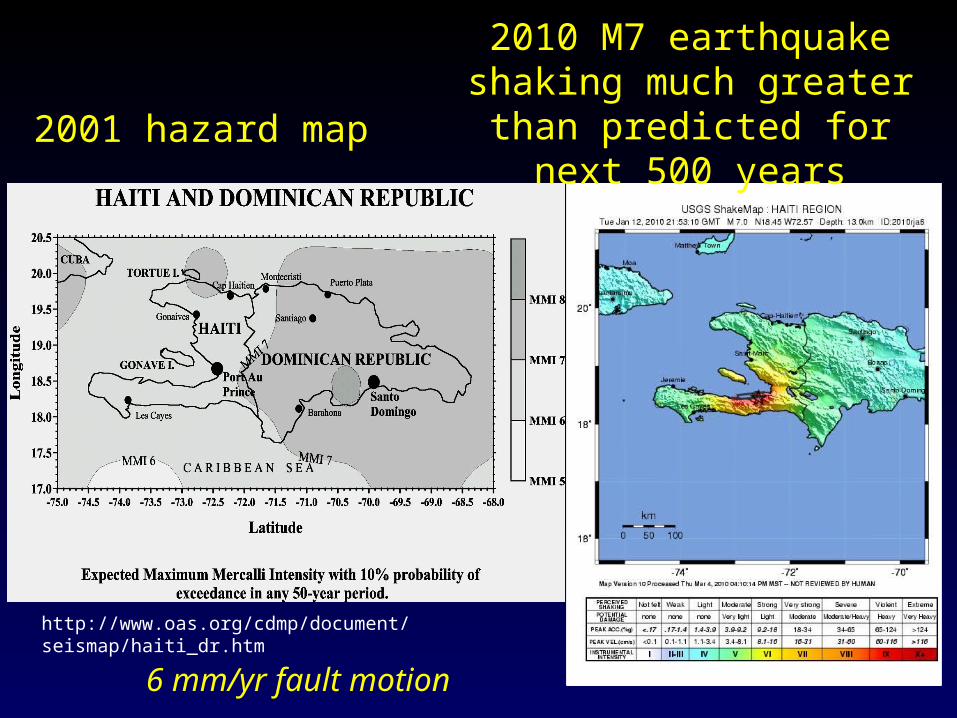
2001 hazard map
http://www.oas.org/cdmp/document/seismap/haiti_dr.htm
2010 M7 earthquake shaking much greater than predicted
for next 500 years
6 mm/yr fault motion
USGS
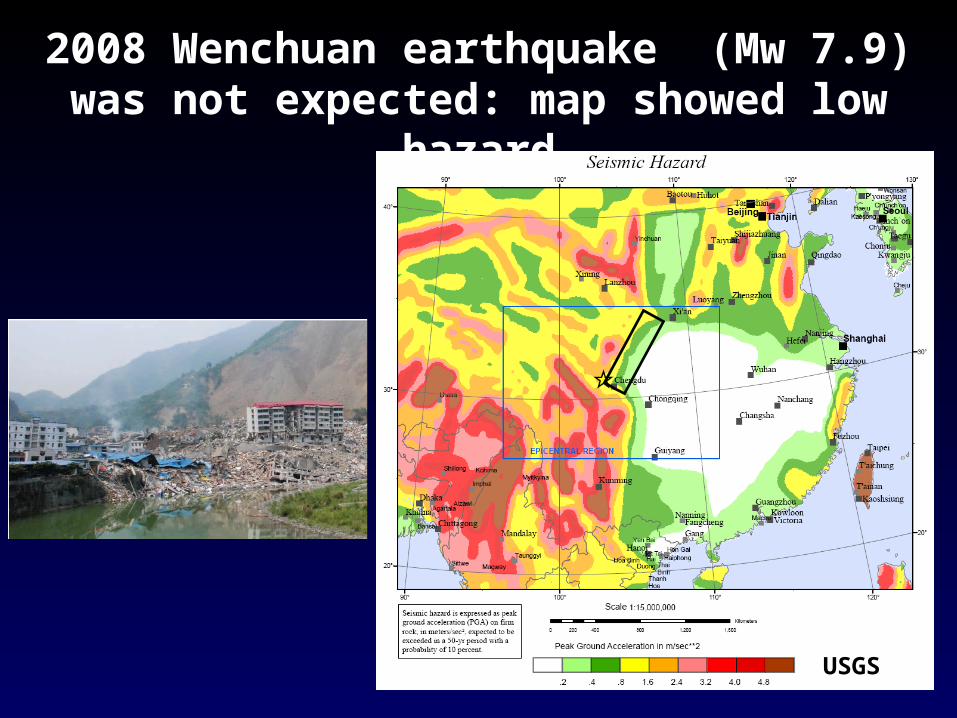
2008 Wenchuan earthquake (Mw 7.9) was not expected: map showed low hazard

Hazard map - assumed steady state - relied on lack of recent seismicity
Didn’t use GPS data showing 1-2 mm/yr
Earthquakes prior to the 2008 Wenchuan event
Aftershocks of the Wenchuan event delineating the rupture zone M. Liu

Japan seemed ideal for hazard mapping
Fast moving (80 mm/yr ) & seismically very active plate boundary with good instrumentation & long seismic history
But: 2011 M 9.1 Tohoku, 1995 Kobe M 7.3 & others in areas mapped as low hazard
In contrast: map assumed high hazard in Tokai “gap”
Geller 2011

Tsunami runup approximately twice fault
slip (Plafker, Okal & Synolakis 2004)
M9 generates much larger tsunami
Planning assumed maximum magnitude 8 Seawalls 5-10 m high
CNN
NYTStein & Okal, 2011
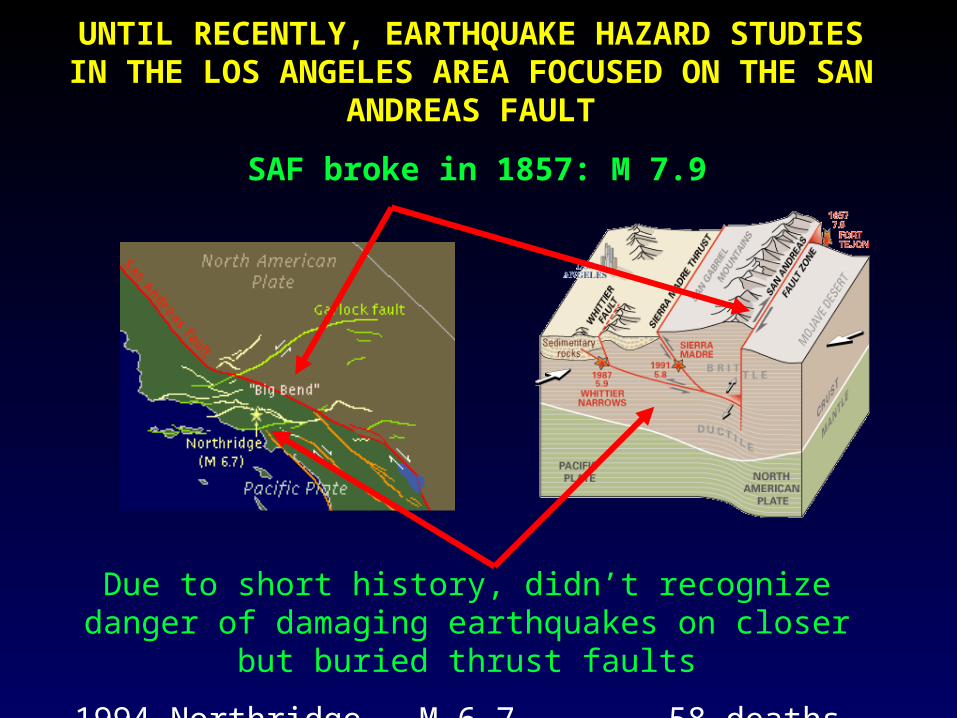
Due to short history, didn’t recognize danger of damaging earthquakes on closer but buried thrust faults
1994 Northridge M 6.7 58 deaths, $20B damage
UNTIL RECENTLY, EARTHQUAKE HAZARD STUDIES IN THE LOS ANGELES AREA FOCUSED ON THE
SAN ANDREAS FAULT
SAF broke in 1857: M 7.9

BECAUSE STRONG GROUND MOTION DECAYS RAPIDLY WITH DISTANCE
A SMALLER EARTHQUAKE NEARBY CAN DO MORE DAMAGE THAN A LARGER ONE FURTHER AWAY
M 7M 6

PREDICTING HAZARDS IS HARD BECAUSE
Human issues
- We often think we know more than we really do
- Rely on inadequate model
- Uncertainties are hard to assess and usually underestimated
- Data selected or interpreted to fit existing idea
- Groups convince themselves
- Researchers go along with others even when their data say otherwise (“Bandwagon”)
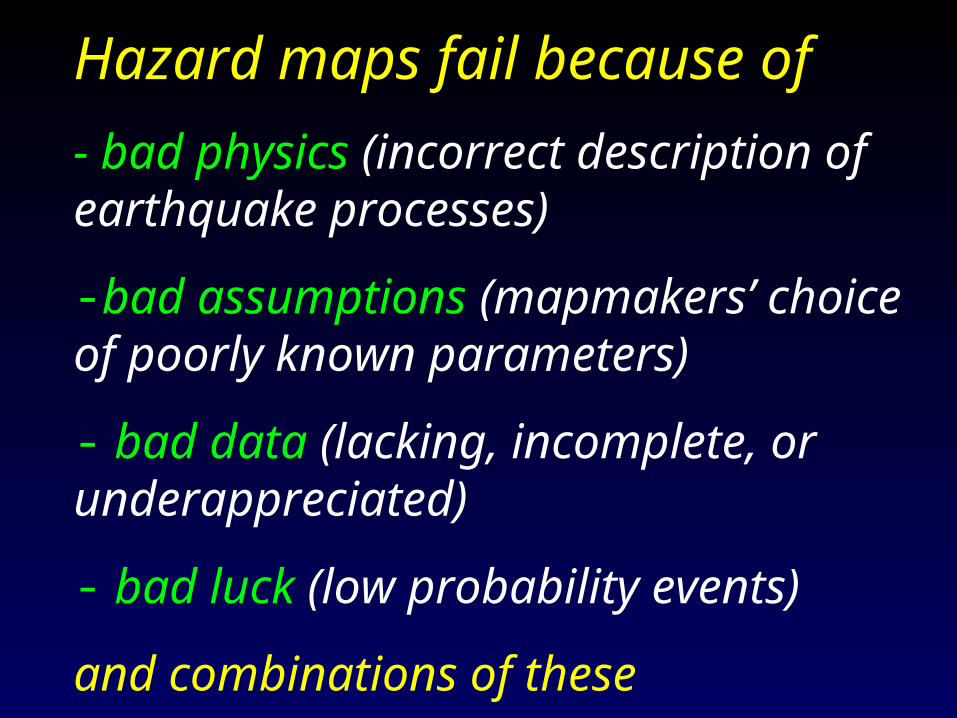
Hazard maps fail because of
- bad physics (incorrect description of earthquake processes)
-bad assumptions (mapmakers’ choice of poorly known parameters)
- bad data (lacking, incomplete, or underappreciated)
- bad luck (low probability events)
and combinations of these
SUGGESTIONS
Do our best to assess hazards, but
Be realistic about what we know & what we don’t
Think carefully about what the evidence for conventional ideas is
Try to realistically assess uncertainties & bear them in mind
Don’t discard new data because they don’t fit model
Accept that the earth is more complicated than we know, and may surprise us