Using Diversity Outbred mice to mimic human population...
31
Using Diversity Outbred mice to mimic human population dynamics in susceptibility to environmental chemicals Alison Harrill Biomolecular Screening Branch National Toxicology Program / NIEHS National Institutes of Health October 6, 2017
Transcript of Using Diversity Outbred mice to mimic human population...
Using Diversity Outbred mice to mimic human population
dynamics in susceptibility to environmental chemicals
Alison HarrillBiomolecular Screening Branch
National Toxicology Program / NIEHSNational Institutes of Health
October 6, 2017
• The opinions expressed in this presentation are the author's own and do not necessarily reflect the view of the National Institutes of Health, the Department of Health and Human Services, or the United States government.
Disclaimer

• Many thousands of chemicals in commerce and in the environment
– Flame retardants, pesticides, dyes, manufacturing catalysts, etc..
– Arsenic, lead, diesel exhaust, etc…
• Multiple scales and routes of exposure
– Occupational (long, high dose duration exposure) , user (short high dose exposure), communities (long or short, low or high)
Where we almost never have human outcome data and never will
Human Health Risk Assessment for Chemicals

• Data needed for risk assessment
– Hazards – target tissues and outcomes
– Dose / Potency – what exposure carries an agreeable risk (conservative)
• Acute versus cumulative
– Susceptible subpopulations
• Age
• Life stage
– All of these data come from whole animal guideline and in vitro studies
Human Health Risk Assessment for Chemicals

• Gene x environment differences are important
– 2009: NRC – for risk assessment “attention should be directed to vulnerable individuals and subpopulations that may be particularly susceptible”
– Understanding influence of genes can inform data-driven uncertainty:
• Methyl mercury: individual susceptibility can vary 50,000-fold between individuals
• 5% of population could be 25-fold more susceptible than average
Considering genetic variation in chemical risk assessment
Variation in: Genetic sequenceEpigenome
EnvironmentHealthStatus

• NTP Mouse – B6C3F1 hybrid
• NTP Rat – Sprague Dawley – outbred, but with low allelic variation and many IBD regions
• Human cells – Typically from a single donor
• A “feature”, not a “bug”!
• New tools have made it more desirable to consider genetic diversity in chemical safety assessments
Diversity is rarely incorporated into risk assessment

Rationally interbred population that mimics human genetic diversity, but polymorphisms are highly randomized
Diversity Outbred mice provide genetic diversity
Founder Strains: A/J, C57BL/6J, 129S1/SvImJ, NOD/ShiLtJ, NZO/H1LtJ, CAST/EiJ, PWK/PhJ,
WSB/EiJ
F1 Diallel Cross→F1 Crosses
Establish Inbreeding Funnels
Collaborative Cross (CC)
• >100 RI lines available• Each RI line is genetically
distinct• Within each RI line, all mice
are genetically identical
Diversity Outbred (DO)
• Large population of genetically unique individuals
• High level of genomic heterozygosity
• Each individual animal is genetically unique
Initiation: Interbred 144 segregating CC lines between G2:F4 and G2:F12 generations
• Comprised of dozens of conventional inbred strains
• Each line is genetically distinct• Many strains have a high
degree of genetic relatedness between them, potentially limiting degree of genetic diversity across strains
Mouse Diversity Panel (MDP)
Strain
Selection
• Diversity Outbred mice are highly genetically diverse, with a randomization of polymorphisms that is superior to human populations Harrill and McAllister, Environmental Health Perspectives 2017
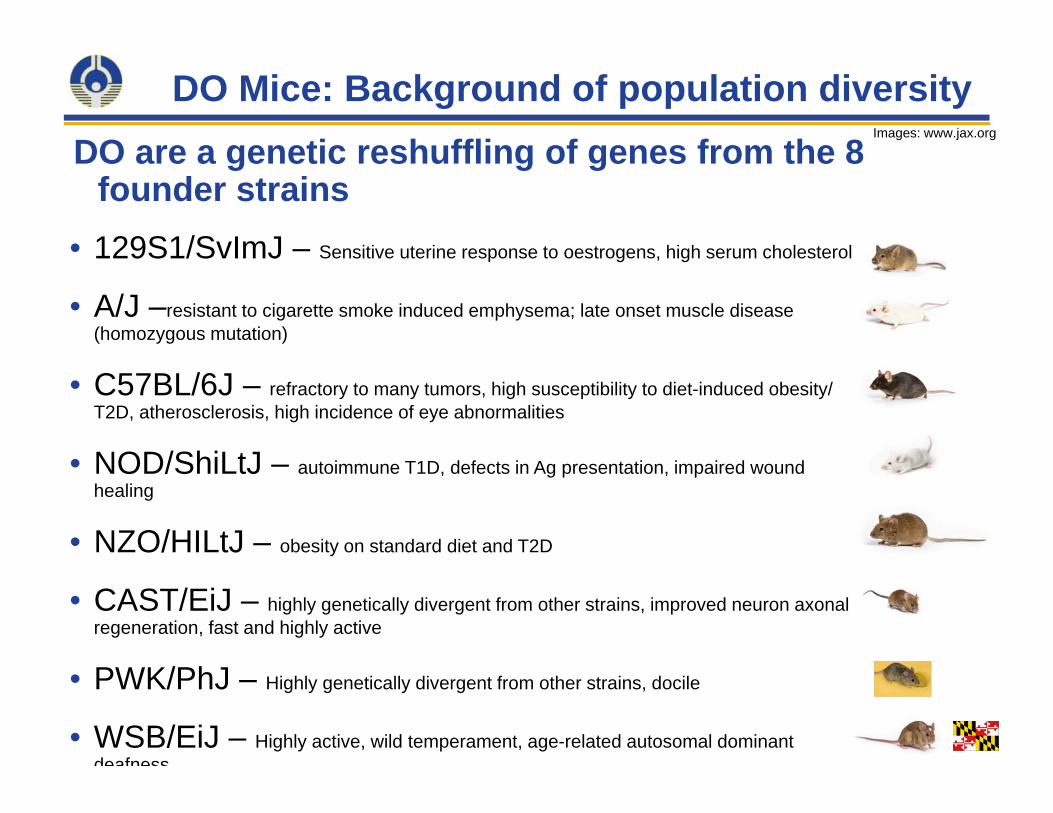
DO are a genetic reshuffling of genes from the 8 founder strains
DO Mice: Background of population diversityImages: www.jax.org
• 129S1/SvImJ – Sensitive uterine response to oestrogens, high serum cholesterol
• A/J –resistant to cigarette smoke induced emphysema; late onset muscle disease (homozygous mutation)
• C57BL/6J – refractory to many tumors, high susceptibility to diet-induced obesity/ T2D, atherosclerosis, high incidence of eye abnormalities
• NOD/ShiLtJ – autoimmune T1D, defects in Ag presentation, impaired wound healing
• NZO/HILtJ – obesity on standard diet and T2D
• CAST/EiJ – highly genetically divergent from other strains, improved neuron axonal regeneration, fast and highly active
• PWK/PhJ – Highly genetically divergent from other strains, docile
• WSB/EiJ – Highly active, wild temperament, age-related autosomal dominant deafness

Uses for DO mice in Chemical Risk Assessment
Mode of ActionHazard ID
Elem
ent
Pot
entia
l App
roac
hes
for P
opul
atio
n-B
ased
R
isk
Ass
essm
ent Predict adverse
effects that only occur in genetically sensitive individuals
Identify hazards that conventional models
may miss
Inform extrapolation of rodent to human via data to replace
standard uncertainty factors
Elucidate shape of dose-response relationship for
variety of endpoints in populations
Quantify threshold doses and BMDL10for adverse events
that occur in sensitive individuals
Dose Response
Estimate population risk with data-driven relationship between exposure and dose
Elucidate interplay between variability in
toxicokinetics with variable
toxicodynamics
‘Omics platform identification of key molecular changes
associated with increased risk
Identify genetic sequence variants
that underlie toxicity sensitivity
Exposure Assessment
Establish exposure biomarkers for biomonitoring
Measure population-wide differences in
toxicokinetics to estimate internal
dose
Harrill and McAllister, Environmental Health Perspectives 2017

Usage Case 1: Identify specific polymorphisms associated with xenobiotic toxicity using the DO

• Idiosyncratic toxicities have been difficult to study because dose-response relationship is unclear and because MOA is debated
– Lack of models: DO may fill a gap
Investigating the cause of rare clinical reports of green tea extract herbal supplement liver injury
DO mice as a model for rare adverse events
Resistant
Responders
Extreme responders “idiosyncratic” DILI
Church et al. Food & Chem Toxicol. 2015
Individual DO Mice

Pharmacogenetic analysis of idiosyncratic DILI
Church et al. Food & Chem Toxicol. 2015

Human translation of GTE PGx risk factors
Gene symbol
SNP (Array)
Gene name Chr P value
Risk/Protective allele
Effect
PER3 exm10762Period circadian clock 3
1 0.004937 T/C Missense (R/W)
MFN2 exm15928 Mitofusin 2 1 0.0067 A/G Missense
(I/V)
VPS13D exm16480
Vacuolar protein sorting 13 homolog D (S. cerevisiae)
1 0.043064 A/T Missense (R/S)
Green tea extract (GTE) supplement hepatotoxicity risk alleles in human clinical cases
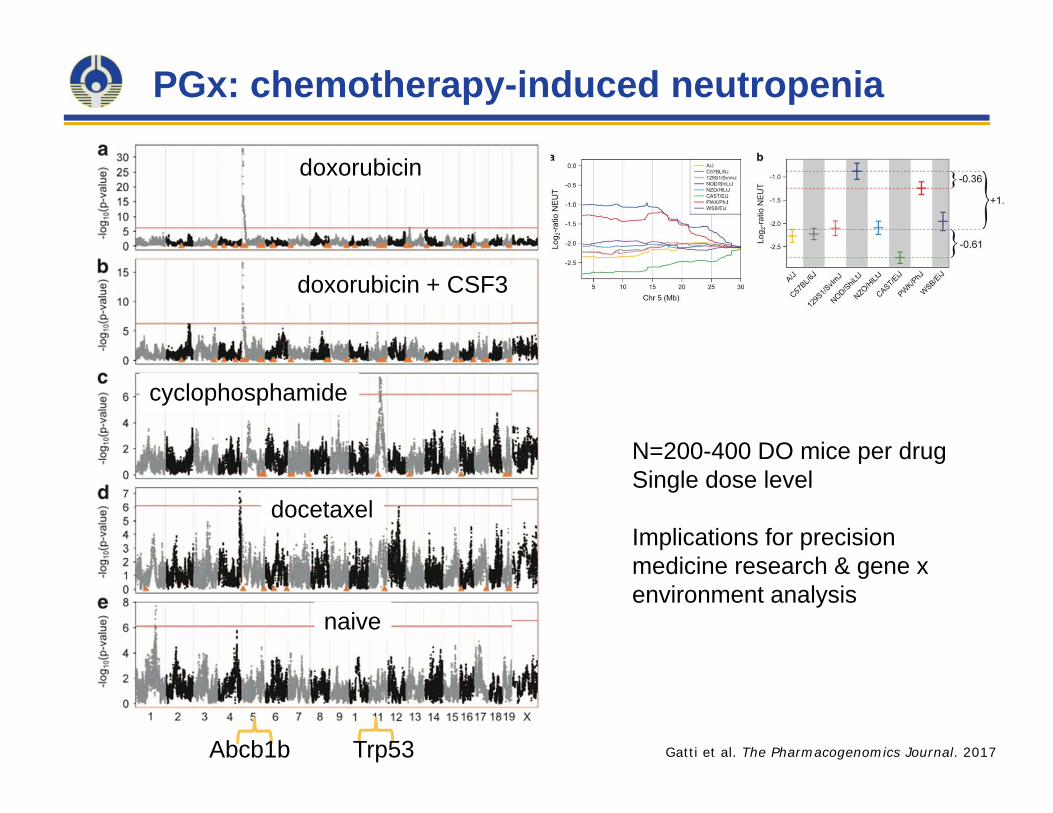
PGx: chemotherapy-induced neutropenia
Trp53Abcb1b
N=200-400 DO mice per drug Single dose level
Implications for precision medicine research & gene x environment analysis
Gatti et al. The Pharmacogenomics Journal. 2017
doxorubicin
doxorubicin + CSF3
cyclophosphamide
docetaxel
naive

Usage Case 2: Evaluate biomarker performance toward assessing human clinical adverse outcomes

Using a population model to investigate predictive value of novel biomarkers
• Many groups are working on qualifying novel biomarkers into clinical practice
• But, how well will biomarkers identified in genetically limited rodent strains translate to a larger population?
• Do single strain studies prevent us from making human relevant discoveries?
Harrill et al. Tox Sci 2016

Renal Biomarkers to Investigate in DO Mice
• “Gold standard”
– Creatinine
– Blood urea nitrogen (BUN)
• Novel proteins qualified for preclinical rat toxicology
– KIM-1, IP-10, TIMP-1, OPN, Renin, VEGF, NGAL, EGF, clusterin, cysC, albumin, TFF3
• Other urine markers
– miRNA

Cisplatin Study – Biomarker Performance
Figure 5. Treatment paradigm for cisplatin exposure and sample collection.
Animals: Female DO mice, 8-12 weeks of ageN = 45 cisplatin (5 mg/kg)N = 45 saline
Goals: (1) Evaluate performance of conventional kidney injury biomarkers(2) Evaluate performances of “NEW & IMPROVED” kidney injury biomarkers(3) Determine whether urinary miRNA biomarkers offer advantages over (1) and (2)
Haixia Lin & Julia Tobacyk, UAMS

Population dynamics in conventional kidney biomarkers, single cisplatin dose
Vehicle Cisplatin0
255075
100125150175200225
BU
N (m
g/dL
)
*
*P<0.05
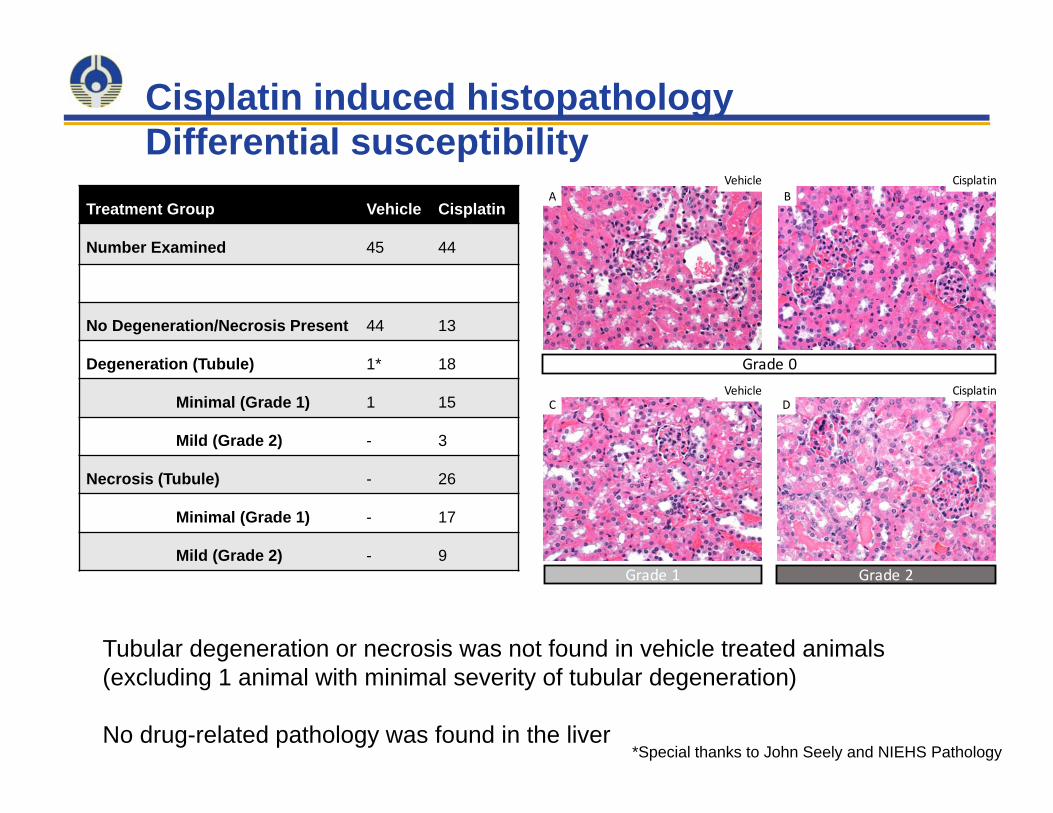
Cisplatin induced histopathologyDifferential susceptibility
*Special thanks to John Seely and NIEHS Pathology
Tubular degeneration or necrosis was not found in vehicle treated animals (excluding 1 animal with minimal severity of tubular degeneration)
No drug-related pathology was found in the liver
Treatment Group Vehicle Cisplatin
Number Examined 45 44
No Degeneration/Necrosis Present 44 13
Degeneration (Tubule) 1* 18
Minimal (Grade 1) 1 15
Mild (Grade 2) - 3
Necrosis (Tubule) - 26
Minimal (Grade 1) - 17
Mild (Grade 2) - 9
Grade 0
Grade 1 Grade 2
A B
C D
Vehicle
Cisplatin
Cisplatin
Vehicle
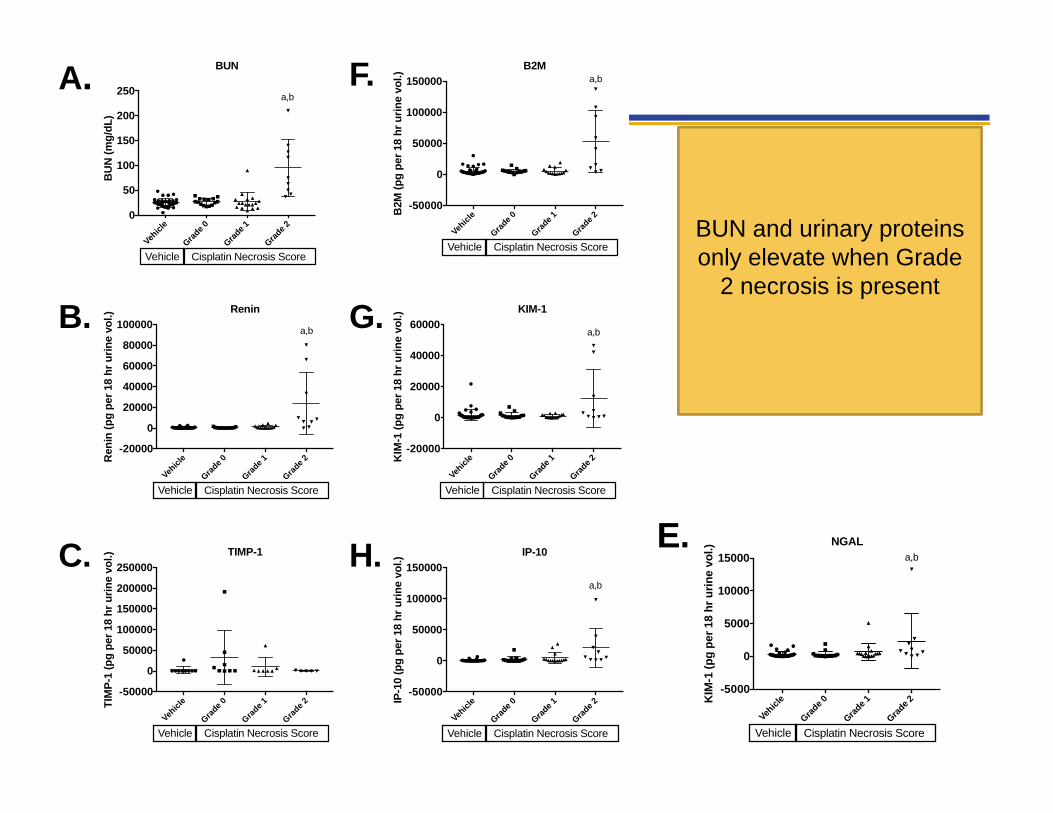
BUN and urinary proteins only elevate when Grade
2 necrosis is present
Vehicl
e
Grade 0
Grade 1
Grade 2
0
50
100
150
200
250B
UN
(mg/
dL)
BUN
a,b
Cisplatin Necrosis ScoreVehicle
Vehicl
e
Grade 0
Grade 1
Grade 2
-20000
0
20000
40000
60000
80000
100000Renin
Ren
in (p
g pe
r 18
hr u
rine
vol.)
Cisplatin Necrosis ScoreVehicle
a,b
Vehicl
e
Grade 0
Grade 1
Grade 2
-50000
0
50000
100000
150000
200000
250000TIMP-1
TIM
P-1
(pg
per 1
8 hr
urin
e vo
l.)
Cisplatin Necrosis ScoreVehicle
Vehicl
e
Grade 0
Grade 1
Grade 2
-50000
0
50000
100000
150000B2M
B2M
(pg
per 1
8 hr
urin
e vo
l.)
Cisplatin Necrosis ScoreVehicle
a,b
Vehicl
e
Grade 0
Grade 1
Grade 2
-20000
0
20000
40000
60000KIM-1
KIM
-1 (p
g pe
r 18
hr u
rine
vol.)
Cisplatin Necrosis ScoreVehicle
a,b
Vehicl
e
Grade 0
Grade 1
Grade 2
-50000
0
50000
100000
150000IP-10
IP-1
0 (p
g pe
r 18
hr u
rine
vol.)
Cisplatin Necrosis ScoreVehicle
a,b
A.
B.
C.
F.
G.
H.
Vehicl
e
Grade 0
Grade 1
Grade 2
-5000
0
5000
10000
15000NGAL
KIM
-1 (p
g pe
r 18
hr u
rine
vol.)
Cisplatin Necrosis ScoreVehicle
a,bE.

Grade 0
Grade 0
Grade 1
Grade 2
15
20
25
30
35
miR-130a
Ct
Vehicle Cisplatin
a,b,c
Grade 0
Grade 0
Grade 1
Grade 2
15
20
25
30
35
miR-221
Ct
Vehicle Cisplatin
a,b,c
Grade 0
Grade 0
Grade 1
Grade 2
15
20
25
30
35
miR-138
Ct
Vehicle Cisplatin
a,b,c
Grade 0
Grade 0
Grade 1
Grade 2
0
10
20
30
40
miR-320
Ct
Vehicle Cisplatin
a,b,c
Grade 0
Grade 0
Grade 1
Grade 2
15
20
25
30
35
miR-151-3p
Ct
Vehicle Cisplatin
a,b,c
Grade 0
Grade 0
Grade 1
Grade 2
0
10
20
30
40
miR-328
Ct
Vehicle Cisplatin
a,b,c
Grade 0
Grade 0
Grade 1
Grade 2
0
10
20
30
40
miR-152
Ct
Vehicle Cisplatin
a,b
Grade 0
Grade 0
Grade 1
Grade 2
0
10
20
30
40
miR-680
Ct
Vehicle Cisplatin
a,b
Grade 0
Grade 0
Grade 1
Grade 2
0
10
20
30
40
miR-218
Ct
Vehicle Cisplatin
a
Grade 0
Grade 0
Grade 1
Grade 2
0
10
20
30
40
miR-685
Ct
Vehicle Cisplatin
a,b,c
The same is true for urinary miRNAs that increase in abundance in response to cisplatin exposure. Elevations in urinary miRNA
abundance are only observed at necrosis grade 2.
Urine miRNA Abundance
Population response dynamics aid biomarker evaluation

Cisplatin miRNA biomarkers in DO - ROC
0 50 1000
25
50
75
100
100% - Specificity%
Sens
itivi
ty%
ROC curve: ROC of miR-130a
0 50 1000
25
50
75
100
ROC curve: ROC of miR-221
100% - Specificity%
Sens
itivi
ty%
0 50 1000
25
50
75
100
ROC curve: ROC of miR-138
100% - Specificity%
Sens
itivi
ty%
0 50 1000
25
50
75
100
ROC curve: ROC of miR-320
100% - Specificity%
Sens
itivi
ty%
0 50 1000
25
50
75
100
ROC curve: ROC of miR-151-3p
100% - Specificity%
Sens
itivi
ty%
0 50 1000
25
50
75
100
ROC curve: ROC of miR-328
100% - Specificity%Se
nsiti
vity
%
0 50 1000
25
50
75
100
ROC curve: ROC of miR-152
100% - Specificity%
Sens
itivi
ty%
0 50 1000
25
50
75
100
ROC curve: ROC of miR-680
100% - Specificity%
Sens
itivi
ty%
0 50 1000
25
50
75
100
ROC curve: ROC of miR-218
100% - Specificity%
Sens
itivi
ty%
0 50 1000
25
50
75
100
ROC curve: ROC of miR-685
100% - Specificity%
Sens
itivi
ty%
Even though performance not great at low end of injury spectrum , ROC
curves are all significant p<0.05 AND
AUROC values 0.71-0.82

Usage Case 3: Tool for population-based estimates of chemical potency for risk assessment

Human BMCL10 7.2 ppm (44 subjects), < 1 ppm FX
DO BMCL10: 0.205 ppm ; B6C3F1 BMCL10: 3.12 ppm
DO: calculate BMDL for inhaled benzene
French et al. EHP 2015.

Population-Based Analysis of Chemical Sensitivity in vitro – Developmental
Neurotoxicity
More refined recombination structure in the CC/DO result in smaller more refined co-expression networks and correlations among behavioral phenotypes at sample sizes comparable to conventional behavioral QTL mapping studies
Chesler. Mamm Genome. 2014; 25(1-2): 3–11.

• Predictive Biology has archived hundreds of ES cells from DO mice
• Over 100 male and 100 female DO ES cell lines (representing 200 individual and genetically unique mice) have been differentiated into neural progenitor cells
• Chromosomal aberrations checked by RNA-Seq and Giga MUGA (mouse universal genotyping array)
DO Neural Progenitor Cells
ESCells
Neural Stem cells
Neural Progenitor
Cells
Neuron-Restricted
Progenitors
Motor Neuron
Progenitors
Glial-Restricted
Progenitors

DNT population responses – differ by chemical and by DO cell line
Estradiol
Methyl Mercuric (II) Chloride
Dieldrin
2,2',4,4',5‐Pentabromodiphenyl ether
Rotenone
Phenol, isopropylated, phosphate (3:1)
Wide variability in response across DO cell lines / individuals for a single chemical
Wide variability in response across DO cell lines / individuals for a single chemical
00.5
11.5
22.5
33.5
44.5
5
0 5 10 15 20
IC50
(uM
)
Cell Lines
Dieldrin
Replicate 1
Replicate 2
Wide variability in response across chemicals for a single DO cell line
Wide variability in response across chemicals for a single DO cell line
Compound P valuesDieldrin 0.000239Ether 0.00071
Estradiol 0.007Methyl mercury 0.02
PBDE 0.0218Rotenone 0.038
Lead 0.07BPA 0.11
Caffeine 0.12Triphenylphosphate 0.24
BPAF 0.25Phthalate 0.3Dopamine 0.43
Hexachlorophene 0.8Phenol 0.939
Correlation between runs

• Standard uncertainty factor for extrapolating rodent to human NOAEL is 100 – is that protective enough?
• Use DO dose-response data to inform a point of departure for regulatory agencies to set a reference dose (RfD)
Potential Study Outcomes
Wide variability in dose responsivenes
Chemical XBMD – 13.4 uM

NTP, EPA, & FDA/NCTR
Phase 2: Tox21 Cross-Partner Project
Chemical Exposures
Expose DO NPCs and fix cells
High Content Imaging
Label targets with fluorescent probes
Scan/Image cells
Image analysis / quantify fluorescent intensity and
morphometry
Predictive Biology NCTR/FDA
Data Analysis and BMD Assessment
Calculate BMD/BMDL for each chemical/sex and for each endpoint
Determine relative sensitivity of each HCA probe and DO cell line
Determine sex differences in susceptibility for each compound
NIEHS/NTP
Dose Concentration Selection
Input into study design, chemical selection, and target doses
Cross-Partner Data Contextualization (NTP/FDA)
Model Evaluation: Compare BMDs calculated using DO NPCs to in vivo data collected by NTP and other stakeholders; determine concordance with human epidemiological data where available, compare variability with other DNT screens
under development (human iPSC neurite outgrowth, zebrafish, others)

AcknowledgementsNIH/NIEHS/NTPRick PaulesMamta BehlKristine Witt
UAMSHaixia Lin (postdoc)Julia Tobacyk (former student)Sam Luo
UNC-Chapel Hill &The Hamner InstitutesRachel Church Merrie MosedaleScott EaddyPaul Watkins
The Jackson LaboratoryDaniel GattiGary Churchill
FDA/NCTRBill SlikkerBill MattesDan AcostaDonna MendrickMark Avigan
Predictive BiologyTed ChoiLesley Page
Funding*UAMS*FDA*The Burroughs Wellcome Fund
*Prior to my joining the NIH
EPLJohn Seely