Using Demand Response Programs to Benefit the Customer and ...
13
Using Demand Response Programs to Benefit the Customer and the Utility Customer and the Utility P t i kJ O hi C i i P atrickJ. Oshie, Commissioner Washington Utilities & Transportation C i i Commission 1
Transcript of Using Demand Response Programs to Benefit the Customer and ...
Using Demand Response gPrograms to Benefit the Customer and the UtilityCustomer and the Utility
P t i k J O hi C i iPatrick J. Oshie, CommissionerWashington Utilities & Transportation
C i iCommission1
What is Demand Response?What is Demand Response?
Changes in electric usage by end‐use customers from their normal consumption patterns in response to changes in the price of electricity over time, or to incentive payments designed to induce lower electricity use at times of high wholesale market prices or when system reliability is jeopardized. – FERC 2008 Demand Response Assessment
2
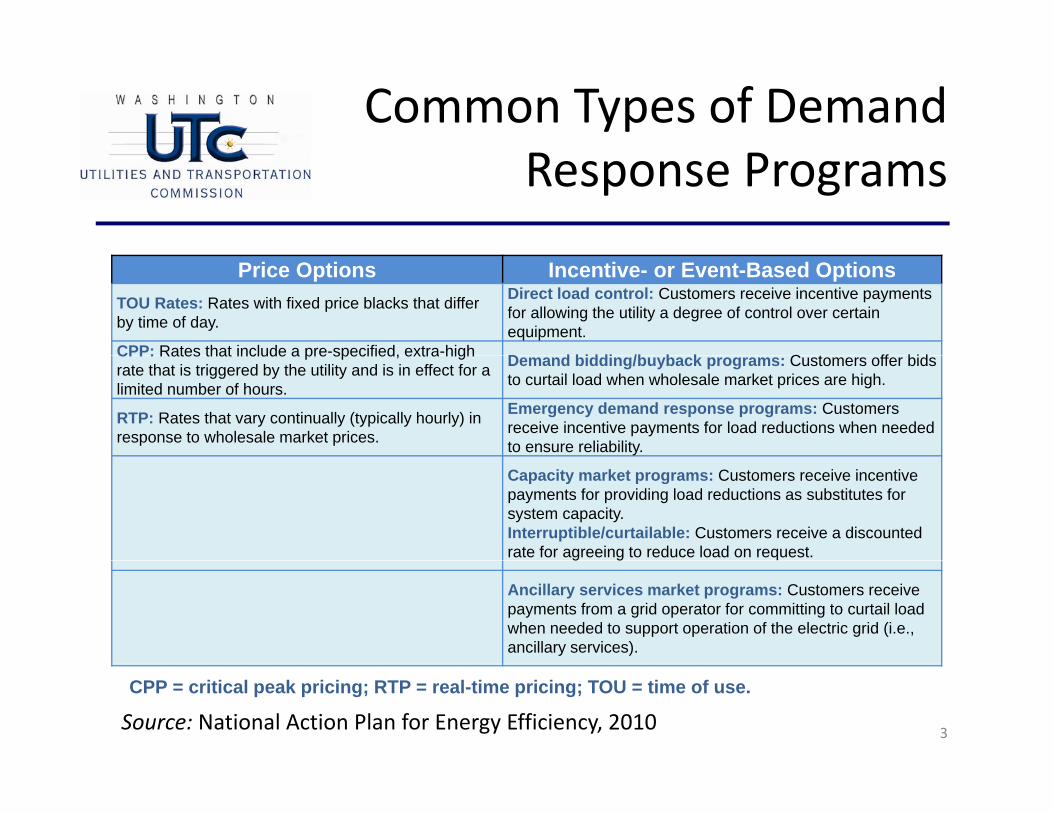
Common Types of DemandResponse Programs
Price Options Incentive- or Event-Based OptionsTOU Rates: Rates with fixed price blacks that differ by time of day.
Direct load control: Customers receive incentive payments for allowing the utility a degree of control over certain equipment.
CPP: Rates that include a pre-specified, extra-high D d biddi /b b k C t ff bidCPP: Rates that include a pre specified, extra high rate that is triggered by the utility and is in effect for a limited number of hours.
Demand bidding/buyback programs: Customers offer bids to curtail load when wholesale market prices are high.
RTP: Rates that vary continually (typically hourly) in response to wholesale market prices.
Emergency demand response programs: Customers receive incentive payments for load reductions when needed to ensure reliability.
Capacity market programs: Customers receive incentive payments for providing load reductions as substitutes for system capacity.Interruptible/curtailable: Customers receive a discounted rate for agreeing to reduce load on request.g g
Ancillary services market programs: Customers receive payments from a grid operator for committing to curtail load when needed to support operation of the electric grid (i.e., ancillary services).
3Source: National Action Plan for Energy Efficiency, 2010
CPP = critical peak pricing; RTP = real-time pricing; TOU = time of use.

What Demand is Responding?
• Lighting
• Space coolingSpace cooling
• Space heating
W h i• Water heating
• Industrial processes
• Irrigation
• At the limit, whatever customer can do
4
At the limit, whatever customer can do
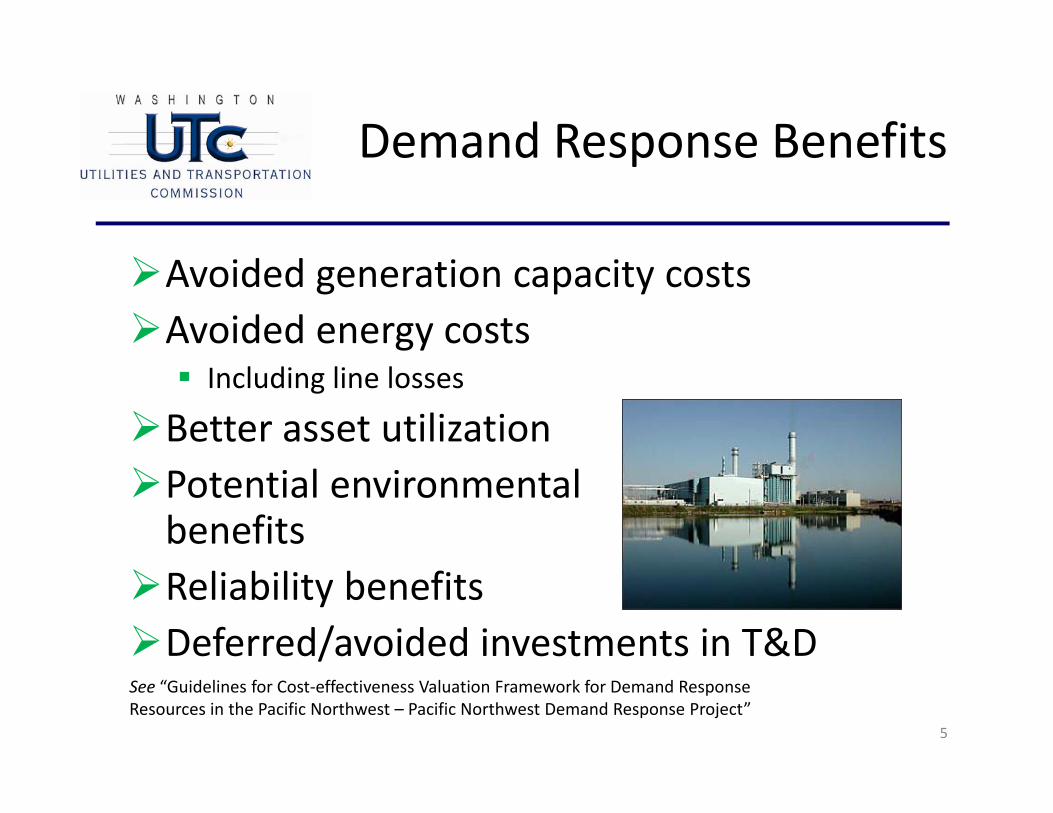
Demand Response BenefitsDemand Response Benefits
Avoided generation capacity costs Avoided energy costs
Including line losses
Better asset utilizationPotential environmentalbenefitsReliability benefitsDeferred/avoided investments in T&D
5
See “Guidelines for Cost‐effectiveness Valuation Framework for Demand Response Resources in the Pacific Northwest – Pacific Northwest Demand Response Project”
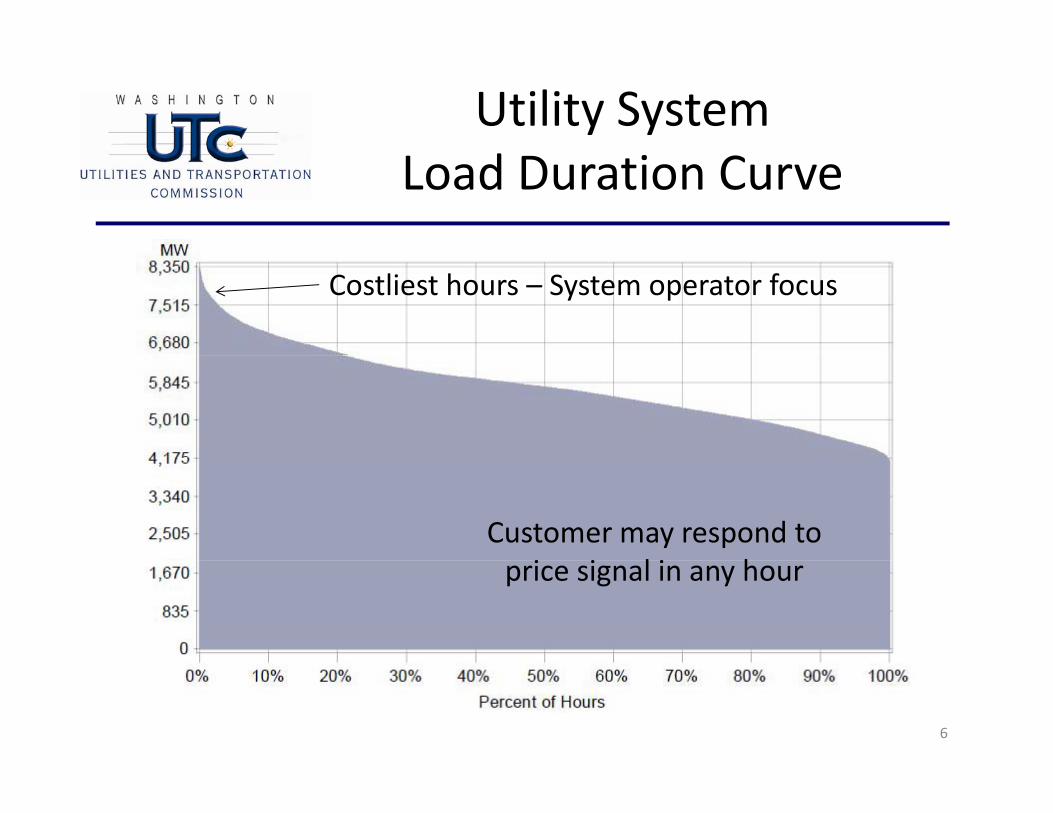
Utility System Load Duration Curve
Costliest hours – System operator focus
Customer may respond to i i l i hprice signal in any hour
6
Demand ResponseProgram Costs
Utility costs for enabling equipment, IT, information management, billing, marketing, education and contracted expertseducation and contracted expertsPayments to customers (if applicable)Customer costsCustomer costs– Investments to curtail peak loads/shift demand– Any reduced service levels or reduced production
7

Utility Concerns About Demand Response
Reliability
Reduced need for large assets
Reduced sales
Changes in relationship with customerg p
Understanding how to do demand response well– Pricing/incentivesg/
– Technology
– IT, information management and billing systems
8
Reliability ofdDemand Response
If mandatory for customer– Controlled by utility or grid operator
• May be through curtailment service providerMay be through curtailment service provider– Contract‐based
• Specified number and duration of events, damages
If voluntary for customerIf voluntary for customer– Based on historical performance– Persistence over a series of events– Automation helps (set it and forget it)
• For example, dispatch pricing signal to programmable communicating thermostat set by customer
9
Policies That PromoteDemand Response
Treat demand response comparably with other resources in integrated resource planning, resource acquisition, T&D planning and marketsAdd tilit di i ti th h d liAddress utility disincentives – e.g., through decouplingOffer all customers a way to participate– Access to useful energy consumption data,
evaluation tools and targeted adviceevaluation tools and targeted advice– Dynamic pricing if advanced metering
infrastructure is in place• Automated controls through marketplace
(foster innovation)(foster innovation)– Incentives for other types of demand response programsAdopt interoperability standards for devices and systemsAddress privacy and cyber‐security concerns
10
p y y y
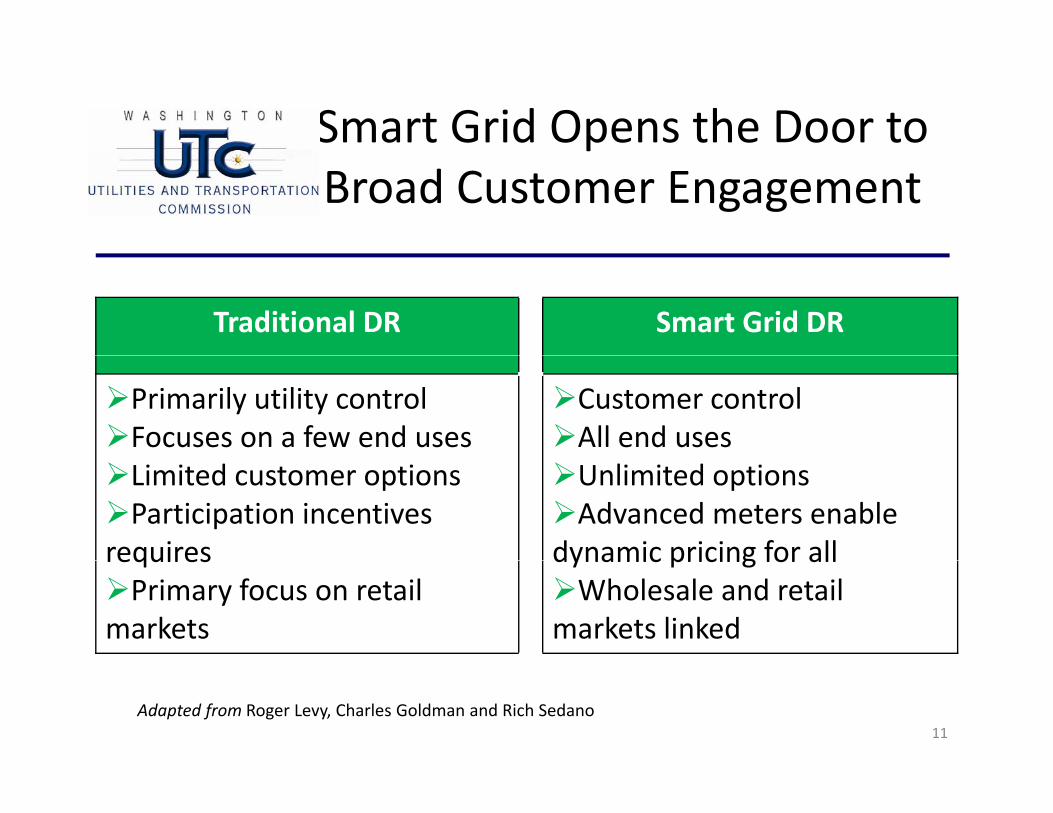
Smart Grid Opens the Door topBroad Customer Engagement
Traditional DR Smart Grid DR
Primarily utility controlFocuses on a few end uses
Customer controlAll end uses
Limited customer optionsParticipation incentives
requires
Unlimited optionsAdvanced meters enable
dynamic pricing for allrequiresPrimary focus on retail
markets
dynamic pricing for allWholesale and retail
markets linked
11Adapted from Roger Levy, Charles Goldman and Rich Sedano
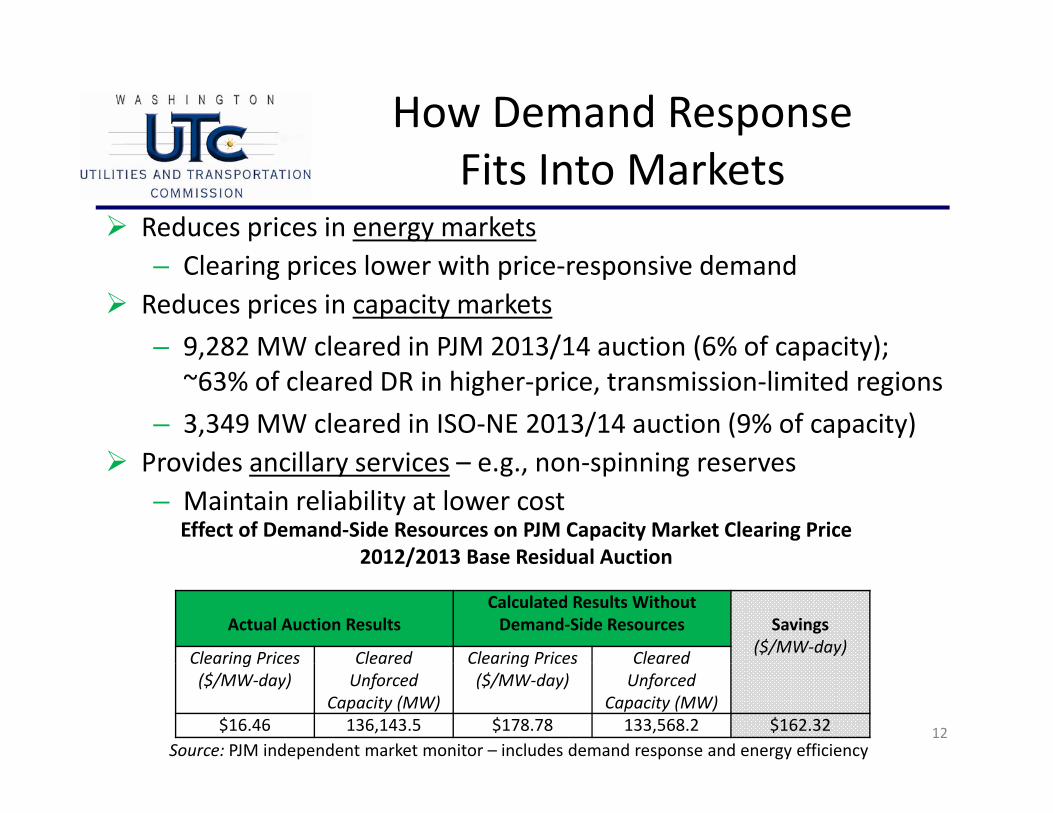
How Demand ResponseFits Into Markets
Reduces prices in energy markets– Clearing prices lower with price‐responsive demandReduces prices in capacity markets
– 9,282 MW cleared in PJM 2013/14 auction (6% of capacity); 9, 8 MW cleared in PJM 0 3/ 4 auction (6% of capacity);~63% of cleared DR in higher‐price, transmission‐limited regions
– 3,349 MW cleared in ISO‐NE 2013/14 auction (9% of capacity)Provides ancillary services e g non spinning reservesProvides ancillary services – e.g., non‐spinning reserves– Maintain reliability at lower cost
Effect of Demand‐Side Resources on PJM Capacity Market Clearing Price2012/2013 Base Residual Auction2012/2013 Base Residual Auction
Actual Auction ResultsCalculated Results WithoutDemand‐Side Resources Savings
($/MW‐day)Clearing Prices Cleared Clearing Prices Cleared
12
Clearing Prices($/MW‐day)
Cleared Unforced
Capacity (MW)
Clearing Prices($/MW‐day)
Cleared Unforced
Capacity (MW)$16.46 136,143.5 $178.78 133,568.2 $162.32
Source: PJM independent market monitor – includes demand response and energy efficiency

FERC Demand Response Potential Assessment
Achievable Potential scenario reduces U.S. peak load growth byload growth by 14% compared to no demand response scenario
Growth in U.S. Peak Demand by DR Scenario