Using Data Mining to Predict Errors in Chronic Disease Caredecisions based on anticipated future...
16
Advances in Patient Safety: New Directions and Alternative Approaches. Agency for Healthcare Research and Quality, 2008 (in press) 1 Using Data Mining to Predict Errors in Chronic Disease Care Ryan M. McCabe a , Gediminas Adomavicius b , PhD, Paul E. Johnson b , PhD, Gregory Ramsey b , Emily Rund c , William A. Rush d , PhD, Patrick J. O’Connor d , MD, MPH, JoAnn Sperl-Hillen d , MD Abstract Development of data mining technologies to predict treatment errors in populations of patients represents a major advance in patient safety research. In the work presented here we (1) create a simulation test environment using characteristic models of physician decision strategies and simulated populations of type 2 diabetic patients, (2) employ a specific data mining technology that predicts encounter-specific errors of omission in representative databases of simulated physician-patient encounters, and (3) test the predictive technology in an administrative database of real physician-patient encounter data. Two dominant decision making strategies with different rates of treatment errors are identified: feedback strategies that use the results of past actions to guide treatment decision, and feedforward strategies that make treatment decisions based on anticipated future patient states. Evaluation of data mining results shows that the predictive tools developed from simulated treatment data can predict errors of omission in clinical patient data. The methods developed in this work can have the potential for wide use in identifying decision strategies that lead to encounter-specific treatment errors in chronic disease care. Introduction Reducing the incidence of medical errors is an ongoing area of interest to the healthcare community. Much of the focus in recent work has been on reducing errors of commission (inappropriate actions), such as amputating the wrong limb. 1 Less attention has been given to errors of omission (failure to act when patients are not at evidence-based goals), a particular area of interest in the treatment of chronic diseases, such as type 2 diabetes. 2 Two major challenges in preventing errors of omission are: (1) identifying patterns of behavior that predict future errors, and (2) determining appropriate actions to take to prevent errors when error-prone behavior patterns are identified. Such actions may include changing the way individual physicians manage patients as well as matching a physician’s abilities to patients with characteristics they are most successful in treating. The healthcare community is placing greater emphasis on the use of data sources to improve the quality of care delivered to patients. 3,4 Available data sources include administrative and clinical records, particularly with the advent of the electronic medical record. Extracting meaningful information from large databases is a challenging task. Data mining, the extraction of useful and a Computer Science, University of Minnesota b Information and Decision Sciences, University of Minnesota c Carlson School of Management, University of Minnesota d HealthPartners Medical Group and HealthPartners Research Foundation
Transcript of Using Data Mining to Predict Errors in Chronic Disease Caredecisions based on anticipated future...

Advances in Patient Safety: New Directions and Alternative Approaches.
Agency for Healthcare Research and Quality, 2008 (in press)
1
Using Data Mining to Predict Errors in Chronic Disease Care
Ryan M. McCabea, Gediminas Adomaviciusb, PhD, Paul E. Johnsonb, PhD, Gregory Ramseyb,
Emily Rundc, William A. Rushd, PhD, Patrick J. O’Connord, MD, MPH, JoAnn Sperl-Hillend, MD
Abstract
Development of data mining technologies to predict treatment errors in populations of patients
represents a major advance in patient safety research. In the work presented here we (1) create
a simulation test environment using characteristic models of physician decision strategies and
simulated populations of type 2 diabetic patients, (2) employ a specific data mining technology
that predicts encounter-specific errors of omission in representative databases of simulated
physician-patient encounters, and (3) test the predictive technology in an administrative
database of real physician-patient encounter data. Two dominant decision making strategies
with different rates of treatment errors are identified: feedback strategies that use the results of
past actions to guide treatment decision, and feedforward strategies that make treatment
decisions based on anticipated future patient states. Evaluation of data mining results shows
that the predictive tools developed from simulated treatment data can predict errors of omission
in clinical patient data. The methods developed in this work can have the potential for wide use
in identifying decision strategies that lead to encounter-specific treatment errors in chronic
disease care.
Introduction
Reducing the incidence of medical errors is an ongoing area of interest to the healthcare community. Much of the focus in recent work has been on reducing errors of commission (inappropriate actions), such as amputating the wrong limb.1 Less attention has been given to errors of omission (failure to act when patients are not at evidence-based goals), a particular area of interest in the treatment of chronic diseases, such as type 2 diabetes.2 Two major challenges in preventing errors of omission are: (1) identifying patterns of behavior that predict future errors, and (2) determining appropriate actions to take to prevent errors when error-prone behavior patterns are identified. Such actions may include changing the way individual physicians manage patients as well as matching a physician’s abilities to patients with characteristics they are most successful in treating. The healthcare community is placing greater emphasis on the use of data sources to improve the quality of care delivered to patients.3,4 Available data sources include administrative and clinical records, particularly with the advent of the electronic medical record. Extracting meaningful information from large databases is a challenging task. Data mining, the extraction of useful and
aComputer Science, University of Minnesota
bInformation and Decision Sciences, University of Minnesota
cCarlson School of Management, University of Minnesota
dHealthPartners Medical Group and HealthPartners Research Foundation

Advances in Patient Safety: New Directions and Alternative Approaches.
Agency for Healthcare Research and Quality, 2008 (in press)
2
potentially actionable information from data, has been identified as a tool for culling healthcare databases for information to improve the quality of care. The majority of recent data mining research directed toward improving quality of care has focused on detecting outcomes associated with patient/illness characteristics.5,6 Less work has directly examined outcomes and physician actions. The present study applies data mining to identify patterns of physician decision making used to treat patients with the goal of predicting errors of omission. In this approach, a simulation study of the clinical environment of type 2 diabetes was conducted to 1) model alternative physician treatment strategies and, 2) develop a representative database of treatment records reflecting the use of these strategies to treat populations of simulated patients. The resulting database was used to employ a specific form of data mining technology – decision trees – that enabled accurate prediction of errors of omission across a range of patients and physician treatment characteristics. The resulting decision trees were then evaluated by using them to predict errors in an administrative database of actual patient records.
Simulation Environment
The simulation environment used in the present work was comprised of a computational model for patients with type 2 diabetes, plus a set of physician decision strategies for treating this disease. Clinical responses of individual patients as well as populations of patients’ responses to treatment were modeled. Each part of the simulation environment is described below.
Patient Model: A computational model of a patient with type 2 diabetes was developed in prior research.7 This model is composed of an inference structure and a rule-network that responds to treatment actions in a manner characteristic of diabetic patients in real clinical encounters. Changes in levels of blood glucose, blood pressure, and lipids are simulated in response to actions taken over time. The patient model accounts for specific effects on outcomes from various oral medications, insulin, and other treatments, including medical nutrition therapy. The model captures the physiological effects of drugs in the form of dose response curves taken from the clinical literature.8,9 The patient model includes three sources of individual patient variation. These are: (1) seasonal fluctuations in adherence to the treatment regimen following a one-year cycle,10 (2) daily fluctuations in adherence,11 and (3) an assigned rate of disease progression.12 Individual Patients: Changes in patient blood glucose values (i.e., glycated hemoglobin and fasting plasma glucose, hereafter referred to as A1c and FPG, respectively) are computed in two parts: (1) the effect of treatment actions (hereafter referred to as moves) is computed as determined by a dose-response table, where each medication dose in the table has a maximum expected effect on patient blood glucose values (A1c and FPG), and (2) the percent of maximum effect is computed at any point in time based on the time-course of respective medications. Time-dependent values for percent maximum effect of medications are computed for both A1c values and FPG values. Adherence to a treatment regimen indirectly affects A1c level, where the level of adherence assigned to each patient determines the percentage of the regimen followed. For example, if a patient has a prescription for 2000 mg of Metformin and is modeled to be 75% adherent, then the patient model receives 2000 mg * 0.75, or 1500 mg, of Metformin throughout the time period in question. Blood pressure and lipid values are similarly represented.

Advances in Patient Safety: New Directions and Alternative Approaches.
Agency for Healthcare Research and Quality, 2008 (in press)
3
Patient Populations: Characteristic properties of populations of patients with type 2 diabetes were modeled using an administrative database of treatment records. Working in conjunction with physicians from a major healthcare organization and their clinical database, eleven key health indicators of diabetic patient health were identified and represented. These were: A1c, Low-density lipoprotein (LDL), High-density lipoprotein (HDL), triglycerides, systolic blood pressure, weight, creatinine, height, depression, stress, and level of adherence to treatment regimen (estimated from the timeliness of prescription fills). Generated populations of synthetic patients in the study reported here are based on distributions of these attributes.
Physician Treatment Strategies
Physician Process Model. The Physician Process Model (PPM) referred to in the present research is a dynamic decision model designed to bring patient blood glucose, blood pressure, and lipid values to evidence-based goals (e.g., A1c values less than 7%). The PPM manages patient state by processing information and making corresponding moves. Moves take three forms: (1) treatment moves, comprised of medications and referrals to specialists; (2) scheduling
moves, comprised of stipulations for when future visits will occur; and (3) information seeking
moves, comprised of orders for medical tests (e.g., A1c) to support decision making. Because patient states change as a function of patient variables as well as decisions made by the physician model, each treatment strategy requires a series of real-time decisions. As described by Brehmer, making such decisions is analogous to a process of achieving control of a system to obtain desired outcomes (goals).13 PPMs for treating patients with type 2 diabetes are based on the internal model control paradigm,14 shown in Figure 1. This model is composed of processes and computations (represented as squares and circles respectively). The system being controlled is a patient (model) with type 2 diabetes.
The inverse model shown in Figure 1 is a process that generates treatment moves, schedules visits, and orders tests. The inverse model determines what moves to make based on the patient’s distance to goal and whether prior moves have had their expected effect on patient state as measured by the expectation discrepancy. Distance to goal is the amount of change in (for example) A1c required to bring the patient to the desired A1c level. Expectation discrepancy is the difference between the patient’s current A1c and expected A1c at a given point in time, as estimated by the mental model. The mental model represents parameters that affect estimations of patient state, including patient adherence to treatment (low or high) and dose-response curves (representations of patient responses to doses of various medications over time). The mental model generates an expectation of patient A1c as a consequence of moves that are made. The patient model receives moves from the inverse model and generates the next state of the patient being treated.
Brehmer suggests two decision strategies to control dynamic processes: feedback and feedforward.13 A feedback strategy uses information based on current patient state to make decisions. A feedforward strategy uses current patient state information and anticipated future patient states to make decisions. Two versions of the feedback strategy and two versions of the feedforward strategy were created for purposes of the present study. These versions are labeled weak and strong. Each version is described below in more detail.

Advances in Patient Safety: New Directions and Alternative Approaches.
Agency for Healthcare Research and Quality, 2008 (in press)
4
Figure 1. Physician Process Model for Managing Patients with Type 2 Diabetes.
Feedback strategies: A common heuristic for feedback control from the literature on decision making is “anchoring and adjustment.”15,16 “Anchoring” is accomplished by selecting a control variable to use as a basis for making decisions. The PPM uses previous blood glucose value as an anchor. “Adjustment” is the process of making decisions relative to past decisions. In the PPM, this equates to titrating (adjusting) the dose of a single medication. The weak version of the feedback strategy represents a physician that infrequently titrates (adjusts) diabetes-related medications. This version of the feedback strategy has encounters with the patient every 90 days but makes treatment moves only when A1c is above goal (i.e., A1c of 7%) and has stopped decreasing, or is increasing compared to the previous encounter. The strong version of the feedback strategy has encounters with the patient every 90 days and makes treatment moves on every encounter when the patient is above A1c goal (7%). The 90 day scheduling parameter was chosen because most oral medications require 90 days for complete absorption by the patient. Feedforward strategies: The feedforward strategy estimates the amount of medication needed to treat the patient based on the distance of the patient’s A1c from goal. The feedforward strategy has a time constraint of one year to reach its A1c goal. Given the time constraint, the feedforward strategy determines if enough visits can be scheduled to administer the amount of medication needed to reach goal. If the strategy estimates that there is insufficient time given standard scheduling of visits and titration of single medications, the model will schedule visits more often, and when appropriate, will administer and titrate more than one medication (including insulin).
Unlike feedback strategies which use only A1c values in their decision making, feedforward strategies use both FPG and A1c values when determining progress toward goal. Because feedforward strategies can make medication moves before prior moves have finished taking their full effect, these strategies must manage this “delay of feedback” by combining dose-response curves in order to prevent over-medicating the patient. The two versions of the feedforward strategy manage this in different ways. The weak version of the feedforward strategy makes a single medication move every encounter

Advances in Patient Safety: New Directions and Alternative Approaches.
Agency for Healthcare Research and Quality, 2008 (in press)
5
when the patient is above goal. When the patient’s A1c < 7.5%, the weak version makes treatment moves only when the A1c has stopped decreasing or is increasing compared to the previous encounter. By using this rule, the weak version does not need to combine dose-response curves in order to avoid over-medicating the patient, possibly resulting in hypoglycemia. The weak feedforward version schedules visits every 60 or 90 days (this allows enough time between moves for medications to have the majority of its effect, thus avoiding the need to combine dose-response curves). The weak feedforward strategy uses a relatively simple (linear) representation of a dose-response curve to anticipate the amount of change in A1c that is to be expected for a given treatment move. On each encounter, the weak feedforward PPM compares the anticipated A1c with the measured A1c (to infer patient adherence, see Figure 1). The strong version of the feedforward strategy makes moves every encounter when the patient is above goal. This version of the feedforward strategy combines dose-response curves in order to estimate delayed effects of medications. Because this version of the feedforward strategy can combine dose-response curves, visits can be scheduled as frequently as every 30 days. If less than expected results are obtained from a prior move, and patient adherence is not an issue, an additional medication can be introduced and more than one medication can then be titrated during a given visit. The strong feedforward strategy has a more complex (piecewise linear) representation of the patient’s responses to treatment moves (which is needed for combining dose-responses from more than one treatment move).
Experiment
An experiment was conducted to determine the effect of the two versions of each model when treating simulated populations of diabetic patients. In the research reported here, the focus was on the way each PPM managed patient blood sugar values. BP and lipid values were treated but are not reported. All models were tested on their ability to bring patients’ A1c values to less than 7% within one year. Four metrics were used to evaluate each of the models at the end of one year of treatment: (1) proportion of patients reaching goal, (2) average final A1c values, (3) average costs to treat patients, and (4) proportion of encounters with errors of omission. Simulated Patients: Using statistical characteristics in an existing database of real patients as a guide, a population of 10,000 synthetic patients was created. Patients were blocked into cells (or groups), according to their initial A1c value and their level of adherence to treatment, for a total of six cells: low A1c (A1c < 8%); medium A1c (8% < A1c < 10%); high A1c (A1c > 10%); low adherence (< 75% compliance with treatment); high adherence (> 75% compliance with treatment). The levels of low, medium, and high A1c were abbreviated as L, M, and H. Cells were labeled using a two letter-designator where the first letter specifies A1c range and the second letter specifies level of adherence (e.g., cell MH represents patients with medium initial A1c and high adherence to treatment). The number (percentages) of simulated patients in each cell was as follows: LL, 900 (9%); LH, 6000 (60%); ML, 400 (4%); MH, 1900 (19%); HL, 200 (2%); and HH, 600 (6%). These numbers reflect the actual distribution of patients in the administrative (clinical) database. Average initial A1c values within each A1c range were: low, 6.7%; medium, 8.8%; high, 11%. Average initial adherence was 60% in low adherence cells and 90% in high adherence cells.
Advances in Patient Safety: New Directions and Alternative Approaches.
Agency for Healthcare Research and Quality, 2008 (in press)
6
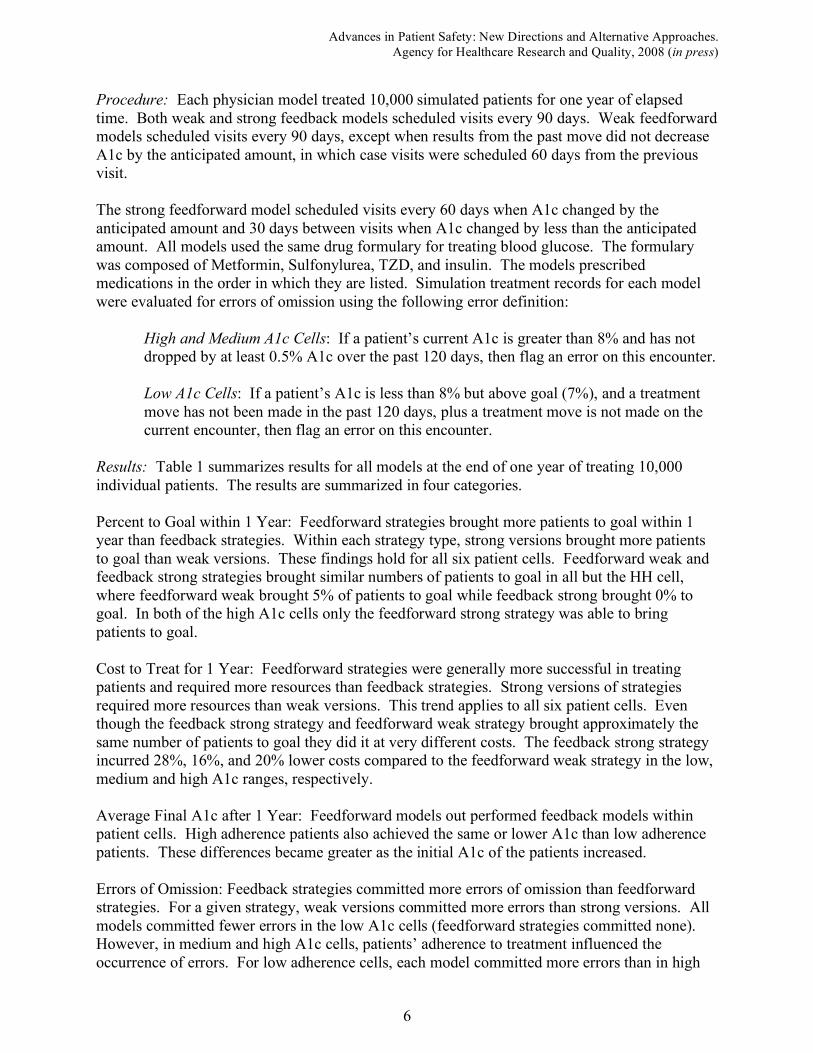
Procedure: Each physician model treated 10,000 simulated patients for one year of elapsed time. Both weak and strong feedback models scheduled visits every 90 days. Weak feedforward models scheduled visits every 90 days, except when results from the past move did not decrease A1c by the anticipated amount, in which case visits were scheduled 60 days from the previous visit. The strong feedforward model scheduled visits every 60 days when A1c changed by the anticipated amount and 30 days between visits when A1c changed by less than the anticipated amount. All models used the same drug formulary for treating blood glucose. The formulary was composed of Metformin, Sulfonylurea, TZD, and insulin. The models prescribed medications in the order in which they are listed. Simulation treatment records for each model were evaluated for errors of omission using the following error definition:
High and Medium A1c Cells: If a patient’s current A1c is greater than 8% and has not dropped by at least 0.5% A1c over the past 120 days, then flag an error on this encounter. Low A1c Cells: If a patient’s A1c is less than 8% but above goal (7%), and a treatment move has not been made in the past 120 days, plus a treatment move is not made on the current encounter, then flag an error on this encounter.
Results: Table 1 summarizes results for all models at the end of one year of treating 10,000 individual patients. The results are summarized in four categories. Percent to Goal within 1 Year: Feedforward strategies brought more patients to goal within 1 year than feedback strategies. Within each strategy type, strong versions brought more patients to goal than weak versions. These findings hold for all six patient cells. Feedforward weak and feedback strong strategies brought similar numbers of patients to goal in all but the HH cell, where feedforward weak brought 5% of patients to goal while feedback strong brought 0% to goal. In both of the high A1c cells only the feedforward strong strategy was able to bring patients to goal. Cost to Treat for 1 Year: Feedforward strategies were generally more successful in treating patients and required more resources than feedback strategies. Strong versions of strategies required more resources than weak versions. This trend applies to all six patient cells. Even though the feedback strong strategy and feedforward weak strategy brought approximately the same number of patients to goal they did it at very different costs. The feedback strong strategy incurred 28%, 16%, and 20% lower costs compared to the feedforward weak strategy in the low, medium and high A1c ranges, respectively. Average Final A1c after 1 Year: Feedforward models out performed feedback models within patient cells. High adherence patients also achieved the same or lower A1c than low adherence patients. These differences became greater as the initial A1c of the patients increased. Errors of Omission: Feedback strategies committed more errors of omission than feedforward strategies. For a given strategy, weak versions committed more errors than strong versions. All models committed fewer errors in the low A1c cells (feedforward strategies committed none). However, in medium and high A1c cells, patients’ adherence to treatment influenced the occurrence of errors. For low adherence cells, each model committed more errors than in high

Advances in Patient Safety: New Directions and Alternative Approaches.
Agency for Healthcare Research and Quality, 2008 (in press)
7
adherence cells. Table 1. Performance of physician process models treating 10,000 synthetic patients for 1 year.
Feedback -
Weak
Feedback -
Strong
Feedforward -
Weak
Feedforward -
Strong
Percent to Goal by Cell*
LL 84.6% 94.8% 98.4% 100.0%
LH 91.9% 99.1% 99.8% 100.0%
ML 9.8% 26.5% 26.5% 90.5%
MH 20.6% 42.9% 49.5% 98.4%
HL 0.0% 0.0% 0.0% 44.5%
HH 0.0% 0.0% 5.0% 87.3%
Average Cost** to Treat by Cell
LL $811 $866 $1,210 $1,390
LH $791 $836 $1,165 $1,325
ML $1,646 $1,697 $2,044 $2,648
MH $1,639 $1,691 $2,008 $2,303
HL $1,973 $2,045 $2,526 $4,200
HH $1,961 $2,033 $2,524 $3,839
Average Final A1c by Cell
LL 6.7% 6.7% 6.5% 6.2%
LH 6.7% 6.6% 6.4% 6.1%
ML 7.9% 7.6% 7.5% 6.8%
MH 7.7% 7.4% 7.2% 6.6%
HL 10.1% 9.7% 9.2% 7.7%
HH 9.8% 9.1% 8.5% 6.8%
Percent Encounters with Errors by
Cell
LL 1.0% 0.9% 0.0% 0.0%
LH 1.2% 1.2% 0.0% 0.0%
ML 23.6% 17.0% 9.0% 3.0%
MH 16.0% 7.9% 2.3% 0.8%
HL 53.1% 52.2% 41.6% 19.3%
HH 45.8% 34.1% 27.0% 2.4%
*Cells are labeled using a two letter designator where the first letter specifies initial A1c range (L, M and H), and the
second letter specifies level of patient adherence to treatment (L or H). **Average costs include prescription costs, charges for office visits, lab orders, and referrals to specialists
(inpatient and emergency treatment costs are not included). Prescription costs were based on Average
Wholesale Prices.17
In the following sections, treatment data and error patterns were used to develop predictive tools for both synthetic and real clinical patient data.
Predicting Errors in Synthetic Patient Data Data mining is an area of computer science that uses algorithms to find patterns in datasets. One use of data mining involves the training and testing of classification functions. Common types of functions include decision trees, artificial neural networks and support vector machines.18 Each type of function, referred to as a classifier, uses a different method for categorizing input data. A classifier reads a single vector of input data and outputs a classification of these data as being one type or another (e.g., in this research it is a presence or absence of an error of omission in the
Advances in Patient Safety: New Directions and Alternative Approaches.
Agency for Healthcare Research and Quality, 2008 (in press)
8
next physician/patient encounter). Building classifiers requires a training set of data that forms the classifier and a testing set of data that tests how well the classifier works. Each vector of training data is labeled (i.e., the class label is known), thus the classifier is trained by developing a mathematical model that minimizes the number of inaccurate classifications. The present research uses decision trees
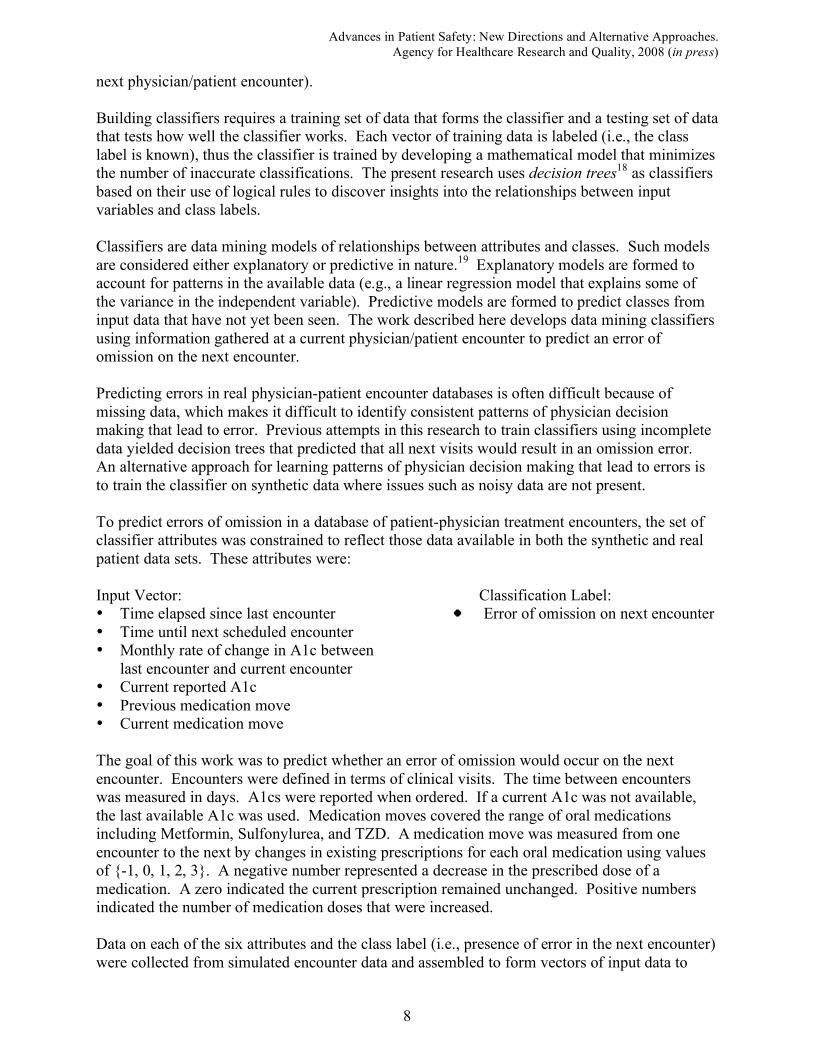
18 as classifiers based on their use of logical rules to discover insights into the relationships between input variables and class labels. Classifiers are data mining models of relationships between attributes and classes. Such models are considered either explanatory or predictive in nature.19 Explanatory models are formed to account for patterns in the available data (e.g., a linear regression model that explains some of the variance in the independent variable). Predictive models are formed to predict classes from input data that have not yet been seen. The work described here develops data mining classifiers using information gathered at a current physician/patient encounter to predict an error of omission on the next encounter. Predicting errors in real physician-patient encounter databases is often difficult because of missing data, which makes it difficult to identify consistent patterns of physician decision making that lead to error. Previous attempts in this research to train classifiers using incomplete data yielded decision trees that predicted that all next visits would result in an omission error. An alternative approach for learning patterns of physician decision making that lead to errors is to train the classifier on synthetic data where issues such as noisy data are not present. To predict errors of omission in a database of patient-physician treatment encounters, the set of classifier attributes was constrained to reflect those data available in both the synthetic and real patient data sets. These attributes were: Input Vector: Classification Label: • Time elapsed since last encounter Error of omission on next encounter • Time until next scheduled encounter • Monthly rate of change in A1c between
last encounter and current encounter • Current reported A1c • Previous medication move • Current medication move The goal of this work was to predict whether an error of omission would occur on the next encounter. Encounters were defined in terms of clinical visits. The time between encounters was measured in days. A1cs were reported when ordered. If a current A1c was not available, the last available A1c was used. Medication moves covered the range of oral medications including Metformin, Sulfonylurea, and TZD. A medication move was measured from one encounter to the next by changes in existing prescriptions for each oral medication using values of {-1, 0, 1, 2, 3}. A negative number represented a decrease in the prescribed dose of a medication. A zero indicated the current prescription remained unchanged. Positive numbers indicated the number of medication doses that were increased. Data on each of the six attributes and the class label (i.e., presence of error in the next encounter) were collected from simulated encounter data and assembled to form vectors of input data to
Advances in Patient Safety: New Directions and Alternative Approaches.
Agency for Healthcare Research and Quality, 2008 (in press)
9
train decision trees. The attributes form a collection of commonly available information representing both a momentary patient state across three clinical encounters, plus a set of physician moves connected to that state transition. The resulting set of input data was combined across all patients with initial A1c ! 8.0 and for all four physician models.
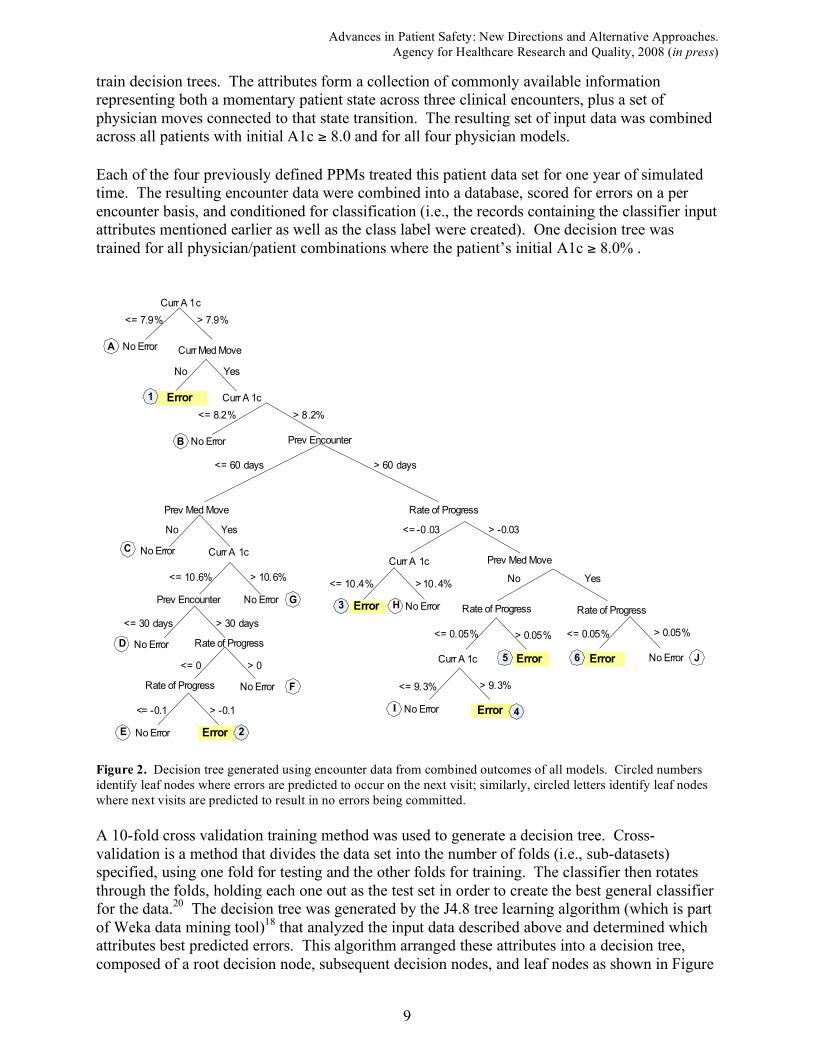
Each of the four previously defined PPMs treated this patient data set for one year of simulated time. The resulting encounter data were combined into a database, scored for errors on a per encounter basis, and conditioned for classification (i.e., the records containing the classifier input attributes mentioned earlier as well as the class label were created). One decision tree was trained for all physician/patient combinations where the patient’s initial A1c ! 8.0% .
Curr A 1c
<= 7.9% > 7.9%
Curr Med Move
Curr A 1c
No Error
Error
No Error Prev Encounter
No Yes
<= 8.2% > 8.2%
<= 60 days > 60 days
Prev Med Move Rate of Progress
No Error Curr A 1c
<= -0.03 > -0.03
Curr A 1c Prev Med Move
<= 10.4% > 10.4%
Error No Error Rate of Progress Rate of Progress
<= 0.05% > 0.05%
No ErrorErrorError
ErrorNo Error
Curr A 1c
<= 9.3% > 9.3%
<= 0.05% > 0.05%
No Yes
<= 10.6% > 10.6%
Prev Encounter No Error
<= 30 days > 30 days
Rate of Progress
<= 0 > 0
No Error
ErrorNo Error
Rate of Progress
<= -0.1 > -0.1
No Error
J
A
1
B
C
D
E 2
F
G3 H
I4
5 6
No Yes
Figure 2. Decision tree generated using encounter data from combined outcomes of all models. Circled numbers
identify leaf nodes where errors are predicted to occur on the next visit; similarly, circled letters identify leaf nodes
where next visits are predicted to result in no errors being committed.
A 10-fold cross validation training method was used to generate a decision tree. Cross-validation is a method that divides the data set into the number of folds (i.e., sub-datasets) specified, using one fold for testing and the other folds for training. The classifier then rotates through the folds, holding each one out as the test set in order to create the best general classifier for the data.20 The decision tree was generated by the J4.8 tree learning algorithm (which is part of Weka data mining tool)18 that analyzed the input data described above and determined which attributes best predicted errors. This algorithm arranged these attributes into a decision tree, composed of a root decision node, subsequent decision nodes, and leaf nodes as shown in Figure

Advances in Patient Safety: New Directions and Alternative Approaches.
Agency for Healthcare Research and Quality, 2008 (in press)
10
2.
The decision tree shown in Figure 2 is used for prediction by starting at the root of the tree and traversing a series of branches until a leaf node is reached. The value of that leaf node determines the prediction the decision tree makes for that encounter. As shown in Figure 2 circled numbers identify leaf nodes where errors of omission are predicted to occur on the next visit; circled letters identify leaf nodes where next visits are predicted to result in no errors being committed. The branch-paths from each decision tree can be stated as logical rules to classify encounters. Tracing a path in Figure 2 from the root node right, then left at the next node creates the following rule: “If a patient’s current A1c is > 7.9 and no medication move is made at a current encounter, then an error is likely to occur in the next encounter with this patient.” Each path can be similarly restated. A given leaf node does not indicate that an actual error did occur at the next encounter for each corresponding input vector; rather, it predicts that an error is likely to occur at the next encounter. Sometimes this prediction is accurate, sometimes it is not. Each leaf node is not necessarily used the same number of times throughout the dataset.
Frequency of Leaves (Synthetic Data)
0
0.1
0.2
0.3
0.4
0.5
0.6
0.7
0.8
A (
28600)
1 (
3250)
B (
4836)
C (
700)
D (
4113)
E (
3230)
2 (
1018)
F (
557)
G (
1684)
3 (
3060)
H (
873)
I (9
89)
4 (
751)
5 (
1184)
6 (
722)
J (
898)
Leaf
Pe
rce
nta
ge
of
To
tal
Accuracy of Leaves (Synthetic Data )
0
0.1
0.2
0.3
0.4
0.5
0.6
0.7
0.8
0.9
1
A (
28
600
)1
( 32
50
)B
(4
836
)
C (
700
)D
(4
11
3)
E (
32
30)
2 ( 1
01
8)
F (
557
)G
(1
68
4)3
( 30
60
)H
(8 7
3)
I ( 9
89
)4
(7
51
)5
(11
84
)
6 (
72
2)
J ( 8
98
)
Leaf
Pe
rce
nta
ge
of
Co
r re
ct
Cla
ss
ifi c
ati
on
Figure 3. Histograms show the way synthetic data coursed through the decision tree during the cross-validation
process and the accuracy with which each leaf node predicted “error” or “no error”. The 16 leaf nodes from the tree
in Figure 2 are laid flat across the x-axis in a left-to-right organization with letters denoting a prediction of “no
error” and numbers denoting “error”. Total number of data points held in each leaf node is in parentheses.
The left histogram shown in Figure 3 indicates the number of data records that end up in each of the 16 leaf nodes of the decision tree shown in Figure 2. The decision tree when tested on the synthetic data predicts the occurrence of “error” and “no error” as the positive and negative prediction, respectively. There were a total of 56,465 physician-patient encounters used to predict errors on next visits. The tree in Figure 2 correctly predicted error 8,042 times (true positives) and incorrectly 5,093 times (false positives). No error was correctly predicted 40,814 times (true negatives) and incorrectly predicted 2,516 times (false negatives). Classification results are summarized in Table 2 using the following abbreviations: TP, true positives; TN, true negatives; FP, false positives; and FN, false negatives. Data mining literature

Advances in Patient Safety: New Directions and Alternative Approaches.
Agency for Healthcare Research and Quality, 2008 (in press)
11
offers a number of different metrics to evaluate the predictive performance of decision trees.20,22 The traditional way to measure predictive accuracy is to calculate the percentage of correctly predicted class labels (both error and no error), i.e., accuracy = (TP + TN) / (TP + TN + FP + FN). As shown in Table 2, the recall measure of the predictive performance is the percentage of errors that are correctly predicted out of all the errors that actually occurred, i.e., recall = TP / (TP + FN). Precision is the percentage of the actual errors among all the encounters that were classified as errors by the decision tree, i.e., precision = TP / (TP + FP). The F-measure metric is the harmonic mean of the recall and precision metrics and is computed as F-measure = 2*(recall * precision) / (recall + precision). The F-measure, which quantifies the overall reliability of the decision tree, represents a tradeoff between correctly predicting errors and over-predicting errors. It is in the range of 0-1 and is commonly used in data mining literature to evaluate classifiers.
Table 2. Summarized results of training and testing decision trees on synthetic data.
Number of Attributes in
Tree
Attributes Used to Predict Errors
Counts Performance Metrics
6
! Current A1c
! Days since last encounter
! Days to next encounter
! Med adjustment – current visit
! Med adjustment – previous visit
! Monthly rate of change in A1c
TP = 8042 (14%)
FP = 2516 (5%)
FN = 5093 (9%)
TN = 40,814 (72%)
Accuracy = 87%
Recall = 0.61
Precision = 0.76
F-measure = 0.68
Kappa statistic = 0.59
8
! Current A1c
! Days since last encounter
! Days to next encounter
! Oral adjustment – current visit
! Oral adjustment – previous visit ! Insulin adjustment – current visit
! Insulin adjustment – previous visit
! Monthly rate of change in A1c
TP = 9382 (17%)
FP = 2665 (5%)
FN = 3753 (7%)
TN = 40,665 (72%)
Accuracy = 89%
Recall = 0.71
Precision = 0.78
F-measure = 0.75
Kappa statistic = 0.67
11
! Current A1c level
! Days since last encounter
! Days to next encounter
! Metformin adjustment – current visit
! Metformin adjustment – previous visit
! Other oral adjustment – current visit
! Other oral adjustment – previous visit
! Current Creatinine level
! Insulin adjustment – current visit
! Insulin adjustment – previous visit ! Monthly rate of change in A1c
TP = 10,248 (18%)
FP = 1967 (3%)
FN = 2887 (5%)
TN = 41,363 (73%)
Accuracy = 91%
Recall = 0.78
Precision = 0.84
F-measure = 0.81
Kappa statistic = 0.75
The Kappa statistic in Table 2 measures similarity between the trained classifier and a random classifier. A value of 0 indicates that a random classifier predicts as well as the trained classifier, whereas a value of 1 indicates that there is no agreement between a random classifier (chance prediction) and the trained classifier (i.e., a value of 1 is a strong indication of an accurate classifier).

Advances in Patient Safety: New Directions and Alternative Approaches.
Agency for Healthcare Research and Quality, 2008 (in press)
12
The predictive accuracy (in terms of F-measure) of the decision tree presented in Figure 2 is 0.68. Attempts were next made to improve this rate by providing additional information to the data mining model. The model shown in Figure 2 was constructed using information present in the database of real patient encounter records available for this study. However, the synthetic models (described in the previous section) that were used to simulate physician/patient clinical encounters maintain a larger set of information, including the actual amounts of different types of insulin administered to each patient and the estimates of the patient’s adherence to treatment. To determine whether training predictive tools using such information could increase the accuracy of error predictions, additional information was incrementally provided. Two alternate decision trees were evaluated. In the first case, attributes for medication adjustments were further divided into oral medication adjustments and insulin adjustments. Adding these attributes increased the decision tree predictive ability (in terms of F-measure) from 0.68 to 0.75. In the second case, a decision tree was created to reflect the fact that PPMs are able to stop the use of contraindicated medications. For the formulary used in the simulation study, the PPMs use creatinine levels to determine if Metformin is contraindicated. In the second alternate tree, attributes for oral medication adjustments were subdivided into metformin adjustments vs. non-metformin adjustments, and an attribute was added for creatinine levels. These additional attributes improved the error prediction ability to 0.81. Table 2 shows that errors can be predicted more accurately by tracking additional patient data. However, since the present research tests whether predictive tools developed in a synthetic database of patient records can be transferred to an available database of real patient records, the decision trees tested on the real (administrative) data were restricted to currently available attributes.
Predicting Errors in Clinical Patient Data
The decision tree developed with synthetic data (and shown in Figure 2) was tested on an administrative database of clinical treatment records. The test was designed to predict errors in real encounter data using a decision tree constructed from synthetic models. A database of de-identified data for 129 real primary care physicians treating 12,708 real diabetes patients over the course of one year served as the test bed. Data records contained date of encounter, last reported A1c value, types and doses of prescribed oral medications (Metformin, Sulfonylurea, TZD). Although records indicated the use of insulin, titrations of insulin were not available. In cases where A1c values were not reported on a given encounter, the last measured A1c was used to fill in the missing value. The clinical data were prepared using a process similar to that used in preparing synthetic treatment data. All encounters not coded as diabetes-related encounters, using available ICD9 codes, and any duplicate entries were removed. Patients with initial A1c ! 8% were extracted
and scored with the error definition. In the real clinical data set, the first encounter for a patient was used to establish a baseline for that patient. The first usable medication move was in the second encounter, which is analogous in the synthetic database to the first encounter. Due to this difference, the first, second, and final encounters listed for each physician/patient treatment path were used to collect information, but could not be used as inputs for error prediction.

Advances in Patient Safety: New Directions and Alternative Approaches.
Agency for Healthcare Research and Quality, 2008 (in press)
13
The initial clinical database contained 77,514 encounter records, spanning 129 physicians and 12,708 patients. Usable encounter data was comprised of 3,389 records spanning 101 physicians and 799 patients. For patients with initial A1c ! 10, 83 physicians saw on average 2.5 patients
for 4.5 usable encounters per year. For patients with initial A1c ! 8% but <10%, 97 physicians
each saw 6.1 patients 4.2 times. Patients treated by physicians were excluded from these averages if they had fewer than four diabetes-related encounters within the year of clinical data examined.
Accuracy of Leaves (Administrative Data )
0
0.1
0.2
0.3
0.4
0.5
0.6
0.7
0.8
0.9
1
A (
80
1)
1 (
22
88)
B (
39)
C (
16
4)
D (
8)
E (
0)
2 ( 4
)
F (
0 )
G (
6)
3 (
1 3)
H (
3)
I (2
2)
4 (
19)
5 (
13)
6 ( 7
)
J (
2)
Leaf
Pe
rce
nta
ge
of
Co
r re
ct
Cl a
ss
ifi c
at i
on
Frequency of Leaves (Administrative Data)
0
0.1
0.2
0.3
0.4
0.5
0.6
0.7
0.8
A (
801)
1 (
2288)
B (
39)
C (
164)
D (
8)
E (
0)
2 (
4)
F (
0)
G (
6)
3 (
13)
H (
3)
I (2
2)
4 (
19)
5 (
13)
6 (
7)
J (
2)
Leaf
Pe
rce
nta
ge
of
To
tal
Figure 4. Histograms show the way real clinical data coursed through the decision tree (learned using synthetic
data) and the accuracy with which each leaf node predicted “error” or “no error”. The 16 leaf nodes from the tree in Figure 2 are laid flat across the x-axis in a left-to-right organization with letters denoting a prediction of “no error”
and numbers denoting “error”. Total number of data points held in each leaf is in parentheses.
Figure 4 shows two histograms resulting from testing the decision tree with real clinical data. There were a total of 3,389 physician-patient instances used to predict errors. The tree in Figure 2 correctly predicted error 1,844 times (true positives) and incorrectly predicted error 923 times (false positives). No error was correctly predicted 122 times (true negatives) and incorrectly predicted no errors 500 times (false negatives). The recall for errors was 67% (compared to 61% in synthetic data), and the F-measure was 0.72 (as compared to 0.68 in the synthetic data). As can be seen by the histogram on the right, most of the data are classified by the first two leaf nodes. Comparison with the histogram on the right of Figure 3 shows that in the real database fewer patients fell below 7.9% over the course of the year and fewer medical moves were made by physicians as compared with simulated data. The classification accuracy of individual leaf nodes in the decision tree varies, due in part to the small number of examples. Focusing on the first two leaf nodes (the most common nodes) it is clear that in the real (clinical) administrative data, having a patient’s A1c " 7.9% does not
prevent an error from occurring on the next encounter. Not making a medical move when a patient’s A1c > 7.9% is highly predictive of errors of omission for next encounter. It is noteworthy that the decision tree developed in a synthetic environment is able to accurately predict errors that are detected in some of the more complex branches of the tree.

Advances in Patient Safety: New Directions and Alternative Approaches.
Agency for Healthcare Research and Quality, 2008 (in press)
14
Conclusions
Simulation of four Physician Process Models (PPMs) treating populations of individual synthetic patients with type 2 diabetes over the course of one year showed heterogeneity in outcome effects for different patient subgroups in terms of 1) average resulting A1c, 2) % of patients reaching goal, 3) costs of treatment, and 4) proportions of encounters with errors of omission. From this subgroup analysis, tradeoffs in reaching evidence-based goals at lowest possible costs were made in each subgroup. Low A1c patients were driven to goal easily by all the PPMs but at lowest cost by the feedback weak model. Medium A1c patients were treated most effectively by the feedforward strong model. Significant per patient cost savings were achieved by using a feedback strong model rather than a feedforward weak model, without a large drop off in performance. In the High A1c cell, only the feedforward strong model was effective at bringing a significant percentage of patients to evidence-based goals. A specific data mining technology (a decision tree) was developed to predict errors of omission that occurred throughout the patient population by virtue of different treatment strategies. Analysis of the prediction results and the specific branch paths used by the decision tree indicated where particular patterns of physician decision making led to errors. The decision tree used to predict errors was formed by restricting the leaf node size to no less than 500 physician/patient encounters. This restriction resulted in a relatively small tree that could be used to interpret predictions generated by the model. The ability to interpret how an error is predicted has implications for the formation of policies based on these predictions. An important aspect of the work presented here is the fact that physician and patient models were used to generate simulated encounter data from which data mining tools could be developed. The ability to use these tools to predict errors of omission in real (as well as synthetic) patient data suggests that future developments in this kind of work has the potential to enable identification as well as correction of physician decision making strategies that lead to encounter-specific treatment errors.21 Application of this work to the improvement of care for patients with type 2 diabetes, as well as chronic diseases more generally, is promising.
Acknowledgements
This work was supported in part by grants from the Agency for Healthcare Research and Quality, the National Institutes of Health (NIDDK), the University of Minnesota Digital Technology Center and the Carlson School of Management Medical Institute Leadership Initiative.

Advances in Patient Safety: New Directions and Alternative Approaches.
Agency for Healthcare Research and Quality, 2008 (in press)
15
References
1. Institute of Medicine. To Err is Human: Building a Safer Health System. Washington, D.C.:
National Academy Press; 2000.
2. O’Connor P, Sperl-Hillen J, Johnson P, Rush W. Identification, Classification, and
Frequency of Medical Errors in Outpatient Diabetes. Advances in patient safety: from
research to implementation: Research Findings No. 1. Rockville (MD) Agency for
Healthcare Research and Quality. 2005 Feb. AHRQ Publication No. 05-0021-1.
3. Johnson PE, Veazie PJ, Kochevar L, et al. Understanding Variation in Chronic Disease
Outcomes. Health Care Management Science 2002:5:175-189. 4. Veazie PJ, Johnson PE, O’Connor PJ, et al. Making improvements in the management of
patients with type 2 diabetes: A possible role for the control of variation in glycated hemoglobin. Medical Hypotheses 2005:64:792-801.
5. Siau K. Health Care Informatics. IEEE Transactions on Information Technology in
Biomedicine 2003 March;7(1):1-7
6. Breault J, Goodall C, Fos P. Data mining a diabetic data warehouse. Artificial Intelligence in
Medicine 2002;26:37-54.
7. Dutta P, Biltz GR, Johnson PE, et al.. SimCare: A Model for Studying Physician Decision
Making Activity. Advances in patient safety: from research to implementation: Programs,
Tools, and Products No. 4. Rockville (MD) Agency for Healthcare Research and Quality.
2005 Feb. AHRQ Publication No. 05-0021-4.
8. Mazze R, Strock E, Simonson G, et al. Staged diabetes management: detection and treatment.
Minneapolis, MN: International Diabetes Center; 2001.
9. Defronzo R. Pharmacologic therapy for type 2 diabetes mellitus. Ann Intern Med 1999;
131(4): 281-303.
10. Tseng C, Brimacombe M, Xie M, et al. Seasonal Patterns in Monthly Hemoglobin A1c
Values. American Journal of Epidemiology 2005;161(6):565-574.
11. Derr R, Garrett E, Stacy G, Saudek C. Is HbA1c Affected by Glycemic Instability? Diabetes
Care 2003;26(10):2728-2733.
12. Levy J, Atkinson AB, Bell PM, et al. Beta-cell deterioration determines the onset and rate of
progression of secondary dietary failure in type 2 diabetes mellitus: the 10-year follow-up of
the Belfast Diet Study. Diabetic Medicine 1998; 15: 290-296.
13. Brehmer B. Strategies in Real-Time Dynamic Decision Making. In: Hogarth R, editor.
Insights in Decision Making: A Tribute to Hillel J. Einhorn. Chicago, University of Chicago
Press;1990.
14. Garcia C, Morari M. Internal Model Control. 1. A Unifying Review and Some New Results.
Industrial & Engineering Chemistry Process Design and Development 1982;21:308-323.

Advances in Patient Safety: New Directions and Alternative Approaches.
Agency for Healthcare Research and Quality, 2008 (in press)
16
15. Tversky A, Kahneman D. Judgment under Uncertainty: Heuristics and Biases. Science
1974;185: 1124-1131.
16. Sterman J. Misperceptions of Feedback in Dynamic Decision Making. Organizational
Behavior and Human Decision Processes 1989;43(3):301-335.
17. Sitagliptin (Januvia) for Type 2 Diabetes. The Medical Letter on Drugs and Therapeutics
2007 Jan 1;49(1251).
18. Witten I, Frank E. Data Mining: Practical Machine Learning Tools and Techniques with Java
Implementations. San Francisco, Morgan Kaufmann Publishers; 2000.
19. Shmueli G, Koppius, O. Predictive vs. Exploratory Modeling in IS Research, Conference on
Information Systems and Technology, Seattle, WA, Nov. 3-4, 2007.
20. Mitchell, T. Machine Learning. Boston: McGraw Hill; 1997.
21. Green L, Seifert C. Translation of Research Into Practice: Why We Can’t “Just Do It.” The
Journal of the American Board of Family Medicine 2005;18(6):541-545.