

USING DATA FOR EQUITY AND SOCIAL JUSTICE: A...
69
USING DATA FOR EQUITY AND SOCIAL JUSTICE: A CASE STUDY ON K-12 FILIPINO ACHIEVEMENT GAPS AND OPPORTUNITIES IN HAWAIʻI PUBLIC SCHOOLS Patricia Halagao, Ph.D. Associate Professor University of Hawaiʻi at Mānoa May 12, 2017 Hawai‘i DXP Data Summit 2017
Transcript of USING DATA FOR EQUITY AND SOCIAL JUSTICE: A...

USING DATA FOR EQUITY AND SOCIAL JUSTICE: A CASE STUDY ON K-12 FILIPINO ACHIEVEMENT GAPS AND OPPORTUNITIES IN HAWAIʻI PUBLIC SCHOOLS
Patricia Halagao, Ph.D. Associate Professor University of Hawaiʻi at Mānoa May 12, 2017
Hawai‘i DXP Data Summit 2017

Who are you? Who am I?


Overview • Purpose • Data collection • Data analysis • Implications

Purpose • Presents the first large scale and current examination of
Hawaii DOE data on Filipinos • Provides a baseline to understand the status of K-12
Filipino American education • Analyzes data to identify target areas of challenges and
successes • Analyzes data to improve instruction and Filipino student
academic achievement • Provides recommendations for curricular and systemic
reform

PURPOSE: TO USE DATA TO IMPROVE FILIPINO STUDENT ACHIEVEMENT
“The need for data – instead of intuition, tradition, and convenience – to guide administrative and educational
decisions has become increasingly important” - Learning Points Associates
Data Collection • Data Source: HawaiʻiDepartment of Education, 2013-2016 • David Moyer, Data Fellow, DOE Office of Strategic
Reform • Hawaiʻi P-20 Partnerships for Education’s Hawaiʻi Data
eXchange Partnership • Collaboration • Reflection
Types of Data • Demographic Data (population, concentration) • Academic Achievement Data (Standardized tests,
proficiency rates in Language arts & math, Graduation rates, College Enrollment, Complex)
• Quantitative Intersectionality (achievement data X ethnicity, class, gender, language)

Data Analysis • Focus questions • Analyze Data patterns • Generate Hypothesis • Check Hypothesis

DEMOGRAPHIC DATA Who are our students? What trends do we see in our student population? Where are students concentrated?

HI Department of Education • 9th largest schools district and only statewide educational
system in the country • King Kamehameha III established Hawaii’s public school
system in 1840 making it one of the oldest school districts West of the Mississippi
• Comprised of 255 schools and 33 charter schools • Serves 185,000 students, employs 13,000 teachers • Act 51

Ethnicity • Surprises? • Where are different ethnic groups concentrated? • Are our schools ethnically segregated?


Demographic Data Patterns • Filipinos have consistently made up the second largest
ethnic group in DOE (22%). • Filipino student enrollment concentrated on Oahu,
primarily Central and Leeward areas • Filipinos make up the majority student enrollment in the 3
out of the 5 largest high schools (Campbell 35%, Waipahu 45%, Farrington 50%),3 out of 5 middle schools (Waipahu 28%, Kalakaua 52%, Maui Waena 35%), 2 out of 5 elementary schools (August Ahrens 54%, Ewa El. 26%) in Hawaii
ACHIEVEMENT DATA What is the achievement according to race/ethnicity? In terms of proficiency of standardized assessments? What are the achievement trends?


Student Achievement • What is the academic proficiency rate by ethnicity?

Asian, 0.69
Filipino, 0.49
Micronesian, 0.18
Native Hawaiian, 0.34
Samoan, 0.29
White, 0.62
Statewide, 0.48
0
0.1
0.2
0.3
0.4
0.5
0.6
0.7
0.8
0.9
1
SY 2010-11 SY 2011-12 SY 2012-13 SY 2013-14�SY 2014-15* SBA
School Year (SY)
State Assessment Results, Percent Proficient in English Language Arts/Reading

Asian, 0.64
Filipino, 0.43
Micronesian, 0.12
Native Hawaiian, 0.27
Samoan, 0.24
White, 0.53
Statewide, 0.41
0
0.1
0.2
0.3
0.4
0.5
0.6
0.7
0.8
0.9
1
SY 2010-11 SY 2011-12 SY 2012-13 SY 2013-14�SY 2014-15* SBA
School Year (SY)
State Assessment Results, Percent Proficient in Mathematics

Achievement Data Patterns • Lumping achievement data obscures differences • Among the 4 largest ethnic groups and those who have
been in Hawaii the longest (Native Hawaiians, Japanese, Chinese and White), Filipinos rank third in reading and math proficiency.
• Filipinos are second to bottom compared to the Native Hawaiians.
• there doesn't seem to be a group that has missed out on recent test score gains--although existing gaps have largely stayed the same.
• Filipino show gains in Math
Hawaii Public Schools Proficiency Rates and Student Growth Scores: 2007 - 2014Five largest racial/ethnic groups shown. Width of the line indicates number of students tested.
READING MATHEMATICS
0%
20%
40%
60%
80%
Pro
Native Hawaiian
Filipino
Japanese
WhiteMultiple
Multiple
Native Hawaiian
Filipino
White
Japanese
Proficiency Rates
READING MATHEMATICS
2007 2008 2009 2010 2011 2012 2013 2014 2007 2008 2009 2010 2011 2012 2013 201440
45
50
55
60
Me
White
Filipino
Japanese
Native Hawaiian
Filipino
Multiple
Native Hawaiian
Japanese
White
Median Student Growth Percentiles
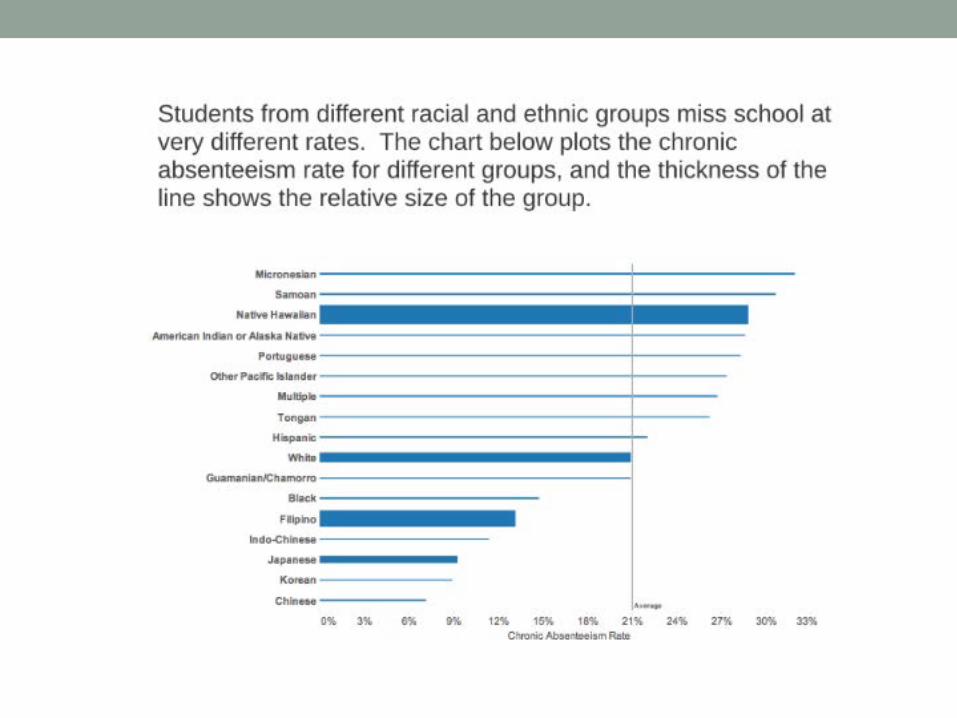
Student Achievement • What is the graduation rate by ethnicity? • What is college enrollment by ethnicity? • What is chronic absenteeism statistics by ethnicity?

0.91 0.89
0.82
0.76 0.79 0.79
0.63
0.9 0.89
0.82 0.81 0.8 0.78
0.57
0%
10%
20%
30%
40%
50%
60%
70%
80%
90%
100%
�Asian �Filipino �Statewide �Samoan �White �Native Hawaiian �MicronesianGraduated Class
On-Time Graduation Rate
2013 2014

Native Hawaiian
Flipino
White
Japanese
Multiple
40
50
60
70
80
90
Class of 2009 Class of 2010 Class of 2011
Hawaii Public Schools College Enrollment Rates within 16 months of Graduation

Asian, 0.78
Filipino, 0.58
Micronesian, 0.23
Native Hawaiian, 0.43
Samoan, 0.36
White, 0.57
Statewide, 0.55
0
0.1
0.2
0.3
0.4
0.5
0.6
0.7
0.8
0.9
1
2011 2012 2013 2014 2015
Graduated Class
First Fall College Enrollment Rate Enrolled Anywhere in Nation
Achievement Data Patterns • When disaggregated from the Asian category, Filipinos
perform 20% below their Asian peers. • Among the 4 largest ethnic groups and those who have
been in Hawaii the longest (Native Hawaiians, Japanese, Chinese and White), Filipinos rank third as a group in reading and math proficiency.
• Filipinos are performing at the state-average in reading and math proficiency.
• All ethnic groups show gain in proficiency in reading and math although existing gaps have largely stayed the same.
• Filipinos show gains in college attendance 2009-2015

INTERSECTIONALITY What is achievement according to ethnicity & gender? What is achievement according to ethnicity & socioeconomic? What is achievement according to place (complex)? What is achievement according to ethnicity & ELL?
Intersectionality is the theory of how different forms of oppression
and discrimination interact (Crenshaw, 1989)

Ethnicity & Gender • What is academic achievement according to ethnicity and
gender? • What explains this disparity?
Ethnicity & Class • What is academic achievement according to ethnicity and
class? • What explains this achievement and opportunity gap?
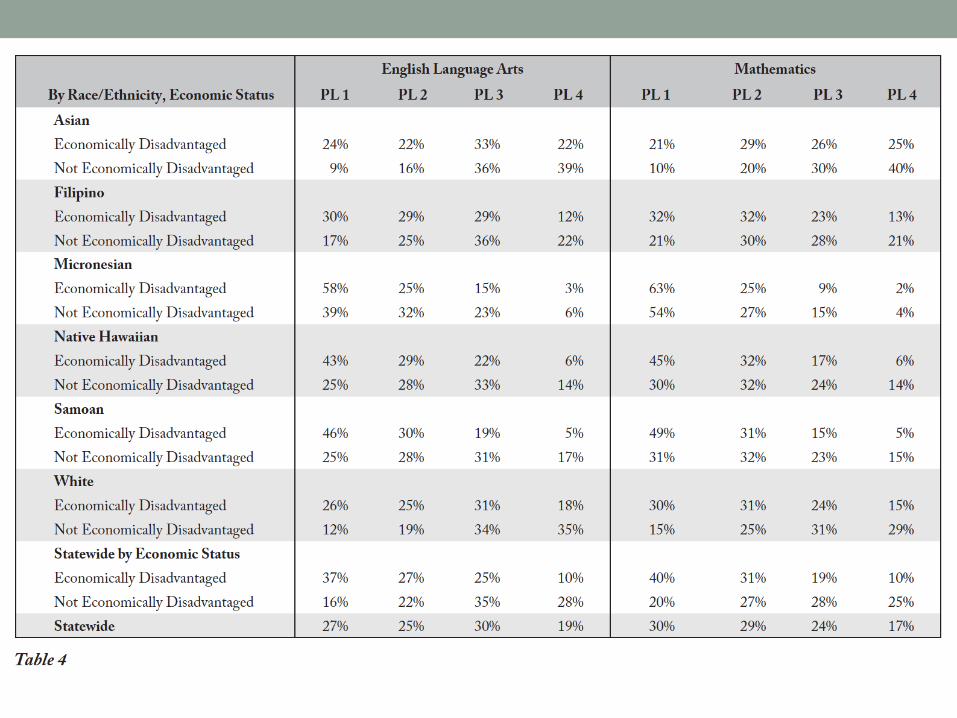
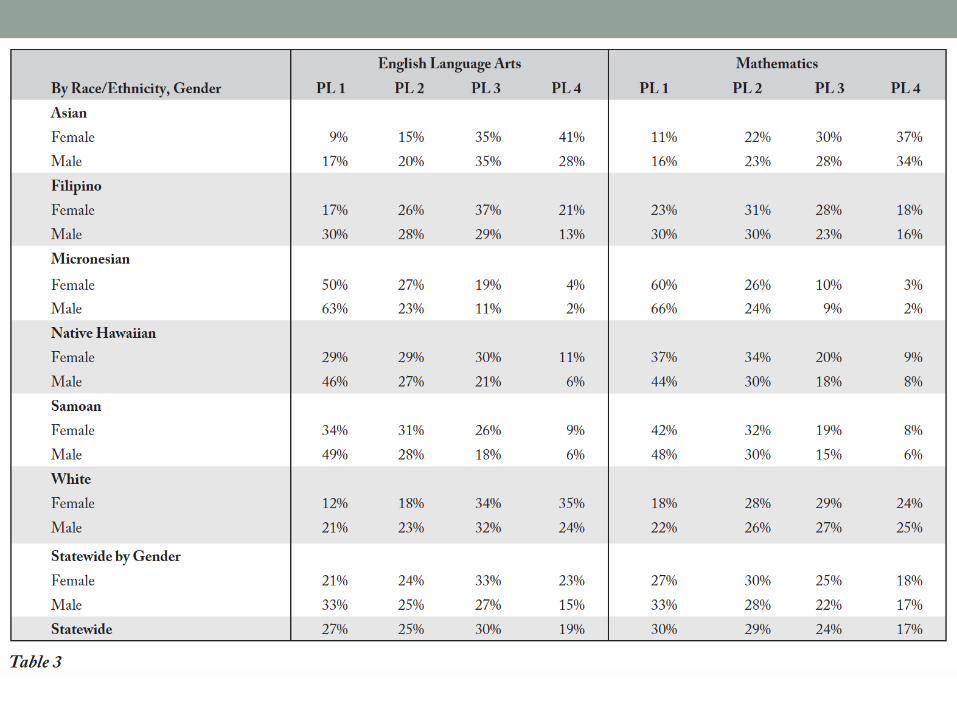
Intersectionality Patterns • When broken down according to gender and socio
economic class, their proficiency rate by gender shows Filipino girls outscoring boys, reflecting a trend in all ethnic groups
• Proficiency by ethnicity and economic disadvantage shows not economically disadvantaged outscoring economically disadvantaged

Ethnicity & Complex • What is academic achievement according to
place/complexes? • What explains this achievement and opportunity gap?


1
2 3
4
4
3
1
2
3 3
4
1
1
2 2


Ethnicity, Complex & Achievement Patterns • Filipinos faring better in schools with less Filipinos • Filipinos doing better in school with higher socioeconomic
populations (Mililani, Kailua, Kaiser, Waiakea) • Filipinos doing better in schools where culture-based
education is a focus (Keaau, Pahoa) • What’s going on in Waialua? • Watch out for Kauai.

Language & Achievement • How many EL students do we have? • What are the most spoken home languages? • Where are the home languages concentrated? • How does language affect academic achievement? • What is the achievement pattern for Filipino EL students?


Total: 13027

3950/ 13027 Filipino languages makes up 30% of languages spoken in DOE
3753/13027 Micronesian languages make up 29%
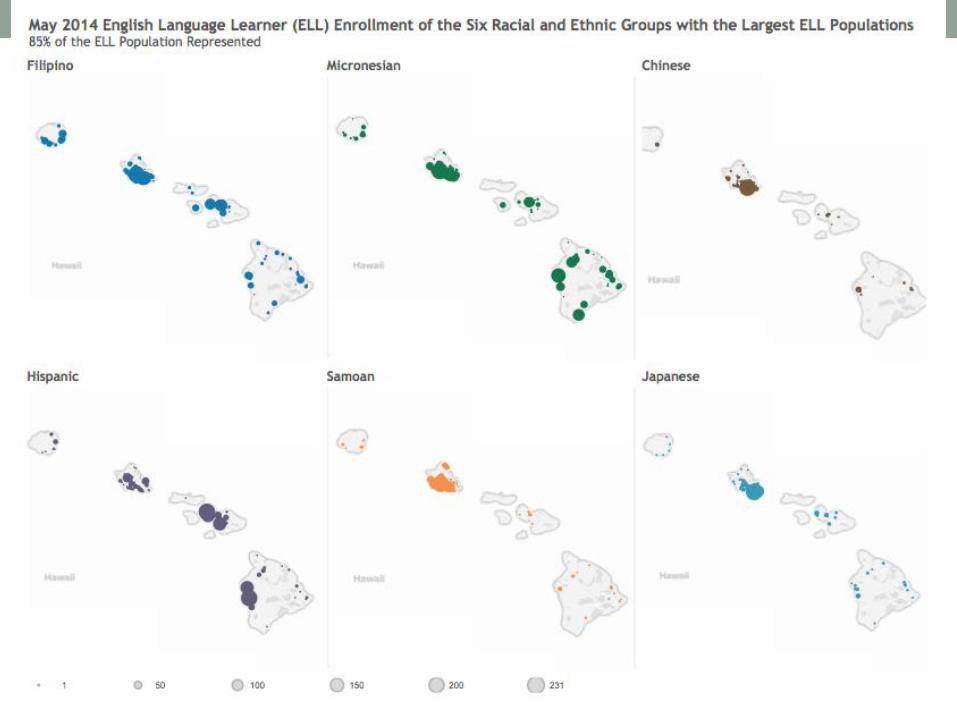
Language & Ethnicity Patterns • EL students make up 10-13.5% of the student population
over past 5 years • Concentration of certain languages in specific areas • Filipino EL students are represented most on Oahu,
followed by Maui, Kauai • Filipino languages make up 30% of the languages spoken
in the DOE • Ilokano (21%) is the top language used in schools with
Tagalog ranking as the fourth most spoken language (8%) in the schools.


Language, Ethnicity & Achievement • According to Strive HI, EL students proficiency rate
declined 2015 to 2016 by 10 % in ELA and Math. • There is an academic disparity between Filipino EL and
Filipino non-ELs
Analyzing Data Pattern • Based on all the data we have studied and the patterns
we have observed, what is the sum of problems that have emerged from the data?
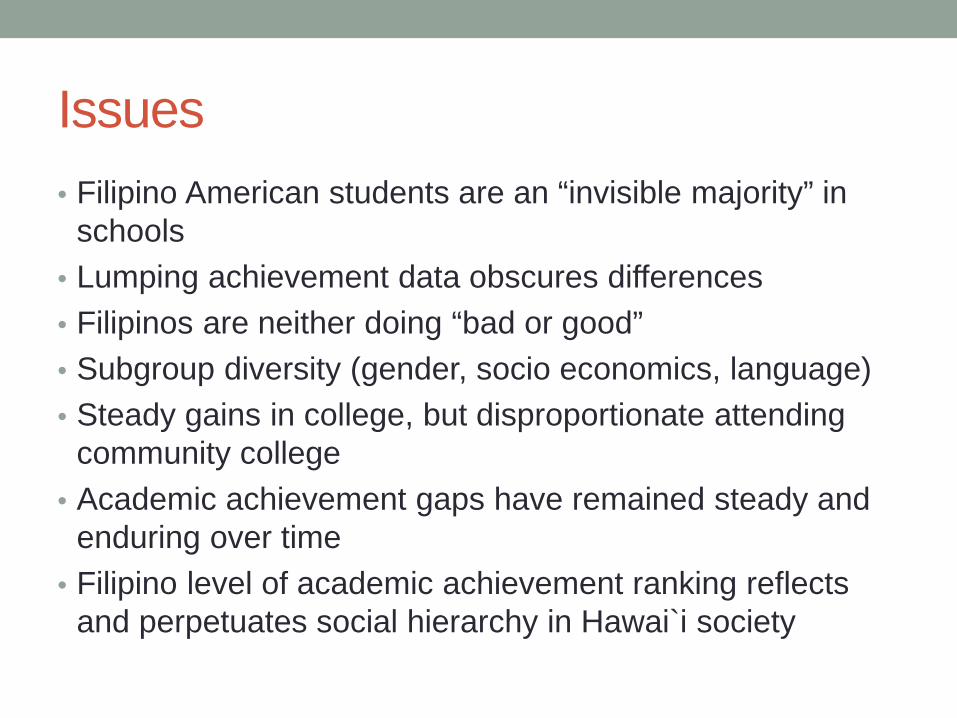
Issues • Filipino American students are an “invisible majority” in
schools • Lumping achievement data obscures differences • Filipinos are neither doing “bad or good” • Subgroup diversity (gender, socio economics, language) • Steady gains in college, but disproportionate attending
community college • Academic achievement gaps have remained steady and
enduring over time • Filipino level of academic achievement ranking reflects
and perpetuates social hierarchy in Hawai`i society
Questions • Why are our students performing the way they are? • What in our systems and practices is causing our
students to have these issues and what can we do?

Discussion • Raise Critical Awareness • Achievement vs. Opportunity Gap • Act on our Strengths

Raise Critical Awareness • Lack of awareness of seriousness of problem • Data lumped together • Race compounded with gender, class and language • Structural issues of racism and discrimination (Okamura,
2008)

Achievement vs. Opportunity Gaps • Achievement gap looks at outputs vs. opportunity gaps
look at inputs (funding, resources, opportunities) • Lack of targeted professional development • Lack of culturally relevant curriculum and pedagogy • Absence of Language education policy (ELL/Bilingual)
and equitable practice • Filipino teacher role models

Act on our Strengths • “the solutions are not found in the problems, but rather
focus on change through our strengths” Kamehameha lead evaluator (2015)
• EL vs. multilingualism

Implications & Recommendations • Evaluation and targeted qualitative research • Culturally and linguistic responsive/ sustaining pedagogy
and policies • Diverse assessment • Community Empowerment

Evaluation & Research • Develop robust data collection, research and evaluation
plan ✔ USDOE AAPI Data Disaggregation Initiative • Dissaggregate Filipinos from Asian Category ✔ The federal ESSA law requires school districts to report student data according to subgroups such as major racial/ethnic groups, English Learners, economically disadvantaged, children with disabilities, and homeless. ✔ Proposed ESSA plan disaggregates Filipinos from Asian Category

Evaluation & Research • Track students and conduct school-level data analysis for
institutional racism (i.e. tracking, honors courses, college-going rates, careers)
• Qualitative research studies, Limitation: Need for multiple forms of data (i.e. perceptual data, school process data, well-being)
✔ Educational Perspectives themed issue on Filipinos and Education

Culturally Responsive Teaching • Uses the cultural backgrounds
of students to teach them more effectively.
• When academic knowledge and skills are situated within their lived experiences, they are more personally meaningful, interesting, and are learned more easily and thoroughly (Gay, 2000).
• Academic achievement improves when they are taught through their own cultural and experiential filters.
• s

Colonial Mentality
• Colonial racial hierarchy • Historical legacy of
colonialism (David & Okazaki, 2006)
• Plantation Mentality • This attitude results in
cultural inferiority, inability to articulate ethnic identity, and lack of ethnic pride (Strobel, 2001).

Data driven decisions • High representation demands attention • Target language resources toward local community • Concentrate Filipino professional development and
resources in areas of high Filipino concentration ✔ Filipino American Education Institute (2010) • Promote culturally relevant and critical curriculum • Address ethnic, gender and social economic equities ✔ DOE/BOE Strategic Plan (2017-2020) and Governors Blueprint

PASSION

MULTILINGUALISM FOR EQUITABLE EDUCATION
(BOE Policy 105.14)
Multilingual/ EL, Immigrant & ASL Learners
Students &
Families
HAWAIIAN EDUCATION (BOE Policy 105.7)
KA PAPHANA KAIAPUNI (BOE Policy 105.8)
Hawaiian/Indigenous All Learners
FAMILY & COMMUNITY ENGAGEMENT/ PARTNERSHIP
(BOE Policy 101.14) “Embracing the diverse cultures,
languages, strengths and needs of all families”
SEAL OF BILITERACY (BOE Policy 105.15)
Heritage/ World Language
Learners
Culturally Responsive Policies

Community Empowerment • Educate educators, administrators, legislators, policy
makers ✔ UH COE Tinalak Filipino Education Advisory Council ✔ Filipino Courier ✔ Educational Perspectives • Empower Filipinos to advocate for themselves ✔ BOE Testimony


