
How to Use Data Analytics to Detect Fixed Asset and Inventory Fraud
© 2018 Association of Certified Fraud Examiners, Inc.
Using Data Analytics to
Detect Fraud
Effectively Communicating the
Results of Data Analytics
© 2018 Association of Certified Fraud Examiners, Inc. 2 of 27
Introduction
▪ Graphical representation of data, results, or
other information
▪ Blend of art and science
▪ Requires communication skills and design
skills
© 2018 Association of Certified Fraud Examiners, Inc. 3 of 27
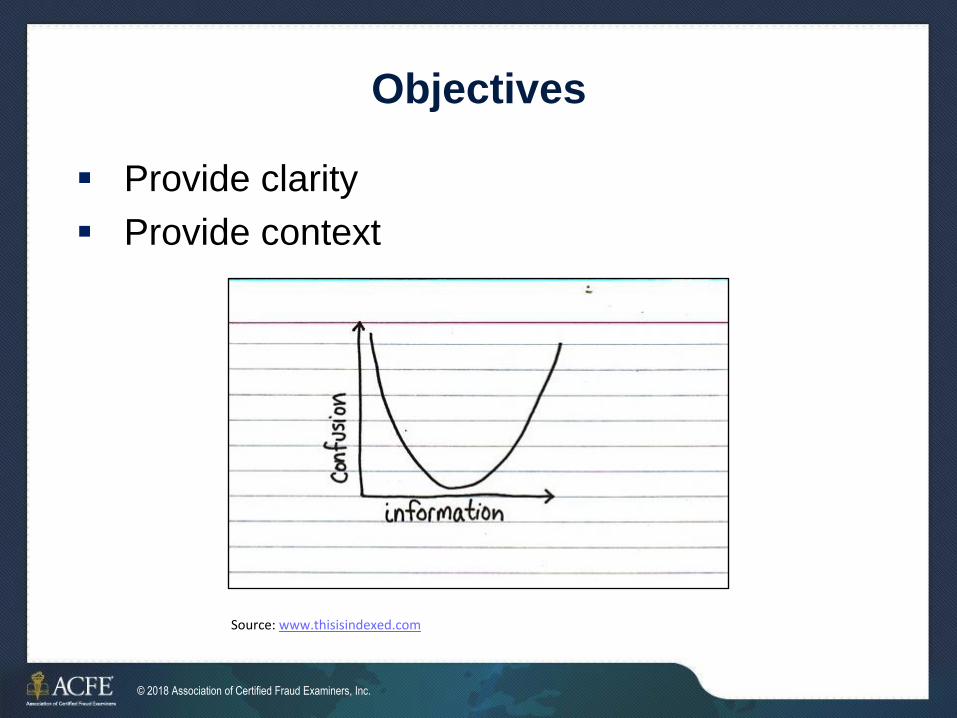
Objectives
▪ Provide clarity
▪ Provide context
Source: www.thisisindexed.com

© 2018 Association of Certified Fraud Examiners, Inc. 4 of 27
COMMUNICATION
PRINCIPLES
© 2018 Association of Certified Fraud Examiners, Inc. 5 of 27
Principle 1: Focus on the Purpose
▪ Common purposes:
• Analyze
• Educate
• Persuade
• Entertain
▪ What is the analyst trying to accomplish?
© 2018 Association of Certified Fraud Examiners, Inc. 6 of 27
Principle 2: The Audience Is
More Important Than Data
▪ Audience considerations
• Internal versus external
• Emotional versus rational
• Agreeable versus confrontational
• Novice versus expert
© 2018 Association of Certified Fraud Examiners, Inc. 7 of 27
Principle 3: Be Selective—Not
All Data Is Equal
▪ No rule requiring that everything be presented
▪ What is relevant?
© 2018 Association of Certified Fraud Examiners, Inc. 8 of 27
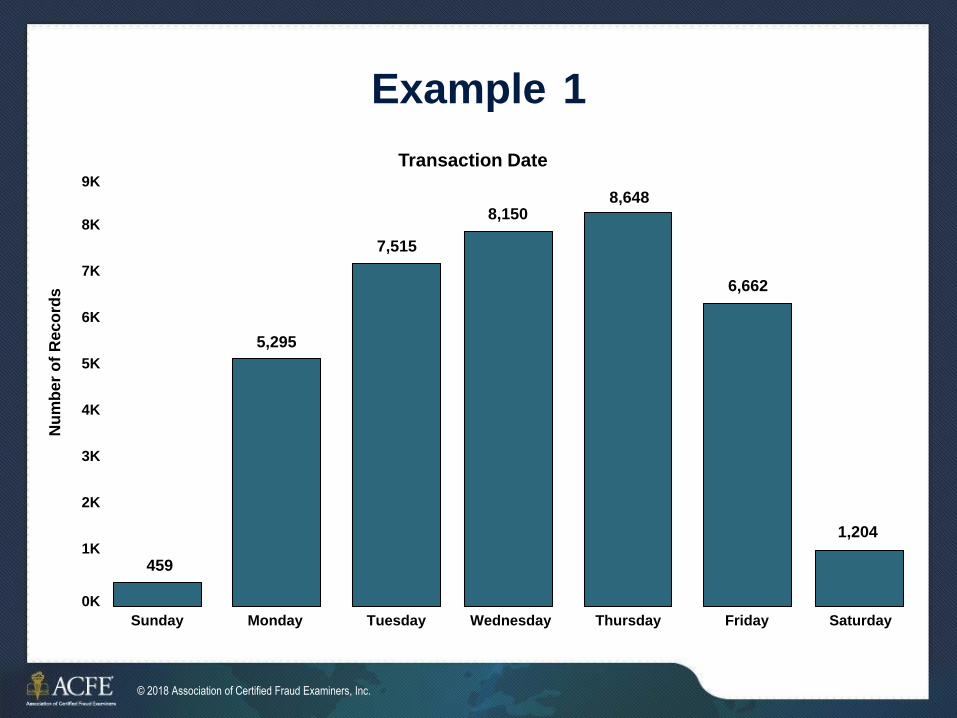
Sunday Monday Tuesday Wednesday Thursday Friday Saturday
459
7,515
5,295
8,1508,648
6,662
1,204
Transaction Date9K
8K
7K
6K
5K
4K
3K
2K
1K
0K
Nu
mb
er
of
Reco
rds
Example 1
© 2018 Association of Certified Fraud Examiners, Inc. 9 of 27
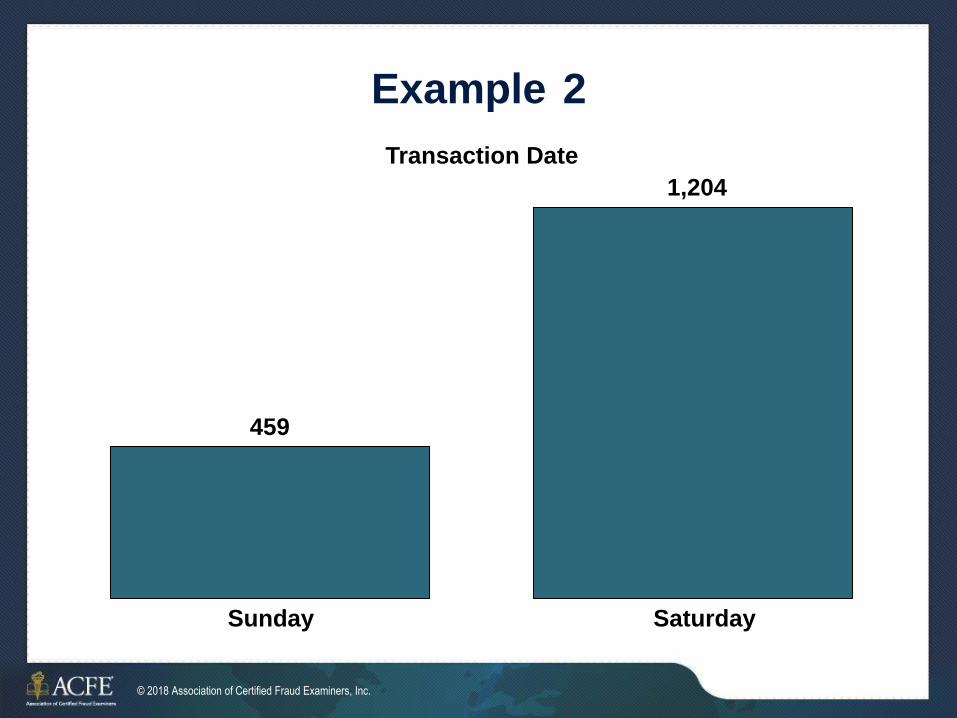
Example 2
Sunday Saturday
459
1,204
Transaction Date
© 2018 Association of Certified Fraud Examiners, Inc. 10 of 27
Principle 4: Think Visually
▪ Visuals can complement other elements of a
report.
▪ Narratives can be supplemented with a
visual.
▪ Data tables can be replaced with a visual.
▪ Each situation is unique.
© 2018 Association of Certified Fraud Examiners, Inc. 11 of 27
Principle 5: Determine the Data’s Role
▪ Detailed data is not required.
▪ Ease of use is a consideration.
▪ Data can be requested later for deeper
analysis.

© 2018 Association of Certified Fraud Examiners, Inc. 12 of 27
DESIGN ELEMENTS
© 2018 Association of Certified Fraud Examiners, Inc. 13 of 27
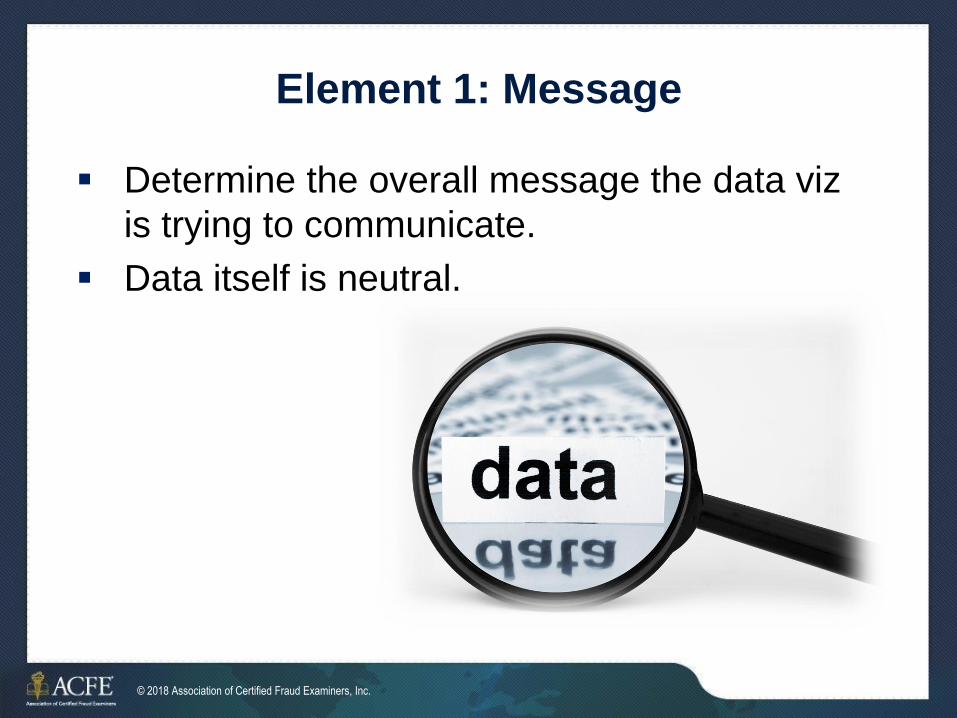
Element 1: Message
▪ Determine the overall message the data viz
is trying to communicate.
▪ Data itself is neutral.
© 2018 Association of Certified Fraud Examiners, Inc. 14 of 27
Element 2: Simplicity
▪ Carefully consider all elements of the design.
▪ Remove unnecessary chart junk.
▪ Ask: “Is there anything else that can be
removed?”
© 2018 Association of Certified Fraud Examiners, Inc. 15 of 27
Element 3: Accessories
▪ Includes all the extras on a visualization:
• Shapes
• Position
• Axis titles
• Data tables
• Trend lines
▪ Not always necessary
© 2018 Association of Certified Fraud Examiners, Inc. 16 of 27
Element 4: Color Selection
▪ Key considerations:
• Color blindness
• Printing of visualization (color or black and white)
• Predefined meaning
• Complementary or divergent
▪ Color directly impacts readability of visualization.
© 2018 Association of Certified Fraud Examiners, Inc. 17 of 27
Element 5: Visual Type
▪ Specific types have specific purposes.
▪ Choosing a chart because it is “fun” might
detract from the message.
▪ Be intentional about the visual type.
© 2018 Association of Certified Fraud Examiners, Inc. 18 of 27
Application to Fraud Examiners
▪ Visualizations are used throughout a fraud
examination:
• Planning
• The examination itself
• Reporting
• Trial and testimony
▪ All uses require slightly different approaches.