USING CURRICULUM-BASED MEASUREMENT OF … CURRICULUM-BASED MEASUREMENT OF READING TO INFORM PRACTICE...
145
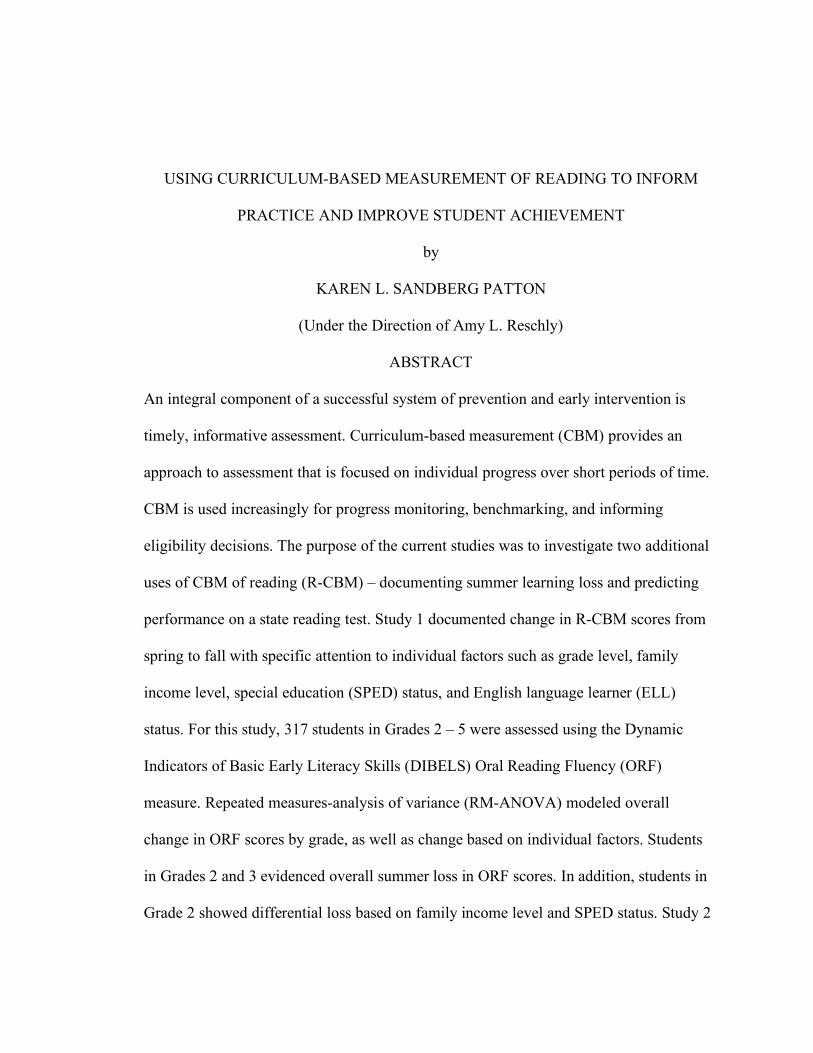
USING CURRICULUM-BASED MEASUREMENT OF READING TO INFORM PRACTICE AND IMPROVE STUDENT ACHIEVEMENT by KAREN L. SANDBERG PATTON (Under the Direction of Amy L. Reschly) ABSTRACT An integral component of a successful system of prevention and early intervention is timely, informative assessment. Curriculum-based measurement (CBM) provides an approach to assessment that is focused on individual progress over short periods of time. CBM is used increasingly for progress monitoring, benchmarking, and informing eligibility decisions. The purpose of the current studies was to investigate two additional uses of CBM of reading (R-CBM) – documenting summer learning loss and predicting performance on a state reading test. Study 1 documented change in R-CBM scores from spring to fall with specific attention to individual factors such as grade level, family income level, special education (SPED) status, and English language learner (ELL) status. For this study, 317 students in Grades 2 – 5 were assessed using the Dynamic Indicators of Basic Early Literacy Skills (DIBELS) Oral Reading Fluency (ORF) measure. Repeated measures-analysis of variance (RM-ANOVA) modeled overall change in ORF scores by grade, as well as change based on individual factors. Students in Grades 2 and 3 evidenced overall summer loss in ORF scores. In addition, students in Grade 2 showed differential loss based on family income level and SPED status. Study 2
Transcript of USING CURRICULUM-BASED MEASUREMENT OF … CURRICULUM-BASED MEASUREMENT OF READING TO INFORM PRACTICE...
USING CURRICULUM-BASED MEASUREMENT OF READING TO INFORM
PRACTICE AND IMPROVE STUDENT ACHIEVEMENT
by
KAREN L. SANDBERG PATTON
(Under the Direction of Amy L. Reschly)
ABSTRACT
An integral component of a successful system of prevention and early intervention is
timely, informative assessment. Curriculum-based measurement (CBM) provides an
approach to assessment that is focused on individual progress over short periods of time.
CBM is used increasingly for progress monitoring, benchmarking, and informing
eligibility decisions. The purpose of the current studies was to investigate two additional
uses of CBM of reading (R-CBM) – documenting summer learning loss and predicting
performance on a state reading test. Study 1 documented change in R-CBM scores from
spring to fall with specific attention to individual factors such as grade level, family
income level, special education (SPED) status, and English language learner (ELL)
status. For this study, 317 students in Grades 2 – 5 were assessed using the Dynamic
Indicators of Basic Early Literacy Skills (DIBELS) Oral Reading Fluency (ORF)
measure. Repeated measures-analysis of variance (RM-ANOVA) modeled overall
change in ORF scores by grade, as well as change based on individual factors. Students
in Grades 2 and 3 evidenced overall summer loss in ORF scores. In addition, students in
Grade 2 showed differential loss based on family income level and SPED status. Study 2

evaluated the relationship between R-CBM and the Georgia reading test by examining
the accuracy of predictions for different ORF benchmarks and the bias of predictions
based on subgroup membership. Scores on DIBELS ORF for 1,374 students in Grades 2
– 5 were used to predict outcomes the Georgia reading test. Cut scores for ORF were
generated using logistic regression and receiver operator characteristic (ROC) curve
analysis, following the procedure outlined in Silberglitt and Hintze (2005). The generated
cut scores were compared to the published DIBELS ORF benchmarks based on
diagnostic efficiency. The generated cut scores were lower than the suggested DIBELS
ORF benchmarks and had improved diagnostic efficiency. The potential for bias based on
family income level, ethnic minority status, and ELL status was investigated using
regression and RM-ANOVA. These results support the broadening application of R-
CBM and the need for additional research. Findings are discussed relative to prevention
and intervention efforts and implications for educational policy.
INDEX WORDS: Reading, Curriculum-Based Measurement, Dynamic Indicators of
Basic Early Literacy Skills, Oral Reading Fluency, Summer Learning Loss, High-Stakes Testing, Diagnostic Efficiency, Predictive Bias
USING CURRICULUM-BASED MEASUREMENT OF READING TO INFORM
PRACTICE AND IMPROVE STUDENT ACHIEVEMENT
by
KAREN L. SANDBERG PATTON
B.S., Furman University, 2005
M.A., University of Georgia, 2008
A Dissertation Submitted to the Graduate Faculty of The University of Georgia in Partial
Fulfillment of the Requirements for the Degree
DOCTOR OF PHILOSOPHY
ATHENS, GEORGIA
2011

© 2011
Karen L. Sandberg Patton
All Rights Reserved

USING CURRICULUM-BASED MEASUREMENT OF READING TO INFORM
PRACTICE AND IMPROVE STUDENT ACHIEVEMENT
by
KAREN L. SANDBERG PATTON
Major Professor: Amy L. Reschly
Committee: Scott P. Ardoin A. Michele Lease Stacey Neuharth-Pritchett Electronic Version Approved: Maureen Grasso Dean of the Graduate School The University of Georgia August 2011
iv
ACKNOWLEDGEMENTS
I would like to extend my sincere gratitude to the faculty, friends, and family who
have supported and encouraged me through this process. To my major professor, Amy, I
am so fortunate to have worked with you. You have taught me much about being a
researcher, a professional, and a mentor. I look forward to our future collaborations. I
would like to thank my dissertation committee – Scott, Michele, and Stacey – for the
support and feedback. Thanks to my fellow graduate students who assisted with data
collection. Thanks to Madison County School District without which this research would
have been impossible. I would also like to express my deepest gratitude to my parents
who have provided financial and emotional support throughout my graduate career.
v
TABLE OF CONTENTS
Page
ACKNOWLEDGEMENTS............................................................................................ iv
LIST OF TABLES .........................................................................................................vi
CHAPTER
1 DISSERTATION INTRODUCTION AND LITERATURE REVIEW........... 1
References ............................................................................................... 5
2 USING CURRICULUM-BASED MEASUREMENT TO EXAMINE
SUMMER LEARNING LOSS ............................................................................ 9
Introduction............................................................................................ 11
Method................................................................................................... 28
Results ................................................................................................... 32
Discussion.............................................................................................. 37
References ............................................................................................. 47
3 CURRICULUM-BASED MEASUREMENT AS A PREDICTOR OF
PERFORMANCE ON STATE ASSESSMENTS: A LOOK AT DIAGNOSTIC
EFFICIENCY AND PREDICTIVE BIAS ......................................................... 56
Introduction............................................................................................ 58
Method................................................................................................... 86
Results ................................................................................................... 94
Discussion............................................................................................ 108

vi
References ........................................................................................... 124
4 DISSERTATION CONCLUSION............................................................. 134

vii
LIST OF TABLES
Page
Table 1: Demographics of the Sample by Percentages ................................................... 29
Table 2: Descriptive Statistics for DIBELS Oral Reading Fluency................................. 33
Table 3: Repeated-Measures Analysis of Variance ........................................................ 36
Table 4: DIBELS Oral Reading Fluency Benchmarks ................................................... 68
Table 5: Demographics of the Sample by Percentages ................................................... 87
Table 6: Descriptive Statistics of the Sample ................................................................. 97
Table 7: Correlations between Measures by Grade and Time......................................... 98
Table 8: Logistic Regression Model Summary .............................................................. 99
Table 9: Comparison of Sample-Specific Cut Scores and DIBELS Benchmarks.......... 100
Table 10: Diagnostic Efficiency Results for DIBELS Benchmarks .............................. 101
Table 11: Diagnostic Efficiency Results for Sample-Specific Cut Scores..................... 101
Table 12: Regression Results by Grade and Subgroup ................................................. 105

1
CHAPTER 1
DISSERTATION INTRODUCTION AND LITERATURE REVIEW
Learning to read is one of the great accomplishments in childhood; yet, for some
children reading becomes not a successful endeavor but one wrought with struggle and
failure. Generally, children develop reading skills in the early elementary grades; yet,
large numbers of children struggle to master these foundational skills. Specific groups of
children are at a disproportionate risk for reading failure, including children who are
African-American or Latino, children from low-income households, and children whose
primary language is not English (American Federation of Teachers, 1999; Missall et al.,
2007; Snow, Burns, & Griffin, 1998). Similarly, long-standing gaps in reading achievement
exist between these minority or at-risk groups of children and the majority population
(National Center for Educational Statistics [NCES], 2009a, 2009b; NCES, 2010).
Moreover, children who have early reading difficulties are at increased risk to experience
later reading failure, as well as high school dropout (Reschly, 2010; Snow et al., 1998).
Despite what may appear to be a bleak outlook for children with early reading
difficulties, recent research supports the positive impact of prevention and early
intervention (Snow et al., 1998; Torgesen, 2000; Vaughn, Linan-Thompson, & Hickman,
2003). Incidentally, much of recent federal and state educational legislation focused on
these two areas (e.g., Reading First, Early Reading First, No Child Left Behind).
An integral component of a successful system of prevention and early intervention
is timely, informative assessment. Educators need results of assessments of educational
progress and academic attainment to guide their decision making and allocation of

2
services. The assessments mandated by most states are end-of-the-year achievement tests,
which, unfortunately, lack utility as measures to inform instruction during the academic
year. The results are too delayed to impact educational planning and are not informative
regarding individual progress or change (Baker & Good, 1995; Crawford, Tindal, &
Stieber, 2001; McGlinchey & Hixson, 2004). Curriculum-based measurement (CBM)
provides a different approach to assessment than is provided by statewide achievement
testing. CBM is a set of measures that may be based in the student’s curriculum and is
amenable to frequent administration (Deno, 1985, 1992). The most widely used and
supported CBM measure is the one for oral reading (R-CBM; for a review, see Reschly,
Busch, Betts, Deno, & Long, 2009). Though initially praised for its utility in monitoring
the progress of students in special education, R-CBM now holds a prominent, and
promising, role in national efforts toward increased accountability, prevention, and early
intervention. Presently, R-CBM data are used for monitoring the effectiveness of
interventions (e.g., Deno et al., 2009; Fuchs & Fuchs, 1986; Marston & Magnusson,
1985), benchmarking (Good, Simmons, & Kame’enui, 2001; Hasbrouck & Tindal, 1992),
documenting summer learning loss (Allinder & Eicher, 2004; Helf, Konrad, &
Algozzine, 2008; Rosenblatt, 2002), and predicting performance on high-stakes
assessments (e.g., Buck & Torgesen, 2003; Crawford et al., 2001; Hintze & Silberglitt,
2005; McGlinchey & Hixson, 2004; Roehrig, Petscher, Nettles, Hudson, & Torgesen,
2008; Shapiro, Keller, Lutz, Santoro, & Hintze, 2006). In all applications the superceding
purpose of R-CBM remains the same – to provide helpful, timely information to
educators that may be used to benefit student achievement.
3
Empirical evidence supporting the various applications of R-CBM is growing, yet
incomplete. Questions remain regarding appropriate uses of R-CBM data and the ability
to generalize these applications to population subgroups. The following two studies
addressed two contexts in which R-CBM data may be advantageous for identifying
student needs and improving student outcomes.
In the first study (Chapter 2), the context was summer learning loss, a phenomenon
often seen among students from low-income backgrounds or other disadvantaged groups
(Cooper, Nye, Charlton, Lindsay, & Greathouse, 1996). The literature review focused on
research documenting summer learning loss and its differential effects on students from
certain subgroups. Of particular interest were the few studies that used R-CBM to assess
for loss over an extended break (i.e., summer break) from school (Allinder & Eicher,
2004; Helf et al., 2008; Rosenblatt, 2002). The first study utilized R-CBM data from
spring and fall assessments to investigate the impact of summer on elementary school
students, both overall and by subgroup.
The context of the second study (Chapter 3) was predicting performance on state
achievement tests. Whereas many states periodically use R-CBM to monitor the progress
of students throughout the school year, only a handful of states have evaluated the value
of R-CBM data for predicting performance on their tests of reading achievement (for a
review, see Yeo, 2009). Even fewer states have examined the predictions for evidence of
predictive bias (Hixson & McGlinchey, 2004; Roehrig et al., 2008; Wilson, 2005). The
second study provided a review of the literature that used R-CBM data to generate cut
scores specific to a state reading assessment, as well as the studies that evaluated generic
cut scores with specific state reading tests. Subsequently, research on predictive bias with
4
R-CBM was presented. This study used R-CBM data and state reading test scores from a
district to generate cut scores and examine the resulting predictions for bias based on
subgroup membership.
5
References
Allinder, R. M. & Eicher, D. D. (1994). Bouncing back: Regression and recoupment
among students with mild disabilities following summer break. Special Services
in the Schools, 8(2), 129-142.
American Federation of Teachers. (1999). Teaching reading IS rocket science: What expert
teachers of reading should know and be able to do. Project Director, Louisa C.
Moats, Washington, DC. Retrieved from http://www.aft.org/
Baker, S. K. & Good, R. (1995). Curriculum-based measurement of English reading with
bilingual Hispanic students: A validation study with second-grade students. School
Psychology Review, 24(4), 561-578.
Buck, J. & Torgesen, J. (2003). The Relationship between performance on a measure of
oral reading fluency and performance on the Florida Comprehensive Assessment
Test (Tech. Rep. No. 1). Tallahassee, FL: Florida Center for Reading Research.
Cooper, H., Nye, B., Charlton, K., Lindsay, J., & Greathouse, S. (1996). The effects of
summer vacation on achievement test scores: A narrative and meta-analytic
review. Review of Educational Research, 66(3), 227-268.
Crawford, L., Tindal, G., & Stieber, S. (2001). Using oral reading rate to predict student
performance on statewide achievement tests. Educational Assessment, 7(4), 303-323.
Deno, S. L. (1985). Curriculum-based measurement: The emerging alternative. Exceptional
Children, 52, 219-232.
Deno, S. L. (1992). The nature and development of curriculum-based measurement.
Preventing School Failure, 36(2), 5-10.
6
Deno, S., Reschly, A.L., Lembke, E, Magnussen, D., Callender, S., Windram, H., &
Statchel, N. (2009). A school-wide model for progress monitoring. Psychology in
the Schools, 46, 44-55.
Fuchs, L. S. & Fuchs, D. (1986). Curriculum-based assessment of progress toward long-
term and short-term goals. The Journal of Special Education, 20, 69-82.
Good, R. H., Simmons, D. C., & Kame’enui, E. J. (2001). The importance of decision-
making utility of a continuum of fluency-based indicators of foundational reading
skills for third grade high-stakes outcomes. Scientific Studies of Reading, 5, 257-
288.
Hasbrouck, J. E. & Tindal, G. (1992). Curriculum-based oral reading fluency norms for
students in grades 2 through 5. Teaching Exceptional Children, 24, 41-44.
Helf, S., Konrad, M., & Algozzine, B. (2008). Recouping and rethinking the effects of
summer vacation on reading achievement. Journal of Research in Reading, 31(4),
420-428.
Hintze, J. M. & Silberglitt, B. (2005). A longitudinal examination of the diagnostic
accuracy and predictive validity of R-CBM and high-stakes testing. School
Psychology Review, 34(3), 372-386.
Hixson, M. D. & McGlinchey, M. T. (2004). The relationship between race, income, and
oral reading fluency and performance on two reading comprehension measures.
Journal of Psychoeducational Assessment, 22, 351-364.
Marston, D. & Magnusson, D. (1985). Implementing curriculum-based measurement in
special and regular education settings. Exceptional Children, 52, 266-276.
McGlinchey, M. T. & Hixson, M. D. (2004). Using curriculum-based measurement to
predict performance on state assessments in reading. School Psychology Review,
7
33(2), 193-203.
Missall, K., Reschly, A., Betts, J., McConnell, S., Heistad, D., Pickart, M., … Marston, D.
(2007). Examination of the predictive validity of preschool early literacy skills. School
Psychology Review, 36(3), 433-452.
National Center for Education Statistics, Institute of Education Sciences. (2009a). The
Nation's Report Card: Mathematics 2009 (NCES 2010-451). Washington, D.C.:
U.S. Department of Education. Retrieved from
http://nces.ed.gov/pubsearch/pubsinfo.asp?pubid=2010451
National Center for Education Statistics, Institute of Education Sciences. (2009b). The
Nation's Report Card: Reading 2009 (NCES 2010-458). Washington, D.C.: U.S.
Department of Education. Retrieved from
http://nces.ed.gov/pubsearch/pubsinfo.asp?pubid=2010458
National Center for Education Statistics, Institute of Education Sciences. (2010). The
Condition of Education 2010 (NCES 2010-028). Washington, D.C.: U.S.
Department of Education. Retrieved from
http://nces.ed.gov/pubsearch/pubsinfo.asp?pubid=2010028
Reschly, A. L. (2010). Reading and school completion: Critical connections and Matthew
Effects. Reading Research Quarterly, 26(1), 67-90. doi:
10.1080/10573560903397023
Reschly, A. L., Busch, T. W., Betts, J., Deno, S. L., & Long, J. (2009). Curriculum-Based
Measurement Oral Reading as an indicator of reading achievement: A meta-
analysis of the correlational evidence. Journal of School Psychology, 47, 427-469.
Roehrig, A., Petscher, Y., Nettles, S. M., Hudson, R. F., & Torgesen, J. K. (2008).
Accuracy of the DIBELS Oral Reading Fluency measure for predicting third

8
grade reading comprehension outcomes. Journal of School Psychology, 46, 343-
366.
Rosenblatt, M. L. (2002). The effects of summer vacation on children’s reading
performance: An examination of retention and recoupment using curriculum-
based measurement (Unpublished master’s thesis). Syracuse University,
Syracuse, NY.
Shapiro, E. S., Keller, M. A., Lutz, J. G., Santoro, L. E., & Hintze, J. M. (2006).
Curriculum-based measures and performance on state assessment and
standardized tests. Journal of Psychoeducational Assessment, 24 (1), 19-35.
Snow, C. E., Burns, M. S., & Griffin, P. (Eds.). (1998). Preventing reading difficulties in
young children. Washington, D.C.: National Academy Press.
Torgesen, J, K. (2002). The prevention of reading difficulties. Journal of School
Psychology, 40, 7-26.
Vaughn, S., Linan-Thompson, S., & Hickman-Davis, P. (2003). Response to treatment as
a means for identifying students with reading/learning disabilities. Exceptional
Children, 69(4) pp. 391-410.
Wilson, J. (2005). The relationship of Dynamic Indicators of Basic Early Literacy Skills
(DIBELS) Oral Reading Fluency to performance on Arizona Instrument to
Measure Standards (AIMS). Research Brief. Tempe, AZ: Tempe School District
No. 3 Assessment and Evaluation Department.
Yeo, S. (2009). Predicting performance on state achievement tests using curriculum-
based measurement in reading: A multilevel meta-analysis. Remedial and Special
Education. Advance online publication. doi: 10.1177/0741932508327463

9
CHAPTER 2
USING CURRICULUM-BASED MEASUREMENT
TO EXAMINE SUMMER LEARNING LOSS1
1 Sandberg Patton, K. L. & Reschly, A. L. To be submitted to Elementary School Journal.
10
Abstract
Summer learning loss of reading is a potential factor in maintaining, and potentially
widening, the achievement gap between students based on family income, ethnicity,
home language, or other at-risk variables. This study used curriculum-based measurement
of reading (R-CBM) to investigate the effect of a summer break on reading skills. R-
CBM is a quick, inexpensive assessment designed to document individual change over
short intervals. Despite these properties, R-CBM has not been utilized often in studies of
summer learning loss. For this study, 317 students in Grades 2 – 5 were assessed in the
spring and fall using the Oral Reading Fluency (ORF) measure of the Dynamic Indicators
of Basic Early Literacy Skills. Repeated measures-analysis of variance modeled overall
change in ORF scores by grade, as well as change based on family income level (as
measured by eligibility for free or reduced-price lunch [FRL]), ethnic minority status,
English language learner (ELL) status, and special education (SPED) status. Students in
Grades 2 and 3 evidenced overall summer loss in ORF scores with the within-subjects
factor of time (effects sizes of .160 and .088, respectively). Students in Grades 4 and 5
did not exhibit loss over the summer. In addition, students in Grade 2 showed differential
loss based on FRL eligibility and SPED status (effect sizes ranging from .113 to .080).
These results support the broadening application of R-CBM and add to the summer
learning loss literature. Findings are discussed relative to prevention and intervention
efforts.
11
Introduction
For decades, researchers have painted a disquieting picture of the educational
outcomes of our nation’s youth - an achievement gap between students based on family
income, ethnicity, and home language that is present at the commencement of schooling
and persists throughout all levels of education (National Center for Education Statistics
[NCES], 2009a, 2009b; NCES, 2010). Substantial efforts have been made to close this
gap (e.g., No Child Left Behind, Reading First, Summer Term Education Programs for
Upward Performance Act of 2007, National Summer Learning Day), yet struggling
students continue to make fewer gains than students with initially higher achievement. In
several large, inner-city school districts the achievement gap expands as children progress
through school, leading to criticism of educational reform efforts and teaching practices
(Chin & Phillips, 2004, 2005; Haycock, Jerald, & Huang, 2001; Nagaoka & Roderick,
2004; Olson & Jerald, 1998), as well as to renewed effort in examinations of student
growth and achievement and the moderators of these outcomes.
Many of the investigations of student growth and achievement have used annual
assessments to interpret the influence of the school environment on student learning. A
drawback of this type of assessment is that it cannot account for the summer, a time away
from the school environment, apart from the school year. Dating back to the early 1900s,
researchers recognized the unique role that lengthy breaks played in the growth of
academic skills. Yearly measures of achievement are not sufficient; achievement should
be measured both in the fall and in the spring in order to account for differential change
during the summer (Alexander, Entwisle, & Olson, 2001; McCoach, O'Connell, Reis, &
Levitt, 2006). When this demarcation was made between summer and school year,
12
researchers noticed that students may gain similarly throughout the school year, but
exhibit differences in performance following the summer break based on several factors.
On average, a slight decline across all academic areas is seen in all students over the
summer (Borman, Benson, & Overman, 2005; Cooper, Nye, Charlton, Lindsay, &
Greathouse, 1996; Heyns, 1987; Murnane, 1975). However, statements about average
performance obscure patterns within particular subject areas among groups of students.
For example, students from lower socioeconomic backgrounds tend to exhibit greater
losses in reading over the summer months than students from middle to upper
socioeconomic backgrounds (Cooper et al., 1996). Research has found conflicting results
regarding the effects of other factors such as grade level, home language, parent
education, and special education status.
In addition to these individual and family factors, the type of measures used to
evaluate summer learning loss may impact the results. Most studies examined summer
learning loss with global achievement scores from published, standardized tests
administered in the spring and the fall (e.g., Alexander, Entwisle, & Olson, 2007;
Borman, et al., 2005). These tests are not designed to provide information about
individual change over a short amount of time, thereby leading to inaccurate conclusions
when used to analyze individual summer change in achievement (Baker & Good, 1995).
An alternative to global achievement measures is an instrument designed for
progress monitoring of general outcomes. It is a type of this measurement, specifically,
curriculum based measurement of oral reading (R-CBM), that the current study used to
examine summer learning loss in reading. The purpose of this study was to investigate
change in oral reading from spring to fall using R-CBM – in particular, Dynamic
13
Indicators of Early Literacy Skills (DIBELS) - for students in elementary school with
specific attention to individual factors such as grade level, special education (SPED)
status, and English language learner (ELL) status. Relatively few studies have used R-
CBM to look at summer loss. The current study supplemented the limited knowledge
base with the goal of further elucidating differential change in reading over the summer.
A review of research addressing summer learning loss and its measurement follows.
The Achievement Gap and the Summer
An emphasis on accountability and achievement has accompanied federal
educational policy during the last few decades. With the inception of the Elementary and
Secondary Education Act (ESEA) in 1965 came a focus on special populations that were
not benefiting adequately from the educational system. ESEA has been reauthorized
every five years, and in 2001 it was reauthorized as the No Child Left Behind Act
(NCLB; 2002). NCLB intensified focus on standards-based reform and accountability
and included literacy programs such as Reading First and Early Reading First, as well as
mandatory testing of student performance by states (Mraz & Rasinski, 2007). Now,
several years deep in the newest legislation, the important question is whether or not
improvement can be seen. According to NCES, in 2009, some students evidenced
progress compared to 2007 (NCES, 2009a, 2009b). Results of the National Assessment
of Educational Progress (NAEP) in 2009 indicated that the average reading and math
scores for students in eighth grade increased since 2007. Alternatively, average reading or
math scores in 2009 for students in fourth grade were unchanged compared to 2007.
Despite some overall gains, no significant changes in gaps based on racial/ethnic group or
family income level were seen over the last two years. That is, White and Asian/Pacific

14
Islander students still outperform Black, Hispanic, and American Indian/Alaska Native
students in reading and math by 21 or more points. Similarly, students in fourth grade not
eligible for free or reduced-price lunch (FRL) outperform students eligible for free lunch
in reading and math by 24 or more points. The gap based on family income level has
remained stable since 2003 when it was first monitored. The gaps among racial/ethnic
groups have seen some change since 1990. Specifically, the gap between White and
Black students has narrowed for reading and math in fourth grade since 1990, but showed
no change over the last two years.
The failure of many federal and state efforts to significantly impact the
achievement gap has led to questioning the quality and viability of the educational system
(Kahlenberg, 2000), as well as the method of measuring growth and achievement.
Measuring progress on a yearly basis, from spring of one grade to spring of the
subsequent grade, does not allow for differential progress based on the time of year,
namely, the school year and the summer. Evidence of detrimental effects on student
achievement because of a lengthy break from school dates back to the early 1900s (e.g.,
Brown, 1911; Cooper et al., 1996; Hayes & Grether, 1983; Heyns, 1987). Children tend
to lose some skills over the summer while they are not influenced by the school
environment. Although knowledge of a summer decline in progress or skill has existed
for many years, it is in more recent years that researchers have acknowledged how
accounting for the school year and summer separately may provide information on the
expansion of the achievement gap and play a role in achieving academic success for all
children (Alexander et al., 2001; McCoach et al., 2006).
15
Influences on Summer Loss of Reading
The phenomenon of summer learning loss has been documented for many years.
Cooper et al. (1996) reviewed studies dating back to 1906 that addressed the issue, with a
general consensus of, on average, a loss in certain mathematical skills and no loss in
reading. For reading, however, the overall picture hides important differences. In a meta-
analysis of 13 studies dating from 1975 to 1996, Cooper et al. documented that lower-
income students showed an average loss in reading whereas higher-income students
showed an average gain, resulting in approximately a three-month difference between the
groups at the end of the summer. Several studies since the meta-analysis have supported
loss in reading based on a low family income (Alexander et al., 2001; Reardon, 2003). In
other studies, students from lower-income backgrounds experienced decay or minimal
gain and students from middle- to upper-income backgrounds exhibited moderate to
substantial gains (Allington & McGill-Franzen, 2003; Burkam, Ready, Lee, & LoGerfo,
2004; McCoach et al., 2006). Apart from the influence of family income, a significant
amount of unexplained variability remained in most studies, which indicated that factors
beyond family income were needed to explain the summer learning loss (Burkam et al.,
2004; McCoach et al., 2006). Other variables, such as grade level, special education
status, home language, level of parent education, and ethnicity, have been implicated in
summer loss but failed to garner unequivocal support.
Parent education and ethnicity have garnered partial support as factors in reading
change over the summer. In one study, students whose parents had a high school
education experienced growth whereas students whose parents dropped out of high
school showed no change (Entwisle & Alexander, 1994). In contrast, a separate study

16
found no connection between summer achievement and the level of parent education
(Borman & Dowling, 2006). Ethnicity is often dismissed because of its overlap with
socioeconomic status (Alexander et al., 2001; Burkam et al., 2004; Rumberger &
Arellano, 2004); however, a few researchers cite the lingering importance of this
variable, claiming that after accounting for income, White first-graders make greater
gains over the summer in reading comprehension than African-American first-graders
(Phillips, 2000).
The remaining factors of grade level, home language, and special education status
are often hypothesized to be involved in summer learning loss, but they less often are
implicated. Researchers have reported conflicting results regarding grade level – some
evidence suggested more loss in reading in the upper grades (Cooper et al., 1996),
whereas other evidence reported the opposite (Borman & Dowling, 2006). Home
language, though a tempting explanation for reading regression due to the association of
language skills with reading ability (Cooper et al., 1996), has not been found to influence
summer learning loss beyond its association with socioeconomic status (Burkam et al.,
2004; Rathbun, Reany, & West, 2003). Special education status has not received much
attention in the summer reading loss literature despite the supposition that students with
disabilities may need extended school year services to prevent disproportionate loss over
the summer as compared to their general education peers. The few studies addressing this
issue have demonstrated loss in reading and math for students with disabilities (Allinder,
Bolling, Oats, & Gagnon, 1998; Allinder & Eicher, 1994); however, studies failed to find
significant differences in loss when comparing students with disabilities to students
without disabilities (Allinder & Fuchs, 1994). Consequently, although theory may imply

17
that students in special education are at risk of experiencing greater summer loss (Cooper,
2003), no empirical evidence suggests that students with high incidence disabilities lose
more skills over the summer in reading or other academic areas than students without
disabilities. In sum, results regarding some of the individual and family factors that
influence summer learning loss of reading are unclear, but the detrimental impact on
reading skills of a low income background is consistently seen.
Measurement of Summer Learning Loss
In order to measure summer learning loss, assessment of student skill must be
made in the spring and in the fall. To do this, studies often employed large-scale,
standardized tests such as the Comprehensive Test of Basic Skills (CTB/McGraw-Hill,
1982) and the Stanford Achievement Test Series (Harcourt Educational Measurement,
1996). These tests are designed to provide information about the relative standing among
peers of the same grade or age; they are not designed to measure individual student
progress, which is often exactly the goal in a study of summer learning loss. To
determine a difference in achievement from spring to fall, a measure must be sensitive to
small changes over short intervals, a characteristic that most published, standardized
norm-referenced tests do not possess (Baker & Good, 1995; Marston, 1989).
Alternatives to global, standardized achievement tests may include forms of
curriculum-based assessment (CBA), a method of assessment that uses direct observation
of student performance on tasks drawn from the local curriculum. Outcomes of CBA are
used to make instructional decisions for individual students and classrooms. All models
of CBA have the common goals of short, direct assessments of the curriculum that can be
repeated often and the results of which can be graphed to display student progress

18
(Marston, 1989). CBA can take the form of teacher-made tests, end-of-unit tests, and
measurement of short-term objectives and skill acquisition. Despite the uniform goals,
CBA models differ greatly in terms of reliability, validity, construction, and informative
ability (Shinn & Bamonto, 1998). Distinct among the models of CBA is one assessment
paradigm, curriculum-based measurement (CBM). Specifically, CBM is based in the
curriculum and addresses the same goals as other forms of CBA, but it meets traditional
psychometric criteria for reliability and validity and measures small changes in growth
over extended periods of time (e.g., across an academic year) in core academic skills that
are related to success in school – reading, writing/spelling, and math (Deno, 1985; 1992;
Shinn & Bamonto, 1998).
CBM was developed by Deno and colleagues at the University of Minnesota. It
was designed to be a tool for measuring progress that can be used frequently and requires
little in terms of cost and time (Deno, 1985; 1992). The most widely used CBM measure
is the individually-administered, standardized procedure to assess oral reading (i.e., R-
CBM; Busch & Reschly, 2007). R-CBM is a General Outcome Measure, in other words,
a longitudinal assessment that uses equivalent content and procedure over time to
document student progress in the curriculum (Fuchs & Deno, 1991; Reschly, Busch,
Betts, Deno, & Long, 2009). R-CBM is widely used for progress monitoring, screening
for academic difficulties, and setting individualized goals (Deno et al., 2009). More
recent developments include using R-CBM data to predict performance on high-stakes
assessments (for a review, see Yeo, 2009) and inform decision making regarding special
education eligibility (Ardoin & Christ, 2009). Several decades of research support the
conclusion that scores derived from R-CBM scores are reliable and valid as indicators of

19
overall reaching achievement (for a review, see Reschly et al., 2009). R-CBM scores
have been shown to be moderately to highly correlated with scores on standardized tests
of reading achievement and reading subtests of word identification, comprehension,
vocabulary, and decoding (Reschly et al., 2009).
To assess oral reading with R-CBM, the assessor asks students to read aloud for
one minute from passages at their grade or instructional level. The score is based on the
number of words read correctly in a minute. There are different standardized passage sets
available including AIMSweb (http://www.aimsweb.com) and Dynamic Indicators of
Basic Early Literacy Skills (DIBELS; https://dibels.uoregon.edu), which are
commercially available. Passage sets consist of many reading passages or probes with
specified difficulty levels based on readability formulas, Euclidean distance procedures,
or other standardized development procedures (Betts et al., 2008).
CBM carries several advantages over global achievement measures. CBM was
designed to be sensitive to individual student change over short periods of time (Deno,
1985). CBM measures may reflect the broad goals of the curriculum, which may create a
greater overlap between teaching and testing than would be seen with criterion-
referenced achievement measures (Deno & Fuchs, 1987) and maintains the focus on the
desired outcome of instruction rather than a sequence of short-term objectives (Hintze &
Silberglitt, 2005). Further, CBM is amenable to multiple administrations in order to
generate comparative scores for students (Allinder, Fuchs, Fuchs, & Hamlett, 1992).
Therefore, CBM has the potential of being more sensitive to effects of changes, like
summer break, instructional method, or intensive interventions, than can be provided by a
single administration of a global achievement test.
20
Using CBM to Measure Loss and Recoupment
Only a few researchers have employed CBM or other assessments of progress to
document learning loss (e.g., Allinder et al., 1992; Allinder & Fuchs, 1994; Helf, Konrad,
& Algozzine, 2008; Rosenblatt, 2002). One particular researcher, Rose Allinder, pointed
out the shortcomings of global achievement measures in examining regression more than
15 years ago and has several published studies that utilized CBM to represent student
performance and compare pre- and post-break scores. Allinder and colleagues
investigated regression and recoupment in various academic areas (i.e., spelling,
mathematics), for different grade levels, for students with and without disabilities, and for
various lengths of breaks (e.g., 3-week, 12-week; Allinder et al., 1992; Allinder & Fuchs,
1994).
Allinder and Fuchs (1994) examined loss of math computation skills over a 3-
week break for students with and without disabilities using CBM. CBM math
computation probes are scored by counting the number of correct digits during a 2-
minute interval from grade-level problems (Marston, 1989). In this study, the CBM
probes reflected computation skills that students were expected to achieve by the end of
the school year (Allinder & Fuchs, 1994). CBM math computation probes differ from R-
CBM in that math probes are not considered General Outcome Measures. That is, scores
on CBM math are not indicative of overall success in mathematics; instead, they
represent specific skills (i.e., addition, subtraction, multiplication).
Allinder and Fuchs (1994) employed two methods - level of performance and
trend line - to compare pre- and post-break scores. The trend line is an indication of
student progress over the measurement period, whereas level of performance is an
21
aggregation of scores over time into a single representation of achievement. Level of
performance was determined by finding the median of the five most recent CBM scores
taken over a period of 3 weeks. Trend line was found by plotting the most recent five
scores on a graph and drawing a line through them using the split-middle technique.
Results of the comparison of level of performance revealed that neither students with
disabilities nor students without disabilities regressed. Students without disabilities
performed better following the break, and students with disabilities performed at a similar
level before and after the break. A comparison of progress before and after the break
indicated no differences based on student disability status, but, instead, significant
differences based on pre-break and post-break trend lines. Students who were making
significant gains before the break demonstrated lower trend lines after the break, whereas
students with negative trend lines before the break had significantly improved trends after
the break. The researchers noted several limits on generalization of results (i.e., trend
lines based on five data points, only math computation assessed), as well as the
possibility that regression to the mean could serve as an explanation for the results of the
study.
In a later study, Allinder et al. (1998) again compared two methods of measuring
regression – a static measurement of student performance and a measurement of student
progress – for students with learning disabilities and mild intellectual disabilities.
Students were monitored in math computation skills in February and March, then again in
April and May following 2 to 3 weeks of standardized testing and spring break. The goal
of the study was to compare student performance in March and May, as well as to
compare student progress in February and March to progress in April and May. CBM
22
math computation probes were used for monitoring progress. Results indicated that
student achievement in May was higher than in March based on aggregated scores, an
indication that students continued to gain skills in math computation despite a 2- to 3-
week break from general academic instruction. An analysis of student progress yielded
different conclusions, though results failed to reach statistical significance. Progress
differed by type of student – students with learning disabilities exhibited a drop in trend
line from March to May while students with mild intellectual disabilities demonstrated a
slight increase in trend. Allinder et al. warned against solely relying on monitoring
progress or level of performance because the two methods may produce discrepant
results.
To summarize, two studies used CBM to compare level of performance and
progress in math computation skills before and after short breaks (2-3 weeks) for students
with and without disabilities (Allinder & Fuchs, 1994; Allinder et al., 1998). Neither
study found regression in performance over the break. Trend lines differed pre- and post-
break based on type of student and direction of pre-break trend line.
In addition to studies that examined change over short breaks, several studies
have used progress monitoring measures to look at change over a summer break for
several academic skills. Allinder et al. (1992) used CBM to study the effects of a summer
break on math and spelling skills for elementary school students. Students were tested
weekly for the final 3 weeks of school in the spring and again for 2 weeks beginning with
the third week of school in the fall. Fall testing was conducted at the spring grade level.
Math and spelling CBM scores were aggregated by taking the median score in the spring
and the average score in the fall; thus the study looked at level of performance rather than
23
progress. Students in the primary grades (second and third grades) regressed in spelling
but not in math. In contrast, students in intermediate grades (fourth and fifth grades)
showed an opposite pattern – they regressed in math but not in spelling. Several
explanations were offered by the researchers to account for the findings. Results may be
explained by the types of problems assessed by the CBM probes at the different grade
levels and the opportunity to practice certain skills depending on grade level. For
instance, assessments for students in primary grades include addition, subtraction, and
multiplication. These types of problems may occur more naturally in the summer
environment than the types of problems used for assessments at the intermediate grades
(e.g., multistep multiplication, division of decimals). An aspect of the design not
addressed by the researchers was the 2-week delay prior to fall testing. If students
promptly start to make gains in math and spelling, the 2-week delay could create an
underestimation of summer regression.
One limitation identified in the Allinder et al. (1992) study was the inability to
generalize to other academic skills such as reading. A subsequent study examined the
effects of summer break on the math and reading skills of students with mild intellectual
disabilities using CBM (Allinder & Eicher, 1994). Students in grades two through five
were tested using CBM probes during the last week of school in the spring, the first week
of school in the fall, and again 5 weeks into the school year. CBM math probes were used
to assess addition, subtraction, multiplication, and division skills. The CBM reading
probes were created from Houghton Mifflin Reading passages. The median score of three
passages was taken at each time point. Fall testing was done at the level of the previous
spring. Results indicated that students with disabilities regressed in both math and

24
reading. In reading, students regressed over the summer but recouped losses and made
significant gains beyond the spring level by the second fall testing. In math, students had
not reached the spring level by the second testing in the fall; however, they showed
improvement from the first week of the fall to the fifth week. This study is cited as
evidence of regression over the summer break for students with mild intellectual
disabilities and is one of few studies addressing reading loss using CBM.
A later study, modeled after Allinder and Eicher (1994), focused on general
education students without diagnosed disabilities who were struggling readers
(Rosenblatt, 2002). The purpose of this study was to use CBM and a norm-referenced
achievement test to examine the effects on reading achievement of attending a summer
program. The students were assessed at the end of the school year in the spring and three
times in the following fall (first week, second week, and sixth week of school). For all
students there was no decline in their global achievement test scores over the summer. In
contrast, all students showed significant losses in oral reading scores over the summer –
R-CBM scores in the first week of fall were lower than scores in June. The losses were
recovered by the second week of school; thus, there was evidence of recoupment within 2
weeks of school. Furthermore, students had surpassed the spring scores by the sixth week
of fall. Students who attended the summer program scored higher on CBM probes and
lower on the achievement test than students not involved in the program. The author
concluded that CBM was sensitive to change over the summer and that there was rapid
recoupment in skill by the second week of school (Rosenblatt, 2002). This study
confirmed the importance of assessing students promptly upon their return to the
academic environment in the fall.

25
A recent study used DIBELS Oral Reading Fluency (DORF) to measure reading
change from spring to fall for rising second-grade students (Helf et al., 2008). The
students were assessed with DORF in the spring and the fall during regular benchmarking
periods with grade-level passages. Students were categorized as not at risk, at-risk
control, and at-risk treatment, according to DORF benchmarking criteria. The at-risk
treatment group received special reading programming during the school year. The
students who were not at risk scored higher on DORF than the at-risk students. All
students exhibited gains over the summer in oral reading. The at-risk treatment group
made greater gains over the summer than the at-risk control group. These results
indicated that DORF was sensitive to small changes and discriminated among groups of
differing abilities or training.
In sum, research addressing loss of math computation skills using CBM math
probes found no change over short breaks during the school year (Allinder et al., 1998;
Allinder & Fuchs, 1994) yet loss over the summer for certain groups, for instance,
students in intermediate grades (Allinder et al., 1992) and students with mild intellectual
disabilities (Allinder & Eicher, 1994). Findings regarding oral reading displayed
inconsistencies. In the studies by Allinder and Eicher (1994) and Rosenblatt (2002),
students regressed in oral reading; however, in the recent study by Helf et al. (2008), all
students exhibited gains in oral reading over the summer. How can these discrepancies be
explained? Differences in sample characteristics, measurement timing, and passage type
among the studies prevent a direct comparison of results. The three studies focused on
different populations such as students with mild intellectual disabilities (Allinder &
Eicher, 1994), struggling readers who were not diagnosed with any disabilities
26
(Rosenblatt, 2002), and both students at risk and not at risk for reading difficulties (Helf
et al., 2008).
Likewise, the studies diverged in their use of CBM. Helf et al. (2008) used DORF
passages and gave the students three grade-appropriate passages in the spring and in the
fall. Allinder and Eicher (1994) and Rosenblatt (2002) used published reading series to
develop CBM probes and tested in the fall at the level of the previous spring in order to
provide a direct comparison of skill. These two studies reported the exact weeks of data
collection, whereas in the most recent study (Helf et al., 2008), the exact timing of data
collection was not reported, just the indication that data were collected during regular
benchmarking in the fall. This delay in measurement could lead to significant changes in
oral reading scores (Allinder & Eicher, 1994; Rosenblatt, 2002); thus, the gains seen in
the study cannot be assumed to have occurred during the summer as opposed to during
the time that the students were in school in the fall prior to data collection.
In addition to measurement delays, grade level of the reading passage impacted
results. CBM passages typically were leveled by grade; thus, the passages increased in
difficulty from spring of one grade to fall of the next. For example, in the spring a second
grade student read a spring second grade passage and in the fall this student read a fall
third grade passage. Acknowledging how the passage level may affect findings about
summer learning loss is important when interpreting and comparing results from studies
about loss and recoupment. The assumption is that a third grade student reading a third
grade passage will read slower than a third grade student reading a second grade spring
passage. Therefore, increasing the grade level of the passage should have the effect of
increasing the chance of documenting summer reading loss because students’ reading

27
rates should be slower when reading more difficult material. The methodological
differences among studies regarding passage level could contribute to the inconsistencies
with findings of summer learning loss.
The existing literature addressing the use of R-CBM to assess summer learning
loss is limited in number and in scope. Only a handful of studies used CBM to investigate
learning loss with only a few specifically addressing reading (Allinder & Eicher, 1994;
Helf et al., 2008; Rosenblatt, 2002). Two of the studies using R-CBM had limited
generalizability because of the focus on students with disabilities or struggling readers
(Allinder & Eicher, 1994; Rosenblatt, 2002). Furthermore, in the learning loss studies
using CBM, socioeconomic status was not examined as a factor in determining loss.
Based on the substantial evidence that this factor is influential in summer loss of reading
skills, its exclusion was limiting.
Current Study
The purpose of the current study was to add to the literature on summer learning
loss by investigating summer change in reading for children in an elementary school in
the Southeastern U.S. The first goal of this study was to append the existing research base
that used R-CBM to measure change in reading. R-CBM is being used with increasing
frequency to monitor reading progress during the school year and has the potential to be
an efficient, effective method of measuring summer learning loss. Findings from previous
studies using R-CBM to measure summer loss were discrepant and lacked
generalizability to general education populations. The current study followed a diverse
sample of students in elementary grades, measuring oral reading in the spring and the
following fall.

28
The second goal of this study was to investigate how individual and family factors
impact oral reading change over the summer. Family income is a well-documented
influence on summer learning loss and was accounted for in this study by examining the
impact of eligibility for FRL. Other factors such as ELL status, SPED status, and grade
level have unclear evidence of their significance and were also included in the analysis to
further elucidate their influence.
Briefly, the goals of the study were
a) to examine a sample of first through fourth graders for summer learning loss
using DIBELS Oral Reading Fluency (DORF) and
b) to evaluate the sample for evidence of differential loss based on demographic
factors such as eligibility for FLR, ELL status, and SPED status.
Method
Participants
The participants of this study were drawn from a Title 1 elementary school in
rural northeast Georgia. The sample was longitudinal, following students in Grades 1
through 4 from the spring of the 2008-2009 school year to the fall of the 2009-2010
school year. Grade levels cited throughout this study refer to the fall grade level of
students (Grades 2 through 5). All students in the school who had participated in DIBELS
benchmarking were included. The initial sample consisted of 404 students. Only students
with both spring and fall data were included, which resulted in eliminating approximately
18% of the initial sample. Most of the students excluded from analyses were missing a
data point either due to transferring out of the district after the spring testing (missing the
fall data point) or entering the district in the fall (missing the spring data point). Six

29
students were excluded because they had been retained in grade. The final sample
consisted of 317 students. Demographic information about the sample is provided in
Table 1 The total sample consisted of 45.4% male with a racial/ethnic composition of
61.2% White, 11.7% Black, 21.1% Hispanic, and 6.0% Other. When all minority groups
were combined, the sample was 38.8% minorities. Enrollment by other subgroups
included 70.7% eligible for FRL, 13.6% ELL, and 12.9% in SPED. Percentages by grade
were similar to the overall percentages with a few exceptions. The most notable
deviations were in Grades 2 and 5. In Grade 2, the racial/ethnic composition included
more Hispanic students (32.1%), a higher percentage of ELL (25.9%), and more students
who were eligible for FRL (79.0%). In Grade 5, the racial/ethnic composition included
fewer Hispanic students (12.4%), more White students (68.5%), fewer ELL (4.5%), and
fewer students eligible for FRL (65.2%).
Table 1
Demographics of the Sample by Percentages (N = 317)
Race ELL SPED FRL White 61.2 Not ELL 86.4 Not SPED 87.1 Not FRL 29.3
Black 11.7 ELL 13.6 SPED 12.9 FRL 70.7 Hispanic 21.1
Other 6.0 Note. ELL = English language learner; SPED = special education; FRL = free or reduced-price lunch.
Measures
Dynamic Indicators of Early Literacy Skills Oral Reading Fluency (DIBELS
ORF). DIBELS ORF is an individually-administered measure with a standardized
procedure published by DIBELS. Whereas other DIBELS measures focus on early
30
literacy skills, DIBELS ORF is a type of R-CBM measuring accuracy and fluency with
connected text (Good, Wallin, Simmons, Kame’enui, & Kaminski, 2002). For the ORF
task, students are asked to read aloud for 1 minute from a leveled passage, and the score
is calculated as the number of words read correctly in a minute (WRC). Omitted words,
substitutions, and hesitations for more than 3 seconds are recorded as errors. Additions
are ignored. If a student self-corrects within 3 seconds, the error is removed. For
benchmarking, each student reads three passages, and the median score is recorded.
Passages and norms are provided by DIBELS for two benchmark assessments in first
grade and three benchmark assessments in second through sixth grades. Information
about the development and generation of DIBELS ORF benchmarks is available for the
three-times-per-year assessment schedule (Good et al., 2002). Likewise, information
about the development and readability of the first through third grade passages has been
published (Good & Kaminski, 2002).
Procedures
The data used for this study were obtained from the elementary school subsequent
to all data collection procedures. The school used the DIBELS benchmarking and
progress monitoring system. As part of the prevention and intervention model, the
elementary school collected DIBELS ORF data on all students three times a year – in the
fall, winter, and spring. Only data from spring and fall measurements were used for this
study. In the first week of May of the 2008 - 2009 school year, all first- through fifth-
grade students were assessed with DIBELS ORF. The school year concluded 2 weeks
later. For the purposes of this study, only first- through fourth-grade data were utilized as
fifth graders had matriculated to middle school and thus were not present for the
31
subsequent fall data collection. ORF was administered by teachers, paraprofessionals,
and administrators, all of whom had completed the required training for DIBELS
administration. All students were assessed within a 1-week period. The prescribed
passages for the benchmarking period (spring) and grade (first through fourth) were used.
Each student read three passages, and the median score was recorded.
Subsequently, in August of the 2009-2010 school year, the same students, now in
the second through fifth grades, were assessed using DORF. Data collection took place
over 3 days during the second week of school. For this assessment, both school personnel
and school psychology doctoral students completing their practica in the county
administered DORF. Each practicum student completed DORF training prior to the data
collection from a faculty member with training and research experience with CBM and
DIBELS. At the completion of training, the doctoral students had obtained 100% inter-
rater agreement over three passages. The administration and scoring procedures used in
the spring were repeated in the fall. The students were administered the same three
passages that were administered to them in the spring of the previous school year. That is,
students now in the second grade received the spring of first grade passage sets; students
in the third grade received spring of second grade passage sets; students in the fourth
grade received third grade passage sets; and, students in the fifth grade received fourth
grade passage sets. The rationale for this administration was to provide a direct
comparison of results from spring to fall. If using different passages, the students’ fall
scores may overestimate the degree of summer learning change due to increases in
difficulty of the passages. The students were also participating in the fall benchmarking

32
testing during this time. The fall grade level passages were administered prior to the
passages used for this study and were never administered on the same day.
Data Analysis Plan
Data analysis was conducted in several steps. First, data were screened for outliers
and adherence to normality and parametric assumptions. After examining descriptive
statistics and correlations among variables, a repeated measures analysis of variance
(RM-ANOVA) was used to compare ORF scores before and after the summer break for
all students in each grade. The grade levels must be analyzed separately because the
DIBELS ORF metric is not comparable across grade levels due to the use of grade
specific passage sets. The between-subjects factors were the demographic variables of
FRL eligibility, SPED status, and ELL status. The within-subjects factor was time of
measurement (pre-break/spring and post-break/fall).
These analyses, specifically, the planned comparisons of demographic groups, are
supported by previous research. Studies have shown that although overall summer
regression may not be seen, specific groups of students appear to lose skills over the
summer while others appear to gain skills or remain the same (Cooper et al., 1996).
Often, family income, which is represented here by eligibility for FRL, is a factor in
summer loss. Consequently, whereas an analysis of the whole sample may not reveal
significant differences, an analysis with disaggregated groups may uncover important
discrepancies.
Results
Data were screened for outliers. A total of 14 cases were eliminated based on
extreme values as identified by examining boxplots and histograms. In second, fourth,

33
and fifth grades, three cases per grade were omitted; five cases were omitted from third
grade. The revised sample did not differ from the original sample on any demographic
characteristics according to chi square analyses. The distributions of the dependent
variables – oral reading scores at each time point – were examined for skewness and
kurtosis. All values of the z-scores of skewness and kurtosis were less than the absolute
value of 1.96 and, thus, not considered to be a significant distributional deviation (Field,
2009). Means and standard deviations for spring and fall DIBELS ORF scores for each
group by grade are provided in Table 2. The correlation between the spring and fall
DIBELS ORF scores was large, r = .96 (p < .01).
Table 2 Descriptive Statistics for DIBELS Oral Reading Fluency
Range
Grade (n) Mean (SD) Minimum Maximum
Grade 2 (81) Spring 48.89 (24.82) 9 105 Fall 43.94 (25.70) 4 108
Grade 3 (86) Spring 96.74 (29.26) 22 174 Fall 88.15 (30.07) 23 163
Grade 4 (61) Spring 119.26 (32.04) 45 190 Fall 112.64 (34.43) 36 195
Grade 5 (89) Spring 124.02 (36.42) 59 214 Fall 126.96 (39.82) 57 208
RM-ANOVA requires data adhere to two assumptions. First, the dependent
variables must follow a multivariate normal distribution. In order to test this assumption,
histograms, boxplots, and descriptive statistics were examined. In addition, the

34
Kolmogorov-Smirnov Test of Normality was used to test the null hypothesis that the
variables’ distributions were normal. All distributions were normal based on the null
hypothesis rejected at the p > .01 level of significance, a level cited for use with this
statistic (Filliben, 2006). The second assumption for this procedure is that the variance-
covariance matrices must be equal across the cells formed by the between-subject effects.
This assumption was examined using Box’s Test of Equality of Covariance Matrices
(Box’s M) and Levene’s Test of Equality of Error Variances. Samples at all grades
conformed to this assumption with values for Box’s M and Levene’s Test nonsignficant
at the p > .01 level. Assumptions of the analysis were met adequately for analyses to
proceed.
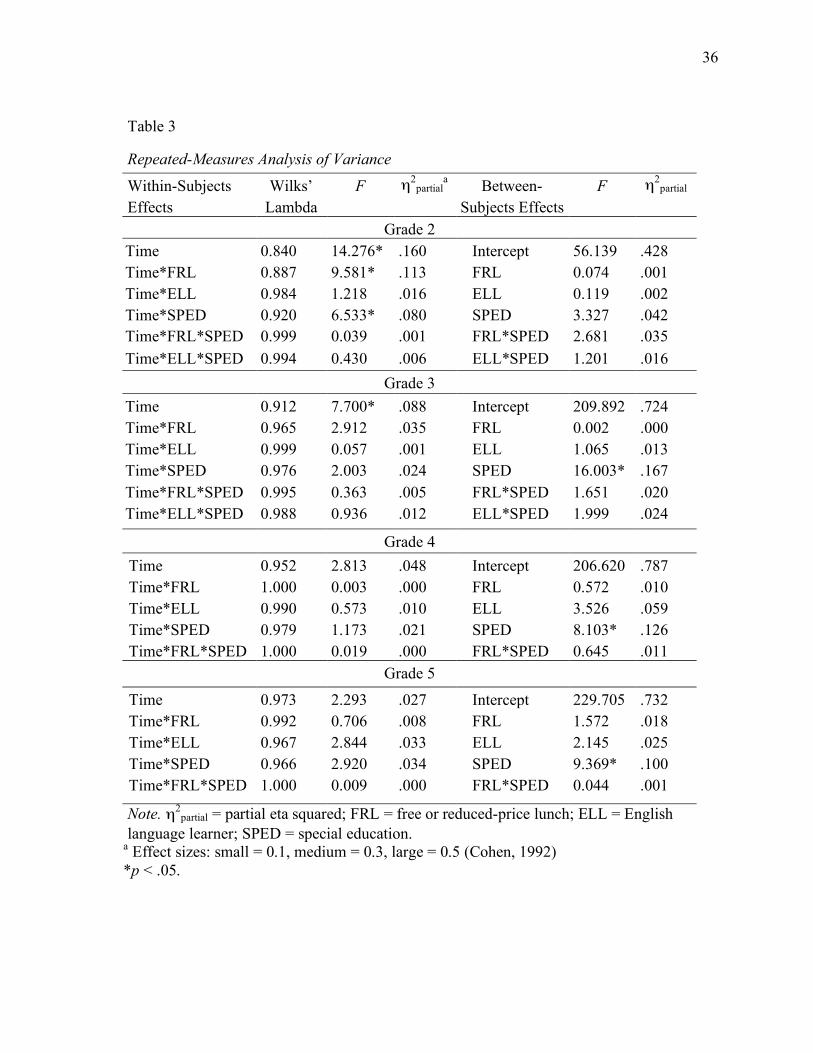
Results from the RM-ANOVA are discussed by grade and displayed in Table 3.
In Grade 2, the RM-ANOVA indicated a significant effect for time, F(1,75) = 14.28, p <
.001, for the interaction of time and FRL status, F(1,75) = 9.58, p = .003, and the
interaction of time and SPED status, F(1,75) = 6.53, p = .013. That is, overall, students in
second grade lost an average of 5 WRC over the summer; however, students eligible for
FRL decreased an average of 7 WRC whereas students not eligible for FRL showed an
increase of 2 WRC. Furthermore, students in special education dropped an average of 10
WRC, yet students in general education lost only 4 WRC. The effect sizes, as measured
by partial eta squared (η2partial), for time, the interaction of time and FRL status, and the
interaction of time and SPED status were small, accounting for only 16 percent (time), 11
percent (time by FRL), and 8 percent (time by SPED) of the variability. Significance was
not obtained for the interaction of time and ELL status, nor for any of the three-way
interactions. None of the main effects were significant at the p < .05 level.

35
In Grade 3, significance was found for the effect of time, F(1,80) = 7.70, p = .007,
as well as the main effect for SPED status, F(1,80) = 16.00, p < .001. Students in third
grade lost an average of 9 WRC overall. Although statistically significant, the effect size
for the effect of time was very small (η2partial = .088). DORF scores for students in special
education were approximately 35 WRC lower in the spring and 29 WRC lower in the fall
as compared to other students. Effect size for this main effect was small (η2partial = .167).
Significance was not obtained for the interactions of time with FRL status, time with ELL
status, or time with SPED status, nor for any of the three-way interactions. No other main
effects were significant.
In Grade 4, only the main effect for SPED status was significant, F(1,56) = 8.10,
p = .006. This effect accounted for 12.6 percent of the variance in the factor. Fourth grade
students in special education earned DORF scores 36 WRC lower in the spring and 28
WRC lower in the fall as compared to other students. Time was not found to be
significant despite the trend toward overall loss, F(1,56) = 2.81, p = .10. All interactions
with time and other main effects did not reach the level of significance.
In Grade 5, significance was revealed for the main effect of SPED status, F(1,84)
= 9.37, p = .003. Students in special education were 31 WRC lower on average on DORF
in the spring and 39 WRC lower on average on DORF in the fall as compared to students
not in special education. SPED status accounted for 10 percent of the variability in the
factor. The effect of time was not significant, F(1,84) = 2.30, p = .13. None of the
interaction effects or main effects was significant.
36
Table 3
Repeated-Measures Analysis of Variance
Within-Subjects Effects
Wilks’ Lambda
F η2partial
a Between-Subjects Effects
F η2partial
Grade 2 Time 0.840 14.276* .160 Intercept 56.139 .428 Time*FRL 0.887 9.581* .113 FRL 0.074 .001 Time*ELL 0.984 1.218 .016 ELL 0.119 .002 Time*SPED 0.920 6.533* .080 SPED 3.327 .042 Time*FRL*SPED 0.999 0.039 .001 FRL*SPED 2.681 .035 Time*ELL*SPED 0.994 0.430 .006 ELL*SPED 1.201 .016
Grade 3 Time 0.912 7.700* .088 Intercept 209.892 .724 Time*FRL 0.965 2.912 .035 FRL 0.002 .000 Time*ELL 0.999 0.057 .001 ELL 1.065 .013 Time*SPED 0.976 2.003 .024 SPED 16.003* .167 Time*FRL*SPED 0.995 0.363 .005 FRL*SPED 1.651 .020 Time*ELL*SPED 0.988 0.936 .012 ELL*SPED 1.999 .024
Grade 4 Time 0.952 2.813 .048 Intercept 206.620 .787 Time*FRL 1.000 0.003 .000 FRL 0.572 .010 Time*ELL 0.990 0.573 .010 ELL 3.526 .059 Time*SPED 0.979 1.173 .021 SPED 8.103* .126 Time*FRL*SPED 1.000 0.019 .000 FRL*SPED 0.645 .011
Grade 5
Time 0.973 2.293 .027 Intercept 229.705 .732 Time*FRL 0.992 0.706 .008 FRL 1.572 .018 Time*ELL 0.967 2.844 .033 ELL 2.145 .025 Time*SPED 0.966 2.920 .034 SPED 9.369* .100 Time*FRL*SPED 1.000 0.009 .000 FRL*SPED 0.044 .001
Note. η2partial = partial eta squared; FRL = free or reduced-price lunch; ELL = English
language learner; SPED = special education. a Effect sizes: small = 0.1, medium = 0.3, large = 0.5 (Cohen, 1992) *p < .05.

37
Discussion
Summer learning loss is a pressing concern due to the differential effects on our
school’s most vulnerable populations. Current methods of documenting summer loss
often are ineffective and impractical. This study investigated the overall summer learning
loss experienced, as well as loss based on various indicators of at-risk status, in
elementary grades as measured by R-CBM. Results indicated loss differed by grade with
overall loss only seen in the lower grades and differential loss only in second grade.
Findings from this research reinforce and extend the information available on summer
learning loss and have specific implications for the use of R-CBM as the method of
measurement. Conclusions and applications are discussed relative to the goals of the
study and the field of school psychology.
Summer Loss
When comparing spring DORF and fall DORF without an increase in passage
level (i.e., using the same passages for spring and fall measurement), an overall analysis
of summer learning loss indicated loss for all students in second and third grades. For
these grades, average scores in the spring were significantly higher than average scores in
the fall across all subgroups. The loss was approximately 5 WRC in second grade and 9
WRC in third grade. In general, the loss figures found in this study were similar to that of
Allinder and Eicher (1994) who documented a loss of 6 on a R-CBM (not DORF),
combined across grades. In contrast, Helf et al. (2008) revealed gains of a similar
magnitude for the not at-risk group and at-risk groups not involved in the summer
treatment program.
38
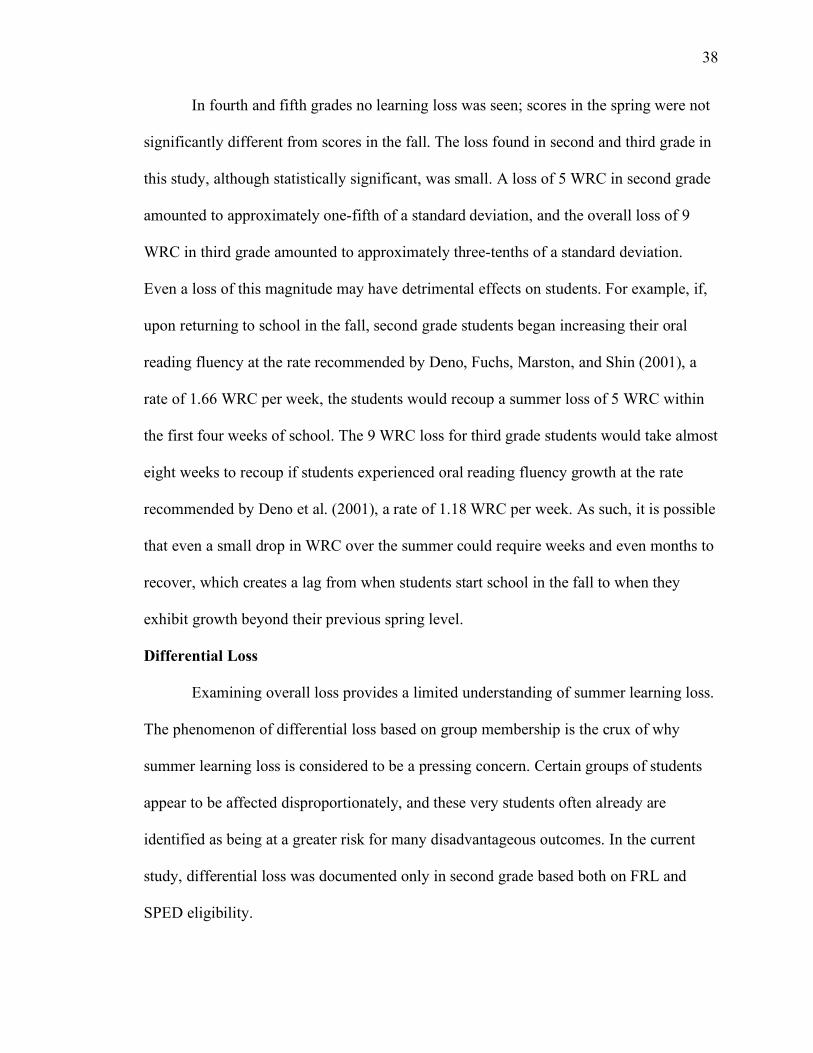
In fourth and fifth grades no learning loss was seen; scores in the spring were not
significantly different from scores in the fall. The loss found in second and third grade in
this study, although statistically significant, was small. A loss of 5 WRC in second grade
amounted to approximately one-fifth of a standard deviation, and the overall loss of 9
WRC in third grade amounted to approximately three-tenths of a standard deviation.
Even a loss of this magnitude may have detrimental effects on students. For example, if,
upon returning to school in the fall, second grade students began increasing their oral
reading fluency at the rate recommended by Deno, Fuchs, Marston, and Shin (2001), a
rate of 1.66 WRC per week, the students would recoup a summer loss of 5 WRC within
the first four weeks of school. The 9 WRC loss for third grade students would take almost
eight weeks to recoup if students experienced oral reading fluency growth at the rate
recommended by Deno et al. (2001), a rate of 1.18 WRC per week. As such, it is possible
that even a small drop in WRC over the summer could require weeks and even months to
recover, which creates a lag from when students start school in the fall to when they
exhibit growth beyond their previous spring level.
Differential Loss
Examining overall loss provides a limited understanding of summer learning loss.
The phenomenon of differential loss based on group membership is the crux of why
summer learning loss is considered to be a pressing concern. Certain groups of students
appear to be affected disproportionately, and these very students often already are
identified as being at a greater risk for many disadvantageous outcomes. In the current
study, differential loss was documented only in second grade based both on FRL and
SPED eligibility.
39
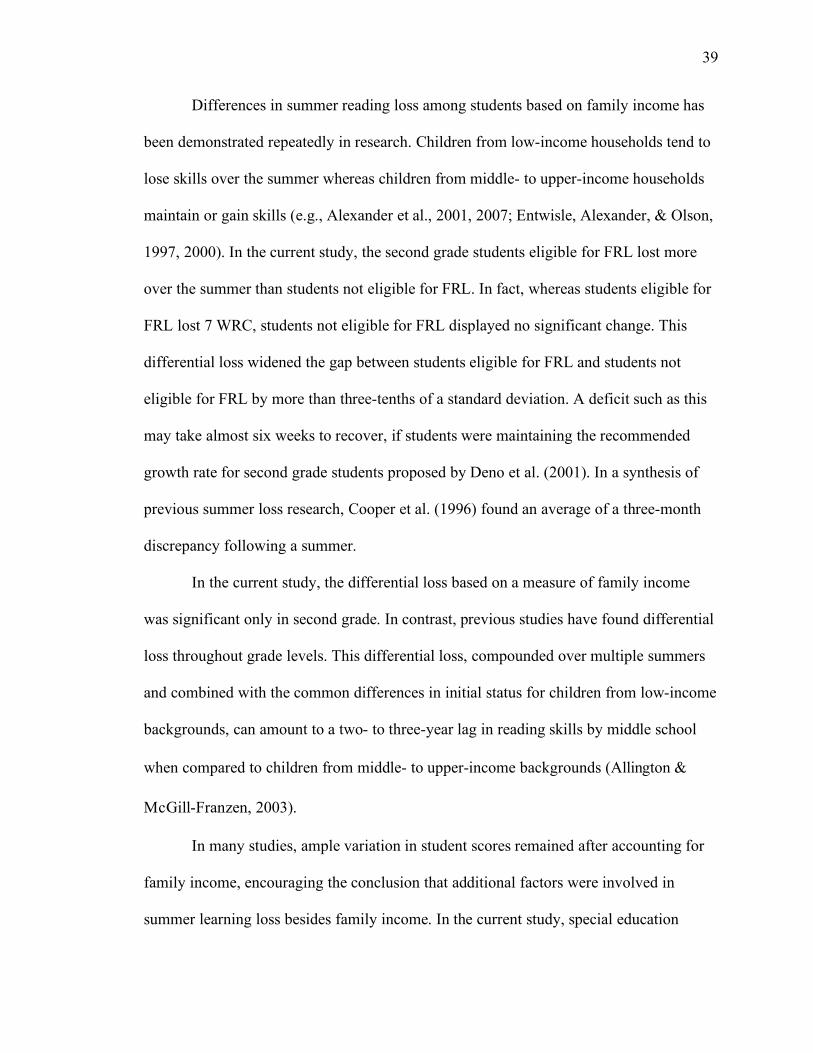
Differences in summer reading loss among students based on family income has
been demonstrated repeatedly in research. Children from low-income households tend to
lose skills over the summer whereas children from middle- to upper-income households
maintain or gain skills (e.g., Alexander et al., 2001, 2007; Entwisle, Alexander, & Olson,
1997, 2000). In the current study, the second grade students eligible for FRL lost more
over the summer than students not eligible for FRL. In fact, whereas students eligible for
FRL lost 7 WRC, students not eligible for FRL displayed no significant change. This
differential loss widened the gap between students eligible for FRL and students not
eligible for FRL by more than three-tenths of a standard deviation. A deficit such as this
may take almost six weeks to recover, if students were maintaining the recommended
growth rate for second grade students proposed by Deno et al. (2001). In a synthesis of
previous summer loss research, Cooper et al. (1996) found an average of a three-month
discrepancy following a summer.
In the current study, the differential loss based on a measure of family income
was significant only in second grade. In contrast, previous studies have found differential
loss throughout grade levels. This differential loss, compounded over multiple summers
and combined with the common differences in initial status for children from low-income
backgrounds, can amount to a two- to three-year lag in reading skills by middle school
when compared to children from middle- to upper-income backgrounds (Allington &
McGill-Franzen, 2003).
In many studies, ample variation in student scores remained after accounting for
family income, encouraging the conclusion that additional factors were involved in
summer learning loss besides family income. In the current study, special education

40
status also accounted for variation in loss in second grade. Although both groups of
students evidenced loss, students in special education lost more over the summer than
students in general education. Only a few previous studies have included special
education status as a variable in summer learning loss. These studies have explored
differences in pre- and post-break trend line and level of performance for disabled and
non-disabled students (Allinder & Eicher, 1994; Allinder & Fuchs, 1994), as well as for
students in varying categories of special education (i.e., learning disabled and mild
cognitive impairment; Allinder et al., 1998). In general, results indicated that students in
special education exhibited loss over the summer, yet this loss was not significantly
different from the loss experienced by the comparison group of students not eligible for
special education. The previous findings aligned with the results seen in the third grade
sample of the current study, but they stood in contrast to the findings from the second
grade students. Adding the current findings to the body of research provides more fodder
for continuing to include this variable in future studies in order to clarify the intricacies of
summer learning loss and special education classification.
Measurement of Loss
By measuring summer loss with R-CBM, common problems associated with
using global, standardized norm-referenced achievement tests (e.g., expensive,
infrequently administered) can be avoided. In addition, the focus no longer has to be
solely on the loss but also can be on recoupment. When using expensive, time-consuming
reading comprehension tests, frequent assessments are not feasible. R-CBM allows for
multiple assessments over short periods of time and, thus, can track progress over the
early weeks and months of a school year, documenting not only the summer loss but also
41
the time it takes to bounce back and begin to grow again. On the other hand, measuring
summer reading loss with R-CBM is a relatively recent development. Curriculum-based
measurement of oral reading, though highly correlated with tests of reading
comprehension (Reschly et al., 2009), remains a different type of assessment, a
characteristic that must be considered when making comparisons with other research
findings. More research is needed that compares summer learning loss documented with
standardized, norm-referenced achievement tests and curriculum-based measurement.
These comparisons will help to determine whether R-CBM and other standardized
measurements provide the same picture of summer learning loss and whether R-CBM is
able to capture the extend of the loss relative to both oral reading fluency and
comprehension.
The current study found that loss was more prominent in the early elementary
grades. Other studies have also determined grade level to be a factor in reading loss;
however, the direction of the differential effect was inconsistent. That is, some studies
found more loss in the lower grades, whereas other studies found more loss in the upper
grades. In Cooper et al.’s (1996) meta-analysis, increases in grade level were associated
with greater summer loss. In contrast, results from a more recent study (Borman &
Dowling, 2006) found greater learning loss for high-poverty children in kindergarten than
in first grade. The impact of grade level could be based on the involvement in reading of
parents/caregivers with children of different grade levels. Students in lower grades may
lose more skills over the summer because they require more assistance with reading
practice due to their developing reading skills; on the other hand, students in upper grades
can read independently and may be better able to maintain reading skills without
42
parent/caregiver involvement. The opposing view could also be argued. Students in upper
grades may lose more skills over the summer because parents are less likely to support or
encourage reading or assist with the level of interpretation and analysis that is required.
Parents may be more likely to encourage reading and to read with younger children, thus
giving them the advantage over the summer.
The impact of grade level also could be dependent on the construct of reading and
the interpretation of R-CBM as children develop their reading skills. One model of
reading purports that in the lower grades, reading is comprised of the single factor of
reading competence, whereas in the upper grades reading involves both reading decoding
and reading comprehension (Shinn, Good, Knutson, Till, & Collins, 1992). There is some
evidence that correlations between R-CBM and other standardized measures of reading
achievement decrease as grade level increases (Reschly et al., 2009). More research is
necessary to establish whether R-CBM is able to document reading loss in the upper
grades or whether it is not sensitive enough to the factors involved in reading
achievement past early elementary to measure how reading skill changes over the
summer.
Implications and Future Directions
The current study has several limitations related to generalization and application
of findings. Results can only be generalized to similar populations (i.e., high percentage
of FRL eligibility, rural, majority white) and applied to reading (not math, spelling,
writing, etc.). As with many studies conducted within the constraints of the public
schools, some of the demographic variables were limited. Eligibility for FRL was used as
a proxy for family income. Eligibility for FRL is not an exact measurement, and there
43
remains a large amount of variability within the category. In future research it would be
helpful to include additional measures of income and economic status to inform relative
to the intra-category variability. The category of special education status also provided
limited information. Due to sample size, all students in special education were included
in one category rather than separating the students by disability category. Most of the
students were classified as Specific Learning Disability and a few others as Other Health
Impaired and Mild Intellectual Disability. Additional differentiation may be obtainable if
this group were separated by disability category. In line with this supposition, Allinder et
al. (1998) studied learning trend lines for students with learning disabilities and students
with mild intellectual disabilities and made the tentative conclusions that the trend of
learning differed by category.
Summer learning loss studies are also limited by the timing of measurement. In
the current study, data collection occurred 2 weeks before the end of the school year in
the spring and 1 week into the school year in the fall. Therefore, the interval of “summer”
actually includes 3 weeks of schooling. The impact of this measurement schedule should
be minimal as often the final week and first week of school are not as heavy with
instruction as other weeks of the school year. If, as it has been conjectured (Allinder &
Eicher, 1994), regression in R-CBM scores is a function of students being “out of
practice” for reading aloud, then the unaccounted for weeks in school may have more of
an effect than assumed. Likewise, several studies have documented rapid recoupment in
R-CBM scores with students reaching previous spring score levels within 5 weeks
(Allinder & Eicher, 1994). The most important takeaway from this is that studies must

44
always document when the data collection occurred in order that the possible affect of an
overlap can be considered.
An additional limitation was related to the choice of passage level for this study.
In order to look at summer learning loss without the increase in passage level difficulty
and the possibility of overestimating loss, the same passages were used in the spring and
fall. By using the previous level passages, there was the possibility of a test-retest effect
because the students read the same passages during the previous spring’s assessment. The
length of time between assessments (almost three months), as well as the brevity of
assessment (1 minute per passage) decreased the likelihood that there were any
advantages when re-reading the previous grade level passages. Furthermore, some
research suggests no evidence for the risk of practice effects when re-administering R-
CBM probes (Ardoin & Christ, 2008). For schools using ORF for benchmarking,
administering the passages from the previous grade level doubles the amount of
assessment conducted in the fall. This inconvenience may outweigh the chance of
obtaining more exact results regarding summer learning loss for many schools.
Consequently, future studies may choose to use the passages assigned for the current
grade level rather than the previous spring’s passages.
This study has implications for policy and practice related to all students, and
specifically at-risk students. It is likely that all students will benefit from summer
enrichment, whether the enrichment is provided through everyday family activities or
structured programming. Scholars and policymakers have argued that summer
enrichment is exceedingly important for children from economically disadvantaged
households; yet, these are the children for whom this enrichment often cannot be

45
provided. Interventions to address summer learning loss include making modifications or
extensions to the regular school year and implementing summer programs. School year
modifications have shown small, possibly trivial, benefits to students with the greatest
benefits seen with low-achieving students, students from disadvantaged backgrounds, and
schools in low-SES districts (Cooper, Valentine, Charlton, & Melson, 2003). Summer
programs and out-of-school time programs (e.g., after-school programs) also have mixed
reviews. For many summer programs, all students benefited and exhibited gains or no
loss; however, students from middle- to upper-income households appeared to benefit
more from summer programming than students from low-income backgrounds (Borman
et al., 2005; Lauer et al., 2006). As a result, even though both groups of students were
affected positively, the achievement gap remained and potentially increased. More
research and funding are necessary to implement effective summer programs and to make
these programs available for the children who need them the most.
Other areas of future research include recoupment, longitudinal studies of loss,
and prevention. Researchers should question how quickly students recover reading skills
and whether recovery differs for students at different grade levels or of different
subgroups. Do students grow at a faster rate immediately upon returning to school in the
fall than they do several weeks or a few months into the school year? If so, how long are
greater growth rates sustained? Furthermore, can recovery be accelerated through
interventions or specialized instruction? Some recent research suggests that growth
within a school year is not linear but rather differs among fall, winter, and spring. Ardoin
and Christ (2008) documented greater growth in the fall to winter interval compared to
the winter to spring interval, whereas Graney, Missall, Martinez, and Bergstrom (2009)

46
recorded the opposite trend. An additional avenue of research should include
investigating what factors, apart from to family income, can inform educators of the
likelihood of summer loss. Gaining an understanding of the alterable factors involved in
loss could inform the development of intervention and prevention programs. One
potential avenue of addressing prevention is providing parent/caregivers with education,
training, and resources to counter loss. Schools could sponsor informational sessions on
summer enrichment and provide ideas for inexpensive, feasible activities for their student
community. Packets of differentiated activities and summer assignments could be sent
home with students over the summer. Further research should continue to document
summer learning loss with the overarching goal of developing methods of prevention and
recovery that benefit all students and especially those often disadvantaged educationally.
47
References
Alexander, K. L., Entwisle, D. R., & Olson, L. S. (2001). Schools, achievement, and
inequality: A seasonal perspective. Educational Evaluation and Policy Analysis,
23(2), 171-191. doi: 10.3102/01623737023002171
Alexander, K. L., Entwisle, D. R., & Olson, L. S. (2007). Lasting consequences of the
summer learning gap. American Sociological Review, 72, 167-180.
Allinder, R. M., Bolling, R., Oats, R., & Gagnon, W. (1998). An analysis of alternative
means of measuring student achievement prior to a scheduled school break.
Special Services in the Schools, 14(1/2), 51-62.
Allinder, R. M. & Eicher, D. D. (1994). Bouncing back: Regression and recoupment
among students with mild disabilities following summer break. Special Services
in the Schools, 8(2), 129-142.
Allinder, R. M. & Fuchs, L. S. (1994). Alternative ways of analyzing effects of a short
school break on students with and without disabilities. School Psychology
Quarterly, 9(2), 145-160.
Allinder, R. M., Fuchs, L. S., Fuchs, D., & Hamlett, C. L. (1992). Effects of summer
break on math and spelling performance as a function of grade level. The
Elementary School Journal, 92(4), 451-460.
Allington, R. L., & McGill-Franzen, A. (2003). Use students' summer-setback months to
raise minority achievement. Education Digest, 69(3), 19-24.
Ardoin, S. P. & Christ, T. J. (2008). Evaluating curriculum based measurement slope
estimate using data from tri-annual universal screenings. School Psychology
Review, 37, 109-125.
48
Ardoin, S. P. & Christ, T. J. (2009). Curriculum-based measurement of oral reading:
Standard errors associated with progress monitoring outcomes from DIBELS,
AIMSweb, and an experimental passage set. School Psychology Review, 38(2),
266-283.
Baker, S. K. & Good, R. (1995). Curriculum-based measurement of English reading with
bilingual Hispanic students: A validation study with second-grade students.
School Psychology Review, 24(4), 561-578.
Betts, J., Reschly, A., Pickart, M., Heistad, D., Sheran, C., & Marston, D. (2008). An
examination of predictive bias for second grade reading outcomes from measures
of early literacy skills in kindergarten with respect to English-language learners
and ethnic subgroups. School Psychology Quarterly, 23(4), 553-570.
Borman, G. D., Benson, J., & Overman, L. T. (2005). Families, schools, and summer
learning. The Elementary School Journal, 106(2), 131-150.
Borman, G. D., & Dowling, N. M. (2006). Longitudinal achievement effects of multiyear
summer school: Evidence from the Teach Baltimore randomized field trial.
Educational Evaluation and Policy Analysis, 28(1), 25-48.
Brown, J. C. (1911). An investigation of the value of drill work in the fundamental
operations of arithmetic. Journal of Educational Psychology, 2, 81-88.
Burkam, D. T., Ready, D. D., Lee, V. E., & LoGerfo, L. F. (2004). Social-class
differences in summer learning between Kindergarten and first grade: Model
specification and estimation. Sociology of Education, 77(1), 1-31.
49
Busch, T. W. & Reschly, A. L. (2007). Progress monitoring in reading: Using
Curriculum-Based Measurement in a response-to-intervention model. Assessment
for Effective Intervention, 32, 223-230.
Chin, T. & Phillips, M. (2004). Social reproduction and child-rearing practices: Social
class, children’s agency, and the summer activity gap. Sociology of Education, 77,
185-210. doi: 10.1177/003804070407700301
Chin, T. & Phillips, M. (2005, Summer). Seasons of inequality: Exploring the summer
activity gap. American Educator, 29(2). Retrieved from http://www.aft.org/pubs-
reports/american_educator/issues/summer2005/chin.htm
Cohen, J. (1992). A power primer. Psychological Bulletin, 112, 155-159.
Cooper, H. (2003). Summer learning loss: The problem and some solutions. ERIC Digest,
ED475391. Retrieved from http://eric.ed.gov
Cooper, H., Nye, B., Charlton, K., Lindsay, J., & Greathouse, S. (1996). The effects of
summer vacation on achievement test scores: A narrative and meta-analytic
review. Review of Educational Research, 66(3), 227-268.
Cooper, H., Valentine, J. C., Charlton, K., & Melson, A. (2003). The effects of modified
school calendars on student achievement and on school and community attitudes.
Review of Educational Research, 73(1), 1-52.
CTB/McGraw-Hill. (1982). Comprehensive Test of Basic Skills. Monterey, CA: Author.
Deno, S. L. (1985). Curriculum-based measurement: The emerging alternative. Exceptional
Children, 52, 219-232.
Deno, S. L. (1992). The nature and development of curriculum-based measurement.
Preventing School Failure, 36(2), 5-10.

50
Deno, S. L. & Fuchs, L. S. (1987). Developing curriculum-based measurement systems
for data-based special education problem solving. Focus on Exceptional Children,
19, 1-16.
Deno, S. L., Fuchs, L. S., Marston, D., & Shin, J. (2001). Using curriculum-based
measurement to establish growth standards for students with learning disabilities.
School Psychology Review, 30, 507-524.
Deno, S., Reschly, A.L., Lembke, E, Magnussen, D., Callender, S., Windram, H., &
Statchel, N. (2009). A school-wide model for progress monitoring. Psychology in
the Schools, 46, 44-55.
Entwisle, D. R. & Alexander, K. L. (1994). Winter setback: The racial composition of
schools and learning to read. American Sociological Review, 59(3), 446-460.
Entwisle, D. R., Alexander, K. L. & Olson, L. S. (1997). Children, schools, and
inequality. Boulder, CO: Westview Press.
Entwisle, D. R., Alexander, K. L. & Olson, L. S. (2000). Summer learning and home
environment. In R. D. Kahlenberg (Ed.), A notion at risk: Preserving public
education as an engine for social mobility (pp. 9-30). New York: Century
Foundation Press.
Field, A. P. (2009). Discovering statistics using SPSS: and sex and drugs and rock ‘n’
roll (3rd Edition). London: Sage.
Filliben, J. J. (2006). Exploring data analysis. In NIST/SEMATECH e-Handbook of
Statistical Methods. Retrieved from http://www.itl.nist.gov/div898/handbook/
Fuchs, L. S., & Deno, S. L. (1991). Paradigmatic distinctions between instructionally
relevant measurement models. Exceptional Children, 57, 488–501.
51
Good, R. H. & Kaminski, R. A. (2002). DIBELSTM Oral Reading Fluency Passages for
First through Third Grades (Technical Report No.10). Eugene, OR: University of
Oregon.
Good, R. H., Simmons, D. C., Kame’enui, E. J., Kaminski, R. A., & Wallin, J. (2002).
Summary of decision rules for intensive, strategic, and benchmark instructional
recommendations in kindergarten through third grade. (Technical Report No.11).
Eugene, OR: University of Oregon.
Graney, S. B., Missall, K. N., Martinez, R. S., & Bergstrom, M. (2009). A preliminary
investigation of within-year growth patterns in reading and mathematics
curriculum-based measures. Journal of School Psychology, 47, 121-142.
Harcourt Educational Measurement. (1996). Stanford Achievement Test Series, 9th Ed.
San Antonio, TX: Harcourt Educational Measurement.
Haycock, K., Jerald, C. & Huang, S. (2001). Closing the gap: Done in a decade. Thinking
K-16, 5, 3-22.
Hayes, D. P. & Grether, J. (1983). The school year and vacations: When do students
learn? Cornell Journal of Social Relations, 17(1), 56-71.
Helf, S., Konrad, M., & Algozzine, B. (2008). Recouping and rethinking the effects of
summer vacation on reading achievement. Journal of Research in Reading, 31(4),
420-428.
Heyns, B. (1987). Schooling and cognitive development: Is there a season for learning?
Child Development, 58(5), 1151-1160.
52
Hintze, J. M. & Silberglitt, B. (2005). A longitudinal examination of the diagnostic
accuracy and predictive validity of R-CBM and high-stakes testing. School
Psychology Review, 34(3), 372-386.
Kahlenberg, R. D. (2000). Introduction: Making K-12 public education an engine for
social mobility. In R. D. Kahlenberg (Ed.), A notion at risk: Preserving public
education as an engine for social mobility (pp. 1-8). New York: Century
Foundation Press.
Lauer, P. A., Akiba, M., Wilkerson, S. B., Apthorp, H. S., Snow, D., & Martin-Glenn,
M. L. (2006). Out-of-school-time programs: A meta-analysis of effects for at-risk
students. Review of Educational Research, 76(2), 275-313.Marston, D. B. (1989).
A Curriculum-Based Measurement approach to assessing academic
performance: What it is and why do it. In M. R. Shinn (Ed.), Curriculum-Based
Measurement: Assessing special children (pp. 18-78). New York: The Guilford
Press.
McCoach, D. B., O'Connell, A. A., Reis, S. M., & Levitt, H. A. (2006). Growing readers:
A hierarchical linear model of children's reading growth during the first 2 years of
school. Journal of Educational Psychology, 98(1), 14-28.
Mraz, M. & Rasinski, T. V. (2007). Summer reading loss. Issues and Trends in Literacy,
60(8), 784-789.
Murnane, R. J. (1975). The impact of school resources on the learning of inner city
children. Cambridge, MA: Ballinger Publishing Co.
Nagaoka, J. & Roderick, M. (2004, April). Ending social promotion: The effects of
retention. Consortium on Chicago School Research. Chicago: University of
53
Chicago. Retrieved from
http://ccsr.uchicago.edu/content/publications.php?pub_id=12
National Center for Education Statistics, Institute of Education Sciences. (2009a). The
Nation's Report Card: Mathematics 2009 (NCES 2010-451). Washington, D.C.:
U.S. Department of Education. Retrieved from
http://nces.ed.gov/pubsearch/pubsinfo.asp?pubid=2010451
National Center for Education Statistics, Institute of Education Sciences. (2009b). The
Nation's Report Card: Reading 2009 (NCES 2010-458). Washington, D.C.: U.S.
Department of Education. Retrieved from
http://nces.ed.gov/pubsearch/pubsinfo.asp?pubid=2010458
National Center for Education Statistics, Institute of Education Sciences. (2010). The
Condition of Education 2010 (NCES 2010-028). Washington, D.C.: U.S.
Department of Education. Retrieved from
http://nces.ed.gov/pubsearch/pubsinfo.asp?pubid=2010028
No Child Left Behind Act of 2001, Pub. L. No. 107-110, 115 Stat. 1425 (2002).
Olson, L. & Jerald, C. D. (1998). The achievement gap. Education Week, 17(17), 10-13. Phillips, M. (2000). Understanding ethnic differences in academic achievement:
Empirical lessons from national data. Washington, D.C.: U.S. Department of
Education, National Center for Education Statistics.
Rathbun, A. H., Reaney, L. M., & West, J. (2003, April). The World Around Them: The
Relationship between Kindergartners' Summer Experiences and Their General
Knowledge. Paper presented at the annual conference of the American
Educational Research Association, Chicago, IL.
54
Reardon, S. F. (2003). Sources of educational inequality: The growth of racial/ethnic and
socioeconomic test score gaps in kindergarten and first grade (Working Paper
03-05R). University Park, PA: The Pennsylvania State University, Population
Research Institute.
Reschly, A. L., Busch, T. W., Betts, J., Deno, S. L., & Long, J. (2009). Curriculum-Based
Measurement Oral Reading as an indicator of reading achievement: A meta-
analysis of the correlational evidence. Journal of School Psychology, 47, 427-469.
Rosenblatt, M. L. (2002). The effects of summer vacation on children’s reading
performance: An examination of retention and recoupment using curriculum-
based measurement (Unpublished master’s thesis). Syracuse University,
Syracuse, NY.
Rumberger, R. W. & Arellano, B. (2004). Understanding and addressing the Latino
achievement gap in California. (Working paper 2004-01). Berkeley, CA: UC
Latino Policy Institute.
Shinn, M. R. & Bamonto, S. (1998). Advanced applications of curriculum-based
measurement: “Big ideas” and avoiding confusion. In M. R. Shinn (Eds),
Advanced applications of curriculum-based measurement (pp. 1-31). New York:
The Guilford Press.
Shinn, M.R., Good, R.H., Knutson, N., Tilly, W.D., & Collins, V. (1992). Curriculum-
based measurement of oral reading fluency: A confirmatory analysis of its
relation to reading. School Psychology Review, 21, 459-479.
55
Yeo, S. (2009). Predicting performance on state achievement tests using curriculum-
based measurement in reading: A multilevel meta-analysis. Remedial and Special
Education. Advance online publication. doi: 10.1177/0741932508327463

56
CHAPTER 3
CURRICULUM-BASED MEASUREMENT AS A PREDICTOR OF
PERFORMANCE ON STATE ASSESSMENTS:
A LOOK AT DIAGNOSTIC EFFICIENCY AND PREDICTIVE BIAS2
2 Sandberg Patton, K. L., Reschly, A. L., & Appleton, J. To be submitted to School Psychology Review.
57
Abstract
With the concurrent emphasis on accountability, prevention, and early intervention,
curriculum-based measurement of reading (R-CBM) is playing an increasingly important
role in the educational process. This study investigated the utility of R-CBM to predict
performance on a state reading test by examining the accuracy of predictions and the
potential for predictive bias based on membership in certain subgroups. Scores on
Dynamic Indicators of Early Literacy Skills (DIBELS) Oral Reading Fluency (ORF) for
1374 students in Grades 2 – 5 were used to predict outcomes the Georgia reading
achievement test, the Criterion Referenced Competency Tests (CRCT). Cut scores were
generated using logistic regression and receiver operator characteristic (ROC) curve
analysis, following the procedure outlined in Silberglitt and Hintze (2005). The generated
cut scores were compared to the published DIBELS ORF benchmarks based on
diagnostic efficiency. The generated cut scores were lower than the suggested DIBELS
ORF benchmarks and had improved diagnostic efficiency. The potential for bias based on
FRL eligibility, ethnic minority status, and ELL status was investigated using regression
and repeated-measures analysis of variance. Evidence of bias was found but varied by
subgroup and grade. Implications related to educational policy and the use of R-CBM are
discussed.

58
Introduction
Curriculum-based measurement (CBM) is a standardized procedure for measuring
student progress in the core academic areas of reading, mathematics, written expression,
and spelling. CBM, developed by Stan Deno and his colleagues at the University of
Minnesota in the late 1970s (Deno, 1985, 1992), is a type of curriculum-based assessment
(CBA), in that the assessments are based in the curriculum and are designed for frequent
administration; however, CBM differs from other forms of CBA (e.g., end-of-unit tests)
because it meets traditional psychometric criteria for validity and reliability. CBM of
reading (R-CBM) is the most widely used and researched form of CBM. Overall, R-CBM
has been found to be moderately to highly correlated with various measures of academic
achievement (for a review, see Reschly, Busch, Betts, Deno, & Long, 2009). Although R-
CBM boasts widespread use and evidence of technical adequacy, there are lingering
questions when the goal is to employ R-CBM scores as predictors of success or failure on
a criterion measure. The purpose of the current study was to explore the utility of R-CBM
for identifying students at risk for failing a high-stakes assessment (i.e., state reading
achievement test) and to explore whether there was evidence of predictive bias. Using R-
CBM data, specifically Dynamic Indicators of Basic Early Literacy Skills (DIBELS) Oral
Reading Fluency (ORF) measure, cut scores were generated to predict success or failure
on the reading portion of the Georgia state reading achievement test, the Criterion
Referenced Competency Tests (CRCT) of Reading. In addition, predictions were
examined for evidence of bias as a function of subgroup membership (i.e., English
language learner [ELL], eligibility for free or reduced lunch [FRL], ethnicity).

59
R-CBM
R-CBM is the most popular CBM measure and touts the most empirical support.
R-CBM is constructed to be correlated with key behaviors that are indicative of overall
performance in reading (Shinn & Bamonto, 1998). That is, it is a General Outcome
Measure for reading (Fuchs & Deno, 1991). Research from the past few decades supports
R-CBM as a reliable and valid method of measurement in the area of reading with
moderate to high correlations with measures of reading achievement, including reading
comprehension, decoding, word identification, and vocabulary (Reschly et al., 2009). R-
CBM is individually administered according to standardized procedures (Busch &
Reschly, 2007). For the procedure, students are asked to read aloud for 1 minute from a
leveled passage that should be reflective of students’ reading curricula and appropriate
for their grade level. R-CBM scores are based on the number of words read correctly in a
minute (WRC).
R-CBM passages or probes can be drawn directly from a school’s reading
curriculum or from standardized passage sets. If drawn from a reading curriculum,
passages should be evaluated and leveled according to grade. The drawback of using
diverse reading curricula from which to develop reading probes is that no two passage
sets are the same across studies, making it difficult to generalize from one study to
another. One alternative is to use published passage sets. Published passage sets consist
of many reading passages or probes that have certain difficulty levels based on
readability formulas, Euclidean distance procedures, or other standardized development
procedures (Betts et al., 2008). Commercially available passage sets include those from
AIMSweb (http://www.aimsweb.com) and DIBELS (https://dibels.uoregon.edu).

60
Nevertheless, even amongst the published passage sets differences exist; thus, it is
important to know what type of R-CBM probe was used to draw proper conclusions. The
current study employed DIBELS passage sets, so should be compared to other studies
using the same.
In its infancy, R-CBM was used primarily by special education teachers to
monitor student progress and make appropriate instructional adjustments. Now, 30 years
after its development, the applicability of R-CBM is much broader than before. R-CBM
has been used with various age groups including adolescents (e.g., Espin, Busch, Shin, &
Kruschwitz, 2005) and preschoolers (e.g., Kaminski & Good, 1996; McConnell,
McEvoy, & Priest, 2002), as well as diverse populations such as students with high-
incidence disabilities (e.g., Allinder, Bolling, Oats, & Gagnon, 1998; Allinder & Fuchs,
1994), students who are blind, deaf, or hard of hearing (e.g., Allinder & Eccarius, 1999;
Morgan & Bradley-Johnson, 1995) and ELL and speakers of languages other than
English (e.g., Baker & Good, 1995; Betts, Muyskens, & Marston, 2006; Domínguez de
Ramírez & Shapiro, 2006; Sandberg & Reschly, 2011; Wiley & Deno, 2005).
In addition to the increased use of R-CBM among diverse populations, many
schools presently use R-CBM and other CBM measures as primary data sources in
problem solving models (e.g., Data-Based Problem Solving Model; Deno, 1989) and
multi-level prevention and intervention systems (e.g., Response to Intervention; Christ &
Silberglitt, 2007; Deno et al., 2009). The use of CBM within these systems has surpassed
mere progress monitoring to include additional uses such as screening for academic
difficulties, setting individualized goals, benchmarking, and informing eligibility
61
decisions (Ardoin & Christ, 2009; Good, Simmons & Kame’enui, 2001; Reschly et al.,
2009; Wiley & Deno, 2005).
Another recent application of CBM, which comes in the wake of increased
pressure for early identification and better accountability, is for the prediction of
performance on statewide achievement tests and other high-stakes assessments (for a
review, see Yeo, 2009). The rationale is to use R-CBM data to identify preemptively
those students who are at risk of failing statewide achievement tests (Shapiro, Keller,
Lutz, Santoro, & Hintze, 2006). To do this, R-CBM benchmarks must be developed that
can predict with a high likelihood the outcome (success or failure) on a state achievement
test. Not only do these predictions need to be accurate for the whole population, but also
they need to function similarly across all subgroups. The goal of the current study was to
examine the relationship between the state reading test of Georgia and R-CBM, looking
at the accuracy of predictions for different benchmarks and examining for predictive bias
based on certain subgroups. The following literature review provides a rationale for the
research, describes common practices for using R-CBM data to predict state test
performance, and synthesizes the research on diagnostic accuracy and predictive bias.
The Context: State Achievement Testing
Within the current educational climate of heightened accountability and
reinforced efforts toward early intervention, R-CBM is playing an increasingly important
role. Existing legislation (i.e., No Child Left Behind, 2002) mandates statewide
achievement testing in order to track student achievement and test participation, both for
a school’s entire student body and separately for subgroups of interest (e.g., by ethnicity,
ELL status, or special education [SPED] status). Often, data from these assessments are
62
used to make high-stakes decisions about individual students’ proficiency and overall
school progress (Crawford, Tindal, & Stieber, 2001). In this way, schools are held
responsible for the achievement of all students and challenged to create equality in
educational services and outcomes. Unfortunately, statewide achievement tests, though
central to the accountability efforts, are not well suited as methods of early identification
and intervention. Most statewide achievement tests are not designed for frequent
administration in a practical or a technical sense – they are costly and time-consuming.
They are only given once a year and often are not administered until the third grade
(Crawford et al., 2001; Keller-Margulis, Shapiro, & Hintze, 2008). Results of the
achievement tests are not helpful for making instructional changes (Crawford et al., 2001)
and are incapable of providing evidence of short-term progress for individual students
(Baker & Good, 1995). Furthermore, state achievement tests often are poorly constructed
and vary widely in terms of difficulty (Peterson & Hess, 2005; Wallis & Steptoe, 2007).
In sum, the information from statewide achievement testing is late and lacking
(McGlinchey & Hixson, 2004).
In order to supply the early identification and intervention needed to positively
impact young learners, teachers need a measurement system that provides earlier and
more frequent assessment of student skill and progress, a measurement system such as
CBM. Despite the utility of R-CBM as a General Outcome Measure (e.g., a broad
indicator of reading competence) and the value of its norms for evaluation and
comparison, the overarching desire in the current milieu is to determine whether students
are or will be proficient relative to state assessments in addition to a general standard of
proficiency (Silberglitt & Hintze, 2005).

63
In the last decade, numerous studies examining the relationship between R-CBM
and specific state tests have been conducted. A recent meta-analysis reviewed 27 studies,
focusing on the strength of the predictive relationship and potential moderators of this
relationship (Yeo, 2009). The 27 studies included in the meta-analysis included peer-
reviewed journal articles, technical reports, and unpublished doctoral dissertations and
encompassed the following statewide tests: the Arizona Instrument to Measure Standards,
the Colorado Student Assessment Program, the Delaware Student Testing Program, the
Florida Comprehensive Assessment Tests, the Illinois Standards Achievement Test, the
Michigan Educational Assessment Program, the Minnesota Comprehensive Assessment,
the North Carolina End of Grade Reading Assessment, the Ohio Off-Grade Proficiency
Reading Test, the Ohio Reading Proficiency Test, the Oklahoma Criterion Referenced
Test of Reading, the Oregon Statewide Assessment, the Pennsylvania System of School
Assessment, the Texas Assessment of Knowledge and Skills, and the Washington
Assessment of Student Learning.
Results of the meta-analysis supported the conclusion that R-CBM is a valid
predictor of performance on statewide reading tests (Yeo, 2009). The population
correlation derived from all the studies was large (r = .69) with individual study’s
correlations ranging from .43 (Stage & Jacobsen, 2001) to .80 (Shaw & Shaw, 2002).
Two additional studies examining the relationship between CBM and state reading tests
have been published since the literature review was performed for the meta-analysis
(Keller-Margulis et al., 2008; Roehrig, Petscher, Nettles, Hudson, & Torgesen, 2008).
These two studies focused on state tests already examined in previous literature (Florida
64
and Pennsylvania) and reported correlations similar to previous research, ranging from
.67 to .71.
As part of the meta-analysis, moderators of the relationship between R-CBM and
state reading tests were examined (Yeo, 2009). The analysis revealed significant
variability in effect size as a function of sample size, the proportion of ELL and SPED,
and the time interval between R-CBM and state testing. As sample size increased, the
relationship between R-CBM and the state reading test was stronger. The proportion of
ELL and SPED students was negatively related to the relationship between the variables;
greater numbers of ELL or SPED students in the sample was related to lower correlations
between CBM and state reading tests. Shorter time intervals between the two testings
were related to higher correlations. Other moderators investigated but not significantly
related to variations in effect size included the proportion of students receiving FRL,
proportion of racial/ethnic minorities, method of R-CBM passage creation, grade level,
and characteristics of state reading tests (year of publication, type of content, and format).
The author acknowledged limitations in the current sample (e.g., small proportion of
students eligible for FRL, large proportion of Caucasian students), as well as existing
research with contradictory findings relative to grade level (Silberglitt, Burns, Madyun, &
Lail, 2006), passage creation (Ardoin & Christ, 2009), and the proportion of certain
demographic characteristics of the sample (Hixson & McGlinchey, 2004). Continued
research was called for to address these and other potential moderators, as well as to
include reading tests from additional states (Yeo, 2009).
As emphasized by the results of the meta-analysis (Yeo, 2009), a review of
research provides strong support for considering R-CBM an indicator of reading
65
competence and using R-CBM as a predictor of state reading test performance. Based on
these conclusions, a plausible next step is to use R-CBM and state reading test
performance to identify R-CBM cut scores that predict success and failure on state
reading tests (Silberglitt & Hintze, 2005). A possible course of action is to develop
universal R-CBM benchmarks appropriate for all students across states. Despite its
attractiveness because of parsimony, this solution may not be desirable for several
reasons. First, due to identified and potential moderators of the relationship between R-
CBM and state reading tests (e.g., time interval of testing, proportion of certain
population subgroups, passage creation), R-CBM benchmarks may not function similarly
across states or districts that vary demographically or differ in terms of testing practices.
For example, if the magnitude of the proportion of ELL in the sample is negatively
related to the relationship between R-CBM and the state reading test (Yeo, 2009), then
benchmarks may perform differently among populations with varying percentages of
ELL. Second, some research suggested that R-CBM scores were biased predictors of
state reading test performance such that certain population subgroups are over- or under-
predicted based on group membership (e.g., Betts et al., 2006; Betts et al., 2008; Hosp,
Hosp, & Dole, 2011; Kranzler, Miller, & Jordan, 1999). If this were the case, universal
benchmarks would not be feasible. Third, due to the diverse nature of state achievement
tests (Reschly et al., 2009), R-CBM benchmarks may not produce the same diagnostic
accuracy across states. In other words, because state reading tests differ greatly based on
level of difficulty and required proficiency (Peterson & Hess, 2005) and format of
questions (Yeo, 2009), R-CBM benchmarks may not function in the same way for each
state (Shapiro et al., 2006).

66
In sum, due to various reasons, one set of R-CBM benchmarks may function
adequately for predicting success on a certain state reading test, but the same set of
benchmarks may not function in the same way if used to predict success on another state
reading test. Despite the recent focus on the correlational relationship between R-CBM
and state reading tests, less attention has been given to establishing benchmarks,
examining diagnostic properties, or testing for predictive bias based on subgroup
membership. A review of the existing literature helps to conceptualize the current
situation and understand the areas where additional research is needed.
Cut Scores and Diagnostic Accuracy.
The goal of creating a cut score is to delineate a critical WRC that indicates
whether students are on track toward a specific standard of proficiency (Silberglitt &
Hintze, 2005). The definition of proficiency differs by situation, but it could be a general
outcome like becoming a successful reader or a more specific outcome like a passing
score on an achievement test. Within the current educational system, districts often have
a very specific definition of proficiency, that is, passing the mandated statewide
achievement test (Silberglitt & Hintze, 2005). To use R-CBM data to determine whether
students are on track toward passing the state reading test, cut scores must be established.
Two approaches to establishing and evaluating cut scores are used frequently, 1) generic
cut scores are applied to the sample, or 2) cut scores are developed specifically for the
sample using statistical procedures.
A few researchers have published R-CBM norms derived from large-scale studies
that are often used applied as cut scores for predicting various standards of proficiency.
One set of norms was developed by Hasbrouck and Tindal (1992) was based on 9 years
67
of R-CBM data from diverse districts in midwestern and western states. According to
Hasbrouck and Tindal, because the data were collected systematically on a large number
of students with a wide range of demographics, the norms provide stable benchmarks of
R-CBM across the year and across grades. Normative scores were provided for second
through fifth grades in the fall, winter, and spring for the 25th, 50th, and 75th percentiles.
The 50th percentile spring scores for first, second, third, and fourth grades (40, 90, 110,
and 118 WRC, respectively) are widely cited and often used as benchmarks of
proficiency. Furthermore, this set of norms has been incorporated into published curricula
(e.g., Read Naturally) and data management systems, like the popular system of DIBELS
(Crawford et al., 2001).
A second generic set of norms is provided by DIBELS and is purported to predict
general success in reading (Good, Simmons, Kame’enui, Kaminski, & Wallin, 2002).
DIBELS is a commonly used benchmarking system (Good et al., 2001; Sibley, Biwer, &
Hesch, 2001) implemented in thousands of schools across the U.S.
(https://dibels.uoregon.edu). The R-CBM norms provided by DIBELS are designed for
use with DIBELS ORF reading probes. DIBLES ORF is an R-CBM and follows the same
procedures for administration and scoring. Reading probes to be used for benchmarking
are provided starting mid-year first grade and continue through the end of fifth grade. In
addition, many probes for progress monitoring are provided at each grade level. The
benchmarks, displayed in Table 4, were developed based on normative data from a
nationwide sample from 2000-2003. The rationale of the systems is that students should
be reading at a rate of 40 or more WRC in the spring of first grade, 90 or more WRC in
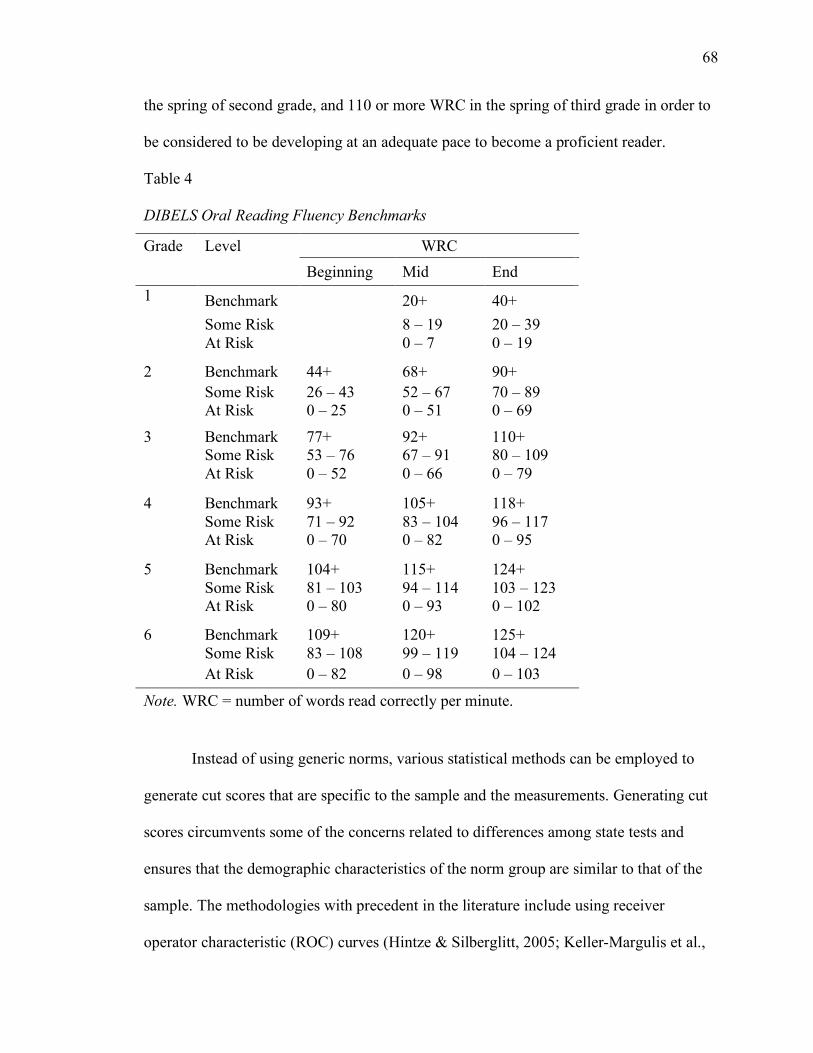
68
the spring of second grade, and 110 or more WRC in the spring of third grade in order to
be considered to be developing at an adequate pace to become a proficient reader.
Table 4 DIBELS Oral Reading Fluency Benchmarks
Grade Level WRC Beginning Mid End
Benchmark 20+ 40+ Some Risk 8 – 19 20 – 39
1
At Risk 0 – 7 0 – 19
Benchmark 44+ 68+ 90+ Some Risk 26 – 43 52 – 67 70 – 89
2
At Risk 0 – 25 0 – 51 0 – 69
Benchmark 77+ 92+ 110+ Some Risk 53 – 76 67 – 91 80 – 109
3
At Risk 0 – 52 0 – 66 0 – 79
Benchmark 93+ 105+ 118+ Some Risk 71 – 92 83 – 104 96 – 117
4
At Risk 0 – 70 0 – 82 0 – 95
Benchmark 104+ 115+ 124+ Some Risk 81 – 103 94 – 114 103 – 123
5
At Risk 0 – 80 0 – 93 0 – 102
Benchmark 109+ 120+ 125+ Some Risk 83 – 108 99 – 119 104 – 124
6
At Risk 0 – 82 0 – 98 0 – 103
Note. WRC = number of words read correctly per minute.
Instead of using generic norms, various statistical methods can be employed to
generate cut scores that are specific to the sample and the measurements. Generating cut
scores circumvents some of the concerns related to differences among state tests and
ensures that the demographic characteristics of the norm group are similar to that of the
sample. The methodologies with precedent in the literature include using receiver
operator characteristic (ROC) curves (Hintze & Silberglitt, 2005; Keller-Margulis et al.,
69
2008; Roehrig et al., 2008; Shapiro et al., 2006), analysis of variance (ANOVA; Stage &
Jacobsen, 2001), logistic regression, discriminant analysis, or the equipercentile method
(Silberglitt & Hintze, 2005). While different methodologies have their advantages,
logistic regression and ROC curves appear to perform most satisfactorily (Silberglitt &
Hintze, 2005).
Regardless of their source (generic or generated), the cut scores should be
evaluated based on their diagnostic efficiency. Diagnostic efficiency is the degree to
which scores on one measure can discriminate between successful and unsuccessful
outcomes on an outcome measure (Hintze & Silberglitt, 2005). Specific to our purposes,
it is the accuracy of R-CBM scores in predicting outcomes on a state reading test.
Standards of diagnostic efficiency differ by purpose and situation, and acceptable levels
of diagnostic accuracy are integral for assurance in a prediction. The main objective for
the current situation is predicting success or failure on a high-stakes achievement test. In
addition to this purpose, many schools and districts use cut scores to ascertain need for
tiered support services. That is, cut scores can be utilized to assign students a risk level
and provide support services based on the risk level. Thus, when considering acceptable
and desired levels of diagnostic efficiency, both purposes must be attended. Two errors in
prediction exist. One, a student is predicted to pass the state reading test yet does not
pass. Two, a student is predicted to fail the state reading test yet does not fail. In the
former situation the student missed out on interventions that may have circumvented the
failure. Conversely, the latter situation often is considered less risky, yet still is
considered undesirable for reasons related to the most beneficial allocation of resources
(e.g., time, money, personnel).
70
When discussing the diagnostic accuracy of a measure, there are several terms
that describe the relationship between the score on the predictor (in this case, R-CBM)
with the score on the outcome measure (the state reading test). These terms are
sensitivity, specificity, positive predictive power (PPP), negative predictive power (NPP),
and overall correct classification (Hintze, Ryan, & Stoner, 2003; McGlinchey & Hixson,
2004; Keller-Margulis et al., 2008; Silberglitt & Hintze, 2005). Sensitivity is the
percentage of students who failed the state assessment who were predicted to fail based
on their R-CBM score. Specificity is the percentage of students who passed the state
assessment who were predicted to pass based on their R-CBM score. PPP is the
probability that students whose R-CBM scores were below the cut score will actually fail
the state assessment. NPP is the probability that students whose R-CBM scores were at or
above the cut score will actually pass the state assessment. Overall correct classification,
also referred to as hit rate, is the percentage of agreement between R-CBM cut scores and
state assessment performance.
A review of the research reveals a limited number of published studies that
applied generic cut scores to a sample population and reported the resulting diagnostic
accuracy, and only a handful of studies that generated sample-specific cut scores and
reported diagnostic accuracy. The following sections outline the findings.
Studies evaluating generic cut scores. There have been several published studies
and technical reports that evaluated the utility of generic cut scores for predicting
performance on certain state achievement tests. Generic cut scores usually originated
from the norms published by Hasbrouck and Tindal (1992) or the cut scores provided by
DIBELS for the ORF measure. As will be seen in the subsequent breakdown, the generic
71
cut scores did not perform identically across studies. Variability likely stemmed from
differences based on sample populations, passage sets, and state tests. In some cases, the
pre-set cut scores were determined to be adequate for the stated purpose (i.e., screening,
prediction), whereas in other cases alternative cut scores were suggested and evaluated as
a way of improving diagnostic efficiency.
One of the first tests to be investigated was the Oregon State Assessment
(OSA). Crawford et al. (2001) linked second and third grade R-CBM scores with third
grade performance on the OSA reading test. The R-CBM passages were drawn from the
Houghton Mifflin reading series. Performance on the OSA was examined based on
quartiles developed from the norms suggested by Hasbrouck and Tindal (1992). In this
sample, second graders scoring at or above 72 WRC all passed the state test in third
grade. Third graders scoring 119 WRC or above had a 94% passing rate. In a similar
study, Good et al. (2001) linked third graders’ scores from R-CBM passages from the
Test of Reading Fluency and from the OSA and evaluated the performance of students
based on the norms suggested by Hasbrouck and Tindal. The authors found a 96%
passing rate on the state test for third graders who scored at or above 110 WRC on R-
CBM, whereas a 28% passing rate for those who scored at or below 70 WRC. Compared
to the results found in Good et al., the third graders in Crawford et al.’s sample needed
higher R-CBM scores to have equivalent chances of passing the Oregon state test.
Notably, even when predicting performance on the same state test, R-CBM scores drawn
from different passage sets and different samples functioned variably.
McGlinchey and Hixson (2004) investigated the diagnostic efficiency of R-CBM
scores in the prediction of student performance on the Michigan Educational Assessment

72
Program’s (MEAP) reading test. In this study, a standard cut score of 100 WRC was
chosen based on previous research and examined with fourth grade fall R-CBM data and
MEAP reading scores. The R-CBM passages were from a fourth grade basal reading text,
MacMillan Connections Reading Program. The specificity of the cut score for identifying
those students who did pass the MEAP was 74%, and the sensitivity of the cut score for
identifying those students who did not pass the MEAP was 75%. The PPP was 77%, and
the NPP was 72%. Authors concluded that the R-CBM cut scores increased the accuracy
of prediction over the base rate of passing or failing the MEAP.
The remainder of the studies to evaluate generic cut scores used the benchmarks
suggested by DIBELS. DIBELS ORF benchmarks have been used to evaluate state
reading test performance in six states – Arizona, Colorado, Florida, Illinois, North
Carolina, and Ohio. Sibley et al. (2001) conducted one of the early evaluations with the
Illinois Standards Achievement Test (ISAT). In this study, R-CBM passages were drawn
from second and third grade local reading curricula (Houghton Mifflin and Scholastic
Literature). Scores from R-CBM were linked to performance on the third grade ISAT,
and passing percentages were examined based on DIBELS ORF benchmarks. Sibley et
al. concluded that the third grade ORF cut scores functioned well for predicting success
on the ISAT, whereas the second grade cut scores were slightly low yet adequate. A
subsequent study similar to Sibley et al.’s analysis linked R-CBM scores to the Florida
Comprehensive Assessment Test (FCAT; Buck & Torgesen, 2003). Buck and Torgesen
(2003) used standard third grade reading passages from Children’s Educational Services
and appraised passing percentages based on the third grade ORF cut scores. The authors
reported a 91% passing rate for scores at or above 110 WRC on R-CBM.

73
Whereas both Sibley et al. (2001) and Buck and Torgesen (2003) evaluated the
DIBELS ORF cut scores, the two studies used different passage sets to do so. The
remainder of the studies evaluating the DIBELS benchmarks also employed the DIBELS
ORF passages. Consequently, the following studies should contain less variability based
on passage difficulty or level, allowing for easier, more appropriate comparisons. The
first of these studies looked at ORF scores and the Colorado State Assessment Program
(CSAP) reading test in third grade (Shaw & Shaw, 2002). Shaw and Shaw (2002) found
that the third grade ORF cut score of 110 WRC produced a 90% passing rate. Yet,
lowering the cut score to 90 WRC resulted in a 91% passing rate, which was judged as
more desirable. Similarly, the third grade benchmark of 110 WRC was appraised by
Barger (2003) to be too stringent for predicting success on the North Carolina End of
Grade reading test. Barger suggested 100 WRC as the most appropriate cut score for
ORF to predict a passing score on the reading test for the small sample of third graders (N
= 38). Of the students scoring 100 WRC or better, 100% passed the test.
In contrast to the high passing percentages found by Barger (2003) and Shaw and
Shaw (2002), the third grade ORF cut scores provided a lower passing percentage when
predicting Arizona Instrument to Measure Standards (AIMS) reading test scores. Wilson
(2005) reported that 81.9% of third grade students scoring 110 WRC on ORF passed the
state reading test. The accuracy was slightly better for those scoring less than 80 WRC
(i.e., the third grade ORF benchmark associated with at risk status) – 93% did not pass
the state test. Vander Meer, Lentz, and Stollar (2005) reported the lowest passing
percentages using ORF cut scores. Only 72% of third graders scoring 110 WRC or better
on ORF were correctly classified for performance on the Ohio Proficiency Test (OPT).

74
Fourth grade fall and spring ORF cut scores were also evaluated, but ORF passages were
not used. Fourth grade R-CBM passages were drawn from the Houghton Mifflin reading
series and linked to fourth grade scores on the OPT. In the fall of fourth grade, the
benchmark of 93 WRC classified 72% correctly, and the spring benchmark of 118 WRC
classified 90% accurately.
In sum, several researchers have evaluated the utility of generic cut scores as
indicators of the likelihood of success or failure on state reading tests. In some instances,
the generic cut scores performed adequately and were recommended for use (Buck &
Torgesen, 2003; Good et al., 2001; Sibley et al., 2001), whereas in other cases the cut
scores needed adjustments in order to improve diagnostic accuracy (Barger, 2003; Shaw
& Shaw, 2002). In addition, several studies reported passing percentages that were
considered unacceptable for predictive purposes (Vander Meer et al., 2005; Wilson,
2005). Overall, these studies confirmed that using generic R-CBM cut scores with a
sample population often resulted in adequate predictions of student success or failure on a
state reading test. At the same time, the studies highlighted the importance of evaluating
the generic cut scores for diagnostic efficiency to ensure accurate application.
Studies generating cut scores. A few studies generated cut scores specific to the
sample population instead of using generic cut scores. Stage and Jacobsen (2001) used R-
CBM and the Washington Assessment of Student Learning (WASL) reading test data to
generate cut scores to predict performance. Fourth grade R-CBM passages were taken
from the reading series Silver Burdette and Ginn and linked to fourth grade WASL
performance. ANOVA was used to establish cut scores for R-CBM based on passing the
WASL. Stage and Jacobsen reported cut scores of 107 for fall, 122 for winter, and 137

75
for spring for passing the test. Confidence intervals (CI) were also reported. The
diagnostic efficiency of the fall cut score (107, CI 100-117) was given as sensitivity of
66%, specificity of 76%, PPP of 41%, and NPP of 90%. The differences among the
diagnostic efficiency statistics for the three cut scores were less than 1%. Stage and
Jacobsen concluded that the proposed cut scores increased the predictive power of failure
and success on the state test over base rates of passing and failing. Thus, the cut scores
served as useful data in a problem solving approach to early intervention.
Two studies have been conducted using the state test in Pennsylvania. Shapiro et
al. (2006) used fifth grade R-CBM scores derived from AIMSweb and district-developed
passages to generate cut scores for predicting success/failure on the fifth grade
Pennsylvania System of School Assessment (PSSA). ROC curves were used to establish
cut scores and the diagnostic efficiency was examined. The scores of 125 (District 1) and
126 (District 2) WRC had the highest levels of both sensitivity (75% in District 1, 86% in
District 2) and specificity (72% in District 1, 83% in District 2), levels which were
considered acceptable for screening purposes by the authors. PPP was 84% and 94%, and
NPP was 58% and 68% for District 1 and 2, respectively. Shapiro et al. concluded that R-
CBM scores were important contributors for PSSA.
Subsequently, in a study by Keller-Margulis et al. (2008), cut scores for
predicting PSSA performance were generated for first-, third-, and fourth-grade samples.
R-CBM scores were obtained from passage sets from AIMSweb, and ROC curves were
used to generate cut scores with maximum sensitivity and specificity at each grade. In
first grade, a cut score of 36 WRC accurately classified 85% on the third grade PSSA
(72% sensitivity, 90% specificity). A cut score of 110 WRC in third grade was associated

76
with 80% classification on the fifth grade PSSA (77% sensitivity, 81% specificity). In
fourth grade, a cut score of 117 WRC classified 76% of students accurately on the fifth
grade PSSA (71% sensitivity, 78% specificity). The authors noted that the third grade cut
score of 110 WRC was consistent with previous research (Good et al., 2001; Stage &
Jacobsen, 2001); the first grade and fourth grade scores were also similar to those
specified by Good et al. (2001) and incorporated as DIBELS benchmarks.
Wood (2006) used ORF data to predict performance on the Colorado Student
Assessment Program Reading Test (CSAP). In this study, third, fourth, and fifth grade
students were assessed with winter ORF benchmarks approximately two months before
the administration of the CSAP. Using ANOVA and following the procedures outlined
by Stage and Jacobsen (2001), cut scores of 96 WRC (third grade), 117 WRC (fourth
grade), and 135 WRC (fifth grade) were established to predict whether students would
pass or fail the CSAP. Sensitivity ranged from 85% to 95% across grades; specificity
ranged from 58% to 67%. Overall correct classification was 66%, 65%, and 71% for
third, fourth, and fifth grades, respectively. Wood also calculated Kappa, a statistic that
refers to the level of diagnostic accuracy beyond chance, an important index to consider
when the base rate of passing or failing is substantially different from 50% (Streiner,
2003). Kappa was 19% in third grade, 33% in fourth grade, and 41% in fifth grade. Based
on the diagnostic efficiency statistics, Wood concluded that the ORF cut scores provided
predictive value above base rates of passing and beyond chance.
Researchers at Florida State University and The Florida Center for Reading
Research (Roehrig et al., 2008) also used ORF to predict state reading test success and
failure, specifically success or failure on the Florida Comprehensive Assessment Test

77
(FCAT). Roehrig et al. (2008) used statewide third grade ORF data to generate cut scores
and compared these cut scores to the generic cut scores suggested by DIBELS. The
authors found that a greater proportion of students would be correctly identified (true
positives and true negatives) by using the generated cut scores in place of the DIBELS
benchmarks. For the fall of third grade, DIBELS ORF benchmarks consider 77 WRC or
more to be a level of low risk and 53 WRC or less to be at risk. Using ROC curves to
examine the data, the cut scores were reestablished at greater than 76 WRC (low risk) and
less than 45 WRC (at risk) for the fall assessment of ORF. These adjusted cut scores
resulted in higher values of sensitivity, specificity, and overall hit rate.
A common thread in the aforementioned studies was that each study generated
cut scores from sample data and then discussed the diagnostic accuracy of the proposed
cut scores. These studies used either ROC curves or a method utilizing ANOVA to
generate the cut scores. There are other methods to generate these scores. As the focus of
two studies, Hintze and Silberglitt (2005; Silberglitt & Hintze, 2005) compared the
different statistical and methodological approaches to determining cut scores using R-
CBM and the Minnesota Comprehensive Assessment (MCA). Both studies provided R-
CBM cut scores for first through third grade at the fall, winter, and spring (except for first
grade, which only has winter and spring) for predicting success on the MCA. In one of
the studies, Hintze and Silberglitt (2005) linked first to third grade longitudinal R-CBM
with third grade MCA using three statistical procedures – discriminant analysis, logistic
regression, and ROC curves. The other study (Silberglitt & Hintze, 2005) used the same
three procedures, as well as the equipercentile method. Each procedure was able to
generate cut scores with adequate levels of diagnostic accuracy. The choice method from

78
both studies was ROC curves; however, this determination came with a few
qualifications. Silberglitt and Hintze (2005) suggested first using logistic regression to
determine whether the measure was able to generate cut scores with adequate diagnostic
accuracy and to set minimum levels of sensitivity and specificity. Next, ROC curves were
used in conjunction with pre-established rules to generate the cut scores that reflect the
desired diagnostic efficiency. Hintze and Silberglitt asserted that whereas logistic
regression provided the most parsimonious solution, ROC curves served as the most
flexible method of determining cut scores, thus the preferred method when users have
various assessment decisions. That is, different cut scores can be developed to support
different purposes such as screening, classification, or eligibility determination (Hintze &
Silberglitt, 2005).
In each of the studies discussed, R-CBM was found to be a useful predictor of
state reading test performance. Likewise, R-CBM cut scores provided adequate
diagnostic efficiency. A compilation of findings lends credence to the theory that R-CBM
cut scores can be generated from sample data and used as indicators of the probability of
success on upcoming statewide reading assessments. Creating cut scores specific to a
population sample and an outcome measure (e.g., individual state tests) may be optimal
to ensure the appropriateness to the sample population; however, the correspondence of
DIBELS ORF cut scores with the some of the R-CBM cut scores generated for the
Pennsylvania reading test (Keller-Margulis et al., 2008), the Colorado reading test
(Wood, 2006), and the Florida reading test (Roehrig et al., 2008) are noteworthy findings.
Nevertheless, more research is needed that generates cut scores for state reading tests and
compares them with the ORF cut scores to further establish the equivalence.

79
Predictive Bias
To garner more confidence in the application of R-CBM as a predictor of
performance on state reading tests, the issue of test bias must be thoroughly examined. If
R-CBM scores are used in decision-making and predicting success or failure on state
tests, then the predictive validity of R-CBM is of utmost importance. Predictive bias is
one aspect of predictive validity and communicates to test users whether the prediction of
future performance on a specific criterion measure holds for all populations of interest
(Betts et al., 2008). The definition of predictive bias proffered here is based on the
regression approach to bias (Reynolds, Lowe, & Saenz, 1999). Essentially, regression
lines formed for any two variables must be identical for any groups when making
predictions. If regression lines among groups differ significantly in slope or intercept,
there would be bias in a prediction if a single regression equation were used. On the
contrary, if regression lines among groups are equivalent, one regression equation is
sufficient for accurate prediction (Reynolds et al., 1999). Practically, if there were
evidence of predictive bias, then subsets of the population would be differentially
affected by the use of the test results. That is, certain populations may be over- or
underselected for services or interventions because the prediction made by the R-CBM
scores may function differently for different populations.
Whereas other psychometric properties (e.g., reliability, criterion validity) of R-
CBM are well established, the predictive validity of R-CBM with diverse populations has
had less attention in the published literature. Kranzler et al. (1999) made such an
observation as part of their rationale for examining test bias based on gender and
ethnicity. According to Kranzler et al., prior to their research, only one study purported to
80
address racial, gender, or socioeconomic status (SES) test bias (Knoff & Dean, 1994) but
employed an erroneous definition of test bias. Knoff and Dean (1994) used students’
mean differences on R-CBM scores as an indicator of test bias, a perspective of test bias
that has been deemed flawed. In other words, a test should not be considered biased
based on the fact that it yields group differences. Tests consistently may yield significant
differences among groups yet have adequate validity. Instead, predictive bias should
focus on the existence of systematic error in the predictions made by the test for the
criterion when basing the predictions on a common regression equation for all subgroups
of the population (Kranzler et al., 1999). Although predictive bias largely has been
overlooked in the published literature, a handful of recent studies have addressed the
issue related to gender, race/ethnicity, home language, and SES.
Predictive bias for CBM based on gender has been subjected to analysis in few
studies. Kranzler et al. (1999) found intercept and slope bias based on gender in a sample
of fifth grade students when using CBM scores to predict performance on the reading test
of the California Achievement Test. No bias based on gender was found with the second
through fourth grade samples. One study subsequent to the Kranzler et al. (1999) study
made the conclusion that R-CBM scores were not biased for gender (Klein & Jimerson,
2005) when used to predict Stanford Achievement Test-Ninth Edition (SAT-9; Harcourt
Brace & Company, 1997) scores for Caucasian and Hispanic students. Notably, in this
study, Klein and Jimerson (2005) looked at first through third graders, grade levels at
which no gender bias was found in Kranzler et al.
Studies examining bias based on ethnicity differ in their conclusions. Kranzler et
al. (1999) found intercept bias for ethnicity with samples of fourth and fifth grades but

81
not with second and third grades when using CBM scores to predict performance on the
California Achievement Test. Kranzler et al. concluded that CBM scores failed as
unbiased predictors in the upper elementary grades but did not exhibit predictive bias in
the early elementary grades.
It is important to note that a measure of family income was not included in the
study by Kranzler et al. (1999), an omission that limits the comparisons that can be drawn
among this study and others that account for this influential variable, such as the similar
study by Hixson and McGlinchey (2004). Hixson and McGlinchey looked at the factors
of race and income in the use of fourth grade R-CBM as a predictor of the Metropolitan
Achievement Tests (MAT/7, The Psychological Corporation, 1993) and the Michigan
Educational Assessment Program (MEAP). Using simultaneous multiple regression, they
found that a common regression line overestimated the performance of African American
students and students eligible for FRL on both criterion measures, yet underestimated the
performance of White students and students not eligible for FRL. In a second analysis
using stepwise regression, no evidence of bias was found. The authors concluded that the
study provided evidence of bias, though not without conflicting support.
Hintze, Callahan, Matthews, Williamson, and Tobin (2002) examined predictive
bias of R-CBM with African American and Caucasian students while controlling for SES
and age (by using a universal R-CBM passage). Their results indicated that prediction
lines for separate ethnic groups did not differ significantly from the group average,
leading to the conclusion that “…no differential predictive bias of reading comprehension
scores was evident based on a student’s age, CBM oral reading fluency abilities, or
ethnicity,” (p. 549, Hintze et al., 2002). Of interest, though, was the finding that R-CBM

82
accounted for less variance in reading comprehension for the Caucasian students than for
the African American students.
Some studies focused on home language or ELL status as a source of bias. Betts
et al. (2006) examined the validity of using R-CBM for prediction of scores on the
Northwest Achievement Levels Test (NALT, Northwest Evaluation Association, 2002)
for three groups of second grade ELL – Spanish, Hmong, and Somali. Common
regression analysis revealed similar growth across the year for each language group, thus
a lack of predictive bias for the slope parameter. In contrast, significant differences in
regression lines were seen when R-CBM was used to predict performance on the NALT.
The authors concluded that due to the intercept bias, a common regression line
underpredict the reading skills of the Somali students while overpredicting the reading
skills of the Spanish-speaking students. In a later study, Betts et al. (2008) looked for
evidence of bias based on ELL status in the predictions of CBM-like measures of early
literacy skills on the Minnesota Kindergarten Assessment (MKA). Bias was defined as
significant differences between regression intercepts, slopes, and standard errors or
estimates between two groups based on certain properties and accounting for SES.
Results indicated that a single predictive equation was adequate for all kindergarten
students regardless of ELL status.
Predictive bias jointly based on ethnicity, socioeconomic status, and language has
been examined in a few recent studies with conflicting results. Klein and Jimerson (2005)
found bias as a function of ethnicity and home language when using first grade R-CBM
to predict third grade SAT-9 scores. Using common R-CBM scores across groups
resulted in the overprediction of reading proficiency for Hispanic students whose home

83
language was Spanish and the underprediction of reading proficiency for Caucasian
students whose home language was English.
Likewise, Wilson (2005) documented bias based on ethnicity, SES, and language
in the predictions made by ORF for the Arizona state test (AIMS). Students classified as
“some risk” according to ORF scores were more likely to meet standards on AIMS if
they were White, not ELL, and not eligible for FRL. This study was limited by a small
total sample size (N = 241) and demographic subgroup totals ranging from 13 to 105. In
addition, methodological characteristics of the predictive bias analysis were not reported,
restricting the conclusions that can be drawn.
In contrast, predictive bias was absent when using R-CBM, specifically DIBELS
ORF, to predict performance on two criteria – the Florida state achievement test (FCAT)
and the SAT-10 (Harcourt Brace, 2003; Roehrig et al., 2008). In this study, logistic
regression was used with FCAT and SAT-10 performance as the outcomes and the
independent variables of FRL, ELL, and race/ethnicity entered simultaneously along with
the interaction terms. Results indicated that ORF predicted reading comprehension
equally well on the FCAT and SAT-10. The authors stated that “[ORF] did an equally
good job of identifying at risk readers regardless of demographic characteristics” (p.359,
Roehrig et al., 2008).
A compilation of findings failed to provide a consistent answer to the question of
whether R-CBM is a biased predictor of reading performance or outcomes. In a recent
study, Hosp et al. (2011) provided additional support for the inconsistent pattern of bias
and discussed potential reasons for this inconsistency. Hosp et al. (2011) documented
some bias for each of the disaggregation categories required through NCLB
84
(economically disadvantaged, Limited English Proficiency, disability status, and
race/ethnicity) when using R-CBM to predict outcomes on the Utah state test. More bias
was found in first and second grades than in third grade. Hosp et al. concluded that the
pattern of bias in this study corresponded with the inconsistent patterns of bias in
previous studies. Various explanations were suggested for maintaining the inconsistent
pattern across studies including differences in outcomes measures, the
exclusion/inclusion of variables, and the type of instruction and intervention provided to
students in the sample (Hosp et al., 2011).
The existing contradictions in research behoove a closer examination of study
differences and procedures. For the purposes of the current research, interest was focused
on R-CBM as the predictor and state achievement tests as the outcome criteria. Hixson
and McGlinchey (2004), Roehrig et al. (2008), Wilson (2005), and Hosp et al. (2011) all
investigated R-CBM as a predictor of performance on state achievement tests - in
Michigan, Florida, Arizona, and Utah, respectively. Results of the four studies differed.
Roehrig et al. (2008) found no evidence of bias as a function of ethnicity, eligibility for
FRL, or ELL status using logistic regression for the analysis; Wilson reported bias as a
function of the same categories, yet supplied no information on the analyses; Hixson and
McGlinchey cited conflicting results based on methodology (multiple regression versus
step-wise regression) when investigating bias as a function of ethnicity and eligibility for
FRL; Hosp et al. found some evidence of bias based on FRL eligibility, ELL and
disability status, and ethnicity with more evidence of bias in first and second grades than
in third grade. Just as the methodologies differed among studies, so did the R-CBM
passages. Roehrig et al., Wilson, and Hosp et al. used DIBELS ORF to conduct R-CBM
85
for third graders; thus, the passage sets employed should be identical. On the other hand,
Hixson and McGlinchey developed R-CBM probes from a basal reading series for fourth
grade students. Methodology may impact results of predictive bias analyses, and R-CBM
characteristics may generate differences. Evidently, better-defined research is required
for the continuing evaluation of the utility of R-CBM for predicting performance on
future criteria, specifically on state reading tests.
Current Study
The objective of the current study was to determine the efficacy of R-CBM as a
predictor of performance on a state reading test. The first goal was to examine the
predictive value of an R-CBM, in particular DIBELS ORF, for performance on the
Georgia state reading test, the CRCT. DIBELS ORF data on grades second through fifth
from a school district was used to generate cut scores and evaluate diagnostic efficiency
for predicting success or failure on the CRCT. Furthermore, these cut scores were
compared to generic cut scores suggested by DIBELS as standards for achieving reading
proficiency. A small body of research suggested that the relationship between R-CBM
scores and state reading test scores varies by state test and population; thus, cut scores for
predicting state reading test outcomes also may vary. No study has evaluated the CRCT,
and few have included states in the southeastern region (Barger, 2003; Buck & Torgesen,
2003; Roehrig et al., 2008).
The second goal of this study was to ascertain whether R-CBM scores
differentially predict performance on a criterion as a function of subgroup membership.
Although the psychometric soundness of R-CBM is well established, few studies
investigated the issue of predictive bias. The current study used DIBELS ORF scores to

86
investigate bias as a function of ethnicity, eligibility for FRL, and ELL status and to
determine whether separate regression lines for each subgroup are necessary to validly
predict performance on the CRCT. The knowledge gained from the present study not
only directly served the school district of interest, but also catered to the broadening
application of R-CBM in the schools.
Briefly the goals of the present study were to
1) generate ORF cut scores using district data to predict success on the CRCT,
2) compare the diagnostic efficiency of the generated ORF cut scores with
DIBELS ORF benchmarks, and
3) evaluate the generated ORF cut scores for evidence of predictive bias based on
FRL eligibility, ELL status, and ethnicity.
Method
Participants
The data for this study were collected in a rural public school district in northeast
Georgia. The district supplied data on 1,598 second through fifth grade students enrolled
during the 2008-2009 school year. Only cases with all three scores – beginning-year
ORF, mid-year ORF, and spring CRCT – were included in the analyses, resulting in a
final sample size of 1,374 students. The majority of cases were lacking data due to out-
of-district placements or late entry. Demographics of the final sample were compared to
the original sample using chi square tests. The demographic composition of the final
sample did not differ significantly from the composition of the initial sample.
Demographics of the final sample are reported in Table 5. The sample was comprised of
60% economically disadvantaged students and 2.5% ELL. The designation of

87
“economically disadvantaged” was based on qualifying for FRL. The ELL category
included those who have been identified as either in need of English language services
due to Limited English Proficiency or as being monitored for the potential need for
services due to prior status as Limited English Proficient. It should be noted that this
category does not include all students who may speak a language other than English in
the home. Racial/ethnic composition of the sample was 82.2% White, 7.8% Black, 5.4%
Hispanic, and 4.1% Multiracial, and 0.4% Asian. The demographics of the final sample
were similar to the district-wide (elementary, middle, and high schools) percentages
reported for the 2007-2008 school year – 51% economically disadvantaged, 2% ELL,
83% White, 10% Black, 4% Hispanic, and 3% Multiracial (Georgia Department of
Education [DOE], 2008a).
Table 5
Demographics of the Sample by Percentages
Race ELL FRL White 82.2 Not ELL 97.5 Not FRL 40.0 Black 7.8 ELL 2.5 FRL 60.0 Hispanic 5.4 Multiracial 4.1 Asian 0.4
Note. N = 1374. ELL = English language learner; FRL = Free or reduced lunch. Measures
Dynamic Indicators of Basic Early Literacy Skills Oral Reading Fluency
(DIBELS ORF). ORF is a type of R-CBM published by DIBELS measuring accuracy
and fluency with connected text (Good, et al., 2002). Students read aloud for 1 minute
from a leveled passage, and the score is calculated as the number of words read correctly
in a minute (WRC). Omitted words, substitutions, and hesitations for more than 3
88
seconds are considered errors and do not contribute to the WRC. Word additions are
ignored. If a student self-corrects within 3 seconds, the word is considered accurate
(Good et al., 2001). The median score of three passages is typically used to examine
student performance for benchmarking and progress monitoring and is used in statistical
analyses. Passages and norms are provided by DIBELS for two benchmark assessments
in first grade and three benchmark assessments in second through sixth grades (See Table
4). Information about the development and generation of DIBELS ORF benchmarks is
available for the three-times-per-year assessment schedule (Good et al., 2002). Likewise,
information about the development and readability of the first through third grade
passages has been published (Good & Kaminski, 2002). In a recent review of
psychometric evidence, reliability evidence for ORF was considered robust with
consistency across examiners, forms, and time periods (Goffreda & DiPerna, 2010).
Concurrent validity evidence for ORF was moderate to high across studies included in
the review.
Criterion-Referenced Competency Tests (CRCT). The CRCT is the criterion-
referenced assessment used by the state of Georgia to measure student achievement of
state academic standards (i.e., Georgia Performance Standards). It is designed to provide
information at the state, district, school, and individual levels. The CRCT is administered
in the spring in grades one through eight. All grades are assessed in Reading,
English/Language Arts, and Mathematics. In addition, grades 3 through 8 are assessed in
Science and Social Studies.
This study utilized scores from the Reading CRCT. The Reading Content
Domains for each grade are as follows (Georgia DOE, 2007): Vocabulary and

89
Comprehension (Grades 1 and 2); Reading Skills and Vocabulary Acquisition, Literary
Comprehension, Reading for Information (Grade 3); and, Reading Skills and Vocabulary
Acquisition, Literary Comprehension, Information and Media Literacy (Grades 4-8). For
grades 1 and 2, the Reading CRCT is read aloud, including all passages, questions, and
answer choices. For grades 3 through 8, only directions are read aloud to the students; no
test content may be read to students. Students are asked to read passages and answer
multiple-choice questions.
Scores on the CRCT are stated as scale scores and can range from 650 to 900
(Georgia DOE, 2009a). Student performance on the Reading CRCT is evaluated using a
three-level scoring rubric (Georgia DOE, 2009b). Scores at or above 850 (Level 3) are
indicative of a level of performance that “Exceeds Expectations” set for the test. Scores
from 800 - 849 (Level 2) indicate a level of performance that “Meets Expectations” set
for the test. Scores below 800 (Level 1) correspond with a level of performance that
“Does Not Meet Expectations” set for the test.
Information on test development, validity, and reliability is available by request
from the Georgia DOE (Georgia DOE, 2008b). All items and test forms were field tested
and examined based on distributions and potential bias. Studies of external validity
comparing the CRCT to other commonly used instruments (e.g., Iowa Test of Basic
Skills) have been conducted by the Georgia DOE. Reported reliability coefficients in
terms of Cronbach’s alpha for the CRCT range from .87 to .93; Reading CRCT reliability
coefficients for grades 1 through 5 range from .89 to .90.
90
Procedures
ORF benchmarking was conducted as part of district-wide testing. Second
through fifth grade students were assessed with ORF at three time points throughout the
school year – beginning, middle, and end. ORF was administered and scored according to
standardized procedures. The median score from each assessment point was recorded and
used in analyses (Good et al., 2001). The school used the results of the ORF
benchmarking to inform instruction and aid decision making regarding supplemental
services. The CRCT was administered during the second and third week of April in 2009.
Testing was conducted school wide according to standardized procedures delineated in
the Test Examiner’s Manual (Georgia DOE, 2009c). Given that the CRCT was
administered prior to the final ORF assessment, only the beginning and mid year
assessments could be used for predicting CRCT outcomes.
Data Analysis
Data analysis was conducted in several steps. First, data were screened for outliers
and the fit between distributions and the parameters of analysis. This was done separately
for the logistic regression as well as for the linear regression as these analyses subscribe
to different analytic assumptions. Descriptive statistics of the sample, including grade
level means of ORF and CRCT and correlations among beginning ORF, mid ORF, and
CRCT scores were calculated. The second step in the data analytic process was to
examine the ability of ORF scores to predict CRCT performance in the current sample
using logistic regression. Based on these findings, ROC curves were used to generate
sample-specific cut scores for each grade and examine their diagnostic properties. The
third step was to evaluate DIBELS benchmarks with the current sample and compare
91
their diagnostic properties to those of the sample-specific cut scores generated in the
second step. The fourth and final step in the data analysis was to examine the sample-
specific cut scores and DIBELS benchmarks for evidence of predictive bias. These steps
are described in more detail below. Due to the grade-based specificity of the two
measures, all analyses were conducted separately for each grade. That is, CRCT and ORF
were developed and standardized by grade; thus, scores cannot be compared
meaningfully across grades.
Generating and evaluating sample-specific cut scores and DIBELS cut
scores. In order to generate sample-specific cut scores using ORF beginning- and mid-
year assessments, this study followed the recommendations and procedures outlined by
Hintze and Silberglitt (2005; Silberglitt & Hintze, 2005). A combination of logistic
regression and ROC curve analysis were used to analyze the data.
Logistic regression is a procedure that estimates, using maximum likelihood
estimation, the probability (0% to 100%) of membership in a certain group (i.e., the
categories of the dependent variable; Hintze & Silberglitt, 2005). Because the goal of
logistic regression is to maximize the correct classification, this procedure is well fitted to
the current goals. However, due to the flexibility of ROC curve analysis, namely its
ability to maximize the negative predictive power, a combination of these two methods is
the preferred for generating the final cut scores (Silberglitt & Hintze, 2005).
Logistic regression was used to determine whether the independent measure,
ORF, possessed enough diagnostic accuracy to be functional. Using logistic regression,
preliminary levels of sensitivity and specificity were set that were later used as the ad hoc
decision rules in the ROC curve analysis. The dependent variable in the logistic

92
regression was the categorical variable of CRCT results – either “Meets or Exceeds
Expectations” or “Does Not Meet Expectations.” The independent variable was the
continuous variable of ORF scores.
Subsequent to logistic regression, a series of ROC curves were generated to explore
diagnostic accuracy of ORF over a range of cut scores. An advantage of ROC curve
analysis is that the user can develop different cut scores for different assessment
decisions (Hintze & Silberglitt, 2005). For example, a screening decision may not need as
stringent criteria for diagnostic efficiency as a classification decision. To generate these
curves, sensitivity (i.e., true positives) was plotted against 1 - specificity (i.e., true
negatives) resulting in a curve. ROC curves were analyzed according to decision rules
specified in Silberglitt and Hintze (2005). That is, scores at each assessment point were
examined to determine the score(s) that yielded specificity and sensitivity levels of at
least 0.7. Next, sensitivity was increased incrementally while still maintaining the
specificity level. The goal was to maximize sensitivity without compromising specificity.
In addition, cut scores were evaluated based on their respective levels of selected indices
- sensitivity, specificity, predictive power, overall classification (hit rate), Kappa, and
Phi. These indices were also used to evaluate the performance of the DIBELS
benchmarks in the current sample.
Diagnostic indices must be interpreted based on what the defined outcome of
interest is. In the current study, the outcome of interest, or “positive” outcome, was
failing the CRCT. The indices are defined here based on how they were applied in the
current study. Sensitivity is the proportion of the students who failed the CRCT who were
predicted to fail (i.e., obtained ORF scores less than the cutoff). Specificity is the

93
proportion of students who passed the CRCT who were predicted to pass. Predictive
power refers the to the proportion of those labeled by the ORF score as failing or passing
the test who actually failed (PPP) or passed (NPP) the test. The overall correct
classification or hit rate is the proportion of correct decisions. A problem with this index
is that it does not correct for chance agreement. Kappa is a widely used statistic that
circumvents this shortcoming of overall classification rate by correcting for chance
agreement. A final index, the Phi Coefficient, is a derivation of Pearson’s r used for
dichotomous data and provides another measure of effect size. Both Kappa and Phi range
from 0 to 1 with greater values indicating a stronger association.
An important issue to address with this study was the prevalence or base rate of
the outcome of interest (Streiner, 2003). The CRCT is not designed to have a base failure
rate of 50%; it is assumed that a lower percentage will fail. In other words, there is a low
prevalence of failing the CRCT. In this current sample, 92.2% passed the CRCT (7.8%
failed). It was necessary to account for this high passing rate when calculating and
evaluating diagnostic accuracy indices so as not to have inflated percentages. Predictive
power and overall classification rate, in particular, are affected by prevalence rates
(Streiner, 2003). Unavoidably, PPP drops as prevalence drops. On the other hand, NPP
will be high when prevalence is low.
Analysis of predictive bias. In order to establish that the predictions functioned
similarly for all populations of interest, an analysis of predictive bias was conducted. The
analyses were based on similar ones described in Betts et al. (2006). Initially, a series of
linear regression analyses were used to model mid-year ORF scores as the predictor and
CRCT scale scores as the outcome. For each grade, separate models were run for ORF

94
scores, and standardized residuals were computed for each student. Using independent-
samples t-tests, the difference in residuals for each of the independent variables was
examined. If there was a significant difference in the standardized residuals, then it was
concluded that predictive bias was evidenced. Subsequently, predictive bias was
examined while statistically controlling for FRL status. Given that a disproportionate
number of ethnic minorities and ELL students come from low-income backgrounds,
evidence of bias for one of these groups could be confounded by the FRL variable (Betts
et al., 2008). Results of this analysis indicated whether CRCT outcomes differed as a
function of ethnicity or ELL status when looking at students of similar SES groupings.
Follow up analyses investigating the change in ORF scores from beginning to mid
year assessment were conducted using repeated-measures analysis of variance (RM-
ANOVA). Results of these analyses indicated whether growth in ORF was similar across
groups based on ELL status, ethnic minority status, and FRL eligibility.
Results
Data Screening
An examination of the scatterplot of the data indicated that the relationship
between ORF scores and CRCT scores was linear. Distributions of beginning and mid
ORF and CRCT scores at each grade level did not violate the assumption that scores were
distributed normally. Distributions were examined for values of skewness and kurtosis,
and all values fell between -0.6 and 0.6, with the one exception being beginning ORF for
second grade (skewness = 0.73). Score ranges for ORF were large with potential floor
effects in Grade 2. That is, scores of zero were present at both beginning- and mid-year
measurements.

95
As the two methods of analysis utilized in this study required different
assumptions to ensure the suitability of the data, the data were screened separately for the
logistic regression and linear regression. For the logistic regression analyses, used for the
preliminary steps in generating cut scores, data were screened for outliers and unusual
points by looking for influential and high-leverage cases. Large values for standardized
residuals (> 3) and Cook’s distance (> 1) were found for several cases in each grade; the
majority of these cases were CRCT failures. Removing these cases from subsequent
analyses would reduce the already limited number of CRCT failures thereby affecting the
power of the analyses and the generalization of results. Thus, outliers were retained for
all logistic regression analyses.
Data were also examined for unusual points and adherence to statistical
assumptions for the analyses used in determining predictive bias. When using linear
regression, the relationship between the two variables must be linear, the errors in
prediction independent, the variances equal, and the residuals normally distributed. All of
these assumptions were upheld in each of the datasets. Some indication of unusual and
high-leverage points were found in Grades 2, 3, and 4 as indicated by large residuals (>
3), large values of Cook’s D (close to 1) and high leverage (based on DfBeta statistics).
Three cases were removed in Grade 2, one case in Grade 3, and six cases in Grade 4. All
cases were retained in Grade 5.
Descriptive Statistics
Means, standard deviations, and spread of scores by grade for ORF assessments
and the CRCT are listed in Table 6. Results indicated that the mean score for the CRCT
at each grade was in the upper range of the “Meets Expectations” level of performance.

96
Grade 2 had the highest mean CRCT score (M = 848), which was just short of the
“Exceeds Expectations” level of performance. Mean ORF scores increased within grades
and across grades. Base rates of failure varied by grade with the lowest rates in Grade 2
and the highest rates in Grade 4. In Grade 2, 4.5% of students failed the CRCT (95.5%
passed); in Grade 3, 8.7% of students failed (91.3% passed); in Grade 4, 11.7% failed
(88.3% passed); in Grade 5, 6.3% failed (93.7% passed). Pearson correlations between
the beginning and mid ORF measurements were very strong ranging from .91 to .95. This
finding indicated that ORF scores at the beginning of the year were highly predictive of
ORF scores part way through the year. Furthermore, this finding communicated that
students were not making many changes in relative rank over the course of the year.
Pearson correlations between ORF and CRCT scores ranged from .54 (Grade 2 beginning
ORF) and .72 (Grade 3 mid ORF). These results showed that ORF performance was
highly predictive of CRCT performance. Correlations among the measures are displayed
in Table 7.

97
Table 6 Descriptive Statistics of the Sample
Range
M SD Min Max Grade 2 (n = 357) CRCT 848.31 32.79 770 920 Beg ORF 56.13 29.07 0 140 Mid ORF 89.83 34.69 0 191
Grade 3 (n = 357) CRCT 834.73 27.62 755 920 Beg ORF 84.27 33.64 9 187 Mid ORF 103.38 37.52 9 207
Grade 4 (n = 342) CRCT 832.81 28.90 759 920 Beg ORF 93.10 35.45 4 205 Mid ORF 114.99 38.75 4 236
Grade 5 (n = 318) CRCT 831.93 22.61 776 895 Beg ORF 116.39 38.72 4 213
Mid ORF 125.54 37.85 9 237
Note. N = 1374. CRCT = Criterion Referenced Competency Test
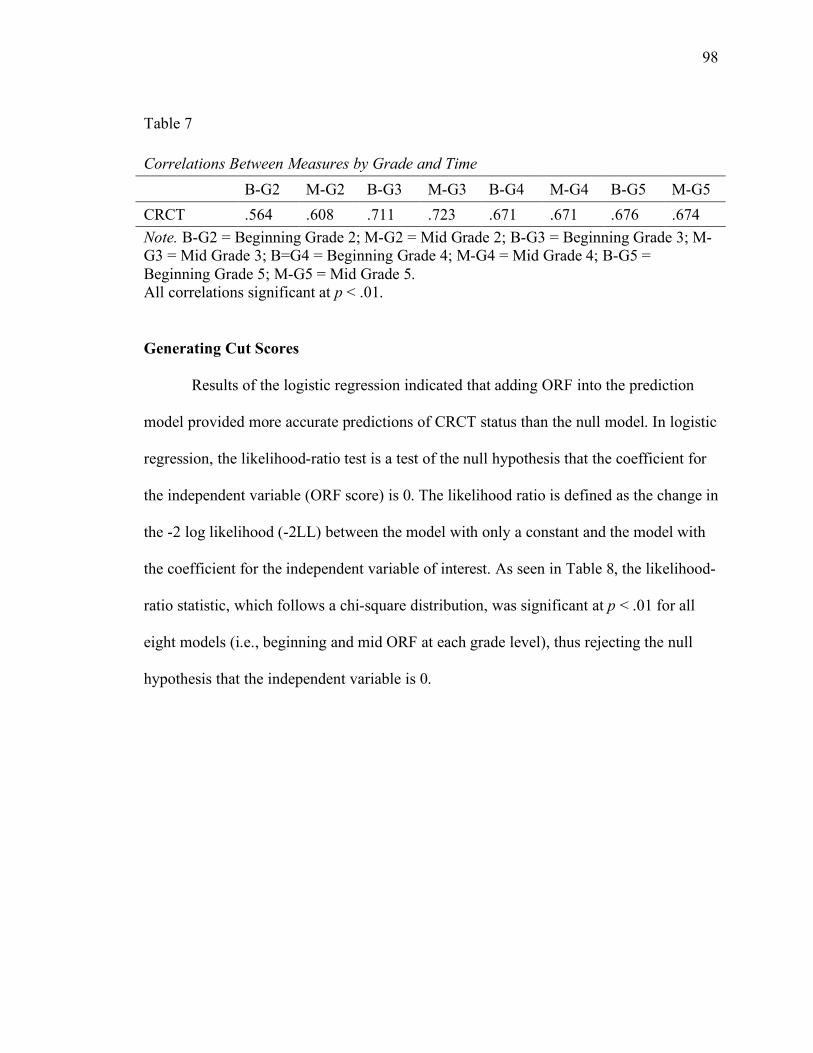
98
Table 7
Correlations Between Measures by Grade and Time B-G2 M-G2 B-G3 M-G3 B-G4 M-G4 B-G5 M-G5 CRCT .564 .608 .711 .723 .671 .671 .676 .674 Note. B-G2 = Beginning Grade 2; M-G2 = Mid Grade 2; B-G3 = Beginning Grade 3; M-G3 = Mid Grade 3; B=G4 = Beginning Grade 4; M-G4 = Mid Grade 4; B-G5 = Beginning Grade 5; M-G5 = Mid Grade 5. All correlations significant at p < .01.
Generating Cut Scores
Results of the logistic regression indicated that adding ORF into the prediction
model provided more accurate predictions of CRCT status than the null model. In logistic
regression, the likelihood-ratio test is a test of the null hypothesis that the coefficient for
the independent variable (ORF score) is 0. The likelihood ratio is defined as the change in
the -2 log likelihood (-2LL) between the model with only a constant and the model with
the coefficient for the independent variable of interest. As seen in Table 8, the likelihood-
ratio statistic, which follows a chi-square distribution, was significant at p < .01 for all
eight models (i.e., beginning and mid ORF at each grade level), thus rejecting the null
hypothesis that the independent variable is 0.
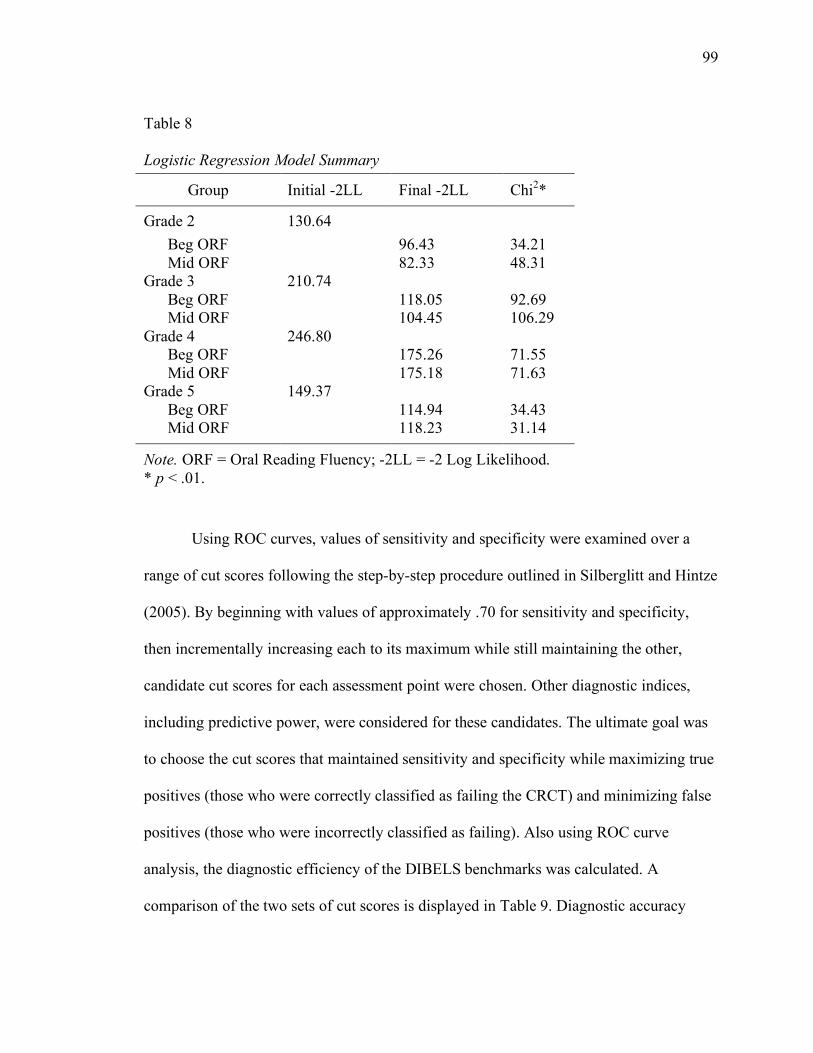
99
Table 8 Logistic Regression Model Summary
Group Initial -2LL Final -2LL Chi2*
Grade 2 130.64 Beg ORF 96.43 34.21 Mid ORF 82.33 48.31
Grade 3 210.74 Beg ORF 118.05 92.69 Mid ORF 104.45 106.29
Grade 4 246.80 Beg ORF 175.26 71.55 Mid ORF 175.18 71.63
Grade 5 149.37 Beg ORF 114.94 34.43 Mid ORF 118.23 31.14
Note. ORF = Oral Reading Fluency; -2LL = -2 Log Likelihood. * p < .01.
Using ROC curves, values of sensitivity and specificity were examined over a
range of cut scores following the step-by-step procedure outlined in Silberglitt and Hintze
(2005). By beginning with values of approximately .70 for sensitivity and specificity,
then incrementally increasing each to its maximum while still maintaining the other,
candidate cut scores for each assessment point were chosen. Other diagnostic indices,
including predictive power, were considered for these candidates. The ultimate goal was
to choose the cut scores that maintained sensitivity and specificity while maximizing true
positives (those who were correctly classified as failing the CRCT) and minimizing false
positives (those who were incorrectly classified as failing). Also using ROC curve
analysis, the diagnostic efficiency of the DIBELS benchmarks was calculated. A
comparison of the two sets of cut scores is displayed in Table 9. Diagnostic accuracy

100
statistics for the DIBELS benchmarks and sample-specific cut scores are reported in
Tables 10 and 11, respectively.
Table 9 Comparison of Sample-Specific Cut Scores and DIBELS Benchmarks
Group Sample-specific cut scores DIBELS BM
Grade 2 Beg ORF 34 44 Mid ORF 59 68
Grade 3 Beg ORF 49 77 Mid ORF 64 92
Grade 4 Beg ORF 67 93 Mid ORF 93 105
Grade 5 Beg ORF 100 104 Mid ORF 114 115
Note. BM = benchmark
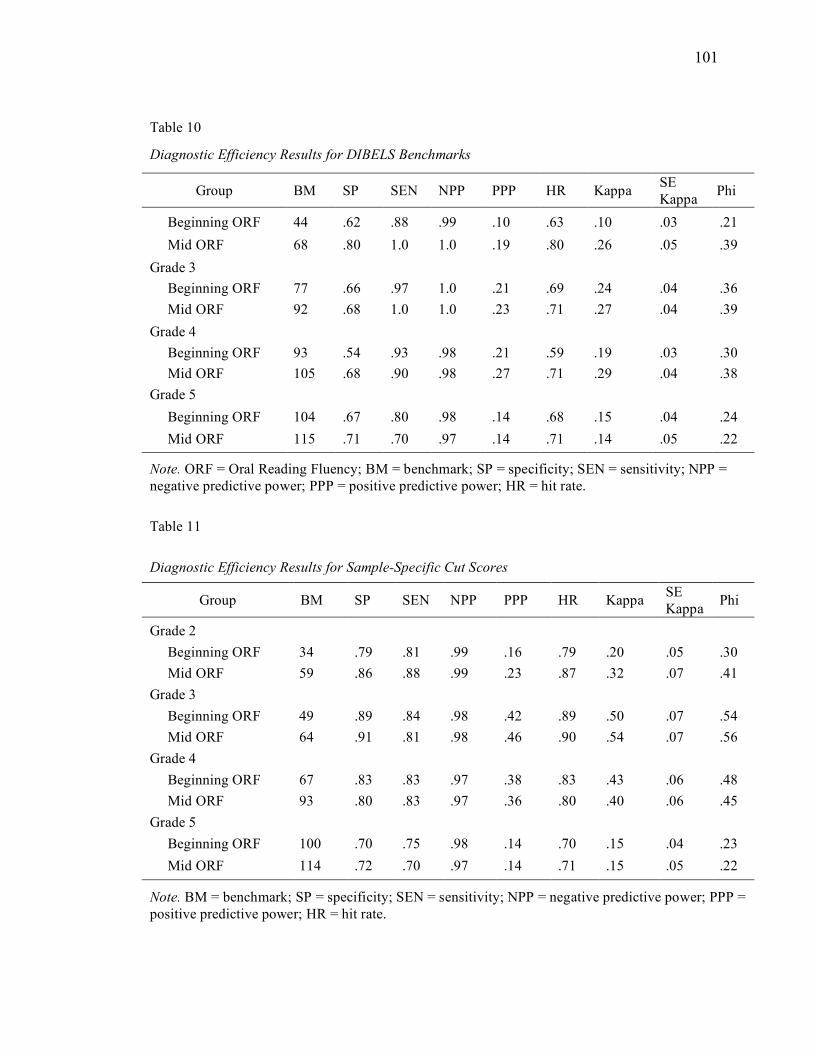
101
Table 10
Diagnostic Efficiency Results for DIBELS Benchmarks
Group BM SP SEN NPP PPP HR Kappa SE Kappa Phi
Beginning ORF 44 .62 .88 .99 .10 .63 .10 .03 .21 Mid ORF 68 .80 1.0 1.0 .19 .80 .26 .05 .39
Grade 3 Beginning ORF 77 .66 .97 1.0 .21 .69 .24 .04 .36 Mid ORF 92 .68 1.0 1.0 .23 .71 .27 .04 .39
Grade 4 Beginning ORF 93 .54 .93 .98 .21 .59 .19 .03 .30 Mid ORF 105 .68 .90 .98 .27 .71 .29 .04 .38
Grade 5 Beginning ORF 104 .67 .80 .98 .14 .68 .15 .04 .24 Mid ORF 115 .71 .70 .97 .14 .71 .14 .05 .22
Note. ORF = Oral Reading Fluency; BM = benchmark; SP = specificity; SEN = sensitivity; NPP = negative predictive power; PPP = positive predictive power; HR = hit rate.
Table 11
Diagnostic Efficiency Results for Sample-Specific Cut Scores
Group BM SP SEN NPP PPP HR Kappa SE Kappa Phi
Grade 2 Beginning ORF 34 .79 .81 .99 .16 .79 .20 .05 .30 Mid ORF 59 .86 .88 .99 .23 .87 .32 .07 .41
Grade 3 Beginning ORF 49 .89 .84 .98 .42 .89 .50 .07 .54 Mid ORF 64 .91 .81 .98 .46 .90 .54 .07 .56
Grade 4 Beginning ORF 67 .83 .83 .97 .38 .83 .43 .06 .48 Mid ORF 93 .80 .83 .97 .36 .80 .40 .06 .45
Grade 5 Beginning ORF 100 .70 .75 .98 .14 .70 .15 .04 .23 Mid ORF 114 .72 .70 .97 .14 .71 .15 .05 .22
Note. BM = benchmark; SP = specificity; SEN = sensitivity; NPP = negative predictive power; PPP = positive predictive power; HR = hit rate.

102
Overall, cut scores generated for this sample had moderate to high levels of
sensitivity and specificity, high NPP, and low to mid PPP. As expected, Kappa, which
corrects for chance agreement, was much lower than the hit rate. The sample-specific cut
scores tended to be much lower than the low risk DIBELS benchmarks, usually falling in
between DIBELS “low risk” and “at risk” benchmarks. Compared to the DIBELS
benchmarks, sample-specific cut scores on average had higher specificity, lower
sensitivity, higher PPP, and greater overall classification rates and values of Kappa and
Phi. In addition, sample-specific cut scores had fewer false positives (incorrectly
predicted to fail) and slightly more false negatives (incorrectly predicted to pass). As
expected, due to prevalence rates, in both sets of cut scores NPP was consistently high
whereas PPP was much lower.
Performance of DIBELS benchmarks across grades. DIBELS “low risk”
benchmarks had a high average value of sensitivity (.90) but ranged widely by grade (.7
to 1.0). Specificity averaged .67 yet was especially low for the Grade 2 and Grade 4
beginning ORF (.62 and .54, respectively). NPP was high (97.2% to 100%) whereas PPP
was very low ranging from just short of 10% (beginning Grade 2) to 27% (mid Grade 4).
Overall correct classification rates ranged from 59% for beginning Grade 4 and 80% for
mid Grade 2. Kappa was much lower than the overall classification rates, ranging from
.10 to .29, due to the correction for chance agreement. The Phi Coefficient, used as a
measure of effect size, ranged from .21 to .39. In general, diagnostic efficiency was
slightly better for the predictions of the mid ORF benchmarks compared to the beginning
ORF benchmarks as seen by the greater overall classification rates, Kappa and Phi
values, and higher PPP.
103
Performance of the sample-specific cut scores across grades. When the cut
scores were recalibrated to fit this study’s sample, specificity was better, with an average
of .81 and a range of .70 to .91. Sensitivity averaged .81 with a range of .70 to .88. NPP
remained high with values from .97 to .99. PPP ranged from 14% to 46%. Values for
Grades 2 and 5 were 14% and 23%, respectively, whereas the values for Grades 3 and 4
approached more acceptable levels at 36% and 46%. On average, 81% of students were
correctly classified using the recalibrated cut scores. The lowest percentages were found
in Grade 5 with a hit rate of 70% to 71%. Kappa ranged from .15 to .54 and Phi from .22
to .56, both greatly improved from the DIBELS benchmarks. Grades 3 and 4 exhibited
the greatest improvements, reaching values equivalent to moderate effects sizes.
The beginning and mid cut scores generated for the Grade 2 sample fell in
between the “low risk” and “at risk” DIBELS benchmarks. The cut scores of 34 for
beginning ORF and 59 for mid ORF functioned best for the Grade 2 sample, generating
high values on all diagnostic indices except for PPP, which was similar to that of the
DIBELS benchmarks. In Grade 3, the sample-specific cut scores were lower than the “at
risk” DIBELS benchmarks. Cut scores of 49 and 64 for beginning and mid ORF
generated high values on all diagnostic indices except for PPP. Although PPP was still
low compared to other indices due to prevalence rate, the values for the Grade 3 sample-
specific cut scores were adequate at 41.9% for beginning ORF and 46.3% for mid ORF.
The cut score of 67 for Grade 4 beginning ORF was lower than the “at risk” DIBELS
benchmark, whereas the mid ORF cut score of 93 was in between the two levels of risk
for the DIBELS benchmark. These cut scores of 67 and 93 had high values of sensitivity,
specificity, and NPP. PPP was 38.4% and 35.5% for beginning and mid scores,

104
respectively. For Grade 5, the sample-specific cut scores were essentially equivalent to
the “low risk” DIBELS benchmarks with scores of 100 for beginning ORF (ORF
benchmark = 104) and 114 for mid ORF (ORF benchmark = 115). Values of sensitivity,
specificity, and PPP were lower than those of the other grades.
Predictive Bias
The goal of these analyses was to ascertain whether a single predictive equation
was sufficient to predict CRCT scale scores for all students regardless of status in certain
demographic categories. Comparisons of the standardized residuals revealed no
significant differences based on ELL status at any grade; thus, predictions from a
common regression equation did not differ significantly for students based on ELL status.
In Grade 2, significant differences in the standardized residuals were seen based on FRL
eligibility, t (352) = 4.56, p < .000, and ethnic minority status, t (352) = 3.61, p < .001. In
Grade 3, significant differences in the standardized residuals were seen based on FRL
eligibility, t (354) = 2.76, p = .006, and ethnic minority status, t (354) = 2.678, p = .006.
In Grade 4, significant differences in the standardized residuals were seen based only on
FRL eligibility, t (334) = 2.58, p = .01. The differences based on ethnic minority status
were not at an acceptable level of significance, t (334) = 1.79, p = .074. In Grade 5,
significant differences in the standardized residuals were seen based on FRL eligibility, t
(316) = 4.75, p = .000, and ethnic minority status, t (316) = 1.90, p = .058.
The next step of analysis was to compare standardized residuals by ethnic
minority status while controlling for FRL eligibility. Results indicated that in Grades 4
and 5, ethnic minority status was no longer significant when controlling for FRL
eligibility. In contrast, in Grades 2 and 3, the difference between the standardized
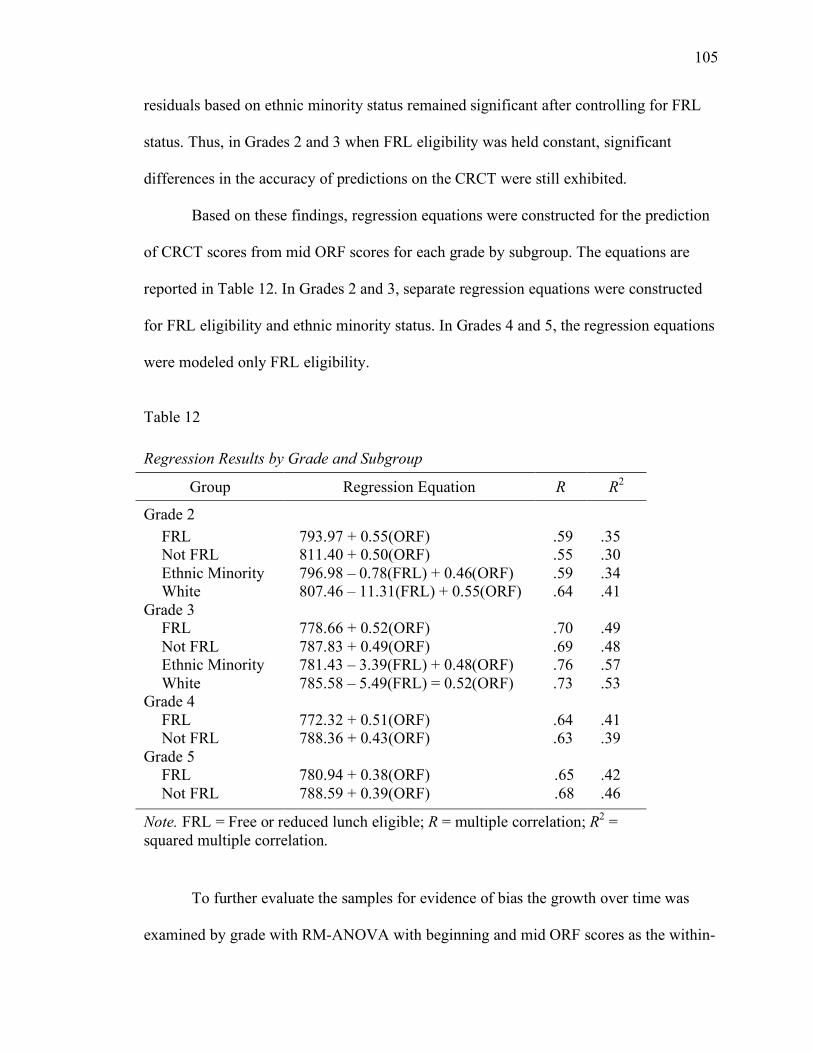
105
residuals based on ethnic minority status remained significant after controlling for FRL
status. Thus, in Grades 2 and 3 when FRL eligibility was held constant, significant
differences in the accuracy of predictions on the CRCT were still exhibited.
Based on these findings, regression equations were constructed for the prediction
of CRCT scores from mid ORF scores for each grade by subgroup. The equations are
reported in Table 12. In Grades 2 and 3, separate regression equations were constructed
for FRL eligibility and ethnic minority status. In Grades 4 and 5, the regression equations
were modeled only FRL eligibility.
Table 12 Regression Results by Grade and Subgroup
Group Regression Equation R R2
Grade 2 FRL 793.97 + 0.55(ORF) .59 .35 Not FRL 811.40 + 0.50(ORF) .55 .30 Ethnic Minority 796.98 – 0.78(FRL) + 0.46(ORF) .59 .34 White 807.46 – 11.31(FRL) + 0.55(ORF) .64 .41
Grade 3 FRL 778.66 + 0.52(ORF) .70 .49 Not FRL 787.83 + 0.49(ORF) .69 .48 Ethnic Minority 781.43 – 3.39(FRL) + 0.48(ORF) .76 .57 White 785.58 – 5.49(FRL) = 0.52(ORF) .73 .53
Grade 4 FRL 772.32 + 0.51(ORF) .64 .41 Not FRL 788.36 + 0.43(ORF) .63 .39
Grade 5 FRL 780.94 + 0.38(ORF) .65 .42 Not FRL 788.59 + 0.39(ORF) .68 .46
Note. FRL = Free or reduced lunch eligible; R = multiple correlation; R2 = squared multiple correlation.
To further evaluate the samples for evidence of bias the growth over time was
examined by grade with RM-ANOVA with beginning and mid ORF scores as the within-

106
subjects factor and FRL eligibility, ethnic minority status, and ELL status as the between-
subjects factors. For all grades, the within-subjects time factor was significant, indicating
that the overall mean of the difference between beginning and mid ORF scores was
significantly different from zero, Grade 2 Pillai’s Trace = 0.322, Wilks’ = 0.678, F
(1,351) = 166.80, p < .001; Grade 3 Pillai’s Trace = 0.232, Wilks’ = 0.768, F (1,352) =
106.11, p < .001; Grade 4 Pillai’s Trace = 0.142, Wilks’ = 0.858, F (1,336) = 55.52, p <
.001; Grade 5 Pillai’s Trace = 0.093, Wilks’ = 0.907, F (1,313) = 31.98, p < .001. These
findings suggested that ORF was sensitive to change in reading skills over time. In
Grades 3 and 4 no other within-subjects factors were significant, which demonstrated that
growth in ORF was similar across groups based on ELL status, ethnic minority status,
and FRL eligibility in Grades 3 and 4. In Grades 2 and 5, some differences in growth
were found.
In Grade 2, the time by FRL eligibility factor was significant, Wilks’ = 0.989, F
(1,351) = 3.910, p = .049. These data showed that the mean growth over time was
different based on FRL eligibility. Follow up analyses revealed greater growth by
approximately 5 WRC for students not eligible for FRL as compared to students eligible
for FRL, t (355) = 3.44, p = .001. The three-way interaction among time, ethnic minority
status, and FRL eligibility was significant, Wilks’ = 0.987, F (1,351) = 4.746, p = .030.
These data indicated that the mean growth over time differed based on an individual’s
combination of FRL eligibility and ethnic minority status. Follow up analyses showed
that ethnic minorities not eligible for FRL (n = 8) displayed greater rates of growth than
White students not eligible for FRL (n = 131). The mean difference was approximately
10 WRC, t (137) = -2.12, p = .036. Rates of growth were similar between ethnic

107
minorities and White students who were eligible for FRL. No other factors were
significant, which indicated that mean growth over time did not differ by ethnic minority
status, ELL status, or the remaining interactions.
In Grade 5, the time by ELL status factor was significant, Wilks’ = 0.979, F
(1,313) = 6.566, p = .011. These data showed that the mean growth over time was
different based on ELL status. Follow up analysis revealed that ELL status was
associated with greater growth. The small sample of ELL in Grade 5 (n = 5) exhibited
mean growth of 26 WRC from the beginning to mid measurements whereas the mean
growth for non-ELL was 8 WRC, t (316) = -2.56, p = .011. No other factors were
significant, which indicated that growth was constant across ethnic minority status and
FRL eligibility, as well as the interactions of these variables.
The results of the RM-ANOVA suggested differences in the slope parameter (the
growth in ORF over time) based on group membership in Grade 2 (based on FRL
eligibility and the interaction of FRL eligibility and ethnic minority status) and in Grade 5
(based on ELL status). The findings were supported by similar pattern of covariances
across the time points and groups as indicated by nonsignificant values (p > .10) of Box’s
M at each grade, Grade 2 Box’s M = 16.87, F (12,4293) = 1.33; Grade 3 Box’s M =
11.46, F (12,4086) = .90; Grade 4 Box’s M = 12.21, F (12,1057) = 0.92; Grade 5 Box’s
M = 12.35, F (12,1470) = 0.93.
The data described above documented the likelihood of predictive bias based on
group membership when using ORF scores to predict scores on the CRCT. Results of
regression analyses at all grades revealed that a common predictive equation would result
in consistent overprediction of CRCT scores for students eligible for FRL. Furthermore,
108
in Grades 2 and 3, a common predictive equation would consistently overpredict scores
based on ethnic minority status even while controlling for FRL eligibility. In addition, the
growth differences evidenced in Grades 2 and 5 supported the existence of predictive bias
with respect to the slope parameter. Follow up analyses revealed differences in ORF
growth from fall to winter for students in Grade 2 based on FRL eligibility and the
combination of ethnic minority status and FRL eligibility, as well as for students in Grade
5 based on ELL status.
Discussion
The use of data to inform decision-making has found a prominent role in the
current milieu of educational practices. R-CBM is a common method of generating data
and is used in an ever-expanding way to inform instruction. With the increased use of
high-stakes, standardized testing in the last decade, school districts have been interested
in using R-CBM data as an early indication of future testing outcomes. The purpose of
the current study was to examine the relationship between DIBELS ORF and reading
achievement on the Georgia state test through diagnostic accuracy and predictive bias.
Results indicated that the commonly used benchmarks suggested by DIBELS may not be
the best predictors of outcomes on the Georgia state test, and separate predictions may be
warranted based on membership in certain subgroups. These findings have implications
for school districts and states that use R-CBM as a tool for early intervention.
Relationship between ORF and the CRCT
The correlations among beginning ORF, mid ORF, and CRCT scores were
moderate to high. Specifically, beginning and mid ORF scores were highly correlated
with each other, indicating consistency within the grade level between fall and winter
109
assessments. Correlations between ORF scores and CRCT scores were moderate to large
and consistent with previous findings (Yeo, 2009). Correlations between second grade
ORF and the CRCT were the lowest out of the four grade levels, whereas correlations
were the largest in the third grade. The magnitude of these associations corresponded to
the range established by studies examining the relationship of R-CBM with other state
tests, including Florida (Buck & Torgesen, 2003; Roehrig et al., 2008), North Carolina
(Barger, 2003), Pennsylvania (Keller-Margulis et al., 2008), Arizona (Wilson, 2005),
Colorado (Shaw & Shaw, 2002; Wood, 2006), Michigan (McGlinchey & Hixson, 2004),
Oregon (Crawford et al., 2001), and Illinois (Sibley et al., 2001). The consistency of these
findings is impressive considering the variability among studies. For instance, within this
list researchers employed different outcome measures, had various timings of assessment
(e.g., fall, spring, winter), and made predictions both within year (e.g., fall to spring) and
across years (e.g., spring of second grade to spring of third grade).
Analysis of Cut Scores
The current study sought to extend the body of research examining the predictive
relationship between oral reading and state reading achievement tests. Initially, the
commonly used benchmarks suggested by DIBELS were used as cut scores, and,
subsequently, cut scores specific to the study’s sample were generated. As evidenced in
the current study and supportive of previous findings, the DIBELS benchmarks had
variable levels of diagnostic accuracy, and the diagnostic accuracy of the ORF scores
were improved by generating sample-specific cut scores.
With this sample of students, the ORF benchmarks functioned well on some
indexes of diagnostic accuracy but were unacceptable on others. The proportion of
110
students in this sample who failed the CRCT who were predicted to fail according to the
DIBELS benchmarks (i.e., sensitivity) was acceptable but ranged widely. In addition,
almost all students scoring at or above the low risk DIBELS benchmarks passed the
CRCT (i.e., NPP). This measure indicated that the benchmarks were not missing many
students who needed to be identified for supplemental services. In contrast to the
acceptable levels of sensitivity and NPP, the values of specificity and PPP were lower
than desired. The high number of students who scored below the DIBELS low risk
benchmark and still passed the CRCT (i.e., false positives) deflated the specificity in this
sample. The PPP, or the proportion of those scoring below the DIBELS benchmark that
actually fail the CRCT, was very low. This measure was greatly affected by the low
prevalence of failing the CRCT and, correspondingly, was especially low in second and
fifth grades where fewer students failed the CRCT. The consequence of low specificity
and PPP is the high likelihood for providing services to students who are not in need of
services to assist them in passing the CRCT. Similar to the low levels of specificity, hit
rates were unacceptably low in the beginning of fourth grade and the beginning of second
grade; in these grades just over half of the students were classified correctly when using
ORF benchmarks as the standard.
Guided by procedures in previous studies (Hintze & Silberglitt, 2005; Silberglitt
& Hintze, 2005), cut scores were generated for the sample using logistic regression and
ROC curves. With this sample of students, DIBELS benchmarks were generally higher
than the recalibrated cut scores. The recalibrated cut scores for second, third, and fourth
grades were either between the “low risk” and “at risk” DIBELS benchmarks or similar
to the “at risk” benchmarks. The exception was the fifth grade recalibrated cut scores,

111
which were practically the same as the “low risk” DIBELS benchmarks. Regarding
diagnostic accuracy, recalibrated cut scores boasted more acceptable levels of diagnostic
accuracy than the DIBELS benchmarks. Overall, specificity was better, and sensitivity
was lower than the DIBELS benchmarks but still within the acceptable range. NPP was
very high and similar to levels found with the DIBELS benchmarks. PPP was improved
over the DIBELS benchmarks yet still quite low in second and fifth grades. The range of
values found in this study was similar to those found in Roehrig et al. (2008) with the
Florida state test and Keller-Margulis et al. (2008) with the Pennsylvania state test. The
overall classification rate, Kappa values, and Phi Coefficients were improved with the
recalibrated cut scores, especially in third and fourth grades. In sum, the recalibrated cut
scores resulted in more students placed in the correct category based on ORF scores and
fewer students identified by the ORF scores as in-need-of-services who actually passed
the CRCT.
A more detailed comparison of the recalibrated cut scores with the DIBELS
benchmarks reveals differences that vary by grade. For second grade, the recalibrated cut
scores (beginning = 34, mid = 59) fell between the “low risk” (beginning = 44, mid = 68)
and “at risk” (beginning = 26, mid = 52) DIBELS benchmarks. They were similar to cut
scores generated using logistic regression in Hintze and Silberglitt’s (2005) study
predicting performance on the Minnesota state test. For the third grade, the recalibrated
cut scores (beginning = 49, mid = 64) were lower than both the “low risk” (beginning =
77, mid = 92) and the “at risk” (beginning = 52, mid = 67) DIBELS benchmarks. These
scores were lower than scores generated using the Florida (Roehrig et al., 2008) and
Minnesota (Silberglitt & Hintze, 2005) state tests. Similar to second grade, the

112
recalibrated fourth grade cut scores (beginning = 67, mid = 93) were lower than the “low
risk” DIBELS benchmarks (beginning = 93, mid = 105). The beginning fourth grade
recalibrated score was similar to the “at risk” beginning benchmark (71); the mid fourth
grade recalibrated score was slightly higher than the “at risk” mid benchmark (83). The
fourth grade cut scores generated in this study were lower than those generated for
predicting performance on Washington’s state test (Stage & Jacobsen, 2001). In contrast
to the lower scores at second, third, and fourth grades, the recalibrated cut scores for fifth
grade were practically identical to the “low risk” DIBELS benchmarks. Notably, the
diagnostic accuracy of the fifth grade recalibrated cut scores was the poorest of the all the
grades. The chosen cut scores maximized the diagnostic indexes, yet specificity and
sensitivity were at minimally-acceptably levels and PPP remained low.
Predictive Bias
If R-CBM is to be utilized as a predictive tool, the potential for bias must be
understood. The current study examined the relationship between the ORF scores and
scores on the CRCT using linear regression. Predictive bias was defined as a difference in
prediction based on membership in a group such that implementing a single regression
line for predictive purposes would result in systematic errors in prediction (Betts et al.,
2008; Reynolds et al., 1999). Previous studies have found bias based on gender (in fifth
grade; Kranzler et al, 1999), ethnicity (African Americans in fourth and fifth grade;
Hixson & McGlinchey, 2004; Kranzler et al., 1999), socioeconomic status (in fourth
grade; Hixson & McGlinchey, 2004), home language (in second grade; Betts et al., 2006)
and the interaction of home language and ethnicity (in third grade; Klein & Jimerson,
2005). Comparisons with previous studies of predictive bias must be made cautiously as
113
methodology, sample, and criterion measures differ across studies (Hosp et al., 2011).
The current study resembled studies conducted by Hixson and McGlinchey (2004),
Roehrig et al. (2008), Wilson (2005), and Hosp et al. (2011) in that R-CBM scores were
used to predict outcomes on state tests; yet, it differed from these studies in methodology.
The methodology used in this study was similar to that of Betts et al. (2006). Results
indicated that the CRCT score predictions made for students who were eligible for FRL
were consistently too high. Conversely, the predictions made for students who were not
eligible for FRL were consistently too low. Differences in predictions were also seen
based on ethnicity for second, third, and fifth grade. In fifth grade, these differences were
accounted for by eligibility for FRL; however, in second and third grade, the predicted
CRCT scores of ethnic minorities were too high even when comparing these predictions
to other students of similar FRL eligibility.
Growth of ORF from fall to winter also exhibited inconsistent patterns across
groups in Grades 2 and 5. In Grade 2, a difference in growth of 5 WRC between students
eligible for FRL and student not eligible for FRL may not present as a large practical
difference alone; however, when considering that students eligible for FRL scored almost
12 WRC lower than students not eligible for FRL at the beginning ORF measurement,
the setback of the slower growth rate becomes a more serious issue. The greater growth
seen for the ELL sample in Grade 5, as well as the greater growth by ethnic minorities
eligible for FRL in Grade 2, warranted consideration, but results lacked generalization
due to the small sample sizes of these groups. ORF growth rates have received attention
in the literature with several studies documenting non-linear growth across the school
year. Patterns of growth were inconsistent across studies with evidence of both greater
114
growth in the fall to winter interval compared to the winter to spring interval (Ardoin &
Christ, 2008), as well as the opposite trend (Graney, Missall, Martinez, & Bergstrom,
2009). More research is needed to investigate how growth rates may differ across grade
and by group in order to inform instructional practices and decision-making ability.
Conclusions and Implications
The results presented in this study have implications for the use of R-CBM for
predicting test outcomes, the use of DIBELS benchmarks for predicting test outcomes,
and the use of statistical procedures to set cut scores for predicting test outcomes. In
addition, the results have specific implications for the state of Georgia, as well as other
districts and states that are similar in terms of population and state test performance.
Several limitations in the study design and details existed. First, the district in
which data were collected was actively using DIBELS ORF in combination with other
student data to determine the need for support services throughout the school year.
Students who failed the CRCT in reading the previous year were identified as in need of
additional services, usually provided in the form of the federally funded Early
Intervention Program (EIP). In addition to those who failed the CRCT, an additional 3%
of students were allowed in the EIP classes. These were usually students struggling in
reading or math as evidenced by low scores on the CRCT and low scores on DIBELS
measures. Students who did not make sufficient progress in the EIP class and continued
to evidence low scores on DIBELS were provided with additional support services
usually in the form of small group or individual intervention targeted to the specific area
of weakness. Both the allocation of services to at risk students and the use of DIBELS
scores as a part of the determination of these services were confounds to the predictive

115
validity; however, the alternative – not providing services to students in need – would
raise ethical concerns (Vander Meer et al., 2005). This limitation is likely present in
many studies conducted in schools as most schools provide extra assistance in some
regard to struggling students whose status is determined by some combination of grades,
curriculum based assessment, achievement testing, etc.
Other limitations were related to generalizability and sample characteristics. As is
the case with any study, generalizability must be limited to samples similar in terms of
demographics and test performance. Further, the small sample size of certain subgroup
(i.e., students failing the CRCT, ELL) made it difficult find significant results. In
addition, a small percentage of the district special education population was excluded
from testing due to severe cognitive limitations. Any conclusions drawn are not
representative of students with these limitations. Conclusions are also limited by the use
of only students who had beginning and mid ORF scores, as well as CRCT scores. If
students transferred within the district, they were retained for analyses; however, students
who transferred out of the district mid year or who entered the district mid year were not
included in the study. It was possible that these students were in some way different from
the population included in the study; thus, conclusions were not representative of the
entire school population.
Certain limitations must be considered before applying the findings regarding
predictive bias. When conducting an analysis of bias on the predictions of R-CBM, one
must also question whether the criterion measure itself (i.e., the CRCT) is biased (Klein
& Jimerson, 2005). CRCT developers claim that all test forms and items were examined
for evidence of bias, but this possibility deserves to be entertained. If the CRCT were a

116
biased assessment, then the predictions of R-CBM would be inherently flawed. This is a
consideration that future researchers should investigate more closely. Another limitation
was that the variables used to represent economic disadvantage and ethnic minority status
were both dichotomous and limited. Eligibility for FRL is often used as an indicator of
economic disadvantage for educational research because it is readily available to
researchers, but it is not a very sensitive measure. If a more sensitive indicator were used,
then this variable may have accounted for more variation in the residuals, thus reducing
the contribution of the ethnic minority variable even further, possibly to nonsignificance
(Hintze et al., 2002; Hixson & McGlinchey, 2004). The ethnic minority variable itself
was not very sensitive either. The ethnic minority group was a diverse group of students,
compiled of students who identify as African American, Hispanic, Multiracial, and
Asian. Due to sample sizes, these groups were combined to form a general classification
of ethnic minority. Although race/ethnicity is often included in psychological and
educational research, research indicates that the differences within ethnic groups often
surpass those found between groups. The individuals within an ethnic group differ based
on social and cultural factors including acculturation, strength of identity with the group,
and perception of society’s attitude toward the group, among others (Phinney, 1996).
Thus, the ethnic minority variable potentially is confounded by the diversity of the group
such that the any differences based on this variable cannot be explained by the variable
itself but rather by the myriad factors encompassed by this variable.
Despite these limitations, important conclusions can be drawn from this study. A
basic finding from this study that supports all existing accounts is that R-CBM assesses
the basic reading skills that are encapsulated in statewide achievement testing for reading
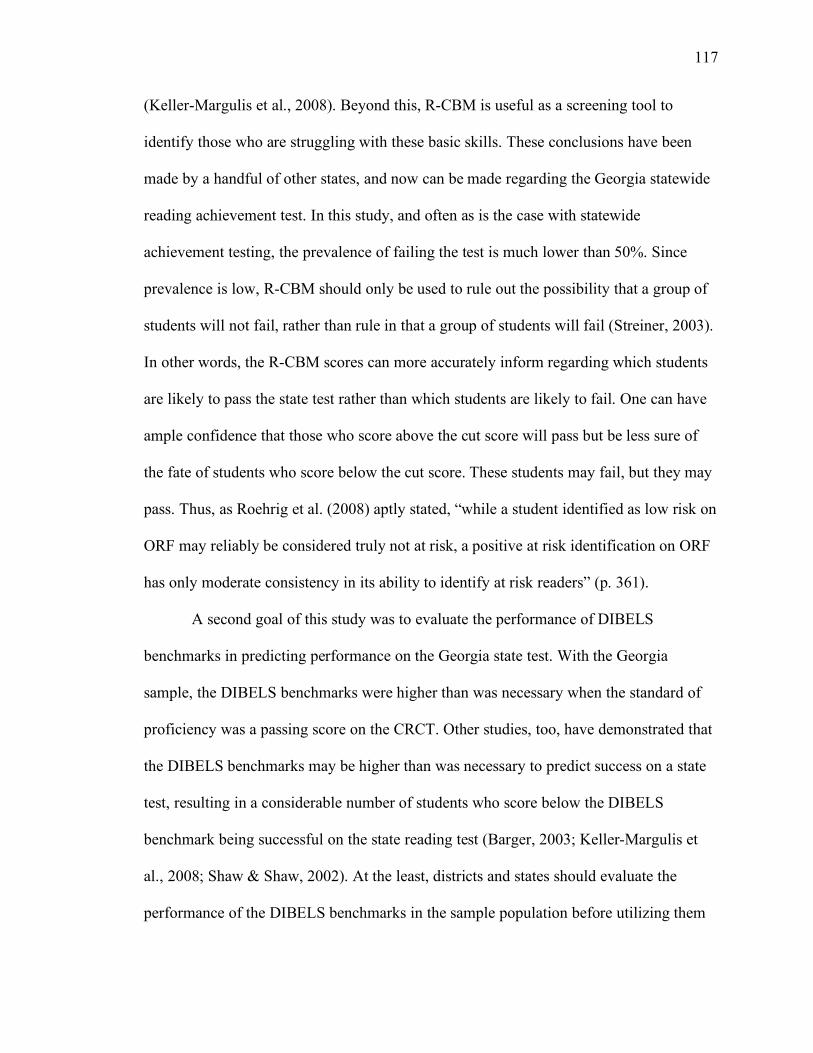
117
(Keller-Margulis et al., 2008). Beyond this, R-CBM is useful as a screening tool to
identify those who are struggling with these basic skills. These conclusions have been
made by a handful of other states, and now can be made regarding the Georgia statewide
reading achievement test. In this study, and often as is the case with statewide
achievement testing, the prevalence of failing the test is much lower than 50%. Since
prevalence is low, R-CBM should only be used to rule out the possibility that a group of
students will not fail, rather than rule in that a group of students will fail (Streiner, 2003).
In other words, the R-CBM scores can more accurately inform regarding which students
are likely to pass the state test rather than which students are likely to fail. One can have
ample confidence that those who score above the cut score will pass but be less sure of
the fate of students who score below the cut score. These students may fail, but they may
pass. Thus, as Roehrig et al. (2008) aptly stated, “while a student identified as low risk on
ORF may reliably be considered truly not at risk, a positive at risk identification on ORF
has only moderate consistency in its ability to identify at risk readers” (p. 361).
A second goal of this study was to evaluate the performance of DIBELS
benchmarks in predicting performance on the Georgia state test. With the Georgia
sample, the DIBELS benchmarks were higher than was necessary when the standard of
proficiency was a passing score on the CRCT. Other studies, too, have demonstrated that
the DIBELS benchmarks may be higher than was necessary to predict success on a state
test, resulting in a considerable number of students who score below the DIBELS
benchmark being successful on the state reading test (Barger, 2003; Keller-Margulis et
al., 2008; Shaw & Shaw, 2002). At the least, districts and states should evaluate the
performance of the DIBELS benchmarks in the sample population before utilizing them

118
for screening, classification, or allocation of services. When benchmarks are too high for
the population in question, as is the case in this sample, the consequences are minor in
scope. More students than should be necessary may receive services, which could be
considering “wasting” services and funds that could be used elsewhere. In contrast, when
benchmarks are too low for the population in question, the repercussions are more
problematic. If the DIBELS benchmarks are too low, students who are in danger of
failing the state test may miss out on support services that would increase their chances of
passing.
Generating cut scores specific to the Georgia sample population was another aim
of this study. Best practices are to establish local, district, and state norms in order to
provide the most accurate predictions and highest levels of diagnostic accuracy for the
specified predictive purpose. In doing this, the unique characteristics of the student
population, as well as the unique make up for the state test, are taken into consideration
(Roehrig et al., 2008). Regarding the statistical procedures, ROC curves allow for
maximum flexibility in setting benchmarks, yet simultaneously introduce a level of
subjectivity since the ultimate determination of the cut scores is dependent on the
researcher (Hintze & Silberglitt, 2005; Silberglitt & Hintze, 2005; Keller-Margulis et al.,
2008). As suggested by Hintze and Silberglitt (2005) the combination of logistic
regression and ROC curves slightly alleviates this subjectivity. For states where
performance on the state test is tied to high-stakes outcomes at certain grades, the
flexibility provided by ROC curves is helpful. For instance, if students in a certain grade
are required to pass the state test in order to be promoted in that subject area, the

119
benchmarks for that grade could be more stringent than the benchmarks at other grades
where promotion is not dependent on the state test scores.
The cut scores generated for this sample were, on average, much lower than the
“low risk” DIBELS benchmarks with the exception of fifth grade. This is an indication
that students in second, third, and fourth grades in Georgia do not need to exhibit oral
reading rates that are commensurate with the standards specified by DIBELS or other
researchers (Hasbrouck & Tindal, 1992) in order to pass the Georgia state test. These
findings indicate that if the outcome of interest is passing the Georgia state test, then this
county could lower the benchmarks to better focus support services on those students
who have greater chances of failing the test.
An essential consideration at this point is whether passing the state test is
ultimately the standard of proficiency to which students should be held. Roehrig et al.
(2008) addressed this issue by clarifying that the cut scores generated for a sample of
students function only as well as the cut scores on the outcome measure function. That is,
if the outcome measure, which in this example is the CRCT, is a poor standard of
proficiency, then the oral reading cut scores are no better. Predicting success on a test that
is not an adequate standard of success is a useless prediction. In the current study,
students in second, third, and fourth grades had oral reading rates much lower than the
rates commonly cited as indicative of likely achievement of proficiency in reading, yet
these students still were able to pass the CRCT. This finding speaks to the quality and
stringency of state tests. Schools in Georgia may be better suited to maintain the DIBELS
benchmarks or similar standards as criteria for supplying support services because,

120
regardless of whether these students are on track to pass the state test, these students may
not be on track to achieving a minimum standard of reading proficiency.
Notably, this issue has been documented elsewhere in the literature. Wanzek et al.
(2010) examined the predictive validity of ORF across first through third grades and
concluded that students needed a low level of fluency to pass the Texas state test, the
Texas Assessment of Knowledge and Skills (TAKS). In contrast, students had to exhibit
more than twice as much growth in ORF to have a high probability of being proficient on
the SAT-10 (Harcourt Brace, 2003). Wanzek et al. (2010) proposed the TAKS was more
appropriately considered a minimum standard rather than an indication of a high
likelihood of achieving future reading proficiency. Based on the results of a national
survey comparing proficiency on state tests and proficiency on the National Assessment
of Educational Progress (NAEP), the discrepancy between reported proficiency levels on
the CRCT and the NAEP was very large (Peterson & Hess, 2005). Georgia was one of
the worst offenders out of the 40 reporting states. This finding suggests that the level of
difficulty of the Georgia state test is much lower than that of the NAEP. Consequently,
although Georgia can claim high percentages of proficiency on the state test, this claim
lacks weight when compared to the much lower percentages of proficiency on the NAEP.
The final goal of the study was to examine the data for evidence of predictive
bias. Alone, the evidence of predictive bias cannot provide firm conclusions, but, in
compilation with the existing research on bias and R-CBM, the current study is an
important contribution. A clear implication is that when using R-CBM to make
predictions, its performance in the population in question must be evaluated for evidence
of bias. As in the current study, if bias is found, several options may be considered. When
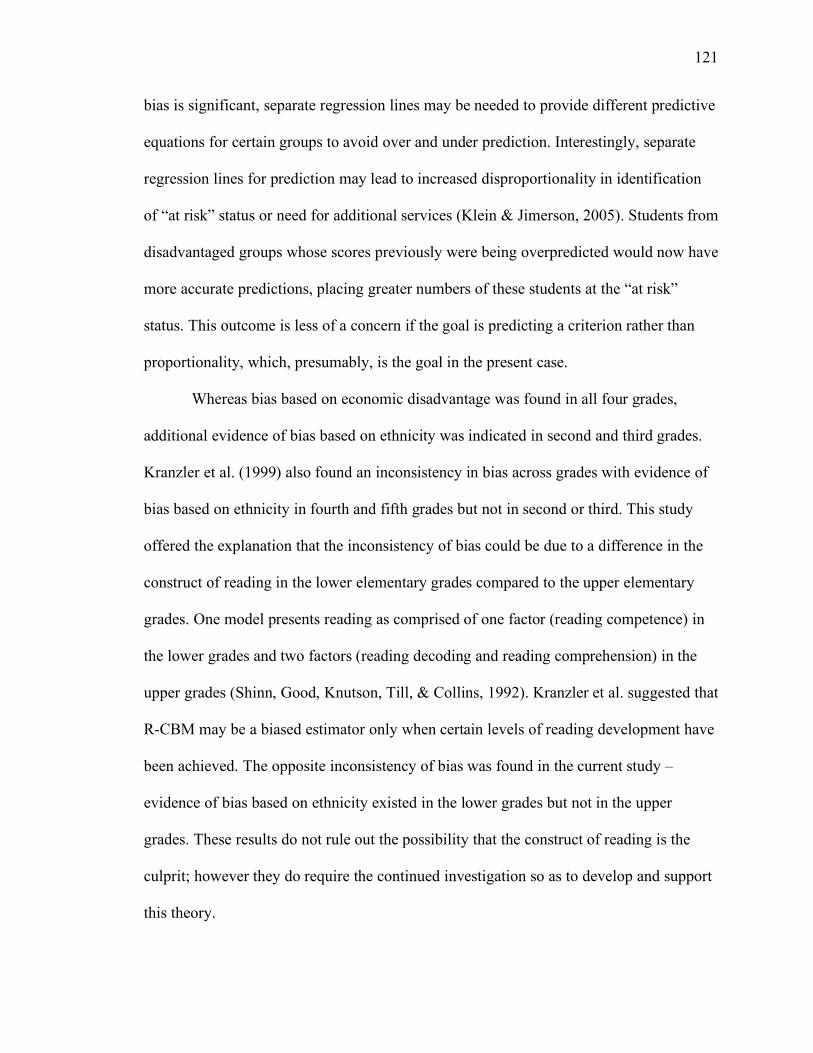
121
bias is significant, separate regression lines may be needed to provide different predictive
equations for certain groups to avoid over and under prediction. Interestingly, separate
regression lines for prediction may lead to increased disproportionality in identification
of “at risk” status or need for additional services (Klein & Jimerson, 2005). Students from
disadvantaged groups whose scores previously were being overpredicted would now have
more accurate predictions, placing greater numbers of these students at the “at risk”
status. This outcome is less of a concern if the goal is predicting a criterion rather than
proportionality, which, presumably, is the goal in the present case.
Whereas bias based on economic disadvantage was found in all four grades,
additional evidence of bias based on ethnicity was indicated in second and third grades.
Kranzler et al. (1999) also found an inconsistency in bias across grades with evidence of
bias based on ethnicity in fourth and fifth grades but not in second or third. This study
offered the explanation that the inconsistency of bias could be due to a difference in the
construct of reading in the lower elementary grades compared to the upper elementary
grades. One model presents reading as comprised of one factor (reading competence) in
the lower grades and two factors (reading decoding and reading comprehension) in the
upper grades (Shinn, Good, Knutson, Till, & Collins, 1992). Kranzler et al. suggested that
R-CBM may be a biased estimator only when certain levels of reading development have
been achieved. The opposite inconsistency of bias was found in the current study –
evidence of bias based on ethnicity existed in the lower grades but not in the upper
grades. These results do not rule out the possibility that the construct of reading is the
culprit; however they do require the continued investigation so as to develop and support
this theory.
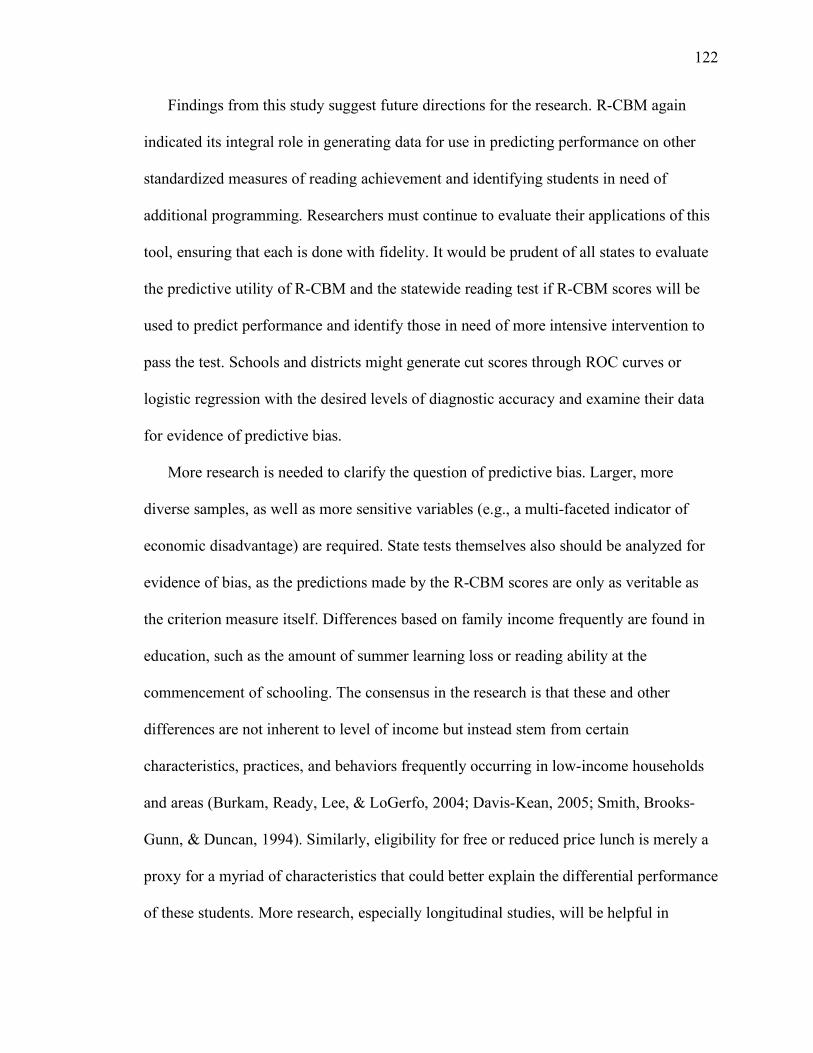
122
Findings from this study suggest future directions for the research. R-CBM again
indicated its integral role in generating data for use in predicting performance on other
standardized measures of reading achievement and identifying students in need of
additional programming. Researchers must continue to evaluate their applications of this
tool, ensuring that each is done with fidelity. It would be prudent of all states to evaluate
the predictive utility of R-CBM and the statewide reading test if R-CBM scores will be
used to predict performance and identify those in need of more intensive intervention to
pass the test. Schools and districts might generate cut scores through ROC curves or
logistic regression with the desired levels of diagnostic accuracy and examine their data
for evidence of predictive bias.
More research is needed to clarify the question of predictive bias. Larger, more
diverse samples, as well as more sensitive variables (e.g., a multi-faceted indicator of
economic disadvantage) are required. State tests themselves also should be analyzed for
evidence of bias, as the predictions made by the R-CBM scores are only as veritable as
the criterion measure itself. Differences based on family income frequently are found in
education, such as the amount of summer learning loss or reading ability at the
commencement of schooling. The consensus in the research is that these and other
differences are not inherent to level of income but instead stem from certain
characteristics, practices, and behaviors frequently occurring in low-income households
and areas (Burkam, Ready, Lee, & LoGerfo, 2004; Davis-Kean, 2005; Smith, Brooks-
Gunn, & Duncan, 1994). Similarly, eligibility for free or reduced price lunch is merely a
proxy for a myriad of characteristics that could better explain the differential performance
of these students. More research, especially longitudinal studies, will be helpful in

123
determining the variables that are responsible for the differences and, ultimately, in
developing interventions to enact change.
In this era of emphasis on state achievement and adequate yearly progress, it is
imperative that we, as educators, administrators, school psychologists, and policy makers,
not lose sight of what should be the fundamental objective. We must strive to foster
students’ success while in school and to prepare for success when finished with school.
Integral to this objective is teaching students to become competent and confident readers.
By using data to inform instruction and identify the need for intervention, this goal can be
achieved in more schools with greater percentages of students. R-CBM is a versatile tool
for assessment that complements existing mandated statewide testing and fosters a
successful system of intervention and prevention.

124
References
Allinder, R. M., Bolling, R., Oats, R., & Gagnon, W. (1998). An analysis of alternative
means of measuring student achievement prior to a scheduled school break.
Special Services in the Schools, 14(1/2), 51-62.
Allinder, R. M. & Eccarius, M. A. (1999). Exploring the technical adequacy of
curriculum-based measurement in reading for children who use manually coded
English. Exceptional Children, 65, 271-283.
Allinder, R. M. & Fuchs, L. S. (1994). Alternative ways of analyzing effects of a short
school break on students with and without disabilities. School Psychology
Quarterly, 9(2), 145-160.
Ardoin, S. P. & Christ, T. J. (2008). Evaluating curriculum based measurement slope
estimate using data from tri-annual universal screenings. School Psychology
Review, 37, 109-125.
Ardoin, S. P. & Christ, T. J. (2009). Curriculum-based measurement of oral reading:
Standard errors associated with progress monitoring outcomes from DIBELS,
AIMSweb, and an experimental passage set. School Psychology Review, 38(2),
266-283.
Baker, S. K. & Good, R. (1995). Curriculum-based measurement of English reading with
bilingual Hispanic students: A validation study with second-grade students.
School Psychology Review,24(4), 561-578.
Barger, J. (2003). Comparing the DIBELS Oral Reading Fluency indicator and the North
Carolina end of grade reading assessment (Technical Report). Asheville, NC:
North Carolina Teacher Academy.

125
Betts, J., Muyskens, P., & Marston, D. (2006). Tracking the progress of students whose
first language is not English towards English proficiency: Using CBM with
English language learners. MinneTESOL/WITESOL Journal, 23, 15-37.
Betts, J., Reschly, A., Pickart, M., Heistad, D., Sheran, C., & Marston, D. (2008). An
examination of predictive bias for second grade reading outcomes from measures
of early literacy skills in kindergarten with respect to English-language learners
and ethnic subgroups. School Psychology Quarterly, 23(4), 553-570.
Buck, J. & Torgesen, J. (2003). The Relationship between performance on a measure of
oral reading fluency and performance on the Florida Comprehensive Assessment
Test (Tech. Rep. No. 1). Tallahassee, FL: Florida Center for Reading Research.
Burkam, D. T., Ready, D. D., Lee, V. E., & LoGerfo, L. F. (2004). Social-class
differences in summer learning between Kindergarten and first grade: Model
specification and estimation. Sociology of Education, 77(1), 1-31.
Busch, T. W. & Reschly, A. L. (2007). Progress monitoring in reading: Using
Curriculum-Based Measurement in a response-to-intervention model. Assessment
for Effective Intervention, 32, 223-230.
Christ, T. J. & Silberglitt, B. (2007). Estimates of the standard error of measurement for
curriculum-based measures of oral reading fluency. School Psychology Review,
36 (1), 130-146.
Crawford, L., Tindal, G., & Stieber, S. (2001). Using oral reading rate to predict student
performance on statewide achievement tests. Educational Assessment, 7(4), 303-
323.
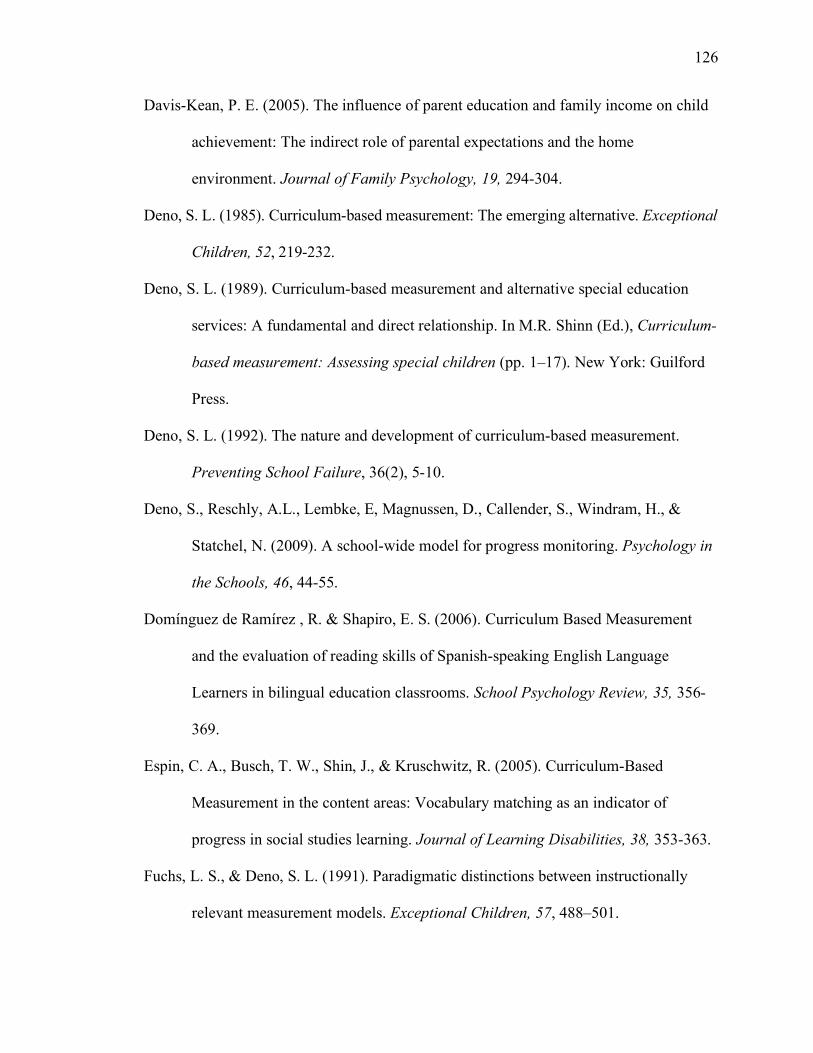
126
Davis-Kean, P. E. (2005). The influence of parent education and family income on child
achievement: The indirect role of parental expectations and the home
environment. Journal of Family Psychology, 19, 294-304.
Deno, S. L. (1985). Curriculum-based measurement: The emerging alternative. Exceptional
Children, 52, 219-232.
Deno, S. L. (1989). Curriculum-based measurement and alternative special education
services: A fundamental and direct relationship. In M.R. Shinn (Ed.), Curriculum-
based measurement: Assessing special children (pp. 1–17). New York: Guilford
Press.
Deno, S. L. (1992). The nature and development of curriculum-based measurement.
Preventing School Failure, 36(2), 5-10.
Deno, S., Reschly, A.L., Lembke, E, Magnussen, D., Callender, S., Windram, H., &
Statchel, N. (2009). A school-wide model for progress monitoring. Psychology in
the Schools, 46, 44-55.
Domínguez de Ramírez , R. & Shapiro, E. S. (2006). Curriculum Based Measurement
and the evaluation of reading skills of Spanish-speaking English Language
Learners in bilingual education classrooms. School Psychology Review, 35, 356-
369.
Espin, C. A., Busch, T. W., Shin, J., & Kruschwitz, R. (2005). Curriculum-Based
Measurement in the content areas: Vocabulary matching as an indicator of
progress in social studies learning. Journal of Learning Disabilities, 38, 353-363.
Fuchs, L. S., & Deno, S. L. (1991). Paradigmatic distinctions between instructionally
relevant measurement models. Exceptional Children, 57, 488–501.
127
Georgia Department of Education (2007). Georgia Criterion-Referenced Competency
Tests: Reading CRCT Content Descriptions.
Georgia Department of Education (2008a). 2007-2008 Report Card, Madison County.
Georgia Department of Education (2008b). Validity and Reliability of the 2008 Criterion-
Referenced Competency Tests. Assessment Research and Development Division
of the Georgia Department of Education.
Georgia Department of Education (2009a). 2009 Scale Scores and Cut Scores for the
Criterion-Referenced Competency Tests. Assessment Research and Development
Division of the Georgia Department of Education.
Georgia Department of Education (2009b). Georgia Criterion-Referenced Competency
Tests: Score Interpretation Guide, Grades 1 through 8.
Georgia Department of Education (2009c). Georgia Criterion-Referenced Competency
Tests: Test Examiner’s Manual.
Goffreda, C. T. & DiPerna, J. C. (2010). An empirical review of psychometric evidence
for the Dynamic Indicators of Basic Early Literacy Skills. School Psychology
Review, 39, 463-483.
Good, R. H. & Kaminski, R. A. (2002). DIBELSTM Oral Reading Fluency Passages for
First through Third Grades (Technical Report No.10). Eugene, OR: University of
Oregon.
Good, R. H., Simmons, D. C., & Kame’enui, E. J. (2001). The importance of decision-
making utility of a continuum of fluency-based indicators of foundational reading
skills for third grade high-stakes outcomes. Scientific Studies of Reading, 5, 257-
288.
128
Good, R. H., Simmons, D. C., Kame’enui, E. J., Kaminski, R. A., & Wallin, J. (2002).
Summary of decision rules for intensive, strategic, and benchmark instructional
recommendations in kindergarten through third grade. (Technical Report No.11).
Eugene, OR: University of Oregon.
Graney, S. B., Missall, K. N., Martinez, R. S., & Bergstrom, M. (2009). A preliminary
investigation of within-year growth patterns in reading and mathematics
curriculum-based measures. Journal of School Psychology, 47, 121-142.
Harcourt Brace (1997). Stanford Achievement Test (9th ed.). San Antonio, TX: Author.
Harcourt Brace (2003). Stanford Achievement Test (10th ed.). San Antonio, TX: Author.
Hasbrouck, J. E. & Tindal, G. (1992). Curriculum-based oral reading fluency norms for
students in grades 2 through 5. Teaching Exceptional Children,24 41-44.
Hintze, J. M., Callahan III, J. E., Matthews, W. J., Williams, S. A. S., & Tobin, K. G.
(2002). Oral reading fluency and prediction of reading comprehension in African
American and Caucasian elementary school children. School Psychology Review,
31(4), 540-553.
Hintze, J. M., Ryan, A. L., & Stoner, G. (2003). Concurrent validity and diagnostic
accuracy of the Dynamic Indicators of Basic Early Literacy Skills and the
Comprehensive Test of Phonological Processing, School Psychology Review, 32,
541-556.
Hintze, J. M. & Silberglitt, B. (2005). A longitudinal examination of the diagnostic
accuracy and predictive validity of R-CBM and high-stakes testing. School
Psychology Review, 34(3), 372-386.
129
Hixson, M. D. & McGlinchey, M. T. (2004). The relationship between race, income, and
oral reading fluency and performance on two reading comprehension measures.
Journal of Psychoeducational Assessment, 22, 351-364.
Hosp, J. L., Hosp, M. A., & Dole, J. K. (2011). Potential bias in predictive validity of
universal screening measures across disaggregation subgroups. School
Psychology Review, 40, 108-131.
Kaminski, R. A. & Good, R. H. (1996). Towards a technology for assessing basic early
literacy skills. School Psychology Review, 25, 215-227.
Keller-Margulis, M. A., Shapiro, E. S., & Hintze, J. M. (2008). Long-term diagnostic
accuracy of curriculum-based measures in reading and mathematics. School
Psychology Review, 37(3), 374-390.
Klein, J. R. & Jimerson, S. R. (2005). Examining ethnic, gender, language, and
socioeconomic bias in oral reading fluency scores among Caucasian and Hispanic
students. School Psychology Quarterly, 20, 23-50.
Knoff, H. M. & Dean, K. R. (1994). Curriculum-based measurement of at-risk students'
reading skills: A preliminary investigation of bias. Psychological Reports, 75,
1355-1360.
Kranzler, J. H., Miller, M. D., Jordan, L. (1999). An examination of racial/ethnic and
gender bias on curriculum-based measurement of reading. School Psychology
Quarterly, 14 (3), 327-342.
McConnell, S. R., McEvoy, M. A., & Priest, J. S. (2002). ‘Growing’ measures for
monitoring progress in early childhood education: A research and development

130
process for individual growth and development indicators. Assessment for
Effective Intervention, 27, 3-14.
McGlinchey, M. T. & Hixson, M. D. (2004). Using curriculum-based measurement to
predict performance on state assessments in reading. School Psychology Review,
33(2), 193-203.
Morgan, S. K. & Bradley-Johnson, S. (1995). Technical adequacy of curriculum-based
measurement for Braille readers. School Psychology Review, 24, 94-103.
No Child Left Behind Act of 2001, Pub. L. No. 107-110, 115 Stat. 1425 (2002).
Northwest Evaluation Association. (2002). Northwest Achievement Levels Test. Lake
Oswego, OR: Northwest Evaluation Association.
Peterson, P. E. & Hess, F. M. (2005). Johnny can read…in some states: Assessing the
rigor of state assessment systems. Education Next, 5, 52-53.
Phinney, J. S. (1996). When we talk about American ethnic groups, what do we mean?
American Psychologist, 51, 918-927.
Reschly, A. L., Busch, T. W., Betts, J., Deno, S. L., & Long, J. (2009). Curriculum-Based
Measurement Oral Reading as an indicator of reading achievement: A meta-
analysis of the correlational evidence. Journal of School Psychology, 47, 427-469.
Reynolds, C. R., Lowe, P. A., & Saenz, A. L. (1999). The problem of bias in
psychological assessment. In C. R. Reynolds & T. B. Gutkin (Eds.), The
Handbook of School Psychology, Third Edition (pp. 549-595). New York: John
Wiley & Sons, Inc.
Roehrig, A., Petscher, Y., Nettles, S. M., Hudson, R. F., & Torgesen, J. K. (2008).
Accuracy of the DIBELS Oral Reading Fluency measure for predicting third
131
grade reading comprehension outcomes. Journal of School Psychology, 46, 343-
366.
Sandberg, K. L. & Reschly, A. L. (2011). English learners: Challenges in assessment and
the promise of curriculum-based measurement. Remedial and Special Education,
32(2), 144-154. doi: 10.1177/0741932510361260
Shapiro, E. S., Keller, M. A., Lutz, J. G., Santoro, L. E., & Hintze, J. M. (2006).
Curriculum-based measures and performance on state assessment and
standardized tests. Journal of Psychoeducational Assessment, 24 (1), 19-35.
Shaw, R. & Shaw, D. (2002). DIBELS Oral Reading Fluency-Based Indicators of Third
Grade Reading Skills for Colorado State Assessment Program (CSAP).
(Technical Report) Eugene, OR: University of Oregon.
Shinn, M. R. & Bamonto, S. (1998). Advanced applications of curriculum-based
measurement: “Big ideas” and avoiding confusion. In M. R. Shinn (Ed.),
Advanced Application of Curriculum-based Measurement (pp. 1-31). New York:
Guilford Press.
Shinn, M.R., Good, R.H., Knutson, N., Tilly, W.D., & Collins, V. (1992). Curriculum-
based measurement of oral reading fluency: A confirmatory analysis of its
relation to reading. School Psychology Review, 21, 459-479.
Sibley, D., Biwer, D., & Hesch, A. (2001). Establishing curriculum-based measurement
oral reading fluency performance standards to predict success on local and state
tests of reading achievement. Unpublished data. Arlington Heights, IL: AHSD 25.
Silberglitt, B. & Hintze, J. (2005). Formative assessment using CBM-R cut scores to
track progress towards success on state-mandated achievement tests: A
132
comparison of methods. Journal of Psychoeducational Assessment, 23 (4), 304-
325.
Sillberglitt, B., Burns, M. K., Madyun, N. H., & Lail, K. E. (2006). Relationship of
reading fluency assessment data with state accountability test scores: A
longitudinal comparison of grade levels. Psychology in the Schools, 43(5), 527-
535. doi: 10.1002/pits.20175
Smith, J. R., Brooks-Gunn, J., & Klebanov, P. K. (1997). Consequences of living in
poverty for young children’s cognitive and verbal ability and early school
achievement. In G. J. Duncan & J. Brooks-Gunn (Eds.), Consequences of growing
up poor (pp. 132–189). New York: Russell Sage Foundation.
Stage, S. A. & Jacobsen, M. D. (2001). Predicting student success on a state-mandated
performance-based assessment using oral reading fluency. School Psychology
Review, 30(3), 407-419.
Streiner, D. L. (2003). Diagnosing tests: Using and misusing diagnostic and screening
tests. Journal of Personality Assessment, 8(3), 209-219.
The Psychological Corporation (1993). Metropolitan Achievement Tests Seventh Edition.
San Antonio, TX: Author.
Vander Meer, C. D., Lentz, F. E., & Stollar, S. (2005). The relationship between oral
reading fluency and Ohio proficiency testing in reading (Technical Report).
Eugene, OR: University of Oregon.
Wallis, C. & Steptoe, S. (2007, May 24). How to fix No Child Left Behind. Time.
Retrieved from http://www.time.com/time/magazine/article/0,9171,1625192-
1,00.html
133
Wanzek, J., Roberts, G., Linan-Thompson, S., Vaughn, S., Woodruff, A. L., & Murray,
C. S. (2010). Differences in the relationship of oral reading fluency and high-
stakes measures of reading comprehension. Assessment for Effective Intervention,
35, 67-77.
Wiley, H. I. & Deno, S. L. (2005). Oral reading and maze measures as predictors of
success for English learners on a state standards assessment. Remedial and
Special Education, 26(4), 207-214.
Wilson, J. (2005). The relationship of Dynamic Indicators of Basic Early Literacy Skills
(DIBELS) Oral Reading Fluency to performance on Arizona Instrument to
Measure Standards (AIMS). Research Brief. Tempe, AZ: Tempe School District
No. 3 Assessment and Evaluation Department.
Wood, D. E. (2006). Modeling the relationship between oral reading fluency and
performance on a statewide reading test. Educational Assessment, 11(2), 85-104.
Yeo, S. (2009). Predicting performance on state achievement tests using curriculum-
based measurement in reading: A multilevel meta-analysis. Remedial and Special
Education. Advance online publication. doi: 10.1177/0741932508327463
134
CHAPTER 4
DISSERTATION CONCLUSION
The overarching goal of the two studies of this dissertation was to investigate how
Curriculum Based Measurement of Reading (R-CBM) may be used to document summer
learning loss and predict performance on a state reading test. Both studies discussed
results of previous studies that focused on using R-CBM in the stated contexts, as well as
identified discrepancies and gaps in the research base that pose additional questions.
The first study (Chapter 2) sought to measure change in reading over the summer
using R-CBM and investigate how individual and family factors impact change. Factors
such as eligibility for free or reduced price lunch (FRL), English language learner (ELL)
status, special education (SPED) status, and grade level were considered. The study
followed a diverse sample of students in elementary grades, measuring oral reading in the
spring and the following fall. Repeated-measures analysis of variance was used to
compare DIBELS ORF scores before and after the summer break for all students in each
grade, both overall and by subgroup. Results indicated loss differed by grade with overall
loss only seen in the lower grades and differential loss only in second grade based both
on FRL and SPED eligibility. Findings from this research reinforce and extend the
information available on summer learning loss and have specific implications for the use
of R-CBM as the method of measurement.
The second study (Chapter 3) investigated the utility of R-CBM to predict
performance on a state reading test by examining the accuracy of predictions and the
135
potential for predictive bias based on membership in certain subgroups. DIBELS ORF
and the Georgia Criterion Referenced Competency Tests (CRCT) were used as
measurement tools. Cut scores were generated using logistic regression and receiver
operator characteristic curve analysis. The diagnostic accuracy of these cut scores was
compared to that of the published DIBELS ORF benchmarks. The potential for bias
based on FRL eligibility, ethnic minority status, and ELL status was investigated using
regression and repeated-measures analysis of variance. Results indicated that the
commonly used benchmarks suggested by DIBELS may not be the best predictors of
outcomes on the Georgia state test. Specifically, DIBELS benchmarks had variable levels
of diagnostic accuracy, and the diagnostic accuracy of the ORF scores were improved by
generating sample-specific cut scores. The cut scores generated for the sample resulted in
more students placed in the correct category based on ORF scores and fewer students
identified by the ORF scores as in-need-of-services who actually passed the state test. In
addition, results indicated that separate state test score predictions may be warranted
based on membership in certain subgroups. The state test score predictions made for
students who were eligible for FRL were consistently too high. Conversely, the
predictions made for students who were not eligible for FRL were consistently too low.
Differences in predictions were also seen based on ethnicity for second and third grades
where the predicted state test scores of ethnic minorities were too high even when
comparing these predictions to other students of similar FRL eligibility.
Though the contexts of application differ, these two studies have implications for
educational policy and practice and the use of R-CBM relative to all students, and
specifically at-risk students. By using R-CBM, problems and limitations associated with

136
solely relying on other forms of assessment (i.e., global, standardized norm-referenced
achievement tests) can be circumvented. R-CBM allows for multiple assessments over
short periods of time and, thus, can document not only the summer loss but also the time
it takes to bounce back and begin to grow again. In addition, R-CBM may be useful for
monitoring growth throughout the summer for students in summer enrichment or
remediation programs, a function beneficial for the students as well as for the
development of evidence-based summer programs. Furthermore, schools and districts
might generate cut scores with the desired levels of diagnostic accuracy and examine
their data for evidence of predictive bias. R-CBM can be used to predict performance on
other standardized measures of reading achievement and identifying students in need of
additional programming. In sum, the information provided by R-CBM, used along with
other methods of assessment, can be used to inform instruction and identify the need for
intervention.