Using Crowdsourced Vehicle Braking Data to Identify ...
8
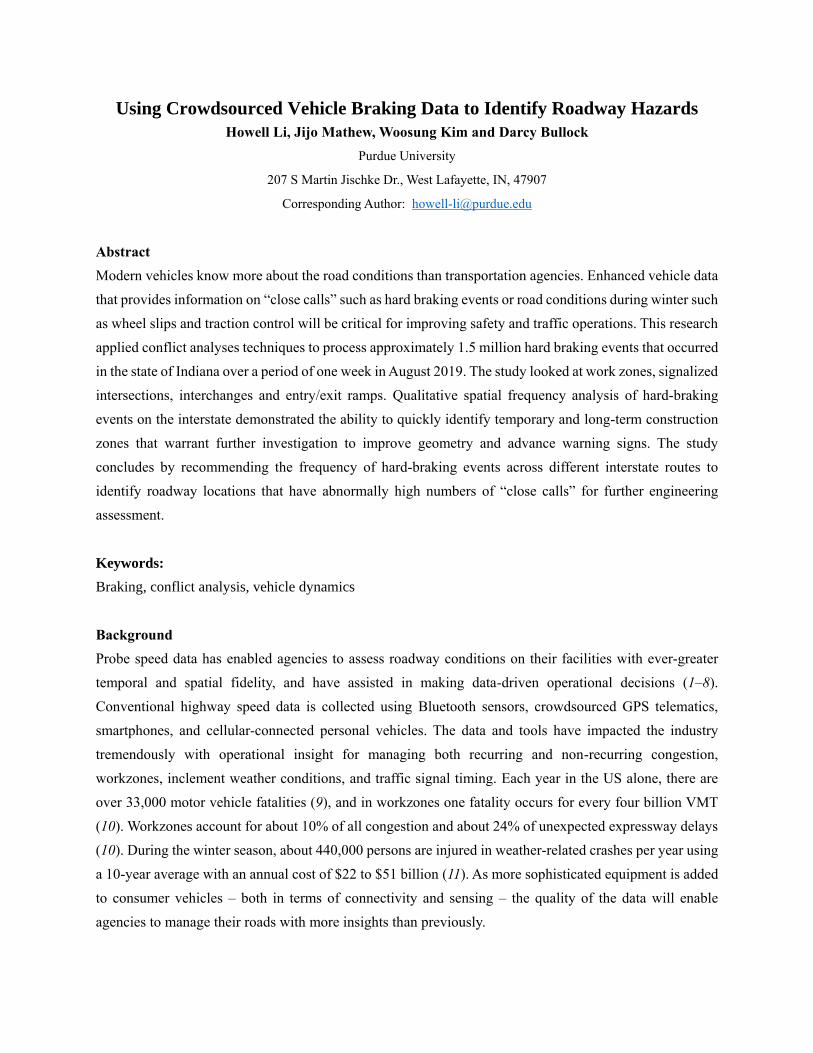
Using Crowdsourced Vehicle Braking Data to Identify Roadway Hazards Howell Li, Jijo Mathew, Woosung Kim and Darcy Bullock Purdue University 207 S Martin Jischke Dr., West Lafayette, IN, 47907 Corresponding Author: [email protected] Abstract Modern vehicles know more about the road conditions than transportation agencies. Enhanced vehicle data that provides information on “close calls” such as hard braking events or road conditions during winter such as wheel slips and traction control will be critical for improving safety and traffic operations. This research applied conflict analyses techniques to process approximately 1.5 million hard braking events that occurred in the state of Indiana over a period of one week in August 2019. The study looked at work zones, signalized intersections, interchanges and entry/exit ramps. Qualitative spatial frequency analysis of hard-braking events on the interstate demonstrated the ability to quickly identify temporary and long-term construction zones that warrant further investigation to improve geometry and advance warning signs. The study concludes by recommending the frequency of hard-braking events across different interstate routes to identify roadway locations that have abnormally high numbers of “close calls” for further engineering assessment. Keywords: Braking, conflict analysis, vehicle dynamics Background Probe speed data has enabled agencies to assess roadway conditions on their facilities with ever-greater temporal and spatial fidelity, and have assisted in making data-driven operational decisions (1–8). Conventional highway speed data is collected using Bluetooth sensors, crowdsourced GPS telematics, smartphones, and cellular-connected personal vehicles. The data and tools have impacted the industry tremendously with operational insight for managing both recurring and non-recurring congestion, workzones, inclement weather conditions, and traffic signal timing. Each year in the US alone, there are over 33,000 motor vehicle fatalities (9), and in workzones one fatality occurs for every four billion VMT (10). Workzones account for about 10% of all congestion and about 24% of unexpected expressway delays (10). During the winter season, about 440,000 persons are injured in weather-related crashes per year using a 10-year average with an annual cost of $22 to $51 billion (11). As more sophisticated equipment is added to consumer vehicles – both in terms of connectivity and sensing – the quality of the data will enable agencies to manage their roads with more insights than previously.
Transcript of Using Crowdsourced Vehicle Braking Data to Identify ...
Using Crowdsourced Vehicle Braking Data to Identify Roadway Hazards Howell Li, Jijo Mathew, Woosung Kim and Darcy Bullock
Purdue University
207 S Martin Jischke Dr., West Lafayette, IN, 47907
Corresponding Author: [email protected]
Abstract
Modern vehicles know more about the road conditions than transportation agencies. Enhanced vehicle data
that provides information on “close calls” such as hard braking events or road conditions during winter such
as wheel slips and traction control will be critical for improving safety and traffic operations. This research
applied conflict analyses techniques to process approximately 1.5 million hard braking events that occurred
in the state of Indiana over a period of one week in August 2019. The study looked at work zones, signalized
intersections, interchanges and entry/exit ramps. Qualitative spatial frequency analysis of hard-braking
events on the interstate demonstrated the ability to quickly identify temporary and long-term construction
zones that warrant further investigation to improve geometry and advance warning signs. The study
concludes by recommending the frequency of hard-braking events across different interstate routes to
identify roadway locations that have abnormally high numbers of “close calls” for further engineering
assessment.
Keywords:
Braking, conflict analysis, vehicle dynamics
Background
Probe speed data has enabled agencies to assess roadway conditions on their facilities with ever-greater
temporal and spatial fidelity, and have assisted in making data-driven operational decisions (1–8).
Conventional highway speed data is collected using Bluetooth sensors, crowdsourced GPS telematics,
smartphones, and cellular-connected personal vehicles. The data and tools have impacted the industry
tremendously with operational insight for managing both recurring and non-recurring congestion,
workzones, inclement weather conditions, and traffic signal timing. Each year in the US alone, there are
over 33,000 motor vehicle fatalities (9), and in workzones one fatality occurs for every four billion VMT
(10). Workzones account for about 10% of all congestion and about 24% of unexpected expressway delays
(10). During the winter season, about 440,000 persons are injured in weather-related crashes per year using
a 10-year average with an annual cost of $22 to $51 billion (11). As more sophisticated equipment is added
to consumer vehicles – both in terms of connectivity and sensing – the quality of the data will enable
agencies to manage their roads with more insights than previously.
Using Vehicle Braking Data to Identify Roadway Hazards
2
Data Source
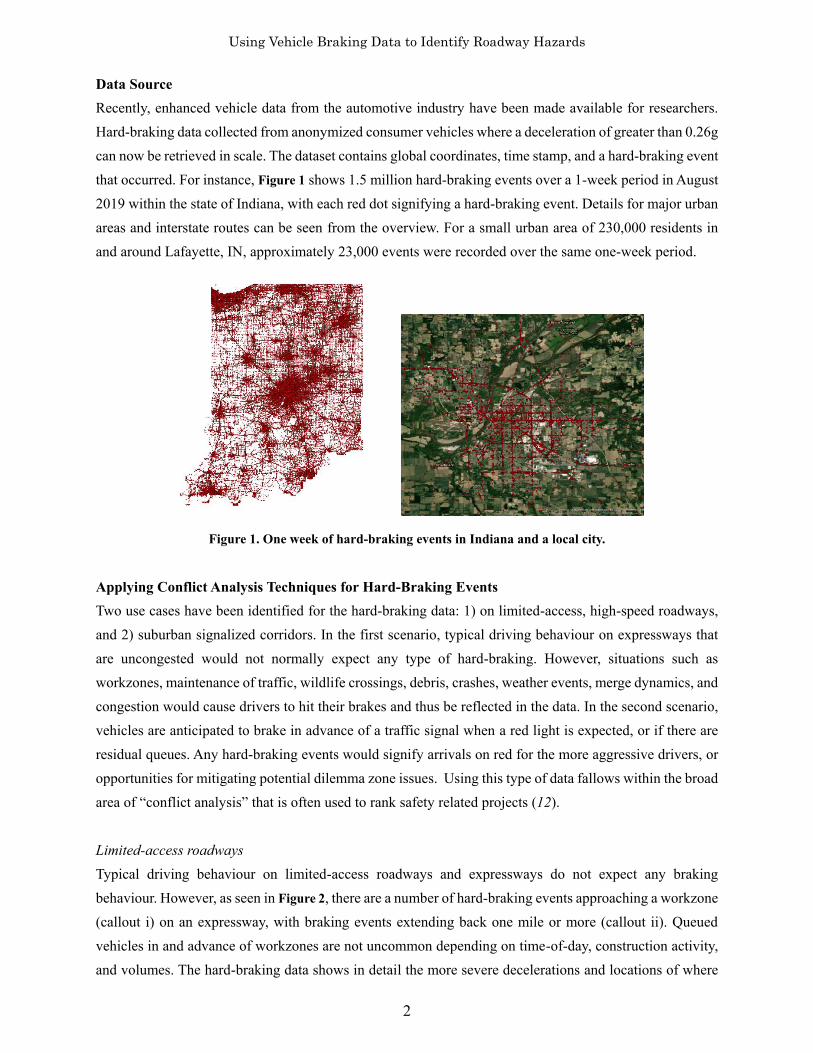
Recently, enhanced vehicle data from the automotive industry have been made available for researchers.
Hard-braking data collected from anonymized consumer vehicles where a deceleration of greater than 0.26g
can now be retrieved in scale. The dataset contains global coordinates, time stamp, and a hard-braking event
that occurred. For instance, Figure 1 shows 1.5 million hard-braking events over a 1-week period in August
2019 within the state of Indiana, with each red dot signifying a hard-braking event. Details for major urban
areas and interstate routes can be seen from the overview. For a small urban area of 230,000 residents in
and around Lafayette, IN, approximately 23,000 events were recorded over the same one-week period.
Figure 1. One week of hard-braking events in Indiana and a local city.
Applying Conflict Analysis Techniques for Hard-Braking Events
Two use cases have been identified for the hard-braking data: 1) on limited-access, high-speed roadways,
and 2) suburban signalized corridors. In the first scenario, typical driving behaviour on expressways that
are uncongested would not normally expect any type of hard-braking. However, situations such as
workzones, maintenance of traffic, wildlife crossings, debris, crashes, weather events, merge dynamics, and
congestion would cause drivers to hit their brakes and thus be reflected in the data. In the second scenario,
vehicles are anticipated to brake in advance of a traffic signal when a red light is expected, or if there are
residual queues. Any hard-braking events would signify arrivals on red for the more aggressive drivers, or
opportunities for mitigating potential dilemma zone issues. Using this type of data fallows within the broad
area of “conflict analysis” that is often used to rank safety related projects (12).
Limited-access roadways
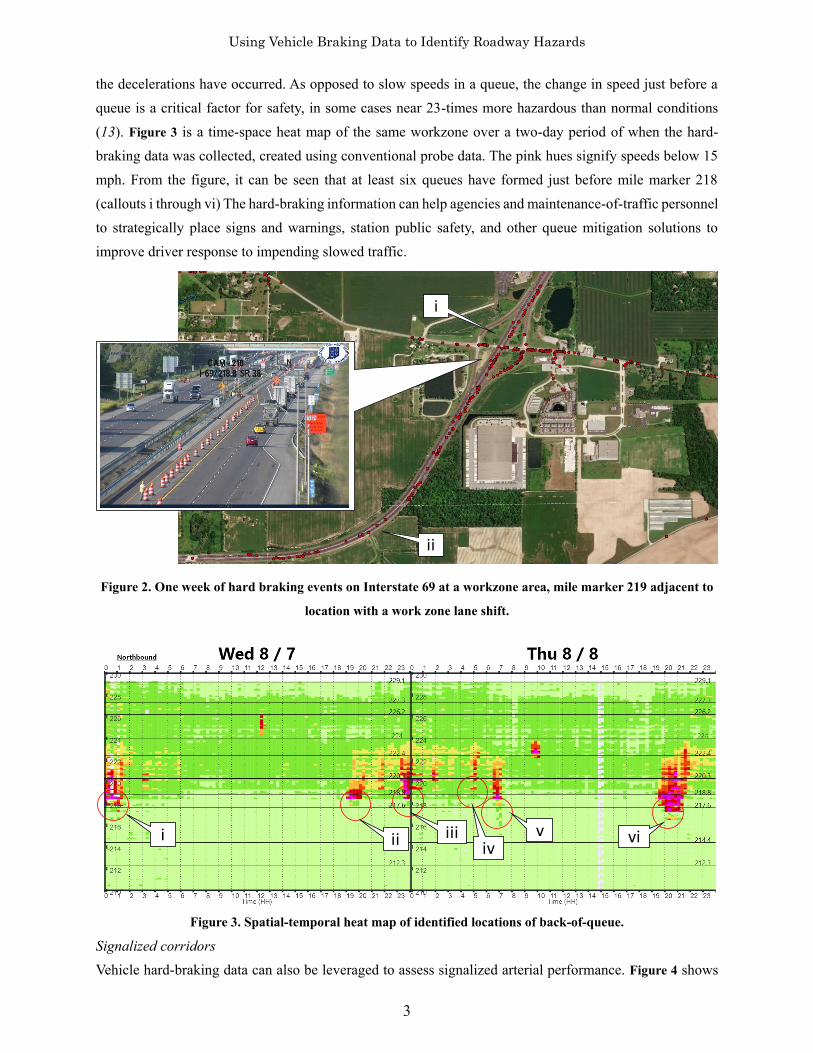
Typical driving behaviour on limited-access roadways and expressways do not expect any braking
behaviour. However, as seen in Figure 2, there are a number of hard-braking events approaching a workzone
(callout i) on an expressway, with braking events extending back one mile or more (callout ii). Queued
vehicles in and advance of workzones are not uncommon depending on time-of-day, construction activity,
and volumes. The hard-braking data shows in detail the more severe decelerations and locations of where
Using Vehicle Braking Data to Identify Roadway Hazards
3
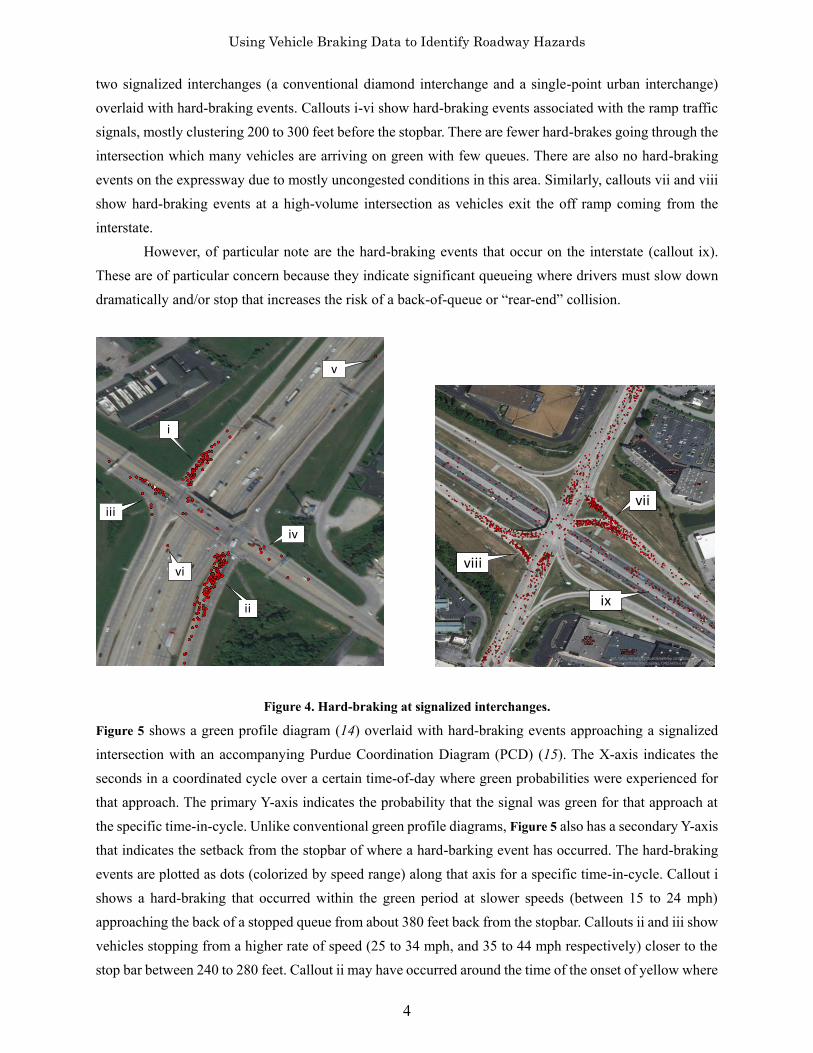
the decelerations have occurred. As opposed to slow speeds in a queue, the change in speed just before a
queue is a critical factor for safety, in some cases near 23-times more hazardous than normal conditions
(13). Figure 3 is a time-space heat map of the same workzone over a two-day period of when the hard-
braking data was collected, created using conventional probe data. The pink hues signify speeds below 15
mph. From the figure, it can be seen that at least six queues have formed just before mile marker 218
(callouts i through vi) The hard-braking information can help agencies and maintenance-of-traffic personnel
to strategically place signs and warnings, station public safety, and other queue mitigation solutions to
improve driver response to impending slowed traffic.
Figure 2. One week of hard braking events on Interstate 69 at a workzone area, mile marker 219 adjacent to
location with a work zone lane shift.
Figure 3. Spatial-temporal heat map of identified locations of back-of-queue.
Signalized corridors
Vehicle hard-braking data can also be leveraged to assess signalized arterial performance. Figure 4 shows
i
ii
i ii iiiiv
v vi
Using Vehicle Braking Data to Identify Roadway Hazards
4
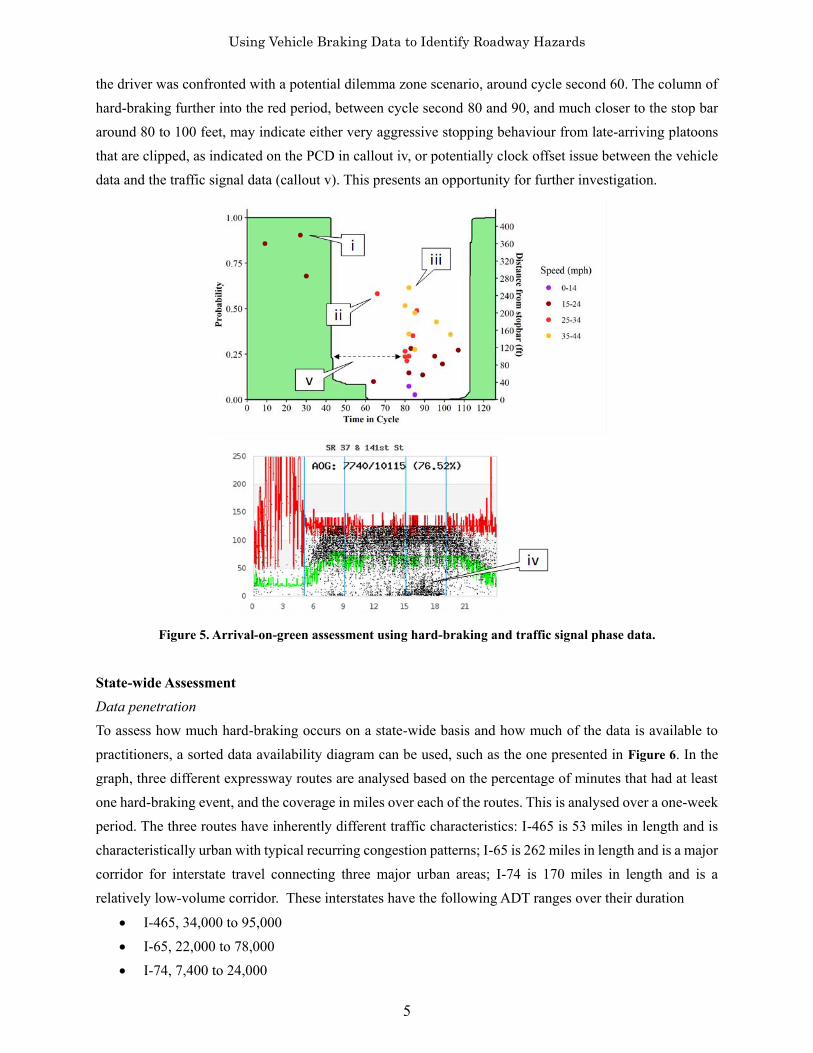
two signalized interchanges (a conventional diamond interchange and a single-point urban interchange)
overlaid with hard-braking events. Callouts i-vi show hard-braking events associated with the ramp traffic
signals, mostly clustering 200 to 300 feet before the stopbar. There are fewer hard-brakes going through the
intersection which many vehicles are arriving on green with few queues. There are also no hard-braking
events on the expressway due to mostly uncongested conditions in this area. Similarly, callouts vii and viii
show hard-braking events at a high-volume intersection as vehicles exit the off ramp coming from the
interstate.
However, of particular note are the hard-braking events that occur on the interstate (callout ix).
These are of particular concern because they indicate significant queueing where drivers must slow down
dramatically and/or stop that increases the risk of a back-of-queue or “rear-end” collision.
Figure 4. Hard-braking at signalized interchanges.
Figure 5 shows a green profile diagram (14) overlaid with hard-braking events approaching a signalized
intersection with an accompanying Purdue Coordination Diagram (PCD) (15). The X-axis indicates the
seconds in a coordinated cycle over a certain time-of-day where green probabilities were experienced for
that approach. The primary Y-axis indicates the probability that the signal was green for that approach at
the specific time-in-cycle. Unlike conventional green profile diagrams, Figure 5 also has a secondary Y-axis
that indicates the setback from the stopbar of where a hard-barking event has occurred. The hard-braking
events are plotted as dots (colorized by speed range) along that axis for a specific time-in-cycle. Callout i
shows a hard-braking that occurred within the green period at slower speeds (between 15 to 24 mph)
approaching the back of a stopped queue from about 380 feet back from the stopbar. Callouts ii and iii show
vehicles stopping from a higher rate of speed (25 to 34 mph, and 35 to 44 mph respectively) closer to the
stop bar between 240 to 280 feet. Callout ii may have occurred around the time of the onset of yellow where
i
ii
vi
v
iii
iv
vii
viii
ix
Using Vehicle Braking Data to Identify Roadway Hazards
5
the driver was confronted with a potential dilemma zone scenario, around cycle second 60. The column of
hard-braking further into the red period, between cycle second 80 and 90, and much closer to the stop bar
around 80 to 100 feet, may indicate either very aggressive stopping behaviour from late-arriving platoons
that are clipped, as indicated on the PCD in callout iv, or potentially clock offset issue between the vehicle
data and the traffic signal data (callout v). This presents an opportunity for further investigation.
Figure 5. Arrival-on-green assessment using hard-braking and traffic signal phase data.
State-wide Assessment
Data penetration
To assess how much hard-braking occurs on a state-wide basis and how much of the data is available to
practitioners, a sorted data availability diagram can be used, such as the one presented in Figure 6. In the
graph, three different expressway routes are analysed based on the percentage of minutes that had at least
one hard-braking event, and the coverage in miles over each of the routes. This is analysed over a one-week
period. The three routes have inherently different traffic characteristics: I-465 is 53 miles in length and is
characteristically urban with typical recurring congestion patterns; I-65 is 262 miles in length and is a major
corridor for interstate travel connecting three major urban areas; I-74 is 170 miles in length and is a
relatively low-volume corridor. These interstates have the following ADT ranges over their duration
I-465, 34,000 to 95,000
I-65, 22,000 to 78,000
I-74, 7,400 to 24,000
Using Vehicle Braking Data to Identify Roadway Hazards
6
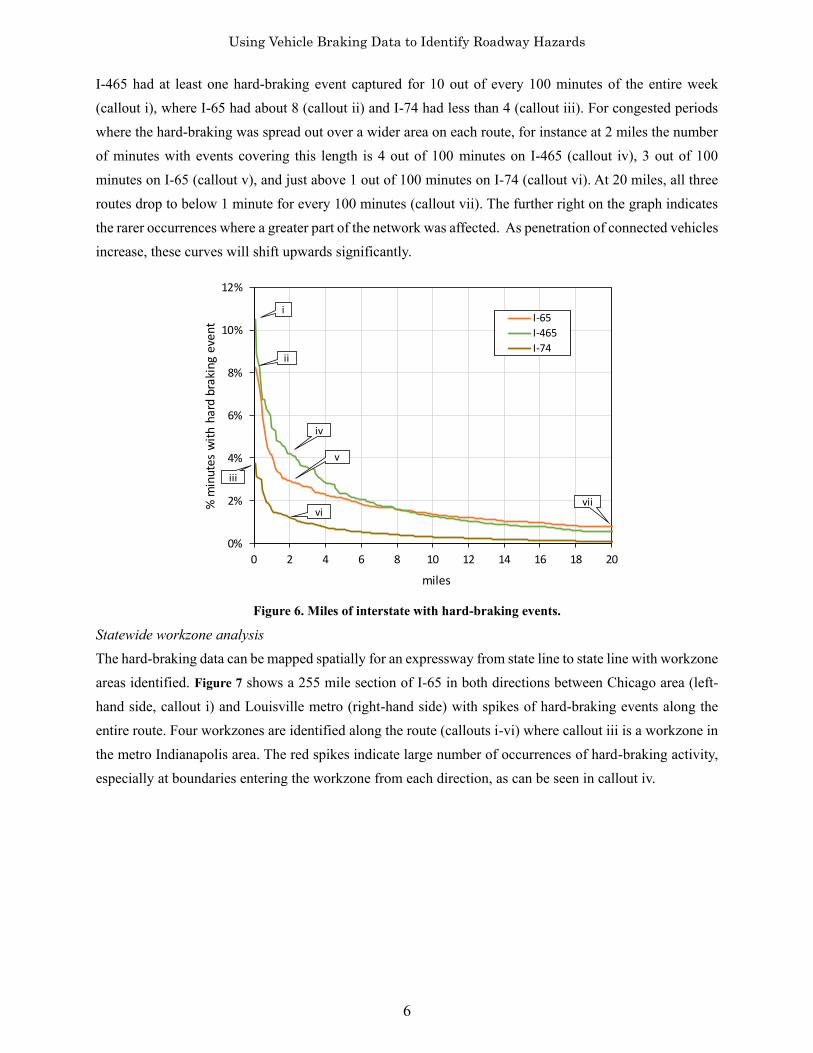
I-465 had at least one hard-braking event captured for 10 out of every 100 minutes of the entire week
(callout i), where I-65 had about 8 (callout ii) and I-74 had less than 4 (callout iii). For congested periods
where the hard-braking was spread out over a wider area on each route, for instance at 2 miles the number
of minutes with events covering this length is 4 out of 100 minutes on I-465 (callout iv), 3 out of 100
minutes on I-65 (callout v), and just above 1 out of 100 minutes on I-74 (callout vi). At 20 miles, all three
routes drop to below 1 minute for every 100 minutes (callout vii). The further right on the graph indicates
the rarer occurrences where a greater part of the network was affected. As penetration of connected vehicles
increase, these curves will shift upwards significantly.
Figure 6. Miles of interstate with hard-braking events.
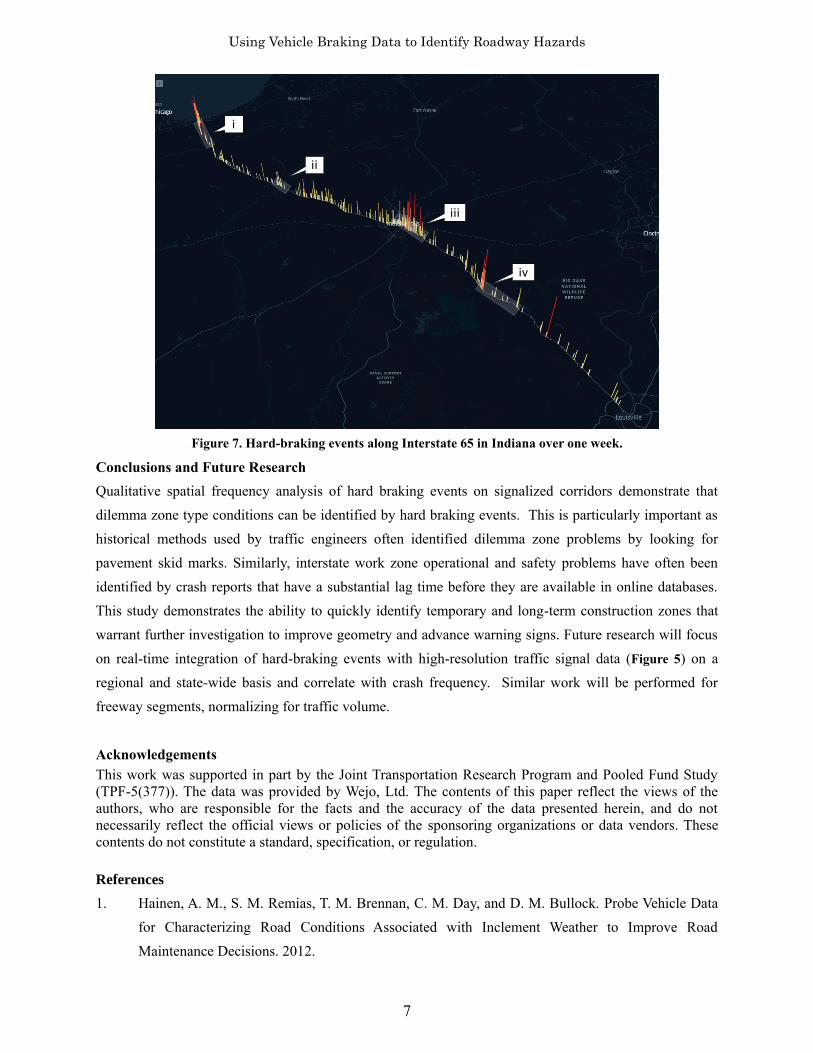
Statewide workzone analysis
The hard-braking data can be mapped spatially for an expressway from state line to state line with workzone
areas identified. Figure 7 shows a 255 mile section of I-65 in both directions between Chicago area (left-
hand side, callout i) and Louisville metro (right-hand side) with spikes of hard-braking events along the
entire route. Four workzones are identified along the route (callouts i-vi) where callout iii is a workzone in
the metro Indianapolis area. The red spikes indicate large number of occurrences of hard-braking activity,
especially at boundaries entering the workzone from each direction, as can be seen in callout iv.
0%
2%
4%
6%
8%
10%
12%
0 2 4 6 8 10 12 14 16 18 20
% m
inut
es w
ith
hard
bra
king
eve
nt
miles
I-65
I-465
I-74
i
ii
iii
iv
v
vivii
Using Vehicle Braking Data to Identify Roadway Hazards
7
Figure 7. Hard-braking events along Interstate 65 in Indiana over one week.
Conclusions and Future Research
Qualitative spatial frequency analysis of hard braking events on signalized corridors demonstrate that
dilemma zone type conditions can be identified by hard braking events. This is particularly important as
historical methods used by traffic engineers often identified dilemma zone problems by looking for
pavement skid marks. Similarly, interstate work zone operational and safety problems have often been
identified by crash reports that have a substantial lag time before they are available in online databases.
This study demonstrates the ability to quickly identify temporary and long-term construction zones that
warrant further investigation to improve geometry and advance warning signs. Future research will focus
on real-time integration of hard-braking events with high-resolution traffic signal data (Figure 5) on a
regional and state-wide basis and correlate with crash frequency. Similar work will be performed for
freeway segments, normalizing for traffic volume.
Acknowledgements
This work was supported in part by the Joint Transportation Research Program and Pooled Fund Study
(TPF-5(377)). The data was provided by Wejo, Ltd. The contents of this paper reflect the views of the
authors, who are responsible for the facts and the accuracy of the data presented herein, and do not
necessarily reflect the official views or policies of the sponsoring organizations or data vendors. These
contents do not constitute a standard, specification, or regulation.
References
1. Hainen, A. M., S. M. Remias, T. M. Brennan, C. M. Day, and D. M. Bullock. Probe Vehicle Data
for Characterizing Road Conditions Associated with Inclement Weather to Improve Road
Maintenance Decisions. 2012.
i
ii
iii
iv
Using Vehicle Braking Data to Identify Roadway Hazards
8
2. Sharifi, E., S. E. Young, S. Eshragh, M. Hamedi, R. M. Juster, and K. Kaushik. Outsourced Probe
Data Effectiveness on Signalized Arterials. Journal of Intelligent Transportation Systems, Vol. 21,
No. 6, 2017, pp. 478–491. https://doi.org/10.1080/15472450.2017.1359093.
3. Ahmed, M. M., G. Yang, and S. Gaweesh. Development and Assessment of a Connected Vehicle
Training Program for Truck Drivers. Transportation Research Record: Journal of the
Transportation Research Board, Vol. 2673, No. 2, 2019, pp. 113–126.
https://doi.org/10.1177/0361198119827904.
4. Haseman, R. J., J. S. Wasson, and D. M. Bullock. Real-Time Measurement of Travel Time Delay in
Work Zones and Evaluation Metrics Using Bluetooth Probe Tracking. Transportation Research
Record: Journal of the Transportation Research Board, Vol. 2169, No. 1, 2010, pp. 40–53.
https://doi.org/10.3141/2169-05.
5. Edwards, M. B., and M. D. Fontaine. Investigation of Travel Time Reliability in Work Zones with
Private-Sector Data. Transportation Research Record: Journal of the Transportation Research
Board, Vol. 2272, No. 1, 2012, pp. 9–18. https://doi.org/10.3141/2272-02.
6. Li, H., S. M. Remias, C. M. Day, M. M. Mekker, J. R. Sturdevant, and D. M. Bullock. Shock Wave
Boundary Identification Using Cloud-Based Probe Data. Transportation Research Record: Journal
of the Transportation Research Board, Vol. 2526, No. 1, 2015, pp. 51–60.
https://doi.org/10.3141/2526-06.
7. Mekker, M., H. Li, J. McGregor, M. Kachler, and D. Bullock. Implementation of a Real-Time Data
Driven System to Provide Queue Alerts to Stakeholders. 2017.
8. Brennan, T. M., S. M. Remias, G. M. Grimmer, D. K. Horton, E. D. Cox, and D. M. Bullock. Probe
Vehicle–Based Statewide Mobility Performance Measures for Decision Makers. Transportation
Research Record: Journal of the Transportation Research Board, Vol. 2338, No. 1, 2013, pp. 78–
90. https://doi.org/10.3141/2338-09.
9. FARS Encyclopedia. https://www-fars.nhtsa.dot.gov/Main/index.aspx. Accessed Jan. 31, 2020.
10. FHWA Work Zone Facts and Statistics - FHWA Office of Operations.
https://ops.fhwa.dot.gov/wz/resources/facts_stats.htm#ftn1. Accessed Jan. 31, 2020.
11. How Do Weather Events Impact Roads? - FHWA Road Weather Management.
https://ops.fhwa.dot.gov/weather/q1_roadimpact.htm. Accessed Jan. 31, 2020.
12. Fricker, J. D., and R. K. Whitford. Fundamentals of Transportation Engineering : A Multimodal
Approach. Pearson Prentice Hall, 2004.
13. Mekker, M., S. Remias, M. McNamara, and D. Bullock. Characterizing Interstate Crash Rates Based
on Traffic Congestion Using Probe Vehicle Data. Purdue Road School, 2016.
14. Robertson, D. I. “TRANSYT” Method for Area Traffic Control. Traffic Engineering and Control,
Vol. 11, 1969, pp. 276–281.
15. Day, C. M., D. M. Bullock, H. Li, S. M. Remias, A. M. Hainen, R. S. Freije, A. L. Stevens, J. R.
Sturdevant, and T. M. B. Jr. Performance Measures for Traffic Signal Systems: An Outcome-
Oriented Approach. Purdue University, West Lafayette, IN, 2014.