Using Comprehensive Assessment to Intervene with...
36
Using Comprehensive Assessment to Intervene with and Retain Students Dr. Stacey Moore Mr. Greg Dieringer Ms. Melinda Grove Ms. Stephanie Myers Mr. Zachary Steiner Ms. Trillah Culver Ms. Cassie Verardi
Transcript of Using Comprehensive Assessment to Intervene with...
Using Comprehensive Assessment to Intervene with and Retain
Students
Dr. Stacey MooreMr. Greg DieringerMs. Melinda Grove
Ms. Stephanie MyersMr. Zachary SteinerMs. Trillah CulverMs. Cassie Verardi

What we have for you today…..
• What is MAP-Works?
• MAP-Works Inspired Interventions
– Academic Advising
– Student Success Seminar
– Off-Campus Outreach Team
– Residence Life and Housing
• MAP-Works Data Highlights
• Case Study
2

What is MAP-Works?
A retention and student success tool that:
• Integrates institutional and student provided information to determine likelihood of retention
• Provides students with personalized success tips and resources
• Provides direct connects and colleges/units with student specific information that can enhance individual interventions
• Provides an early warning mechanism for faculty
• Facilitates communication across units
• Provides the institution with aggregate information that can inform the creation of institution-wide initiatives

MAP-Works Process
• Student Profile• Institution Profile• Campus Resources
• Expectations• Behaviors
• Social Norming• Expectations• Campus Resources
• Student Summary• Sort Students• Coordinate Efforts

Student Characteristics
•Gender•Race/ethnicity•Entrance exam scores•# credit hours enrolled•High school GPA
Self-Assessment
•Communication Skills•Analytical Skills•Self-Discipline•Time Management•Health and Wellness
Social Integration
•Peer Connections•Living Environment (on/off campus)
•Roommate Relationships
•Homesickness
Academic Integration
•Academic Self-Efficacy
•Core Academic Behaviors
•Advanced Academic Behaviors
•Commitment to Higher Education
Information Collected

MAP-Works Risk Indicator
• Represents a student’s risk level and is indicated by an icon in Faculty/Staff Reporting.
• Based on a regression algorithm.
• Students are classified as:– Low risk for attrition or poor academic performance (Green Risk
Indicator)
– Moderate risk (Yellow Risk Indicator)
– High risk (Red Risk Indicator)
– Extremely high risk (Red2 Risk Indicator)

MAP-Works at UA
• 2009-2010 – pilot with 1,000 UC students
• 2010-2011
– Students invited = 5,049 total (4,528 first-year, first-time)
– Faculty Staff Participants = 628 total
• 373 Direct Connects/Referrals; 255 Alert Only Faculty
• 2011-2012
• All Akron FYFT
• Wayne College will use two-year college survey
• Akron Second-Year Cohort added

Athletics & Adult Focus
Residence Life & Off Campus Student Services
Student Success Seminar Instructors
Office of Multicultural Development & International Programs
Academic Adviser/ Mentor from “Admitted” College
2010-2011 UA Direct-Connects

Student Tracking

Talking Points

Dashboard & Risk Indicator
It’s fairly obvious that “Travis Gatlin” is at risk…
It’s less obvious that “Jessica Anderson”, is
equally at risk. But look at the red risk indicator.

Alerts• Alerts: Input by Faculty/Staff to identify student
problems/issues.

Alert Details

Student Dashboard

Fall Transition Written Student Report

MAP-WorksInspired Interventions

– Email reminders to complete the survey
– Emails to “Red” students encouraging them to schedule an appointment
– Communication across departments to inform direct connects of issues
– Review responses to guide advising appointment discussions
Academic Advising
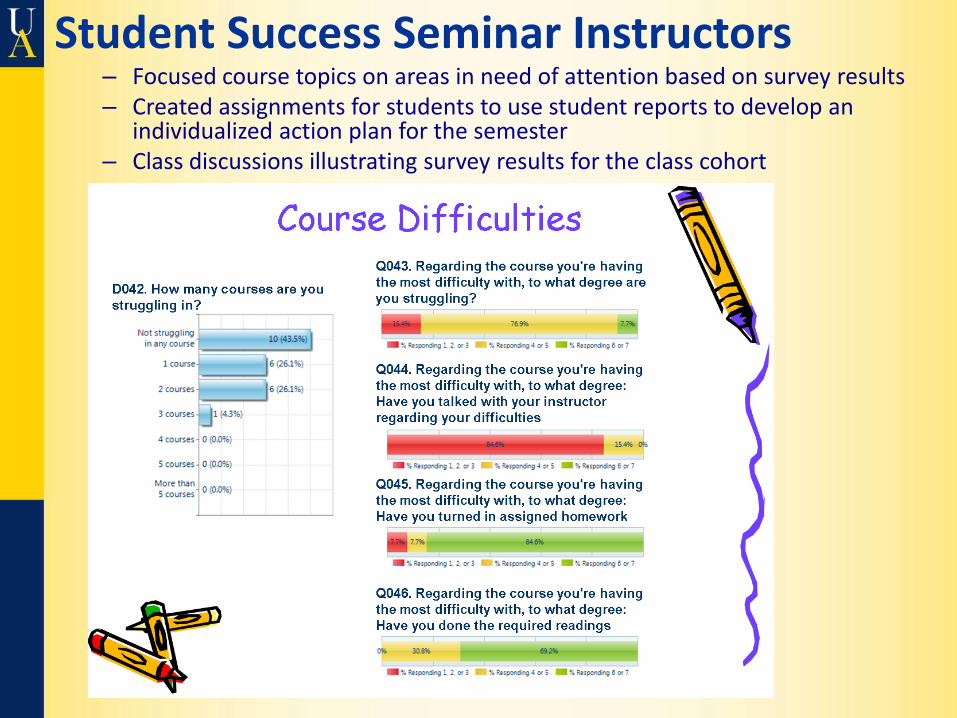
Student Success Seminar Instructors– Focused course topics on areas in need of attention based on survey results– Created assignments for students to use student reports to develop an
individualized action plan for the semester– Class discussions illustrating survey results for the class cohort

MAP-Works inspired interventions –Off Campus Outreach Team
• MAP-Works questions used to identify 297 students
– Intent to Return for Spring and Next Year
– Commitment to Institution
– Commitment to Completing Degree
– Sense of Belonging
• Off Campus Outreach Team
– Volunteers from various Student Affairs departments
– Assigned an average of 11 students each
– Trained on MAP-Works
– Guidelines and Scripts
19
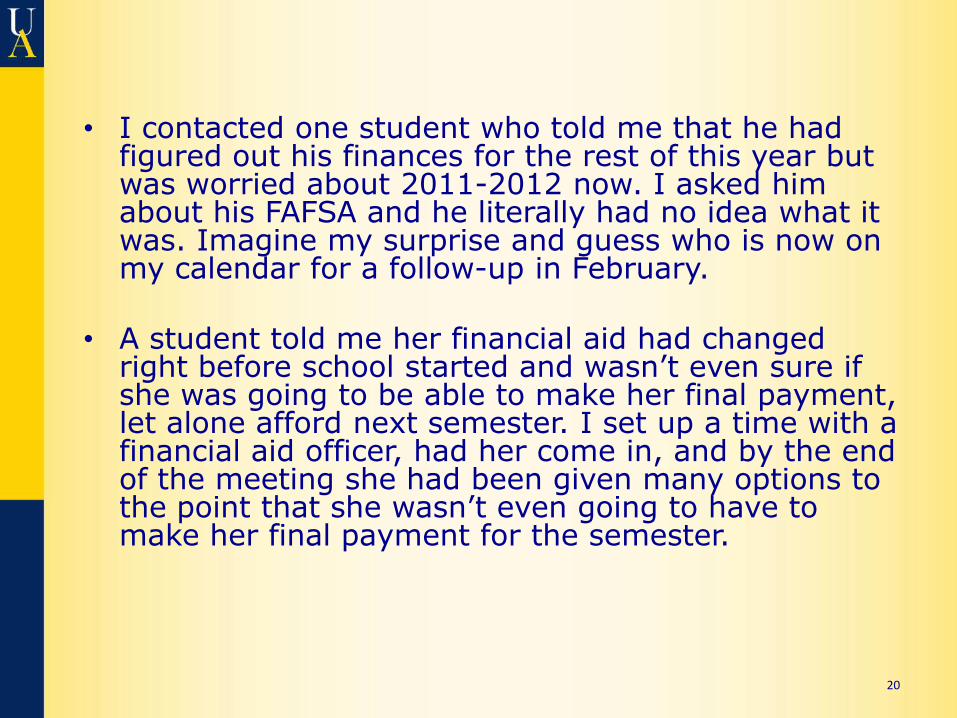
• I contacted one student who told me that he had figured out his finances for the rest of this year but was worried about 2011-2012 now. I asked him about his FAFSA and he literally had no idea what it was. Imagine my surprise and guess who is now on my calendar for a follow-up in February.
• A student told me her financial aid had changed right before school started and wasn’t even sure if she was going to be able to make her final payment, let alone afford next semester. I set up a time with a financial aid officer, had her come in, and by the end of the meeting she had been given many options to the point that she wasn’t even going to have to make her final payment for the semester.
20

• Email received from a student “I can’t believe I just now found your email. It somehow ended up in my spam folder (which I never check because I never get spam?) Weird, but never the less I wanted to say thank you for taking me to a financial adviser. One of the options didn’t work out but I was able to get my Pell Grant back! This should hopefully be enough to bring my payments down to something more reasonable, than almost $600 a month. If I need help again, you are certainly the first person I am going to ask! Thank you so much! “
21

Off Campus Outreach Fall 2010 Outcomes
22

Residence Life and Housing
• The plan
– Keep track of “frequent flyers” prior to survey launch
– Resident Assistants – goal of 70% response rate
– Integrate MAP-Works into everyday work pattern (student conduct meetings, room changes, etc.)
– Backtrack “frequent flyers”
– MAP-Works follow up plan submitted by Hall Staff
– Use data to create floor and building programs

Residence Life and Housing
• The reality
– 90% response rate for residential students
– Staff burnout
– Professional Hall Staff did not honor the hard work our student staff put in
– MAP-Works got lost in everyday business

Residence Life and Housing
• New Game Plan for 2011
– Digging through 2010 data looking for where we can get a good bang for our buck
– Having Professional Hall Staff look at 2010 data and come up with intervention plans now that they are excited about

Fall Cum GPA > 2.5
Fall to Spring Retention
Spring Cum GPA > 2.5
Fall 2011 Enrolled (as of June 8, 2011)
Overall 54.59% 85.34% 56.60% 48.98%
On Campus 62.90% 89.21% 64.66% 63.21%
Responders 63.45% 90.03.% 64.67% 64.19%
Non-Responders 35.44% 73.79% 42.11% 40.29%
Risk Indicator – Green 76.65% 96.69% 80.28% 79.38%
Risk Indicator – Yellow 73.55% 89.24% 59.23% 60.80%
Risk Indicator – Red 44.90% 73.18% 44.22% 39.36%
Room Type – Single 63.37% 87.21% 66.67% 64.53%
Room Type – Double 66.64% 92.46% 68.00% 67.82%
Room Type – Triple 51.61% 81.72% 53.51% 51.97%
Do I belong here – Green 65.67% 92.98% 65.96% 68.67%
Do I belong here – Yellow 60.28% 87.03% 62.61% 56.69%
Do I belong here – Red 52.59% 71.55% 56.63% 47.41%
RLH MAP-Works Data Points

MAP-Works 2010-2011Data Highlights

Fall-to-Spring Retention and Average GPA by Risk Indicator
MAP-Works Fall 2010
Risk Indicator
Total Students with Spring 2011 data
Average Fall 2010 GPA
Returned Spring 2011
Did Not Return Spring 2011
Green 1659 (36.8%) 2.90 1597 (96.3%) 62 (3.7%)
Yellow 1917 (42.5%) 2.26 1642 (85.7%) 275 (14.3%)
Red 729 (16.2%) 1.84 543 (74.5%) 186 (25.5%)
Red2 39 (0.9%) 2.27 19 (48.7%) 20 (51.3%)
NA (insufficient
data to calculate risk)
164 (3.6%) 1.10 108 (65.9%) 56 (34.1%)
Total 4508 2.39 3909 (86.7%) 599 (13.3%)

Fall 2010 Academic Standing by Response Rate
Respondents Non-Respondents

5.3%
5.1%
4.6%
14.9%
24.6%
19.5%
79.9%
70.3%
75.9%
0% 20% 40% 60% 80% 100%
To what degree do you intend to come back
next year?
To what degree are you committed to completing your …
Would you recommend this
institution to others?Not at all
Moderately
Extremely
6.2% 48.6% 45.2%
0% 20% 40% 60% 80% 100%
Rate your experience at this insitution.
Very Poor to Fair
Good to Very Good
Excellent to Exceptional
Commitment to the Institution and Persistence
Evaluation of the Institution

30.9%
59.6%
9.1%.4%
0
500
1000
1500
2000
2500
Mostly A Mostly B Mostly C Below C
What grades do you think you will earn this …
29.2%
46.5%
17.9%
5.9%
.5%0
200
400
600
800
1000
1200
1400
1600
1800
3.50 or higher 3.00 - 3.49 2.50 - 2.99 2.00 - 2.49 Less than 2.00
What GPA do you think you will earn this semester?

41% 40.8%
15.1%
2.2% .6% .1% .1%0
200
400
600
800
1000
1200
1400
1600
None 1 2 3 4 5 >5
How many courses are you struggling in?
29.3%
68%
62.3%
23.3%
7.9%
8.7%
0% 10% 20% 30% 40% 50% 60% 70% 80% 90% 100%
To what degree are you struggling?
Have you talked with your instructor regarding your difficulties?
Not at all
Moderately
Extremely
Case Study
• The following is information on an alert that you may receive
• Take a look at the information and try to identify who might help this student
• Groups:
1) Think of this student as a residence hall student
2) Think of this student as a commuter student

34

35

Questions?
36