Using Benchmark Data for Change in Policy Decisions August 11, 2014.
16
Using Benchmark Data for Change in Policy Decisions ugust 11, 2014
-
Upload
chloe-summers -
Category
Documents
-
view
213 -
download
0
Transcript of Using Benchmark Data for Change in Policy Decisions August 11, 2014.

Using Benchmark Data for Change in Policy Decisions
August 11, 2014
NASACT 2014 conference | 2
© 2014 The Hackett Group, Inc. All rights reserved. Reproduction of this document or any portion thereof without prior written consent is prohibited.
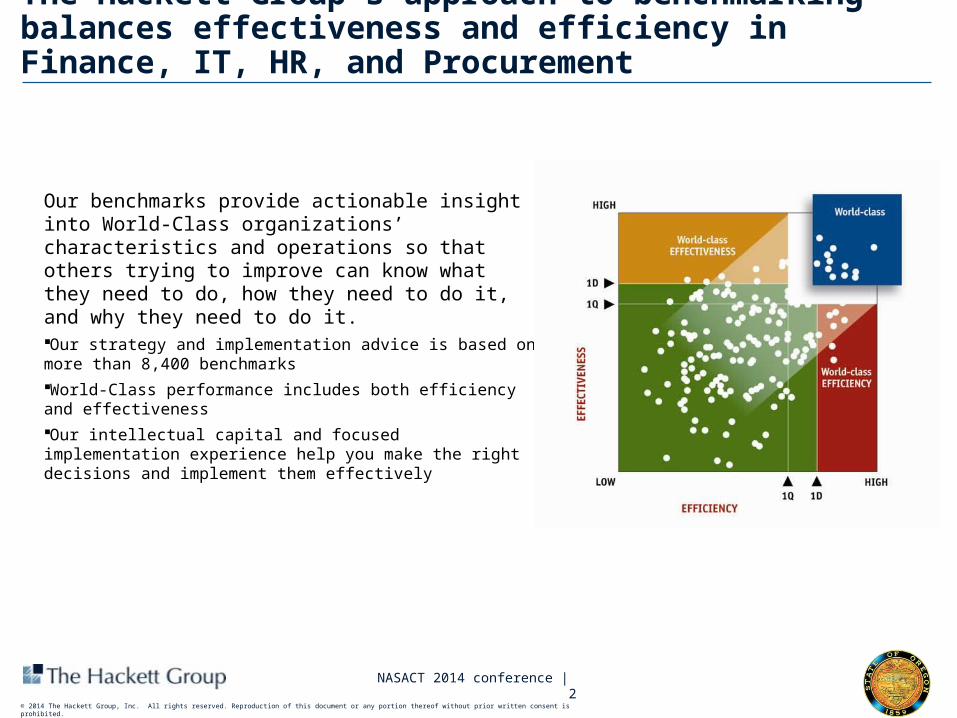
The Hackett Group's approach to benchmarking balances effectiveness and efficiency in Finance, IT, HR, and Procurement
Our benchmarks provide actionable insight into World-Class organizations’ characteristics and operations so that others trying to improve can know what they need to do, how they need to do it, and why they need to do it.Our strategy and implementation advice is based on more than 8,400 benchmarksWorld-Class performance includes both efficiency and effectivenessOur intellectual capital and focused implementation experience help you make the right decisions and implement them effectively

NASACT 2014 conference | 3
© 2014 The Hackett Group, Inc. All rights reserved. Reproduction of this document or any portion thereof without prior written consent is prohibited.
What this benchmark is . . . What this benchmark is not . . .
A starting point … the end answer
A measurement highlighting where efforts should be focused
…a detailed analysis of how to redesign processes
Best practice comparisons …a competitive analysis
Process based comparison …an exact match to organizational departments . . . no benchmarking is
One input to setting targets …the only input
A broad look at the Finance, HR, IT and Procurement functions …going to cover all aspects of state operations
Benchmark results should be evaluated in conjunction with the specific requirements of the State

NASACT 2014 conference | 4
© 2014 The Hackett Group, Inc. All rights reserved. Reproduction of this document or any portion thereof without prior written consent is prohibited.
The partnership between NASACT and Hackett has allowed many states to benchmark since 2004
Alabama Massachusetts Oregon
Alaska Michigan Tennessee
Arizona Mississippi West Virginia
California Nevada Wyoming (Underway!)
Delaware New Jersey Virginia
Georgia Oklahoma

NASACT 2014 conference | 5
© 2014 The Hackett Group, Inc. All rights reserved. Reproduction of this document or any portion thereof without prior written consent is prohibited.
Benchmark results were collected and analyzed for State of Oregon as a whole and by Agency:
In Scope Agencies (Cross-functional)Board of Nursing Department of Justice Office of Energy
Bureau of Labor & IndustriesDept of Land Conservation & Development
Oregon Business Development Department
Commission for the Blind Department of Parks & Recreation Oregon Medical BoardCommunity Colleges & Workforce Dev Department of Revenue Oregon Youth AuthorityConstruction Contractors Board Department of State Lands Public Employees Retirement SystemDepartment of Administrative Services* Department of Transportation Public Safety Standards & TrainingDepartment of Agriculture Department of Treasury Public Utility CommissionDepartment of Aviation Department of Veterans Affairs Real Estate AgencyDepartment of Consumer & Business Services Employment Department Secretary of StateDepartment of Corrections Health Licensing Agency State LibraryDepartment of Education Housing & Community Services State Police
Department of Environmental QualityDepartment of Human Services and the Oregon Health Authority Student Access
Department of Fish & Wildlife Liquor Control Commission Teacher Standards and PracticesDepartment of Forestry Marine Board Water Resources DepartmentDepartment of Geology & Mineral Industries Military Department Watershed Enhancement Board
*Includes all DAS Client Agencies
State of Oregon’s benchmark scope

NASACT 2014 conference | 6
© 2014 The Hackett Group, Inc. All rights reserved. Reproduction of this document or any portion thereof without prior written consent is prohibited.
To achieve World-Class performance in administrative functions, organizations need to achieve World-Class IT performance.
Source: The Hackett Group
40% of organizations that conduct a multi-function
benchmark are World-Class in an individual function But only 30% of these
organizations are World-Class in two or more functions
IT is one of those functions 86% of the
time!

NASACT 2014 conference | 7
© 2014 The Hackett Group, Inc. All rights reserved. Reproduction of this document or any portion thereof without prior written consent is prohibited.
Setting the stage
The Kitzhaber Administration and the Chief Operating Officer The 10 Year Plan for Oregon The Enterprise Leadership Team The Improving Gov’t Steering Committee

NASACT 2014 conference | 8
© 2014 The Hackett Group, Inc. All rights reserved. Reproduction of this document or any portion thereof without prior written consent is prohibited.
Oregon’s Administrative Baseline 2.0 objectives
Initiative Overview
Project Objectives
Deliverables
Get a comprehensive view of the State of Oregon's current Finance (including Payroll), Procurement, Information Technology and Human Resources performance.
Establish a baseline of the State of Oregon's Finance (including Payroll), Procurement, Information Technology and Human Resources organization to identify resource allocations and key cost drivers.
Compare the State of Oregon to peer group and 'World-Class' organizations – Gain insight to how leading Finance (including Payroll), Procurement, Information Technology and HR
divisions are organized and staffed– Identify ways to better leverage technology solutions– Identify specific performance gaps to better focus improvement resources
Obtain a balanced, qualitative perspective of Finance (including Payroll), Procurement, Information Technology and Human Resources through executive interviews and stakeholder surveys
Comprehensive baseline data on costs and performance of key operational functions for state agencies Recommendations for improvement in efficiency and effectiveness
Benchmark costs and performance of key operational functions: Finance (including Payroll), Procurement, Information Technology and Human Resources

NASACT 2014 conference | 9
© 2014 The Hackett Group, Inc. All rights reserved. Reproduction of this document or any portion thereof without prior written consent is prohibited.
Finance labor costs and FTEs are much higher for Oregon than other states
1.020%
0.451%
0.088%
0.097%
0.078%
0.080%
0.102%
0.048%
0.676%
1.288%
State of Oregon Peer Group
Labor Outsourcing Technology Other
Finance Cost as a % of Revenue Overall State of Oregon FTEs
352.6272.4
73.0
38.1
159.7
40.1
33.2
16.7
618.4
367.3
State of Oregon Peer Group
Transactional ManagementPlanning & StrategyControl/Risk Management

NASACT 2014 conference | 10
© 2014 The Hackett Group, Inc. All rights reserved. Reproduction of this document or any portion thereof without prior written consent is prohibited.
While Oregon's total IT cost per EUE is similar to comparable states, it is higher than the peer, driven by the labor cost
$3,915
$2,033
$439
$608
$2,202
$1,992
$319
$375
$5,008
$6,875
State of Oregon Peer Group
Labor Outsourcing Technology Other
IT Cost ($) per EUE Number of IT FTEs per State of Oregon’s EUEs
EUEs1: 40,965
Pro
cess
co
st
State range: $3,575 to $9,373
114.3 72.5
403.7336.5
873.0
992.2
65.6
52.41,562.5
1,347.6
State of Oregon Peer Group
Design Build Run Manage
1 EUEs = End User Equivalents.

NASACT 2014 conference | 11
© 2014 The Hackett Group, Inc. All rights reserved. Reproduction of this document or any portion thereof without prior written consent is prohibited.
$424
$164$897
$178
State of Oregon Peer Group
Labor Outsourcing
Rationalize (reduce) the application and infrastructure portfolio to support the state in a more effective and efficient manner. Determine where there are opportunities to consolidate across agencies and departments.
Make more effective use of existing systems through interfaces and, as appropriate, provide uniform views of information across departments. Focus on statewide level business needs, not just by agency. Analyze which agencies have the most immediate opportunity to move to shared services for Infrastructure. Enforce compliance to standards across the IT organization – particularly for hardware configuration and application development. Ensure that a collaborative process and governance structure exists and is used to
establish and maintain the statewide architecture plan. Develop a shared services model for Application Management where it makes sense and doesn‘t hinder
performance.
Oregon has a proliferation of applications and fragmentation within Information Technology
Select Infrastructure Volumes State of Oregon Recommendations
Overall IT costs are higher than comparison groups, but centralization of infrastructure has resulted in cost reduction and improved performance for Oregon Currently only 50% of the technology portfolio is considered as managed in shared services. 204 Infrastructure Management FTEs (63%) and 63 Infrastructure
Development FTEs (73%) are outside of the centralized organization. This is a high number of FTEs servicing less than 20% of state’s infrastructure spend. Infrastructure and application complexity are high as are the corresponding supplier counts and the costs to manage the processes Adherence to standards is below peer level for hardware configuration and application development
State of Oregon Observations
$296
$123$787
$51
State of Oregon Peer Group
Labor Outsourcing
$838
$419
$1,076
$588
Infrastructure Management Process Cost ($) per EUE Application Maintenance Process Cost ($) per EUE Applications per 1,000 EUEs
15
531
14
374
Data Centers Databases*
* Includes customer, employee, supplier and product databases
71
25
State of Oregon Peer Group
State of Oregon Peer Group
NASACT 2014 conference | 12
© 2014 The Hackett Group, Inc. All rights reserved. Reproduction of this document or any portion thereof without prior written consent is prohibited.
Strategically separate the cost reduction initiatives from the performance improvement initiatives. Cost reduction should be focused on reducing run costs and unnecessary, duplicative software spend. Reinvest savings into
Build activities. Increase self service capabilities and system automation for routine transactions and reporting needs to facilitate
efficiency in administrative functions. This may result in a higher cost in IT to drive lower admin costs overall. Ensure there is proper demand management and understanding of user requests to properly scope and plan delivery efforts to truly meet user needs. Given the spend on Quality Assurance, it’s important to ensure that this process is effective in driving high quality deliverables with minimal break/fix requests. Bolster end user training to improve user understanding and acceptance of new technologies.
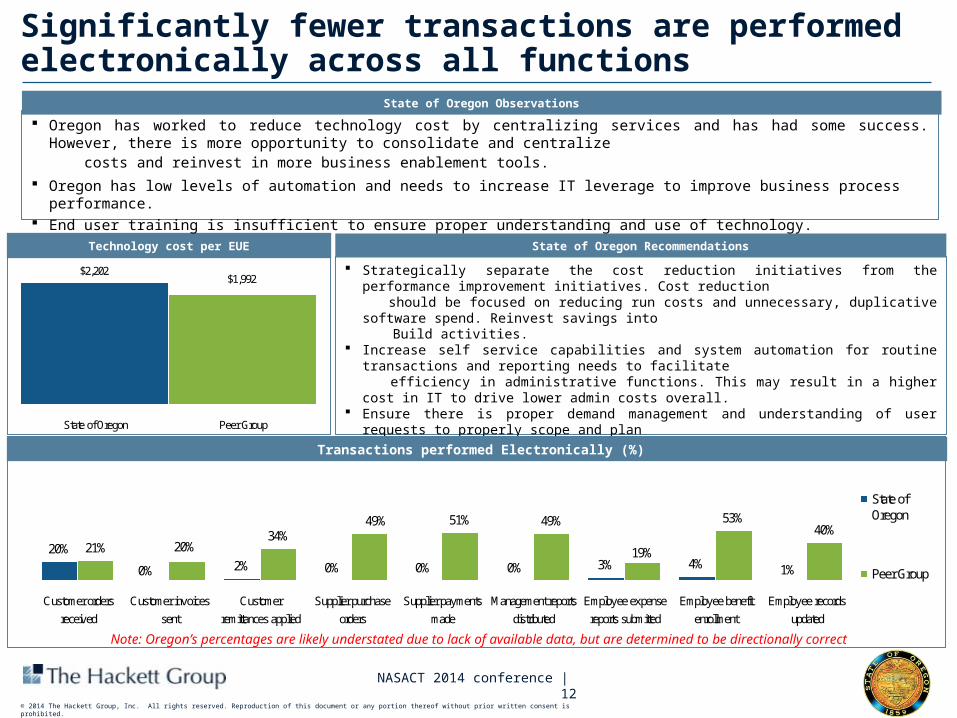
Significantly fewer transactions are performed electronically across all functions
Technology cost per EUE State of Oregon Recommendations
Oregon has worked to reduce technology cost by centralizing services and has had some success. However, there is more opportunity to consolidate and centralize costs and reinvest in more business enablement tools. Oregon has low levels of automation and needs to increase IT leverage to improve business process performance. End user training is insufficient to ensure proper understanding and use of technology.
State of Oregon Observations
Transactions performed Electronically (%)
$2,202$1,992
State of Oregon Peer Group
20%2% 0% 0% 0% 3%
21%34%
51% 49% 53%40%
1%4%0%19%
49%
20%
Customer ordersreceived
Customer invoicessent
Customerremittances applied
Supplier purchaseorders
Supplier paymentsmade
Management reportsdistributed
Employee expensereports submitted
Employee benefitenrollment
Employee recordsupdated
State ofOregon
Peer Group
Note: Oregon’s percentages are likely understated due to lack of available data, but are determined to be directionally correct

NASACT 2014 conference | 13
© 2014 The Hackett Group, Inc. All rights reserved. Reproduction of this document or any portion thereof without prior written consent is prohibited.
Human Resources is another key area with little investment in technology

NASACT 2014 conference | 14
© 2014 The Hackett Group, Inc. All rights reserved. Reproduction of this document or any portion thereof without prior written consent is prohibited.
Legal Entities
Operating locations
Countries
Employees
Revenue (BN $US)
$1B $3B $7B $20B
5K 8K 17K 40K
5-23 24-48 >482-4
7-49 50-99 100-300<7
3-35 36-90 91-200<3
<2
>300
>200
Peer Group MedianState of Oregon
We do things differently here…
13.05.3
4516
1
206 1,204
1 165

NASACT 2014 conference | 15
© 2014 The Hackett Group, Inc. All rights reserved. Reproduction of this document or any portion thereof without prior written consent is prohibited.
44%
23%
43%
26%
24%
45%51%
47%
34%48%
40%
41%
26%32%20%18%14%
16%6%6%6%
15%23%
36%
51%
29%
3% 9% 6%18%
Innovation in strategicvision
Partnership orientationManagement ofSupplier Performance
BusinessCommunications
OrganizationalAlignment
Customer ServiceOrientation
Effectiveness ofPurchasing Policies
and Procedures
Staff Capabilities
Strong/Exceeds expectations Average Falls short of expectations Needs major improvement
Stakeholder Survey summary results identify State of Oregon Procurement as predominately an "Administrator"
Representative Stakeholder Comments
• Over the past few years, I have seen some positive changes in procurement. I believe the leadership is trying to move the group in the right direction. Part of the solution will be to find that right level of risk and have strategies to manage it effectively…
• Provide more information to internal customers about what purchases must be on contract items and/or assist more with communicating how to better work with Procurement from the business user side…
• Increase performance by better understanding business needs, educating their customers and being more flexible to help solve business problems. Stop reducing performance by being less of a gatekeeper (i.e. saying "no, because..." instead of "no, instead you may...", and being more careful with processing certain transactions (seem overworked at times)
• Continue their work on improving business processes
15%
15%
29%
41%
Valued Business Partner Negotiations/Sourcing Expert
Gatekeeper Administrator
Performance of the Procurement OrganizationProcurement’s Role

NASACT 2014 conference | 16
© 2014 The Hackett Group, Inc. All rights reserved. Reproduction of this document or any portion thereof without prior written consent is prohibited.
From Hackett to the Future
Culture/Relationships The Oregon Legislature Department of Administrative Services and the Agencies The change that never comes Substantive Change IT Governance Human Resource Information System (HRIS) Payroll Consolidation