Using and creating Crosstabs in Crystal Reports - Monika & Juri
13
Using and creating Crosstabs in Crystal Reports Juri Urbainczyk – 27.08.2007 Using an creating Crosstabs in Crystal Reports ...................................................................................................... 1 What’s a crosstab? .................................................................................................................................................. 1 Usage....................................................................................................................................................................... 2 Working with crosstabs ........................................................................................................................................... 2 Creation ............................................................................................................................................................... 2 Configuration ...................................................................................................................................................... 3 Static Formatting ..................................................................................................................................................... 4 Caveat ................................................................................................................................................................. 4 Styles ................................................................................................................................................................... 4 Customize Style .................................................................................................................................................. 5 Dynamic Formatting ............................................................................................................................................... 6 Highlighting Expert............................................................................................................................................. 6 Object Formatting with Formula Workshop ....................................................................................................... 6 Alternating Background Color ............................................................................................................................ 7 Changing crosstabs at runtime ...............................................................................................................................10 Dynamic Dimensions .........................................................................................................................................10 Dynamic Facts....................................................................................................................................................11 Integration of Crosstabs and Standard Reports ......................................................................................................12 Images in Crosstabs ...............................................................................................................................................12 This document describes the usage of crosstabs with Crystal Reports (focusing on version XI). While there can be no total coverage of the topic, the paper concentrates on the necessities in BI projects. However, after reading this document a developer should be able to create sensible and fully functional crosstabs. What’s a crosstab? A cross tabular (abbreviated ‚crosstab’) is a tabular structure of a report, which allows dimensions to be displayed as well on the X- as on the Y-axis (“rows” or “columns”). The facts, which correspond to the current dimension values, are shown in that table cell, which lies at the crosssing of both the X- and Y-axis values. In that respect, a crosstab is similar to a pivot table, but normally the dimensions shown cannot be changed by the user (a work around is described in chapter “Dynamic Dimensions”). For rows and columns, respectively, as many dimension levels as possible can be chosen. However, the dimensions should have a sensible 1-many relationship, e.g. as first level manufacturer and as second level car and not the other way round. The following picture shows a crosstab example with two dimension levels on both the X- and the Y-axis. The crosstab is heavily formatted. How create and format such a crosstab will be shown in the rest of the document.
Transcript of Using and creating Crosstabs in Crystal Reports - Monika & Juri

Using and creating Crosstabs in Crystal Reports Juri Urbainczyk – 27.08.2007
Using an creating Crosstabs in Crystal Reports ...................................................................................................... 1 What’s a crosstab? .................................................................................................................................................. 1 Usage....................................................................................................................................................................... 2 Working with crosstabs........................................................................................................................................... 2
Creation............................................................................................................................................................... 2 Configuration ...................................................................................................................................................... 3
Static Formatting..................................................................................................................................................... 4 Caveat ................................................................................................................................................................. 4 Styles................................................................................................................................................................... 4 Customize Style .................................................................................................................................................. 5
Dynamic Formatting ............................................................................................................................................... 6 Highlighting Expert............................................................................................................................................. 6 Object Formatting with Formula Workshop ....................................................................................................... 6 Alternating Background Color ............................................................................................................................ 7
Changing crosstabs at runtime ...............................................................................................................................10 Dynamic Dimensions .........................................................................................................................................10 Dynamic Facts....................................................................................................................................................11
Integration of Crosstabs and Standard Reports ......................................................................................................12 Images in Crosstabs ...............................................................................................................................................12
This document describes the usage of crosstabs with Crystal Reports (focusing on version XI). While there can
be no total coverage of the topic, the paper concentrates on the necessities in BI projects. However, after reading
this document a developer should be able to create sensible and fully functional crosstabs.
What’s a crosstab? A cross tabular (abbreviated ‚crosstab’) is a tabular structure of a report, which allows dimensions to be
displayed as well on the X- as on the Y-axis (“rows” or “columns”). The facts, which correspond to the current
dimension values, are shown in that table cell, which lies at the crosssing of both the X- and Y-axis values. In
that respect, a crosstab is similar to a pivot table, but normally the dimensions shown cannot be changed by the
user (a work around is described in chapter “Dynamic Dimensions”). For rows and columns, respectively, as
many dimension levels as possible can be chosen. However, the dimensions should have a sensible 1-many
relationship, e.g. as first level manufacturer and as second level car and not the other way round.
The following picture shows a crosstab example with two dimension levels on both the X- and the Y-axis. The
crosstab is heavily formatted. How create and format such a crosstab will be shown in the rest of the document.

Usage In contradiction to normal reports, a crosstab only features few possibilities for formatting and navigation:
• A Crystal Report crosstab does not allow drilling into deeper dimension levels. All needed dimension
levels have to be defined from the beginning by the developers.
• All cells of a crosstab, with the exception of the summary cells, must have the same width and height. If
one has to display values which differ very much in size, a crosstab could prove unpractical.
• There is no standard functionality to display images and icons in the cells of a crosstab. Therefore,
crosstabs are not a good choice for cockpit reports and traffic light features. The chapter “Images in
Crosstabs” shows a potential workaround.
Thus, a crosstab should only be used when the conceptual requirements clearly ask for it. Generally speaking, a
crosstab is needed if there are more than one independent dimension in the same report, which consist of more
then three elements each, and if there are requirements for summaries independently or maybe even combined
for all dimensions.
Bottom line, a standard report should be realized with “normal” Crytstal Reports. Crosstabs should be used in
special cases.
Because of better readability, the author proposes to use the dynamic formatting (see also “Dynamic
Formatting”). If there is need for it, editable dimensions and facts should be used (see also “Changing crosstabs
at runtime”).
Working with crosstabs
Creation A crosstab can be created with the menu „Insert-Crosstab“. Then, a rectangular shape appears, which can be
dragged upon the report. Typically, the crosstab will be placed in the report footer (s. “Integration of Crosstabs
and Standard Reports”). After that the “crosstab expert” can be opened using the context menu, which can only
be reached via the small rectangular area in the upper left corner of the crosstab. In the crosstab expert, the
various dimensions and facts can be defined (s. picture).
To do this, one drags the needed field from the „fields“-list in the corresponding target list „rows“, „columns“ or
„summarized fields“. One can also use the arrow keys. The sequence of the fields in the crosstab expert also
defines the sequence, in which they occur in the crosstab. Above all, the sequnce of the entries in the listes

“rows” and “columns” governs the appearance of the dimension levels. The next picture shows the dependencies
between the elements in the crosstab and the crosstab expert.
Additionally, you can also choose the facts in the crosstab expert, which are called „summarized fields“. You
can define as much facts as you want. Normally, they will be displayed one under another in each cell of the
crosstab. The operation needed to summarize the fact can be changed, using the button “change summary” on the
respective fact. For example the operation can be changed from “sum” to “maximum” or “average”.
If they don’t speak for themselves, Crystal Reports can show labels for each fact. To that end, you select the tab
“Customize style” in the crosstab expert. There you find the checkbox “Show labels” in the box “Summarized
fields” (s. picture). When you activate this checkbox, a separate column is generated which containes the labels
for the facts.
As a default, Crystal Reports takes the internal field names for the labels. Using the context menu entry “Edit
Text” you can change the standard text and replace it by a sensible name (s. picture).
Configuration Normally, Crystal Reports defines a summary columns (or line) for each level of each dimension. The summary
(called “Subtotal”) can be switched on and off for every dimension level separately (s. picture). To that end, you
have to go to the tab „Customize Style“ in the crosstab expert and select the respective dimension level with the
mouse. Then, you switch the checkbox “Suppress Subtotal” in the „Group Options“ on or off. The summaries in
the highest level can be changed using the checkboxes “Suppress Row Grand Totals” and “Suppress Column
Grand Totals”.

Additionally, you can customize wheather the totals and subtotals should appear on top or on the bottom, or left
or right, respectively. The checkboxes “Column Totals on Top“ or „Row Totals on Left” can be used for that.
On the same tab „Customize Style” there are also the checkboxes “Suppress Empty Rows” and “Suppress Empty
Columns”. If they are activated, rows or columns, which contain true null values, will not be displayed.
Static Formatting
Caveat All formatting options should also be checked using the HTML preview, in order to ensure that the intended
layout is achieved on the web as well.
Styles First, the crosstab as a whole can be given a backgound color. This background color is used every time, when
there is no other background color defined for other elements (e.g. cells). The general background color can be
changed with the “Format crosstab” option, reachable via the context menu of the crosstab (s. picture).
Along with Crystal Reports come various different styles for crosstabs. These styles can be selected in the
crosstab expert tab “Style”. However, this feature should be handled carefully, because selecting a style
overwrites all formatting opions selected earlier. Unfornately, it is not possible to define new styles, which are
selectable on the “Style” tab.

Customize Style Of course, the formatting of the crosstab can be changed more fine-grained. This is also done in the crosstab
expert tab “Customize Style”. There, you can also define a background color separately for the totals and for
each dimension level (s. picture). The format of the gridlines (lines separating the table cells) can be changed as
well. To that end, you can click on the button “Format Grid Lines”.
You can select the color from a predefined palette or define a new one using RGB values. The color selected for
a row or a columsn is used as well for the corresponding axis label (dimension) and as for the facts.
If you select a color as well for row as for column, the column color is preferred (s. picture).
If you define different colors for different dimension levels, the color of the most detailed level also applies to
the facts. The color of the highest level only applies to this level itself and – if applicable – to the summary
column (s. picture).
Unfornately, the crosstab expert only allows for static color definitions. The formula workshop can not be
opened to define the color dynamically. Therefore, it is not possible to let the background color be dependent

from certain conditions. To achieve that, the formatting of the elements within the cells must be changed (more
on that further down).
Dynamic Formatting
Highlighting Expert There is more than one way to achieve dynamic formatting of crosstabs with Crystal Reports. The first
possibility is the so-called “Highlighting expert” (s. picture).
Using the highlighting expert makes sense, whenever the formatting should be dependent on the contents of the
cell (e.g. red font color, if a certain value is over limit).
Object Formatting with Formula Workshop Another option is the formating of the objects which are contained in the cells of the crosstab. To that end, you
select all the relevant objects in design mode and open the format editor using the context menu (s. picture):
The format editor allows changing the background color of the objects. Here you can also open the Formula
Workshop with the button and insert a formula (function) for the background color. The formula may be
written in Crystal Report or Visual Basic Syntax and has to return a color value, which will be applied to the
background color during execution. Crystal Reports already comes with certain color constants predefined (e.g.
crRed or crBlack). Alternatively, you can use the function Color(R,G,B) and defined a new color using the red,
green and blue values (between 0 and 255) of this color. With this method you can apply dynamic formatting to
all objects in a crosstab. The following picture shows for example a formula, which sets the background color to
either red or blue, dependent on the current value of the field.

Alternating Background Color The last mentioned method also allows for complex color arrangements. Often, one wants to have a change of
the background color between to adjacent lines in the crosstab, in order to differentiate them better. An exemple
can be seen in the next screenshot:
To achieve this result, you have to enter a formula in Visual Basic Syntax for all relevant objects. The VB syntax
is necessary, because global variables are used. In the formula editor you first switch the syntax to VB. Then,
you enter the following lines of code, starting with “Rem Formula” in the first line, in order to thell Crystal to
recognize it as VB formula:
Rem Formula BackgroundColor
Global RowNumber as Number
Global RowName as String
Global ColName as String
if (RowName <> GridRowColumnValue ("WZ")) then
RowNumber = RowNumber + 1
RowName = GridRowColumnValue ("WZ")
end if
if (ColName <> GridRowColumnValue ("NL")) then
RowNumber = 0
ColName = GridRowColumnValue ("NL")
end if

if (Remainder(RowNumber,2) = 0) then
formula = Color(236,236,236)
else
formula = Color(224,224,224)
end if
The formula applies the following algorithm:
1. Global variables are defined (since they must stay untouched from one object to another)
2. If the global variable “RowName” is not equal to the current value of the dimension in the line (which
is always true in the first cell), a line change has occurred. Then, the current value of the line dimension
gets stored in “RowName”. Furthermore, the variable “RowNumber” is increased by one.
3. If the global variable “ColName” is not equal to the current value of the column dimension (which is
always true in the first cell), a row change has occurred. Then, the current value of the column
dimension is stored in the variable “Colname”. Furthermore, the variable “RowNumber is set back to
zero, since we are back in the first line of a new column.
4. Finally, the algorithm checks, if the value of the variabel “RowNumber” is odd or even (can be devided
by two). Depending on that, the color of the object is set with the Color(R,G,B) function.
The built-in function “GridRowColumnValue“ is used in the algorithm above. This function returns the current
value of the given dimension level (row or column). The parameter of the function is the alias (a symbolic name)
of the dimension level (in the code shown the “WZ” or “NL”). This alias can be defined for every dimension
level in the crosstab expert on the tab “Customize Style” (s. picture).
This algorithm works very well so far and can be applied also to columns instead of rows – or any combination
of the two. You can also applie it to dimension headers, if you want to display them in alternating colors.
However, there can be only a sensible result, if the value of dimension can be found by
“GridRowColumnValue“. If no dimension value is defined (e.g. when rendering the summary column), an
exception occurs and no color can be returned. That’s the reason, why the summary column has a white
background in the picture above.
Furthermore, the cell margins have to be considered. As a default, Crystal Reports displays the crosstab cells
with a small margin (and it seems that one cannot change this default size). Using the context menu options of
the crosstab “Grid Options / Show Cell Margins” the margins can be scwitched on an off. If an object formatting
is in place, the following ugly result can be seen:

Thus, the author recommends disabling the margins when using the object formatting. If the result seems to be to
narrow, you can use the “Display String” feature in the “Common” tab of the format editor. There, you can
defined the function ‚ ‚+CStr(CurrentFieldValue)+‚ ‚ which leads to at least one space character
distance between the grid lines and the contents.
As an alternative, the grid lines and the general background color can be disabled. This may give the following
result:

Changing crosstabs at runtime
Dynamic Dimensions Often there is the requirement that users want to change the structure of the crosstab during runtime (without
going back to the development department). One change often adressed is the change of a dimension or a
dimension level. For example, the X-axis should not display the organizational structure but the year of
construction, which is equal to a dice operation in OLAP.
In order to achieve this, a new parameter must be defined for the report. In the field explorer you simply choose
“new” on the parameter subtree. In the following dialog (s. picture) you can specify the parameter. For the
example, we name the parameter “Col” and allow that the two fixed values “NL” or “BJ” may be entered. These
value can be chosen freely, by one selected they have to be used as such in the whole report.
After that, we navigate to the crosstab expert and create a new formula by klicking on the button “New
Formula”. Then, a new dialog appears, which allows entering the name of the formula. We enter “NL or BJ”.
With „Edit Formula“ we can open the formula workshop and can enter the formula: if ({?Columns} = 'NL') THEN
{xy.niederlassung}
ELSE
{xy.baujahr}
This formula returns the subsidiary or the construction year, depending on the value of the parameter. In the
crosstab expert this formula appears in the “Available field” list. Then, we drag it in the list “Columns” (s.
picture).

As a consequence, the second level of the dimension now is dependent on the current value of the parameter.
The user can choose during runtime, wheather he wants to see the organizational structure (subsidiary) or the
year of construction (s. the following screenshots).
Parameter = NL
Parameter = BJ
Dynamic Facts Facts can be changed during runtime as well. To do this, a further parameter is necessary, which will be set by
the user when the report starts. Depending on the value of the parameter, the fact shown is different. Again, a
corresponding formula has to be written, which checks the value of the parameter using an “if” statement. This
formula has to be selected in the crosstab expert for “Summarized fields”.

Integration of Crosstabs and Standard Reports In order to display one crosstab all by itself, this crosstab should be placed in the report footer. Alternatively, the
crosstab may also be placed in the header or footer of a group. This generates a new instance of the crosstab for
every value in the group, which can make sense. If the group is identical with one of the dimension in the
crosstab, the value of this dimension is fixed for that instance of the crosstab. The following picture shows a
group, which only contains a sum of the “tool count”. For every value of the group there is an instance of the
crosstab, which only show the data relevant to this part of the group.
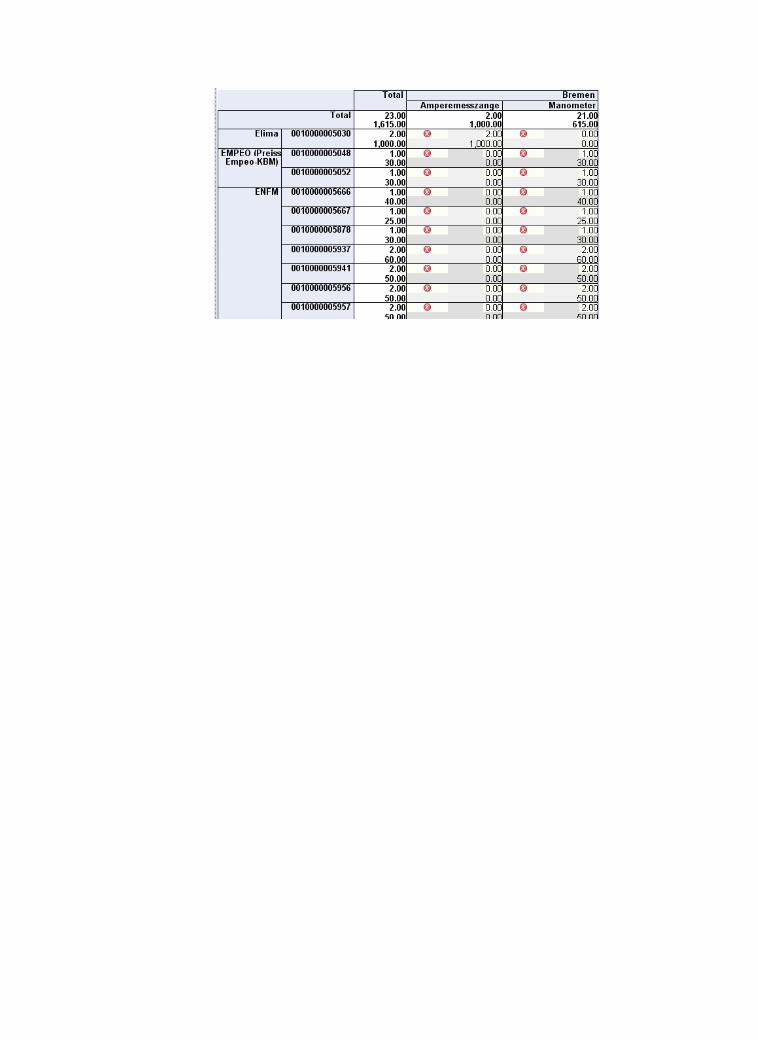
Images in Crosstabs There is no standard way in Crystal Reports to display icons or images in the cells of a crosstab. If you want to
achieve this nevertheless, you can use CSS (cascading style sheets). Beware, that CSS only effects the web
viewer of Crystal and not the standard preview.
In the CSS file you define one ore more classes featuring a background image. The imgage should be displayed
only once per obkect (“no-repeat”): .crosstab_cell_img
{
font-size: 9pt;
font-weight: normal;
font-family: Arial, verdana;
text-align: right;
background-image: url("H:/reports/icons/delete.jpg");
background-repeat:no-repeat;
}
The following picture shows the result. Since the CSS classes can be defined dynamically inCrystal (using the
formula workshop again), it is possible to display another image, depending on the current value in the crosstab.