Using an emulator
43
Using an emulator
-
Upload
tertius-aric -
Category
Documents
-
view
51 -
download
0
description
Using an emulator. Outline. So we’ve built an emulator – what can we use it for? Prediction What would the simulator output y be at an untried input x? Uncertainty analysis Given uncertainty in x, what is the implied uncertainty in y? Sensitivity analysis - PowerPoint PPT Presentation
Transcript of Using an emulator

Using an emulator

Outline
So we’ve built an emulator – what can we use it for?
PredictionWhat would the simulator output y be at an untried input x?
Uncertainty analysisGiven uncertainty in x, what is the implied uncertainty in y?
Sensitivity analysisWhich inputs influence the output most?
Which inputs are responsible for most output uncertainty?
CalibrationGiven observation of the real system, how can we use that to learn about the best input values?
MUCM short course - session 4 2

Prediction and UA

Prediction
Prediction is simple because that’s precisely what the emulator does
For any given x, the emulator mean E(f(x)) is an estimate
The emulator variance var[f(x)] expresses uncertaintyKnown as code uncertainty
Similarly, given x and some threshold c we can evaluate P[f(x) > c]
MUCM short course - session 4 4

y sample: 10000
-0.4 -0.2 0.0 0.2
0.0 2.5 5.0 7.5 10.0
If X has distribution g(x) then UA looks at the implied distribution of Y = f(X)
How do we evaluate that?
In Session 1 we used Monte Carlo for a simple nonlinear simulator
Mean = 0.117
Median = 0.122
Std. dev. = 0.048
But all these are estimatesAccuracy depends on the size of the Monte Carlo sample
95% interval for the mean is (0.116, 0.118)
Uncertainty analysis
MUCM short course - session 4 5

UA with an emulator
Consider the expected output M = E[Y]
It is uncertain because of code uncertainty
The emulator mean value for M is E[M] = ∫ E[f(x)] g(x) dx
We can evaluate this by Monte CarloSample many values of x, evaluate the emulator mean E[f(x)] for each and average them
This is already much faster than making many simulator runs to evaluate f(x)
But we can often do the integral exactly
MUCM short course - session 4 6

Why emulation is more efficient
Similarly we can evaluate var[M]This is code uncertainty and depends on the number of simulator runs to build the emulator
We want to compute/estimate M sufficiently accurately, so we want var[M] sufficiently small
Emulation is more efficient because we can typically achieve the desired accuracy using far fewer simulator runs to build the emulator than using traditional methods
For the simple nonlinear model, using only 25 simulator runs to build the emulator, a 95% interval for M is (0.1173, 0.1179)
Using the emulator we can also compute/estimate all those other quantities of interest, like var[Y] or P[Y > c]
MUCM short course - session 4 7

Sensitivity analysis

MUCM short course - session 4 9
Sensitivity analysis
Which inputs affect the output most?
This is a common question
Sensitivity analysis (SA) attempts to address it
There are various forms of SA
The methods most frequently used are not the most
helpful!

Recap – the nonlinear model
The simple nonlinear model of the first session
y = sin(x1)/{1+exp(x1+x2)}
Just two inputs
Uncertainty analysis:Normal distributions on inputs
Output mean = 0.117, median = 0.122
Std. dev. = 0.048
Which of these two inputs influences output most?And in what ways?
MUCM short course - session 4 10

MUCM short course - session 4 11
Local sensitivity analysis
To measure the sensitivity of y to input xi, compute the derivative of y with respect to xi
Nonlinear model:At x1 = x2 = 0.5, the derivatives are
wrt x1, 0.142; wrt x2, –0.094
How useful is this?Derivatives evaluated only at the central estimate
Could be quite different at other points nearby
Doesn’t capture interactions between inputsE.g. sensitivity of y to increasing both x1 and x2 could be greater or less than the sum of their individual sensitivities
Not invariant to change of units

MUCM short course - session 4 12
One-way SA
Vary inputs one at a time from central estimateNonlinear model:
Vary x1 to 0.25, 0.75, output is 0.079, 0.152
Vary x2 to 0.25, 0.75, output is 0.154, 0.107
Is this more useful?Depends on how far we vary each input
Relative sensitivities of different inputs change if we change the ranges
But ranges are arbitrary
Also fails to capture interactionsStatisticians have known for decades that varying factors one at a time is bad experimental design!

MUCM short course - session 4 13
Multi-way SA
Vary factors two or more at a timeMaybe statistical factorial design
Full factorial designs require very many runs
Can find interactions but hard to interpretOften just look for the biggest change of output among all runs
Still dependent on how far we vary each input

MUCM short course - session 4 14
Probabilistic SA
Inputs varied according to their probability distributionsAs in Uncertainty Analysis (UA)
Sensitivities still depend on ranges of distributions (variances), but these are now not necessarily arbitrary
Gives an overall picture and can identify interactions
MUCM short course - session 4 15
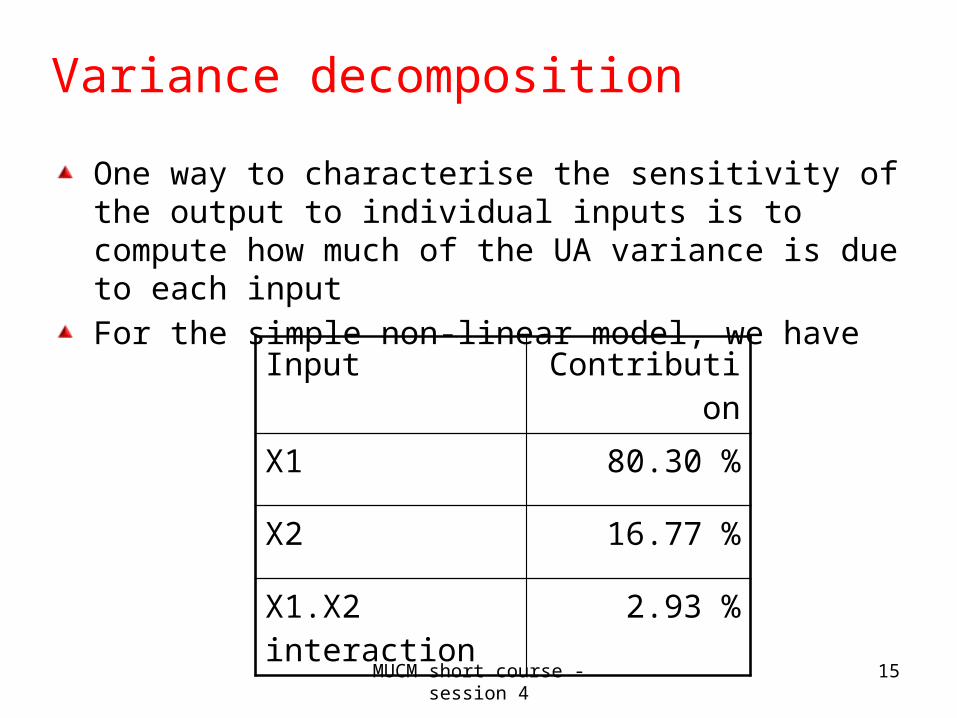
Variance decomposition
One way to characterise the sensitivity of the output to individual inputs is to compute how much of the UA variance is due to each input
For the simple non-linear model, we have
Input Contribution
X1 80.30 %
X2 16.77 %
X1.X2 interaction 2.93 %

MUCM short course - session 4 16
Main effects
We can also plot the effect of varying one input averaged over the others
Nonlinear modelAveraging y = sin(x1)/{1+exp(x1+x2)} with respect to the uncertainty in x2, we can plot it as a function of x1
Similarly, we can plot it as a function of x2 averaged over uncertainty in x1
We can also plot interaction effects

MUCM short course - session 4 17
1 2
1.00.50.0
0.15
0.10
0.05
0.00
x
y
Main effects in the simple nonlinear model
Red is main effect of x1 (averaged over x2)
Blue is main effect of x2 (averaged over x1)

MUCM short course - session 4 18
Joint effect in the simple nonlinear model
-1-0.5
00.5
11.5
2
x2
-1
-0.5
0
0.5
1
1.5
2
x1
-0.8
-0.6
-0.4
-0.2
00
.20
.40
.6jo
int
eff
ect
MUCM short course - session 4 19
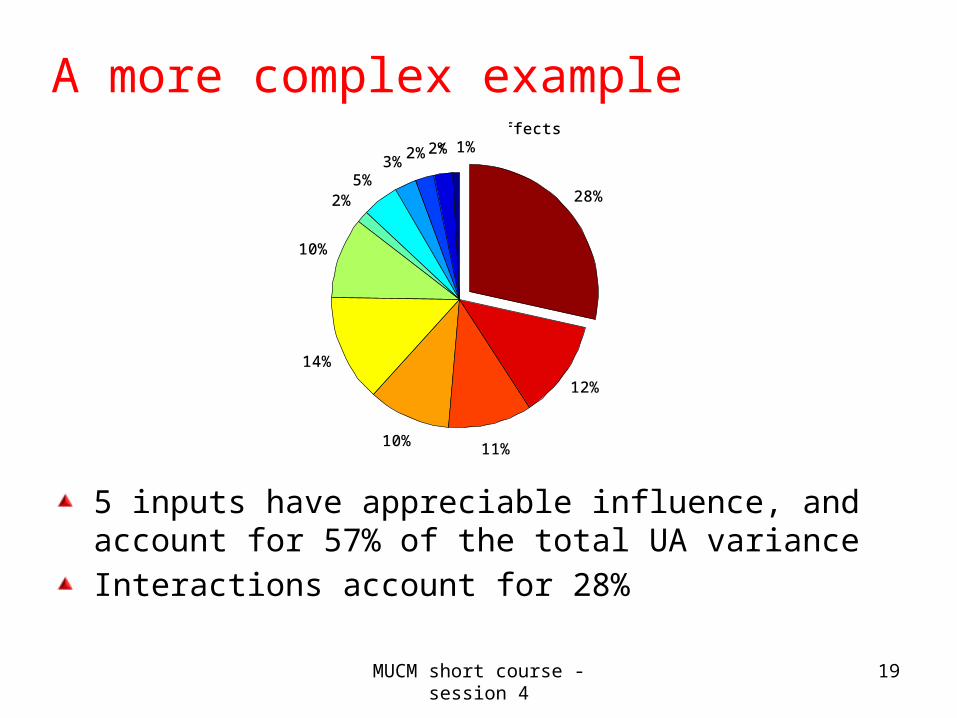
A more complex example
5 inputs have appreciable influence, and account for 57% of the total UA variance
Interactions account for 28%
< 1%2%2%3%
5%2%
10%
14%
10% 11%
12%
28%
True main effects1%2%2%3%
4%1%
9%
13%
11%10%
13%
29%
Estimated main effects
MUCM short course - session 4 20
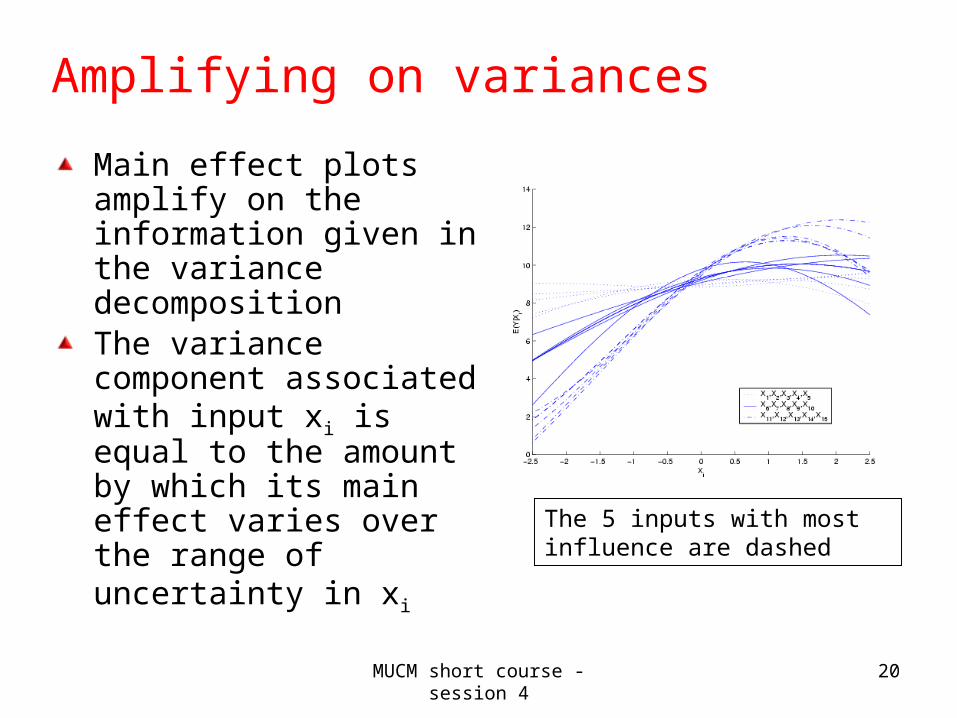
Amplifying on variances
Main effect plots amplify on the information given in the variance decompositionThe variance component associated with input xi is equal to the amount by which its main effect varies over the range of uncertainty in xi
The 5 inputs with most influence are dashed

Demonstration with GEM-SA

GEM-SA
GEM-SA is a user-friendly piece of software that does many of the things we’ve been discussing
Can create some kinds of design
Fits an emulator to simulator output
Computes uncertainty and sensitivity analyses
It’s freely availablehttp://tonyohagan.co.uk/academic/GEM
It’s really useful for experimenting with relatively simple simulators
But not always reliable
MUCM short course - session 4 22

MUCM short course - session 4 23
menu
Log window
toolbar
Sensitivity analysis output grid
The main GEM-SA window

MUCM short course - session 4 24
Toolbar icons
New project
Open project
Save project
Print output report
Edit project
Generate input design points
Rescale an input
Standardise design
Copy input design to clipboard
Convert input to integer
Run the analysis
Help

MUCM short course - session 4 25
Output tabs
When an emulator has been fitted, the contents of these tabs will provide the main resultsSensitivity Analysis. This will report the SA variance decompositions
One line for each input parameterOne line for each pair of inputs, if joint effects are selected
Main effects. This will plot the main effects of the various inputsResults Summary. This will present numerical summaries of emulator fit and uncertainty analysis

MUCM short course - session 4 26
Log Window output
Tells usWhich training data are being loaded/saved
Transformations applied to the data
Fitted Gaussian process parameters
Summary of cross-validation analysis
Summary of the uncertainty analysis
MUCM short course - session 4 27
Example
The GEM-SA package includes a number of datasets to play with
One of these is from the ForestETP vegetation simulator7 input parameters
120 simulator runs
Objective: conduct a variance-based sensitivity analysis To identify which uncertain inputs are driving the output uncertainty.

MUCM short course - session 4 28
Exploratory scatter plots

First impressions
Looks like X6 is most important, and probably also X5
But these plots are hard to read because of the scatter
GEM-SA fitted an emulator and carried out the uncertainty and sensitivity analyses
MUCM short course - session 4 29

MUCM short course - session 4 30
Variance of main effects
Main effects for each input. Input 6 has the greatest individual contribution to the variance
Main effects sum to 66% of the total variance

MUCM short course - session 4 31
Main effect plots

MUCM short course - session 4 32
Main effect plots
Fixing X6 = 18, this point shows the expected value of the output (obtained by averaging over all other inputs).
Simply fixing all the other inputs at their central values and comparing X6=10 with X6=40 would underestimate the influence of this input
(The thickness of the band shows emulator uncertainty)

Interactions and total effects
Main effects explain only 2/3 of the varianceModel must contain interactions
Any input can have small main effect, but large interaction effect, so overall still an ‘important’ input
We can ask GEM-SA to compute all pair-wise interaction effects
435 in total for a 30 input model – can take some time!
Useful to know what to look for
MUCM short course - session 4 33

MUCM short course - session 4 34
Interactions and total effects
For each input Xi
Total effect = main effect for Xi + all interactions involving Xi
Assumes independent inputsMain effects and total effects normalised by varianceTotal effect >> main effect implies interactions in the model Look for inputs with large total effects relative to main effects
Investigate possible interactions involving those inputs

MUCM short course - session 4 35
Interactions and total effects
Total effects for inputs 4 and 7 much larger than their main effects.
Implies presence of interactions.

Interaction effects
Ask GEM-SA to compute pair-wise joint effect variancesAll interactions between X4, X5, X6, X7
MUCM short course - session 4 36

MUCM short course - session 4 37
Main and interaction effects
Note interactions involving inputs 4 and 7
Main effects and selected interactions now sum to almost 92% of the total variance

What have we learnt here?
Most important inputs are X4, X5, X6, X7We can more or less ignore X1, X2, X3
Together these 3 account for < 10% of overall variance
X6 is most important single input 36% of variance
Has only minor interactions with other inputs
X4, X5, X7 interact in complex waysBut together account for over 50% of variance
Main effect plots are usefulParticularly for X6
But less so for the others! Need to look at how they interact
MUCM short course - session 4 38

MUCM short course - session 4 39
SA summary
Why SA?
1. For the model user: SA identifies which inputs it would be most useful to reduce uncertainty about
2. For the model builder: main effect and interaction plots demonstrate how the simulator is behaving
Sometimes surprisingly!

Calibration

Calibration
Simulator users often want to tune the simulator using observations of the real system
Adjust the input parameters so that the simulator output matches observations as well as possible
Two very important points1. Calibration will reduce uncertainty about x but will not
eliminate it
2. It is necessary to understand how the simulator relates to reality
Model discrepancy
MUCM short course - session 4 41

Model discrepancy
Simulator output y = f(x) will not equal the real system value z
Even with best/correct inputs x
Model discrepancy is the difference z – f(x)
As discussed in Session 1, model discrepancy is due toWrong or incomplete science
Programming errors, rounding errors
Inaccuracy in numerically solving systems of equations
Ignoring model discrepancy leads to poor calibrationOver-fitting of parameter estimates
Over-confidence in the fitted values
MUCM short course - session 4 42

Resources for calibration
Calibration is beyond the scope of this course
But there is material in the toolkit on calibration and model discrepancy
GEM-Cal is an extension of GEM-SA that does some simple calibration
http://tonyohagan.co.uk/academic/GEM
MUCM short course - session 4 43


![Android Environment Emulator · 2020. 5. 7. · Android Emulator Android Emulator –How to use the SDCARD device The general syntax to create an SD card is mksdcard [ -l label ]](https://static.fdocuments.us/doc/165x107/614a810e12c9616cbc697561/android-environment-emulator-2020-5-7-android-emulator-android-emulator-ahow.jpg)