
Using an Artificial Financial Market for studying a ... · Using an Artificial Financial Market...
13
Using an Artificial Financial Market for studying a Cryptocurrency Market Luisanna Cocco, Giulio Concas and Michele Marchesi University of Cagliari, Italy Dipartimento Ingegneria Elettrica ed Elettronica Email: [luisanna.cocco, concas, michele]@diee.unica.it Abstract—This paper presents an agent-based artificial cryp- tocurrency market in which heterogeneous agents buy or sell cryptocurrencies, in particular Bitcoins. In this market, there are two typologies of agents, Random Traders and Chartists, which interact with each other by trading Bitcoins. Each agent is initially endowed with a finite amount of crypto and/or fiat cash and issues buy and sell orders, according to her strategy and resources. The number of Bitcoins increases over time with a rate proportional to the real one, even if the mining process is not explicitly modelled. The model proposed is able to reproduce some of the real statistical properties of the price absolute returns observed in the Bitcoin real market. In particular, it is able to reproduce the autocorrelation of the absolute returns, and their cumulative distribution function. The simulator has been implemented using object-oriented technology, and could be considered a valid starting point to study and analyse the cryptocurrency market and its future evolutions. Index Terms—Artificial Financial Market, Cryptocurrency, Bitcoin, Heterogeneous Agents, Market Simulation I. I NTRODUCTION Cryptocurrencies are digital currencies alternative to the legal ones. A cryptocurrency is a computer currency whose implementation is based on the principles of cryptography, used both to validate the transactions and to generate new cur- rency. The cryptocurrency implementation often use a proof- of-work scheme recording all transactions in a public ledger in order to protect sellers from fraud. Most of cryptocurrencies are designed to gradually introduce new currency, placing a ceiling on the total amount of money in circulation, to avoid the inflation phenomena as often happens for ”fiat” currencies. The most popular cryptocurrency is undoubtedly Bitcoin. It was created by a computer scientist known as ”Satoshi Nakamoto” whose real identity is still unknown [20]. Like the other cryptocurrencies, Bitcoins use cryptographic techniques, and thanks to an open source system anyone is allowed to control and modify the source code of the Bitcoin software. The Bitcoin network is a peer-to-peer network that checks and monitors both the generation of new Bitcoins, (aka ”mining”) and the transactions in Bitcoins. This network includes a high number of computers connected to each other through the Internet. It performs complex mathematical procedures which give life to the mining and verify the correctness and truthfulness of the Bitcoin transactions. The Bitcoin system provides a ceiling on the amount of money in circulation, equal to 21 million of Bitcoins, conse- quently there is not the risk that the number of coins increases too much, devaluating the currency. Bitcoin has several attractive properties for consumers. At first, it does not rely on a central bank or a government to regulate the money supply. It enables quasi- anonymous transactions, providing a greater anonymity than traditional electronic payments. In addition, Bitcoin transactions are irreversible and can also be very small. Indeed, a Bitcoin transaction can involve only one ”Satoshi”, a subunit equal to 10 -8 of a Bitcoin. The Bitcoin can be purchased on appropriate websites such as Crypto Trade CoinMKT, BTC-and Vircurex, Cryptsy, Coinbase, UpBit and Vault of Satoshi, that allow to change fiat cash in Bitcoins. Other sites offer online services, or goods exchange for goods, and accept payments in Bitcoins. The Bitcoin allow everyone to send cryptocurrency internationally at a very small expense. Over the past years, interest in digital currencies has in- creased. Indeed, Bitcoin had a rapid growth, both in value and in the number of transactions since its beginning in early 2009. The BlockChain 1 Web site provides different graphs and statistical analysis about Bitcoins. In particular, we can observe the time trend of the Bitcoin price. Between January 2009 and January 2010 there were no exchanges on the market. Between February 2010 and May 2010 two consumers made the first real-world transactions. One bought 2 pizzas for 10,000 BTC, and another auctioned 10,000 BTC for $50. In June 2010, the price grew from $0.008 to $0.08 for 1 bitcoin. Thereafter, the price slowly rose until a peak of $1,150 was reached in December 2013. In the same month, the Bitcoin price crashed to $600, rebounded to $1,000, then crashed again to the $500 range. In January 2014 the price settled in the $800-$900 range and in February and March it fell following the shutdown of historical MTGOX exchange site and reports regarding Bitcoin ban in China. As of April 2014, one Bitcoin is priced at about $400. The recent attention given to Bitcoin and in general to the 1 BlockChain is a web site which displays detailed information about all transactions and Bitcoin blocks, providing graphs and statistics on different data, (https://blockchain.info/). We used this web site for extracting the empirical data (such as daily data about price, unique address number and bitcoin number, in the period between January 1, 2012 and April 10, 2014) used in this work. arXiv:1406.6496v1 [q-fin.TR] 25 Jun 2014
Transcript of Using an Artificial Financial Market for studying a ... · Using an Artificial Financial Market...

Using an Artificial Financial Market for studying aCryptocurrency Market
Luisanna Cocco, Giulio Concas and Michele MarchesiUniversity of Cagliari, Italy
Dipartimento Ingegneria Elettrica ed ElettronicaEmail: [luisanna.cocco, concas, michele]@diee.unica.it
Abstract—This paper presents an agent-based artificial cryp-tocurrency market in which heterogeneous agents buy or sellcryptocurrencies, in particular Bitcoins. In this market, thereare two typologies of agents, Random Traders and Chartists,which interact with each other by trading Bitcoins. Each agentis initially endowed with a finite amount of crypto and/or fiatcash and issues buy and sell orders, according to her strategyand resources. The number of Bitcoins increases over time witha rate proportional to the real one, even if the mining process isnot explicitly modelled.
The model proposed is able to reproduce some of the realstatistical properties of the price absolute returns observed inthe Bitcoin real market. In particular, it is able to reproducethe autocorrelation of the absolute returns, and their cumulativedistribution function. The simulator has been implemented usingobject-oriented technology, and could be considered a validstarting point to study and analyse the cryptocurrency marketand its future evolutions.
Index Terms—Artificial Financial Market, Cryptocurrency,Bitcoin, Heterogeneous Agents, Market Simulation
I. INTRODUCTION
Cryptocurrencies are digital currencies alternative to thelegal ones. A cryptocurrency is a computer currency whoseimplementation is based on the principles of cryptography,used both to validate the transactions and to generate new cur-rency. The cryptocurrency implementation often use a proof-of-work scheme recording all transactions in a public ledger inorder to protect sellers from fraud. Most of cryptocurrenciesare designed to gradually introduce new currency, placing aceiling on the total amount of money in circulation, to avoidthe inflation phenomena as often happens for ”fiat” currencies.
The most popular cryptocurrency is undoubtedly Bitcoin.It was created by a computer scientist known as ”SatoshiNakamoto” whose real identity is still unknown [20]. Like theother cryptocurrencies, Bitcoins use cryptographic techniques,and thanks to an open source system anyone is allowed tocontrol and modify the source code of the Bitcoin software.The Bitcoin network is a peer-to-peer network that checks andmonitors both the generation of new Bitcoins, (aka ”mining”)and the transactions in Bitcoins. This network includes ahigh number of computers connected to each other throughthe Internet. It performs complex mathematical procedureswhich give life to the mining and verify the correctness andtruthfulness of the Bitcoin transactions.
The Bitcoin system provides a ceiling on the amount ofmoney in circulation, equal to 21 million of Bitcoins, conse-
quently there is not the risk that the number of coins increasestoo much, devaluating the currency.
Bitcoin has several attractive properties for consumers. Atfirst, it does not rely on a central bank or a governmentto regulate the money supply. It enables quasi- anonymoustransactions, providing a greater anonymity than traditionalelectronic payments. In addition, Bitcoin transactions areirreversible and can also be very small. Indeed, a Bitcointransaction can involve only one ”Satoshi”, a subunit equalto 10−8 of a Bitcoin.
The Bitcoin can be purchased on appropriate websitessuch as Crypto Trade CoinMKT, BTC-and Vircurex, Cryptsy,Coinbase, UpBit and Vault of Satoshi, that allow to change fiatcash in Bitcoins. Other sites offer online services, or goodsexchange for goods, and accept payments in Bitcoins. TheBitcoin allow everyone to send cryptocurrency internationallyat a very small expense.
Over the past years, interest in digital currencies has in-creased. Indeed, Bitcoin had a rapid growth, both in valueand in the number of transactions since its beginning in early2009. The BlockChain 1 Web site provides different graphsand statistical analysis about Bitcoins. In particular, we canobserve the time trend of the Bitcoin price.
Between January 2009 and January 2010 there were noexchanges on the market. Between February 2010 and May2010 two consumers made the first real-world transactions.One bought 2 pizzas for 10,000 BTC, and another auctioned10,000 BTC for $50.
In June 2010, the price grew from $0.008 to $0.08 for 1bitcoin. Thereafter, the price slowly rose until a peak of $1,150was reached in December 2013. In the same month, the Bitcoinprice crashed to $600, rebounded to $1,000, then crashed againto the $500 range. In January 2014 the price settled in the$800-$900 range and in February and March it fell followingthe shutdown of historical MTGOX exchange site and reportsregarding Bitcoin ban in China. As of April 2014, one Bitcoinis priced at about $400.
The recent attention given to Bitcoin and in general to the
1BlockChain is a web site which displays detailed information about alltransactions and Bitcoin blocks, providing graphs and statistics on differentdata, (https://blockchain.info/). We used this web site for extracting theempirical data (such as daily data about price, unique address number andbitcoin number, in the period between January 1, 2012 and April 10, 2014)used in this work.
arX
iv:1
406.
6496
v1 [
q-fi
n.T
R]
25
Jun
2014
cryptocurrencies shows that many consumers are turning theirattention toward new trading means to simplify their financiallives. Online purchases performed with cryptocurrency areanonymous, faster and simpler than the traditional credit cardsones.
While the popularity of cryptocurrencis has grown quickly,they still face important argument because of their unconven-tional way of working.
A lively debate is ongoing about promise, perils and risksof digital currencies and in particular of Bitcoin. Severalpapers appeared on these topics, but the attempts to studythe cryptocurrency market as a whole are very few. In thiswork, we propose an agent-based model aimed to study andanalyse the Bitcoin market as a whole. We try to reproducethe main stylized facts present in the real Bitcoin market, suchas the autocorrelation and the cumulative distribution functionof the price absolute returns. The model proposed simulatesthe Bitcoin transactions, by implementing a mechanism for theformation of the Bitcoin price, and a specific behavior for eachtypology of trader. The paper is organized in the following.In Section II we discuss other works related to this paper, inSection III we present our model in detail; Section IV dealswith the calibration of the model, and with the values given toseveral parameters of the model. Section V presents the resultsof the simulations, including an analysis of Bitcoin real prices.The conclusions of the paper are reported in Section VI.
II. RELATED WORK
The study and analysis of the cryptocurrency market is arelatively new field. In the last years, several papers appearedon this topic given its potential interest, and the many issuesrelated to it.
Androulaki et al. [2] studied the privacy guarantees ofBitcoin when Bitcoin is used as a primary currency for thedaily transactions. Moore [19], Hout et al. [13], Eyal et al. [10],Brezo et al. [6] and Hanley [12] analysed promise, perils, risksand issues of digital currencies. Bergstra et al. [4] investigatedtechnical issues about protocols and security, and issues aboutlegal, ethical and phychological aspects of cryptocurrencies.Singh et al. [29] proposed an additional layer of mutual trustbetween the payer and the paye,e in order to enhance thesecurity associated with fast transactions for the real Bitcointransaction network.
Only very few attempts have been made so far in orderto model the cryptocurrency market as a whole. Luther [17]studied why cryptocurrencies failed to gain widespread accep-tance using a simple agent model. The proposed a model inwhich crypto-anarchists, computer gamers, tech savy and blackmarket agents derive a specific utility by using the fiat currencyor the crypto currency. The utility’s value varies with the typol-ogy of currency and traders. It takes into account the networkrelated benefits from using the same money as other agents,the benefits unrelated to networks, and the switching costs thatincur to switch to the alternative currency. The author showedthat cryptocurrencies like Bitcoins cannot generate widespreadacceptance in absence of significant monetary instability, or of
government support, because of the high switching costs andof the importance of the network effects.
Considering that hundreds of cryptocurrencies have be al-ready proposed on the Internet, and that most of them arewaiting for acceptance, Bornholdt and Sneppen [5] proposeda model based on Moran process to study the cryptocurrenciesable to emerge. This model simulate the interchange betweenseveral markets where different cryptocurrencies are traded.In particular, the authors simulate the agent trading, and themining of new coins at a constant rate, and the commu-nications among traders. They showed that all the crypto-currencies are innately interchangeable, and that the Bitcoincurrency in itself is not special, but may rather be understoodas the contemporary dominating crypto-currency that might bereplaced by other currencies.
Since very few works have been made to model the cryptomarket, in this paper we propose a complex agent-basedmodel to study the cryptocurrencies market as a whole andto reproduce the main stylized facts present in this market,such as autocorrelation and distribution function of the priceabsolute returns. Our model is inspired by artificial financialmarket models. These models are stylized heterogeneous agentmodels (HAMs) and reproduce the real functioning of markets,trying to explain the main stylised facts observed in financialmarkets, such as the fat-tailed distribution of returns, thevolatility clustering, and the unit-root property. Many workshave been published on this topic.
LeBaron [14] offered a first review of the work appeared inthis field. More recently, Chakraborti et al. [7], and Chen etal. [8] offered other, updated reviews.
Palmer et al. [23] and Arthur et al. [3] proposed an artificialmarkets combining market trading mechanisms with inductiveagent learning. In the 2000s, researchers at the Universityof Genoa and Cagliari developed the Genoa Artificial StockMarket (GASM). In particular, Raberto et al. [26] proposed anagent-based artificial financial market that, through a realistictrading mechanism for price formation, is able to reproducesome of the main stylised facts observed in real financialmarkets. Raberto et al. [27], and Cincotti et al. [9] studied thelong-run wealth of traders characterized by different tradingstrategies. Moreover, Raberto et al [28] presented an extensionof the GASM including a limit order book mechanism forprice formation. They demonstrated that the main stylizedfacts in financial market can be reproduced as a consequenceof the limit order book, not introducing any assumption onagents behavior. Alfarano et al. [1], starting from the studyof relatively complicated agent-based models which do notallow for analytical solutions, proposed a closed-form modelthat gives rise to realistic behavior of the resulting time series,like fat tails of returns and temporal dependence of volatility.
Liua et al. [16] developed two simple models to investigateimportant statistical features of stock price series. With the firstmodel, the authors found that the clearing house microstructurecan explain fat tail, excess volatility and autocorrelation phe-nomena of high-frequency returns. With the second model theauthors investigated the effects of agents’ behavioral assump-
tions on daily returns. Ponta et al. [24] studied the statisticalproperties of prices and returns by using a heterogeneous agentmodel. They simulate an artificial stock market where agentsare modelled as nodes of sparsely connected graphs. Theagents own an amount of cash and stocks, share informationby means of interactions determined by graphs and trade riskyassets; whereas a central market maker determines the price atthe intersection of the demand and supply curves. Ponta et al.[25] proposed a heterogeneous agent model for the simulationof high-frequency market data by using the Genoa ArtificialStock Market. In this market, agents have zero intelligenceand trade a risky asset, the price being cleared by meansof a limit order book in which the waiting-time distributionbetween consecutive orders follows a Weibull distribution. Theauthors demonstrated that this mechanism is able to reproducefat-tailed distributions of returns without ad-hoc behavioralassumptions on agents.
Recently, Feng et al. [11] combine the agent-based approachwith the stochastic process approach and propose a modelbased on the empirically proven behavior of individual marketparticipants that quantitatively reproduces fat-tailed returndistributions and long-term memory properties. Westerhoff andFranke [31] propose a model using three groups of traders:chartists, fundamentalists and investors, demonstrateing thatthis combination, together with a simple asset pricing model,can contribute to explaining the stylized facts of the dailyreturns of financial markets.
III. THE MODEL
The proposed model presents an agent-based artificial cryp-tocurrency market in which heterogeneous agents buy or sellcryptocurrency. In particular, we used the Bitcoin market asa reference to calibrate the model and to compare the results.For the same reason, the fiat currency is referred as ”dollars”,or ”$”.
The features of the model that deserve special mention are:• the trading mechanism is based on a realistic order book
that keeps sorted lists of buy and sell orders, and matchesthem allowing to fullfill compatible orders and to set theprice;
• traders have typically limited financial resources, initiallydistributed following a power law;
• the number of agents engaged in trading at each momentis a fraction of the total number of agents;
• either a number of new traders, endowed only with cash,enter the market every day, or a number of traders quitany trading activity; they represent people who decidedto start trading in Bitcoins, or people who decides to quittrading in Bitcoins;
• to account for the mining of new Bitcoins, from time totime some traders are randomly chosen and their Bitcoinamount is increased.
The trading mechanism gives rise to a demand-supplyschedule, whose imbalance between demand and supplycauses price fluctuations. The limited financial resources of theagents pose significant constraints on the trading of each agent.
The engagement in trading of a small fraction of populationmakes the trading mechanism realistic, given also the fact thatthe Bitcoin exchange mechanism do not allow high-frequencytrading.
The entering the market of new traders interested in buyingBitcoins is an empirical fact, that is reflected in the increasingnumber of IP addresses registered in the Blockchain. Thiscontinuous inflow of traders fits empirical data, and makes thewhole market open. These new traders are endowed only ofcash, because they represent newcomers to the Bitcoin market,wishing to buy Bitcoins for the first time. We also accountfor the ever increasing number of Bitcoins due to mining byincreasing proportionally the amount of Bitcoins owned byrandomly selected traders who already own Bitcoins, and whoact as ”miners” in the model.
As regards trading strategies, it is worth noting that tradersoperate in the market either for real needs, or for speculativereasons. In fact, it is misleading to claim that the agentstrade only for speculative reasons, so in the proposed modeltwo populations of traders are defined. One population issuesorders for real needs and the other for speculative reasons,hence each of them follows specific trading strategies.
In the next subsections we described in detail the model,which simulates the Bitcoin transactions and the related mech-anism of price formation.
A. The Traders
At every generic time step, t, i-th trader holds and amountci(t) of fiat currency (cash, in dollars), and an amount bi(t) ofcrypto-currecy (Bitcoins). Traders are divided into ”historic”ones - who are in the market since its beginning and ownboth cash and Bitcoins - and new traders - who enter themarket in a second time and are endowed only with cash. Thewealth distribution of both kinds of traders follows an inversepower-law. This is a realistic assumption because the financial”power” of traders hugely varies. More detailed explanationsof this property can be found in [15].
The set of traders entering the market at times > 0 aregenerated in the beginning of the simulation with a Paretodistribution of fiat cash, and then are randomly extracted fromthe set, when a given number of them must enter the marketat a given time step. More details on how wealth is actuallygiven to traders is given in Section IV-A.
At each time t, an active trader can issue only one order,which can be a sell order or a buy order. Orders alreadyplaced but not yet satisfied or withdrawn are accounted forwhen determining the amount of Bitcoins a trader can buy orsell. A buy order implies that a trader buys Bitcoin currencyin exchange of a given amount of dollars. Consequenty, theamount of Bitcoins to be bought is given by the ratio betweenthe amount of dollars to be traded and the Bitcoin unitaryprice.
As regard the trading strategy, traders are divided into twopopulations: Random traders and Chartists.
1) Random Traders represent persons who entered thecrypto-currency market for various reasons, but not

for speculative purposes. They issue orders for reasonslinked to their needs, for instance they invest in Bitcoinsto diversify their portfolio, or they disinvest to satisfy aneed for cash. In the model, this is represented by thefact that they issue orders in a random way, compatiblywith their available resources. Buy or a sell orders arealways issued by these agents with the same probability.Random traders’ behavior gives stability to the system.They can be considered as a ”thermal bath” where otherstrategies can be introduced.
2) Chartists represent speculators, aimed to gain by plac-ing orders in the Bitcoin market. They speculates that,if prices are rising, they will keep rising, and if pricesare falling, they will keep falling. To this purpose, theyissue orders when the price relative variation in a giventime window τi is higher than a given threshold Th.Chartists usually issue buy orders when the price isincreasing and sell orders when the price is decreasing.Chartists’ behavior is key to produce large price vari-ations, and to the reproduction of the basic statisticalproprieties of the real returns.
At each time step t only a fraction of traders is active, andhence enabled to issue orders. Random Traders are active witha probability ptR = 0.1, whereas the Chartists are active with aprobability ptC = 0.5. This because the interest of Chartists inpurchasing or selling Bitcoins is higher than that of Randomtraders. Random traders issue orders to satisfy their needs,whereas Chartists issue order for speculative reasons, studycarefully the price variation over time and are more ready toplace orders.
The number of traders may vary with time. New traders mayenter the market, and existing traders may quit. We assumedthat each unique address in the Blockchain corresponds to atrader, and that the number of unique addresses that placeorders in a given day is proportional to the number of activetraders. To make these data less volatile, we computed andused as an estimate the moving average of the number ofunique adresses over a period of 30 days.
The average number of traders can increase or decrease withtime. If the number increases, we randomly select the propernumber of traders from a set of waiting traders, and make thementer the market. If the number decreases, a proper number oftraders is randomly selected and removed from the market. Fig.1 (a) shows the number of unique addresses in the consideredperiod, together with the moving average we used. When atrader is removed, we assume that she does not want to tradeBitcoins anymore, so she posts a market order to sell all herBitcoins, and then she is removed from the market.
At the initial time, the sum of the Bitcoins owned by eachtrader represents the total number of Bitcoins in the market.Over time, Bitcoins are added due to the mining of newBitcoins. The input rate of new Bitcoins is proportional tothe difference between the known total number of Bitcoins intwo consecutive days.
We computed this rate and fitted a 4−th degree polynomialthrough it, using as data source the Web site BlockChain in
(a)
(b)
Fig. 1. (a) Number of unique addresses in the Blockchain and theirmoving average, and (b) Total number of Bitcoins and its interpolation, inthe considered time interval of 830 days.
the period between January 1, 2012 and April 10, 2014. Itsexpression is given by:
NB(t) = 4.709∗10−5 ∗ t3−0.08932∗ t2+98.88∗ t+78, 880(1)
Fig. 1 (b) shows the total number of Bitcoins and theirinterpolation curve NB(t).
Since the input rate of bitcoins is always positive, the newBitcoins which enter the market are assigned to a randomly

extracted fraction of Random Traders, giving them an amountof Bitcoins proportional to the Bitcoins already owned. Thenumber of traders extracted is equal to the number of newBitcoins which enter the market, so that on average eachselected trader gets one Bitcoin.
B. Buy and Sell Orders
The Bitcoin market is modelled as a steady inflow of buyand sell orders, placed by the traders. Both buy and sell ordersare expressed in Bitcoins, that is, they refer to a given amountof Bitcoins to buy or sell. In deeper detail, all orders have thefollowing features:
• amount, expressed in Bitcoins: it is a real number, be-cause Bitcoins can be bought and sold in fractions assmall as a ”Satoshi” (10−8 of a Bitcoin);
• residual amount (Bitcoins): used when an order is onlypartially satisfied by previous transactions;
• limit price (see below), which in turn can be a realnumber;
• time when the order was issued;• expiration time: if the order is not (fully) satisfied, it is
removed from the book at this time.The amount of each buy order depends on the amount of
cash, ci(t), owned by i-th trader at time t, less the cash alreadycommitted to other pending buy orders still in the book. Letus call cbi the available cash. The number of Bitcoins to buy,ba is given by eq. 2
ba = cbip(t)β (2)
where p(t) is the current price and β is a random variabledrawn from a lognormal distribution with average and standarddeviation equal to 0.25 and 0.2, respectively. In the unlikelycase that β > 1, β is set equal to 1. In this way, a buyer postson average orders equal to one fourth of her cash availability.
Similarly, the amount of each sell order depends on thenumber of Bitcoins, bi(t) owned by i-th trader at time t, lessthe Bitcoins already committed to other pending sell ordersstill in the book, overall called bsi . The number of Bitcoins tosell, sa is given by sa = bsiβ, where β is a lognormal randomvariable as above. Short selling is not allowed.
The limit price models the price to which a trader desire toconclude his/her transaction. An order can also be issued withno limit (market order), meaning that its originator wishes toperform the trade at the best price she can find. In this case, thelimit price is set to zero. The probability of placing a marketorder, Plim, is set at the beginning of the simulation and isequal to 0.2 for Random Traders and to 0.7 for Chartists. Thisbecause, unlike Random Traders, if Chartists issue orders thenthey wish to perform the trade at the best available price, tobe able to gain by following the price trend.
Let us suppose that i-th trader issues a limit order to buyabi (t) Bitcoins at time t. Each buy order can be executed if thetrading price is lower than, or equal to, the buy limit price bi.In the case of a sell order of asi (t) Bitcoins, it can be executedif the trading price is higher than, or equal to, sell limit price
si. As said above, if the limit prices bi = 0 or si = 0, thenthe orders can be always executed, provided there is a pendingcomplementary order.
The buy and sell limit prices, bi and si, are given respec-tively by the following equations:
bi(t) = p(t) ∗Ni(µ, σi) (3)
si(t) =p(t)
Ni(µ, σi)(4)
where• p(t) is the current Bitcoin price;• Ni(µ, σ
ci ) is a random draw from a Gaussian distribution
with average µ and standard deviation σi.As you can see, the limit prices have a random component,
modelling the fact that what traders ”feel” is the right priceto buy or to sell is not constant, and may vary for each singleorder. In the case of buy orders, we stipulate that a traderwishing to buy must offer a price that is, on average, slightlyhigher than the market price. We set this average to be 2%higher: µ = 1.02.
The value of σi is proportional to the ”volatility” σ(Ti)of the price p(t) through the equation σi = Kσ(Ti), whereK is a constant and σ(Ti) is the standard deviation of priceabsolute returns, calculated in the time window Ti (this is thesame approach of [26]).
In the case of sell orders, the reasoning is dual. In this case,for symmetry, the limit price is divided by a random draw fromthe same Gaussian distribution Ni(µ, σci ).
Each order issued can be satisfied only within a specific timeinterval. So, an expiration time is associated to each order. ForRandom Traders, the value of the expiration time is equal tothe current time plus a number of days (time steps) drawn froma lognormal distribution with average and standard deviationequal to 3 and 1 days, respectively. In this way, most orderswill expire within 4 days since they were posted. Chartists,who act in a more dynamic way to follow the market trend,post orders whose expiration time is at the end of the sametrading day.
Random traders issue buy or sell orders with the sameprobability, whereas Chartists issue buy orders when the priceincreases and sell orders when the price decreases. In particu-lar, they issue buy orders when the price relative variation ina time window τi, different for each trader, is higher than athreshold Th = 0.01, and issue sell orders if this variation islower than −Th.
C. Price Clearing Mechanism
In the real crypto currency market, all Bitcoin transactionsare recorded in the ”Blockchain”, which is a massive and trans-parent ledger of every Bitcoin transaction. The Blockchain isa mechanism that certifies the single transaction by using atimestamp server. This server generates computational proofof the chronological order of transactions to avoid the double-spending problem, and attacks of fraudsters.

In the Bitcoin system, clearing and settlement services areoffered by several Bitcoin Exchanges. These exchanges oper-ate quite independently, but being the transaction price publicand immediately available through inspecting the Blockchain,at least in principle they should work as a single exchange.These exchanges typically allow to post both limit orders andmarket orders. Some banks, such as South Africa’s StandardBank and Germany’s Fidor Bank, are already offering priceclearing services.
Overall, we believe that a single, global Order Book mecha-nism can, at a first approximation, represent the Bitcoin marketquite accurately. We implemented this mechanism as describedbelow. It is similar to the book presented in [28].
At every time step, the order book holds the list of allthe orders received and still to be executed. Buy orders aresorted in descending order with respect to the limit price bi.Orders with the same limit price are sorted in ascending orderwith respect to the order issue time. Sell orders are sorted inascending order with respect to the limit price sj . Orders withthe same limit price are sorted in ascending order with respectto the order issue time.
At each simulation step, various new orders are insertedinto the respective lists. As soon as a new order entersthe book, the first buy order and the first sell order of thelists are inspected to verify if they match. If they match, atransaction occurs. The order with the smaller residual amountis fully executed, whereas the order with larger amount isonly partially executed, and remains in the head of the listwith residual amount reduced by the amount of the matchingorder. Clearly, if both orders have the same residual amount,they are both fully executed.
After the transaction, the next pair of orders at the headof the lists are checked for matching. If they match, they areexecuted, and so on until they do not match anymore. Hence,before the book can accept new orders, all the matching ordersare satisfied.
A sell order of index j matches a buy order of index i, andvice versa, only if sj ≤ bi, or if one of the two limit prices,or both, are equal to zero.
As regards the price, pT , to which the transaction isperformed, the price formation mechanism follows the rulesdescribed below. Here, p(t) denotes the current price:
• when one of the two orders has limit price equal to zero:– if bi > 0, then pT = min(bi, p(t)),– if sj > 0, then pT = max(sj , p(t)),
• when both orders have limit price equal to zero, pT =p(t);
• when both orders have limit price higher than zero, pT =bi+sj
2 .
IV. CALIBRATION OF THE MODEL
The model described in the previous section was imple-mented in Smalltalk language. Before the simulation, it hadto be calibrated in order to reproduce the real stylized factsin the Bitcoin market in the period between January 2012 and
April 2014. The simulation period was thus set to 830 steps, asimulation step corresponding to to one day. We included alsoweekends and holidays, because the Bitcoin market is, by itsvery nature, accessible and working everyday.
A. Trader Wealth Endowment
At the beginning of the simulation, (t = 0), each trader iis endowed with an amount of cash ci(0) and an amount ofBitcoins bi(0). The distributions of cash and Bitcoins followa power-law with exponent α. In all the performed simulationwe set α = 1, a value yielding the distribution known as Zipf’slaw [21]. Table I gives information about the actual quantitiesused to initialize traders’ wealth.
To create this type of distribution we used the rankingproperty of the power-law [30]. This means that if we orderthe wealth of agents in decreasing order, the cash/Bitcoinsof the ith agent is i−α the cash/Bitcoins of the first agent.We therefore artificially created a population of agents whosecash and number of Bitcoins at time step 0 follows the rankingproperty of the Pareto law.
In fact, we started with the total initial number of Bitcoinsavailable, BT , that is a known quantity. If the total number oftraders is Nt and the number of Bitcoins owned by them, bi,follows a Pareto law with exponent α = 1, it is well-knownfrom Harmonic-series theory that BT = b1ln(Nt) + γ, whereγ is the Euler-Mascheroni constant and b1 is the number ofBitcoins owned by the richest trader. The number of Bitcoinsowned by i-th trader is consequently: b1
i .A similar approach was followed to create the set of traders
who entered the simulation at t > 0, but in this case thetraders were only endowed with cash. In this case, we hadno specific data to calibrate the wealth of these traders. Westipulated that the cash, cs1, of the richest trader is about fivetimes the cash owned by the richest initial trader, and thatthe exponent of the Pareto law is in this case α = 0.6. Inthis way, the cash of the poorest traders amounts to about2,600$, whereas the total cash of these traders is about 8.7million $. This figure is slightly higher than the total cash ofthe initial traders (CT (0) = 400, 000), multiplied by the ratioof the number of traders entering at t > 0 over the numberof initial traders. Overall, we performed various simulationsvarying these parameters, with no significant impact on theresults.
The set of ”new” traders are generated before the simulationstarts. When new traders are needed to enter the simulation,they are chosen randomly in this set.
The wealth endowment of traders was made for all traders,both initial and new, irrespectively of being Random orChartist ones. Then, they were randomly selected for beingRandom or Chartis traders with probability PR = 0.7 andPC = 0.3, respectively.
B. Model Initialization
We set the initial value of several key parameter of themodel by computing the corresponding parameters using theBlockchain Web site. The main assumption we made is to

TABLE IVALUES OF SIMULATION PARAMETERS AND THE ASSUMPTIONS BEHIND
THEM.
Param. Initial Value Description and discussion
Nt(0) 100 Number of initial traders. Obtained dividing by 100 the number ofaverage unique Bitcoin addresses as of January 2012 (which are about10,000).
BT (0) 80,000 Total initial number of Bitcoins. Obtained dividing by 100 the Bitcoinsmined as of January 2012, that are approximately 8 million.
p(0) 5.0 $ Initial price. The average price as of January 2012.CT (0) 400,000 $ Total initial cash. Obtained through formula: CT (0) = BT (0)p(0).
In fact, at equilibrium, the total value of Bitcoins is approximatelyequal to the total cash available to traders.
Nt(tmax) 1,500 Total number of traders at the end of the simulation (t = tmax = 830.Obtained dividing by 100 the number of average univocal Bitcoinaddresses as of April 2014 (which are on average about 150,000).
cs1 400,000 $ Total initial cash of the richest trader entering the simulation at t > 0.Plim 0.2 and 0.7 Probability that an order has no limit price, for Random Traders
and Chartists respectively. We stipulate that one fifth of all RandomTraders’ orders are market orders, and that a Chartists’ order is amarket order with a probability equal to 0.7.
K 10−2 Constant used in the computation of σi (see eqs. 3 and 4). Tuned toyield a reasonable variation of σi with price volatility.
Ti 10 Number of time steps used to compute the standard deviation of prices.
Fig. 2. Price of Bitcoins in US$, and number of unique addresses of theBlockchain.
size the artificial market at about 1/100 of the real market, tobe able to manage the computational load of the simulation.Table I shows the parameter values and their computationassumptions in detail.
V. SIMULATION RESULTS
A. Bitcoin Prices
We started studying the real Bitcoin price series betweenJanuary 1, 2012 and April 10, 2014. The daily data weretaken from the web site Blockchain.info. Fig. 2 shows theBitcoin prices and the moving average of unique addressesof the Blockchain. It highlights a period in which the pricetrend is relatively constant, until about 450th day. Then, aperiod of higher volatility follows between 450th and 650th
day, followed by a period of high volatility after day 650, untilthe end of the considered interval.
The number of unique addresses tends to increase sincethe beginning of the considered period. Yet the price remainssteady for a long time. However, the periods where the priceincreases most are also characterized by the largest incrementof addresses. At the end of the considered interval, the pricetends to decrease, whereas the number of adresses continuesto increase.
It is well known that the price series encountered in financialmarkets typically exhibit some statistical features, also knownas ”stylized facts” [22] [18]. Among these, the three uni-variateproperties which appear to be the most important and pervasiveof price series, are (i) the unit-root property, (ii) the fat tailphenomenon, and (iii) the Volatility Clustering. We examineddaily Bitcoin prices to assess whether also these prices exhibitthese properties.
Regarding unit-root property, it amounts to being unableto reject the hypothesis that financial prices follow a randomwalk. To this purpose, we applied the Augmented Dickey-Fuller test to the series of Bitcoin daily prices we considered.The τ3 statistic for the null hypothesis γ = 0 is −2.2, and itscorresponding critical values at levels 1%, 5%, and 10% with830 observations are −3.96, −3.41 and −3.12 respectively.At these levels we can’t reject the null hypothesis that γ = 0.
The second property is the fat-tail phenomenon: the dis-tribution of absolute returns at weekly, daily and higherfrequencies displays a heavy tail with positive excess kurtosis.In particular,the absolute return distribution in the tails can beapproximated by a Pareto, or power-law, distribution:
P (x) = x−α (5)
where α is higher than zero and is known as the exponent orscaling parameter of power-law function.
The corresponding ccdf, i.e. the probability that the randomvariable is greater than a given value x, is:
P (X ≥ x) ∝ x−(α−1) (6)
Given the expressions just described, it is simple to concludethat a power law is represented as a straight line in a log-loggraph of both the probability density and the ccdf.
In figure 3, the log-log graph of the real absolute returnccdf is shown. The Pareto distribution holds for values of xthat are greater than a positive number xmin – in our casexmin ' 10−1 – and hence we can consider the ccdf of the realprice absolute return as a power-law only in its right ”tail”,where this curve is clearly a straight line. So, Bitcoin dailyreturns are not an exception to the ”fat tail” stylized fact.
The third property is Volatility Clustering: periods of qui-escence and turbulence tend to cluster together. This can beverified by the presence of highly significant autocorrelationin absolute or squared returns, despite insignificant autocorre-lation in raw returns.
Fig. 4 shows the autocorrelations of the real price returnsand absolute returns, at different time lags. It is possible to notethat the autocorrelation of raw returns (a) is often negative,and is anyway very close to zero, whereas the autocorrelation

Fig. 3. Complementary cumulative distribution function of the price absolutereturns.
of absolute returns (b) slowly decreases for increasing lags,and that for most lag values is higher than 0.2. This behavioris typical of financial price return series, and confirms thepresence of volatility clustering.
In conclusion, the Bitcoin price shows all the stylized factsof financial price series, as expected.
B. Prices of the simulated model
The model was run to study the main features whichcharacterize the Bitcoin market and the traders who operatein it.
We performed several simulations using the parameter val-ues calibrated as described in Section IV. The results of allsimulations were consistent. We report in Fig. 5 the Bitcoinprice in one typical simulation run. At a first sight, the behavioris quite similar to the real price (see Fig. 2). It is possible toobserve that, as in the case of the real price, at first the pricekeeps its value constant, and then, after about 200 simulationsteps, it presents intervals characterized by high volatility, withprice peaks of about 40$, 100$ and 110$. These values aremuch lower than real Bitcoin price spikes. We attribute itto the fact that the intrinsic mean reverting behavior of thesimulated model prevents prices to spike as in the real market.All other statistical properties of prices and returns, however,are reproduced quite well in our model.
We performed the Augmented Dickey-Fuller test to theseries of simulated Bitcoin daily prices. The results for oneof the simulations are the followings. The τ3 statistic for thenull hypothesis γ = 0 is −2.889, and its corresponding criticalvalues at levels 1%, 5%, and 10% with 830 observations are−3.96, −3.41 and −3.12 respectively. At these levels, alsofor the simulated data we can’t reject the null hypothesis thatγ = 0. All simulations yield similar results.
(a)
(b)
Fig. 4. Autocorrelation of (a) raw returns, and (b) absolute returns of Bitcoinprices.
The log-log plot of the ccdf of the price absolute returns ina simulated Bitcoin market is shown in Fig. 6, together with itsreal counterpart. The linear behavior in the tail, that denotes apower-law, is patent. The two curves are quite similar, thoughthe real ccdf has a fat tail slightly broader.
The autocorrelations of the simulated price returns andabsolute returns at different time lags are shown in Figs. 7(a) and (b), respectively.
The autocorrelation of raw returns (a) is much lower thanthat of absolute returns (b). Both are very similar to those of

Fig. 5. Price of the Bitcoin in the simulated market.
Fig. 6. Ccdf of the price absolute returns in a simulated Bitcoin market,compared with the real ccdf.
real Bitcoin prices, shown in Fig. 4(a) and (b). This confirmsthe presence of volatility clustering also for the simulated priceseries.
C. Traders’ statistics
As described in the previous sections, each trader owns aspecific amount of dollars and Bitcoins, so the amount ofBitcoins to be traded, depend on these quantities. The totalwealth of i-th trader at time t, wi(t), is defined as the sumof her cash plus her Bitcoins multiplied by the current price,
(a)
(b)
Fig. 7. Autocorrelation of (a) raw returns, and (b) absolute returns of Bitcoinprices, in a simulated market.
reported in eq. 7. Of course, this quantity varies with the price.
wi(t) = ci(t) + bi(t)p(t) (7)
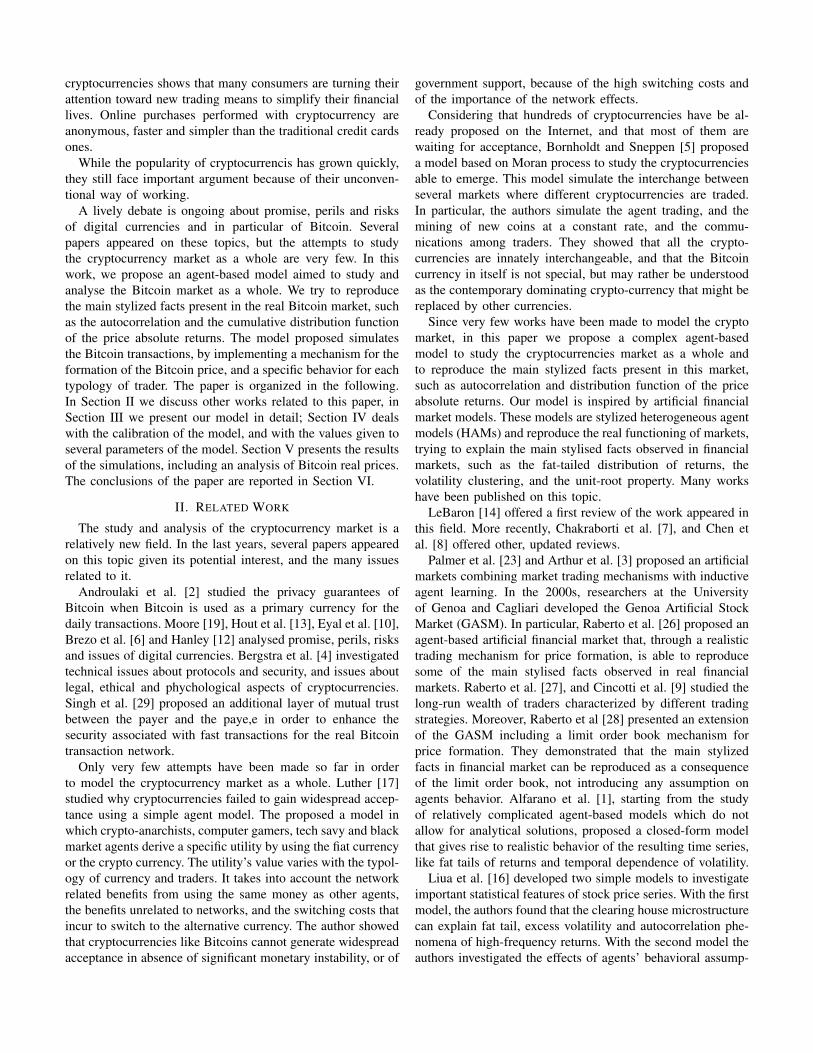
Some data about the distribution of the wealth among thedifferent population of traders, the limit prices and the amountaverage of Bitcoin exchanged in each transaction are reportedin the next figures. Figs. 8 (a) and (b) show the total amountof Bitcoins and cash owned by both populations, for all timesteps. The ”spikes” you see in Fig. 8 (a) regarding Bitcoin
(a)
(b)
Fig. 8. (a) Bitcoin amount and (b) cash amount for both trader populationsduring the simulation period.
endowment of Random traders are an artifact due to theremoval of traders. When a trader is removed from the market,she sells all her Bitcoins through a market order. However,if there are no enough matching buy orders, these Bitcoins”disappear” from the market, until some trader buy them.Hence, the spikes. During the simulation shown there is noChartist in a similar condition.
The sum of Bitcoins owned by Random and Chartist tradersfollows the trends shown in Fig. 1 (b). It is worth noting thatthe total amount of Bitcoins owned by Chartists looks fairly
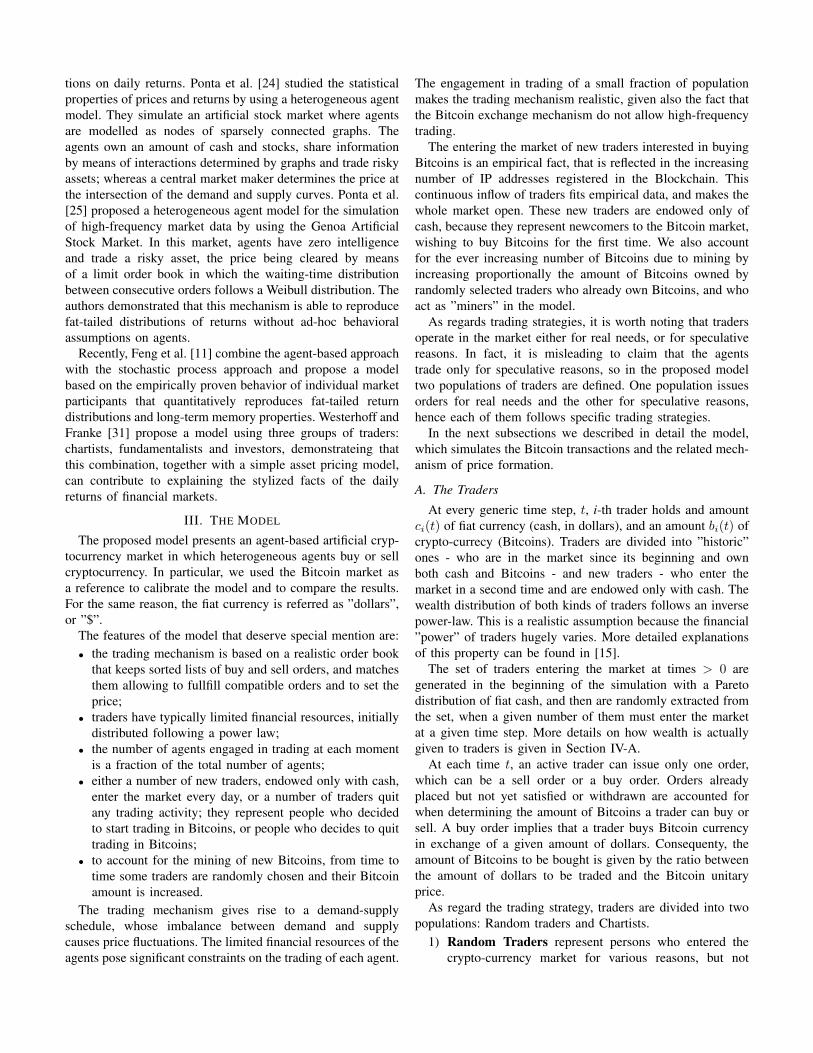
Fig. 9. Total wealth of both trader populations.
constant.Fig. 9 shows the total wealth of both populations, as defined
in eq. 7. The total wealth is heavily influenced by price behav-ior. We also computed the ratio between the total wealth ofRandom traders and that of Chartists, finding that it fluctuatesaround a constant value, equal to the ratio of the total initialwealth of all Random traders over the total initial wealth ofChartists. This ratio is on average equal the ratio of the numberof Random over Chartist traders – that is 0.7/0.3 ' 2.33, butit can differ substantially from the average, due to the Paretodistribution of traders’ wealth. In fact, in different runs therecan be relatively high differences between the total wealth ofthe various kinds of traders, whereas the total wealth of alltraders is constant. The relative invariance of this ratio duringthe simulation means that the Chartist strategy is not winningwith respect to the Random strategy, but both are roughlyequivalent.
D. Robustness analysis
In order to assess the robustness of our model and thevalidity of our statistical analysis, we repeated 100 simulationswith the same initial conditions, but different seeds of therandom number generator.
Figs. 10 (a) and (b) report the average and the standarddeviation of the simulated price, taken on all 100 simulations.The average price follows quite closely the number of traderspresent in the market, reported in Fig. 1. This is reasonablebecause, given the slowly varying amount of Bitcoins, the priceshould be roughly proportional to the cash available in themarket to buy them, which is in turn proportional to the tradersnumber. The standard deviation of prices is roughly equal to1/4 of the average, meaning that the 100 simulations are quiteconsistent as regards price behavior.

(a)
(b)
Fig. 10. (a) Average Price and (b) standard deviation computed on the 100Monte Carlo simulations performed.
Figs. 11 (a) and (b) show the raw return autocorrelationfunctions (ACF) of a couple of simulations extracted fromthe 100 performed. Both ACFs show the same behavior asreported in Fig. 7 (a). All 100 ACFs have similar behaviors.Also the ACF of absolute returns show a behavior similar tothat reported in Fig. 7 (b) for all the considered cases.
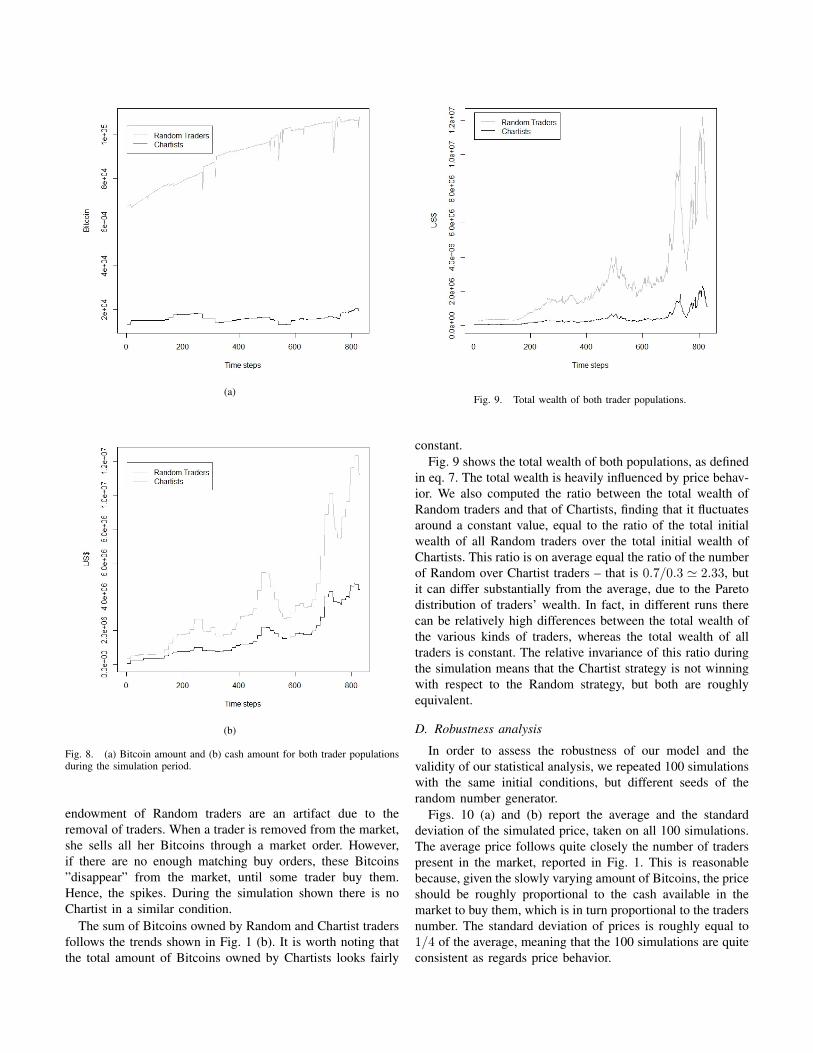
Figs. 12 show the cccdf of the price absolute returns inthe real case and for ten simulations extracted from the 100simulations quoted. Also in this case, the power-law behavioris patent in all reported simulations, though with a greater
(a)
(b)
Fig. 11. Examples of autocorrelations of the returns computed on twodifferent Monte Carlo simulations.
slope than in the real case.Overall, all performed simulations presented a consistent
behavior, with no significant variations of statistical propertiesof the Bitcoin prices and of traders’ endowment of Bitcoinsand cash.
VI. CONCLUSIONS
In this paper, we present an heterogenous agent model of theBitcoin market, accurately modeling many of the characteris-tics of the real market. Namely, the model includes different
Fig. 12. (a) Complementary cumulative distribution function of absolutereturns of real prices (black circles), and ccdf of ten simulated cases taken atrandom (colored circles).
trading strategies, an initial distribution of wealth followingPareto law, a realistic trading and price clearing mechanismbased on an order book, the increase with time of the totalnumber of Bitcoins due to mining, the arrival of new tradersinterested in Bitcoins. The model is simulated and its outputs– especially the Bitcoin prices – are analysed and comparedto real prices.
The main result of the model, besides being to our knowl-edge the first model of a cryptocurrency market followingthe artificial financial market approach, is the fact that somekey stylized facts of Bitcoin real price series are very wellreproduced. The computational experiments performed pro-duce price series for which we are unable to reject thehypothesis that they follow a random walk. The autocorrelationof raw returns is very low for all time lags, whereas theautocorrelation of absolute returns is much higher, confirmingthe presence of volatility clustering. Also, the ccdf of theabsolute returns exhibit a power-law behavior in its tail, likethat of real absolute returns.
Note that the results obtained are quite sensitive to thetraders’ behavior. We found that the presence of differenttraders’ populations, and hence the trading between Randomtraders and Chartists, is essential to reproduce the autocor-relation and the ccdf of the returns of the Bitcoin price. Inparticular, the Chartists’ behaviour is essential to reproduceautocorrelations of the returns that confirm periods of quies-cence and turbulence in the simulated Bitcoin price.
Future research will explore more traders’ behaviors, amore detailed mechanism for describing mining, the interplaybetween different cryptocurrencies through explicit networkeffects among traders.
REFERENCES
[1] Alfarano S., Lux T., Wagner F., Time variation of higher moments in anancial market with heterogeneous agents: An analytical approach, Journalof Economic Dynamics & Control 32, 101136 (2008)
[2] Androulaki E., Karame G., Roeschlin M., Scherer T. and Capkun S., Eval-uating User Privacy in Bitcoin, Proceedings of the Financial Cryptographyand Data Security Conference (FC) (2013)
[3] Arthur W.B., Holland J.H., LeBaron B., Palmer R. and Tayler P., Assetpricing under endogenous expectations in an artificial stock market, TheEconomy as an Evolving Complex System II, ser. SFI Studies in theSciences of Complexity, Arthur W.B, Durlauf S.N., and Lane D.A. (Eds),vol. Addison Wesley Longman, pagg. 15-44 (1997)
[4] Bergstra J. A. and Leeuw dK., Questions related to Bitcoin and otherInformational Money, CoRR, vol. 1305.5956 (2013)
[5] Bornholdt S. and Sneppen K. , Do Bitcoins make the world go round?On the dynamics of competing crypto-currencies (2014)
[6] Brezo F. and Bringas P. G., Issues and Risks Associated with Cryptocur-rencies such as Bitcoin, The Second International Conference on SocialEco-Informatics (2012)
[7] Chakraborti A., Toke I.M., Patriarca M. and Abergel F., Econophysicsreview: II. Agent-based models, Quantitative Finance 11:7, 1013-1041(2011)
[8] Chen S.H., Chang C.L. and Du Y.R., Agent-Based Economic Models andEconometrics, The Knowledge Engineering Review, 27,187-219 (2012)
[9] Cincotti S., Focardi S., Marchesi M. and Raberto M., Who wins? Study oflong-run trader survival in an artificial stock market, Physica A: StatisticalMechanics and its Applications, Elsevier, vol. 324(1), pagg. 227-233(2003)
[10] Eyal I. and Sirer E., Majority is not Enough: Bitcoin Mining isVulnerable, CoRR, vol. 1311.0243 (2013)
[11] Feng L., Podobnik B. L., B., Preis T., and Stanley H.E., Linking agent-based models and stochastic models of financial markets, PNAS 109:22,83888393 (2012)
[12] Hanley B.P., The False Premises and Promises of Bitcoin, CoRR (2013)[13] Hout M. C. V. and Bingham T., Responsible vendors, intelligent con-
sumers: Silk Road, the online revolution in drug trading, InternationalJournal of Drug Policy, Elsevier, vol. 25, pagg. 183-189 (2014)
[14] LeBaron B., Agent-based computational finance, Handbook of Compu-tational Economics, Agent-based Computational Economics, vol. 2 (2006)
[15] Levy M. and Solomon S., New evidence in the power-law distributionof wealth, Physica A, 242(12), 9094 (1997).
[16] Liua X., Gregorc S., Yang J., The effects of behavioral and structuralassumptions in articial stock market, Physica A 387 25352546 (2008)
[17] Luthe W. , Cryptocurrencies, Network Effects, and Switching Costs,Mercatus Center Working Paper No. 13-17 (2013)
[18] Lux T., Marchesi M., Volatility Clustering in Financial Markets: aMicrosimulation of Interacting Agents, International Journal of Theoreticaland Applied Finance 3:4 675-702 (2000)
[19] Moore T., The promise and perils of digital currencies, InternationalJournal of Critical Infrastructure Protection, Agent-based ComputationalEconomics, pagg. 147-149 (2013)
[20] Nakamoto S., Bitcoin: A Peer-to-Peer Electronic Cash System,www.Bitcoin.org.
[21] Newman M.E.J., Power laws, Pareto distributions and Zipf’s law,Contemporary Physics 46:5 323-351 (2005).
[22] Pagan A., The econometrics of financial markets, J. Empirical Finance3 15-102 (1996).
[23] Palmer R., Arthur W.B., Holland J.H., LeBaron B. and Tayler P,Artificial economic life: a simple model of a stock market, Physica D,vol. 75, pagg. 264-274 (1994)
[24] Ponta L., Pastore S., Cincotti S., Information-based multi-assets artificialstock market with heterogeneous agents, Nonlinear Analysis: Real WorldApplications, vol. 12, pagg. 1235-1242 (2011)
[25] Ponta L., Scalas E., Raberto M. , and Cincotti S., Statistical Analysisand Agent-Based Microstructure. Modeling of High-Frequency FinancialTrading, IEEE Journal of selected topics in signal processing, vol. 6, no.4 (2012)
[26] Raberto M. and Cincotti S. and Focardi S. and Marchesi M., Agent-based simulation of a financial market, Physica A, vol.299(1), pagg. 319-327 (2001)
[27] Raberto M. and Cincotti S. and Focardi S. and Marchesi M., Traders’long-run wealth in an artificial financial market, Society for ComputationalEconomics, Computing in Economics and Finance, vol. 301 (2002)

[28] Raberto M. and Cincotti S. and Dose C. and Focardi S. and Marchesi M.,Price formation in an artificial market: limit order book versus matchingof supply and demand, Nonlinear Dynamics and Heterogenous InteractingAgents, Springer-Verlag, Berlin (2005)
[29] Singh P. and Chandavarkar B. R. and Arora S. and Agrawal N., Perfor-mance Comparison of Executing Fast Transactions in Bitcoin NetworkUsing Verifiable Code Execution, Second International Conference onAdvanced Computing, Networking and Security (2013)
[30] Takayasu, H., Fractals in the Physical Sciences, John Wiley and Sons,New York (1990).
[31] Westerhoff F., Franke R., Converse trading strategies, intrinsic noise andthe stylized facts of financial markets, Quantitative Finance, 12:3, 425-436(2012).