Understanding impact through alternative metrics: developing library-based assessment services

Using Alternative Metrics to Predict College Student Success:
The Student Behavior and Experience Inventory Research Initiative
Jacob Bradburn, Dr. Neal Schmitt, Dr. Ann Marie Ryan, Dr. Christopher Nye,
Morgan Showler, Joshua Prasad, & Sergio Marquez
2017 Michigan Association for Institutional Research Annual Conference Ann Arbor, MI
1

Current State of College Admissions
▪ Cognitive predictor (e.g. ACT/SAT, HSGPA, etc.) frequently used for admission decisions (NACAC, 2006)
▪ Predict well, but much variance in student performance unaccounted for
▪ SAT subtests & HSGPA accounted for ~21% of variance in 1st
Semester GPA (via Patterson & Mattern, 2013)
▪ Supplemental materials used, but to a lesser extent (NACAC, 2006) and difficult to standardize use
2

Problems with Status Quo
▪ If cognitive skills primary selection criteria and other neglected, could lead to campus deficiencies in other abilities (e.g. leadership, community involvement, etc.)
▪ Students may not have non-cognitive capabilities to succeed in a college environment
▪ Some minority groups tend to score lower on cognitive ability measures (Roth, Bevier, Bobko, Switzer, & Tyler,
2001), which can lead to a lack of diversity
3

Alternative Predictors
▪ Non-Cognitive predictors are individual differences that predict student success besides cognitive ability
▪ Increasing interest in non-cognitive predictors (Niessen &
Meijer, 2017; NASEM, 2017)
▪ Personality (Poropat, 2009)
▪ Vocational Interests (Nye, Su, Rounds, & Drasgow, 2012)
▪ Situational Judgement (Oswald, Schmitt, Kim, Ramsay, & Gillespie, 2004)
▪ Biographical Data (Oswald et al., 2004)
4

Benefits of Utilizing Non-Cognitive Measures
▪ Easy to score
▪ Particularly useful in high volume applicant environments
▪ Can be added to cognitive measures
▪ Can capture unique variance (Oswald et al., 2004; Schmitt, Keeney,
Oswald, Pleskac, Billington, Sinha, & Zorzie, 2009)
▪ Smaller group differences (Schmitt et al. 2009)
▪ Better predictors of other outcomes (Oswald et al., 2004;
Schmitt et al., 2009)
5

Student Behavior and Experience Inventory (SBEI)
▪ “Mission to develop and validate alternative measures of college student potential and successful performance/development”
▪ Developed from a multi-institutional initiative to develop alternative predictors of student success
6

Student Behavior and Experience Inventory (SBEI)
▪ Two assessment based in organizational psychology literature utilized
▪ Biographical Data (Biodata): Questions regarding experiences, preferences, interests; given a set of options and scored on a 1-5 scale.
▪ Situational Judgment Test: Given a situation and alternative courses of action. Asked to indicate which option would be most likely to take and which least likely to take. Scored based on expert ratings.
7

Example Biodata Item
▪ Generally, whenever you learn about a topic or how to perform a task, how often do you learn all the details as well as the general principles?
▪ Hardly ever
▪ Not very often
▪ Sometimes
▪ Often
▪ Almost always
8

Example SJT itemAfter you arrive on campus, you begin to socialize with a group of students who drink regularly even though all are underage. By the end of the term, you realize that you are drinking several drinks at least three nights a week, but you don’t know how to withdraw from the group in which this is normal routine behavior. What action would you take?
A) Ask a close friend to help watch out for your best interests, and pursue other activities with other people.
B) As long as you keep your grades up it is not a problem.
C) Explain to the group that you are concerned about falling behind if you continue the behavior and concentrate more on your studies instead.
D) Join alternative groups such as campus clubs and sports, or maybe even take an evening or early morning job.
E) Just socialize with the group less frequently.
F) Continue socializing with the group, but don’t always drink when they do.
What are you most likely to do?
What are you least likely to do?
9

Student Behavior and Experience Inventory (SBEI) - Background
▪ Initial development involved ten 4-year institutions
▪ Reviewed university mission statements, department objectives, interviewed university staff, etc., 12 dimensions important for college student performance emerged
▪ Developed biodata and SJT measures to assess dimensions
▪ Results supportive of these measures for predicting student outcomes (Oswald et al.,2004; Schmitt et al., 2009)
10

Student Behavior and Experience Inventory (SBEI)
▪ This previous research was used to develop the SBEI for Michigan State University
▪ Developed to give admissions officers more info to make better decisions
▪ Currently have collected data from 3 cohorts, and partial 4th
▪ Current iteration has been reduced to 119 items and eight dimensions▪ Knowledge, Continuous Learning, Social Responsibility, Leadership,
Perseverance, Adaptability, Academic Values, and Situational Judgement
11

Knowledge
▪ Gaining knowledge and mastering facts, ideas and theories and how they interrelate, and the relevant contexts in which knowledge is developed and applied.
For class work, how often do you tend to skim the material, reading only the important points?
▪ Almost all the time
▪ Most of the time
▪ Sometimes
▪ Rarely
▪ Never
12

Continuous Learning
▪ Being intellectually curious and interested in continuous learning.
How often do you ask a teacher or classmate questions that go beyond the material but are still relevant to the topic (either in or out of class)?
▪ Very often▪ Often▪ Sometimes▪ Rarely▪ Never
13

Social Responsibility
▪ Being responsible to society and the community, and demonstrating good citizenship.
In the past year, in how many fundraisers have you participated?
▪ None
▪ 1
▪ 2
▪ 3
▪ 4 or more
14

Leadership
▪ Demonstrating skills in a group, such as motivating others, coordinating groups and tasks, serving as a representative for the group, or otherwise performing a managing role in a group.
In the past year, how often have you been selected by a group or club to serve as an official or representative?
▪ Never▪ Once▪ Twice▪ Three or four times▪ Five times or more
15

Perseverance
▪ Committing oneself to goals and priorities set, regardless of the difficulties that stand in the way.
How frequently do you fail to get what you want because you did not put in enough effort?
▪ Very often
▪ Often
▪ Sometimes
▪ Rarely
▪ Never
16

Adaptability
▪ Adapting to a changing environment (at school or home), dealing well with gradual or sudden and expected or unexpected changes.
How difficult has it been for you to deal with situations that forced you to make adjustments in your daily life (e.g. broken leg, illness, family crisis)?
▪ Very difficult
▪ Difficult
▪ Not easy but not difficult
▪ Easy
▪ Very easy
17

Academic Values
▪ Having a well-developed set of values, and behaving in ways consistent with those values.
In you first three years of high school, how often did you skip classes without a legitimate reason?
▪ Most of the time
▪ A lot
▪ Sometimes
▪ Once or twice
▪ Never
18

Situational Judgement
▪ Making good decisions in various academic and social situations related to each of the above areas.
▪ Analyzing and choosing from among various
alternative possible actions in problem situations.
19

Situational Judgement
You are part of a three-person group working on a class project with a quickly approaching deadline. One member of the team is not pulling his weight. He avoids assignments, complains about the amount of work that has to be done, and says the project doesn’t really matter anyway. While you are all classmates, you seem to be the group leader. What would you do?
A) Divide the workload among members of the group, making sure everyone knows that they are responsible for their share. If the group member still does not pull his own weight, bring it up with the instructor.B) Speak with him in private and offer him moral encouragement to complete his portion of the project. If the group member still does not pull his own weight, bring it up with the instructor.C) Try to get the team member motivated to do his work. If that doesn’t help the situation, just put more effort into the project yourself in order to complete it.D) Just do the group member’s portion of the assignment in addition to your own, and tell the instructor about the situation.E) See if the person could be removed from your group.F) Consult with the non-problematic group members about the most appropriate course of action, and then act on whatever you jointly decide.
What are you most likely to do?
What are you least likely to do?20

Prediction of 1st Semester GPA
21
2015 – 2016 Cohort (N = 7702-6673)
2016 – 2017 Cohort(N = 6530 - 7683)
Situational Judgement .14*** .18***
Knowledge .15*** .15***
Leadership .06*** .10***
Social Responsibility .08*** .10***
Adaptability .04*** .07***
Perseverance .10*** .12***
Continuous Learning -.05*** -.05***
Academic Values .11*** .12***
ACT Composite .36*** .33***
HSGPA .47*** .44***
***p < .01

Situational Judgement and 1st Semester GPA
22
Percentiles
1 – Lowest 15%
2 – 15th-35th
3 – 35th – 65th
4 – 65th – 85th
5 – Top 15%
*2016 – 2017 Cohort

Knowledge and 1st Semester GPA
23
Percentiles
1 – Lowest 15%
2 – 15th-35th
3 – 35th – 65th
4 – 65th – 85th
5 – Top 15%
*2016 – 2017 Cohort

SBEI Composite and 1st Semester GPA
24
Percentiles
1 – Lowest 15%
2 – 15th-35th
3 – 35th – 65th
4 – 65th – 85th
5 – Top 15%
*2016 – 2017 Cohort

Situational Judgement and Probation Rates
25
Percentiles
1 – Lowest 15%
2 – 15th-35th
3 – 35th – 65th
4 – 65th – 85th
5 – Top 15%
*2016 – 2017 Cohort
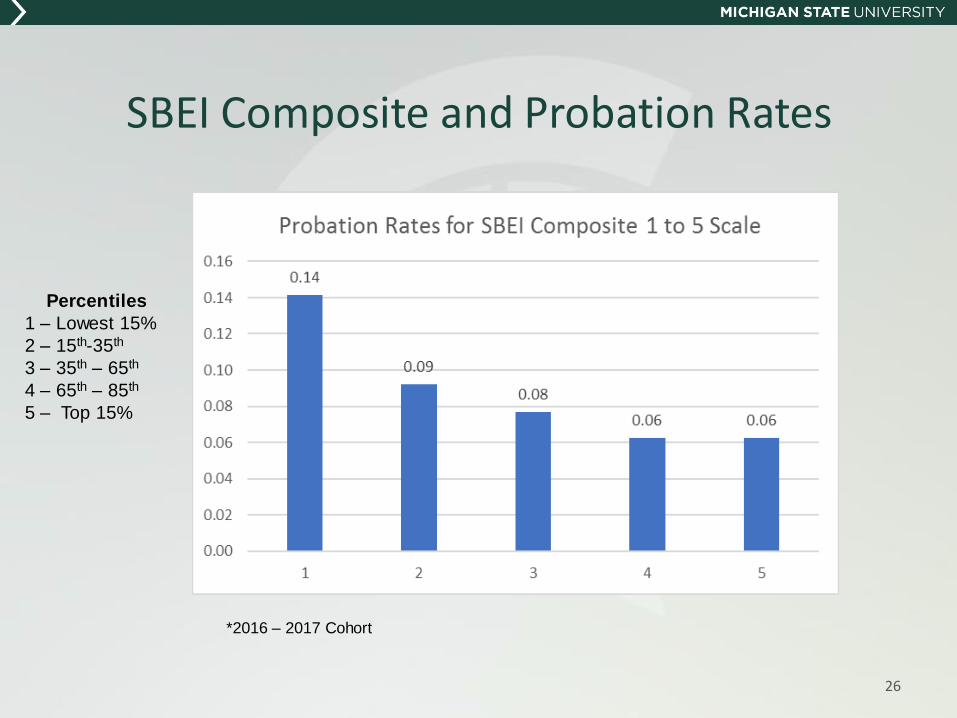
SBEI Composite and Probation Rates
26
Percentiles
1 – Lowest 15%
2 – 15th-35th
3 – 35th – 65th
4 – 65th – 85th
5 – Top 15%
*2016 – 2017 Cohort

Prediction of 1st Semester GPA Above ACT & HSGPA
27
R R SquareAdjusted
R Square
Std. Error
of
Estimate
R Square
ChangeF Change df1 df2
Sig. F
Change
Step 1 .46 .21 .21 .64 .21 832.42 2 6221 <.001
Step 2 .48 .23 .23 .63 .02 16.53 8 6213 <.001
*2016 – 2017 Cohort

Alternative OutcomesInvolvement Organizational
Citizenship Behaviors
Social Integration
Situational Judgement
.01 .10* -.01
Knowledge .04 .14*** .04
Leadership .20*** .31*** .12***
Social Responsibility
.19*** .23*** .11***
Adaptability .18*** .22*** .20***
Perseverance .15*** .35*** .14***
Continuous Learning
.00 .17*** .01
Academic Values -.05 .04 -.01
ACT Composite -.02 -.08* .07
HSGPA .00 -.08* .01
28
2015 – 2016 Cohort, N = 627 – 683 *p < .05 ***p < .01

Group Differences
29
Black (d)
(N = 551-590)
Hispanic (d)
(N = 276-329
Multiracial (d)
(N = 236-254)
International
(d)
(N = 30-970)
Asian (d)
(N = 420-462)
SJT .27 .05 .12 .78 .20
Knowledge .30 .15 .15 .31 .10
Leadership .11 .18 .05 .50 .20
Social
Responsibility.13 .12 -.04 .46 -.07
Adaptability .12 .09 -.01 .42 .33
Perseverance -.30 -.03 -.03 1.07 .32
Academic
Values.28 .05 .12 .30 .09
Learning -.18 -.09 -.02 -.21 .01
High School
GPA1.06 .53 .22 .54 .03
ACT 1.72 .93 .35 1.22 -.16
2016 – 2017 Cohort. Caucasian group is comparison group. Positive d values indicate Caucasians score higher than the comparison
group while negative d values indicate they score lower.

Problems with Using Non-Cognitive Predictors
▪ Fakeable
▪ Though some promising developments in this area
▪ Validity could be higher
▪ Cognitive predictors should not be replaced
30

Future Research
▪ Continued efforts to assess and develop ways to handle faking
▪ Investigating use of personality and interest in predicting student success
▪ Exploring the impact of cultural differences (e.g. international student status) on responding to items
▪ The importance of non-cognitive attributes in certain contexts (e.g. female in STEM field)
31

Student Behavior and Experience Inventory (SBEI)
Research Team
(Left to Right) Jacob Bradburn, Sergio Marquez, Dr. Neal Schmitt, Joshua Prasad,
Dr. Ann Marie Ryan, Morgan Showler, Dr. Christopher Nye
Faculty and Graduate Students in MSU Organizational Psychology Program32

Thank You!
Jacob Bradburn
Department of Psychology
Michigan State University
SBEI Research Group Website: sbei.psy.msu.edu
33

References▪ National Association for College Admission Counseling. (2008). Report of the Commission on the Use of Standardized Test in
Undergraduate Admission. Retrieved from http://www.nacacnet.org/research/PublicationsResources/Marketplace/Documents/TestingComission_FinalReport.pdf
▪ National Academies of Sciences, Engineering, and Medicine. 2017. Supporting Students' College Success: The Role of Assessment of Intrapersonal and Interpersonal Competencies. Washington, DC: The National Academies Press.
▪ Niessen, A. S. M., & Meijer, R. R. (2017). On the use of broadened admission criteria in higher education. Perspectives on Psychological Science, 12(3), 436-448.
▪ Nye, C. D., Su, R., Rounds, J., & Drasgow, F. (2012). Vocational interests and performance: A quantitative summary of over 60 years of research. Perspectives on Psychological Science, 7(4), 384-403.
▪ Oswald, F. L., Schmitt, N., Kim, B. H., Ramsay, L. J., & Gillespie, M. A. (2004). Developing a Biodata Measure and Situational Judgment Inventory as Predictors of College Student Performance. Journal of Applied Psychology, 89(2), 187-207.
▪ Patterson, B. F. & Mattern, K. D. (2013). Validity of the SAT for Predicting First-Year Grades: 2010 SAT Validity Sample. Retrieved from https://research.collegeboard.org/publications/validity-sat-predicting-first-year-grades-2010-sat-validity-sample
▪ Poropat, A. E. (2009). A meta-analysis of the five-factor model of personality and academic performance. Psychological bulletin, 135, 322-338.
▪ Roth, P. L., Bevier, C., Bobko, P., Switzer, F. S., & Tyler, P. (2001). Ethnic Group Differences in Cognitive Ability in Employment and Educational Settings: A Meta-Analysis. Personnel Psychology, 54(2), 297-330.
▪ Schmitt, N., Keeney, J., Oswald, F. L., Pleskac, T. J., Billington, A. Q., Sinha, R., & Zorzie, M. (2009). Prediction of 4-Year College Student Performance Using Cognitive and Noncognitive Predictors and the Impact on Demographic Status of Admitted Students. Journal of Applied Psychology, 94(6), 1479-1497.
34