Sea Level Rise Magdalena Anguelova Ph.D. Student Advisor: Prof. Ferris Webster Sea Level Rise 5 min.

Using AIRS data to estimate sublimation/deposition on the
Greenland ice sheet: Comparisons and Climatology
Dr. Linette Boisvert ESSIC/ NASA-GSFC
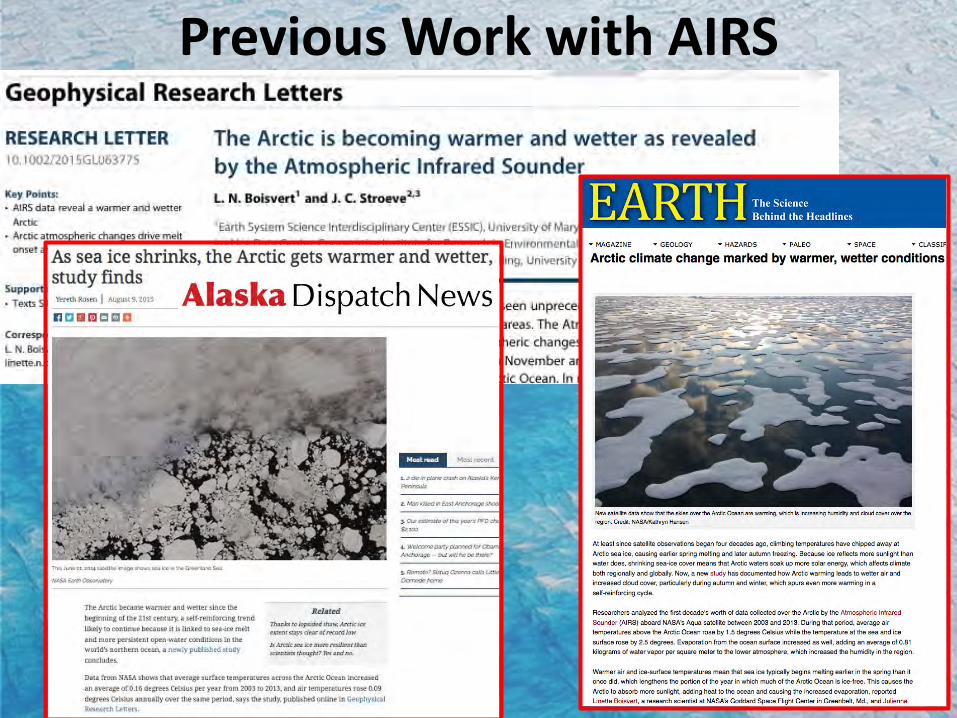
Previous Work with AIRS

Previous Work with AIRS

Sea Level Rise Melting of the ice sheet will cause global sea level rise
anywhere between 3 to > 7 meters Total amount is uncertain (~30% i.e. Rignot et al., 2011) Lack of in situ observations Harsh environment Difficulty in measuring snowfall amounts, sublimation and glacial
runoff
Schaeffer et al., 2012

Way to estimate past and present sea level rise is through mass loss
Greenland mass loss 1990-2008: attributed equally to Solid discharge through outlet glaciers Enhanced runoff from surface melt
2008-present: dominated by surface processes
SMB = Precipitation – Sublimation - Runoff
Surface Mass Balance (SMB)

Want to reduce the uncertainty of this term using improved data and methods Use modified sublimation model from Boisvert et al., 2013;
2015 Use AIRS version 6 level 3 data Compare with in situ measurements Compare with a regional climate model
SMB = Precipitation – - Runoff
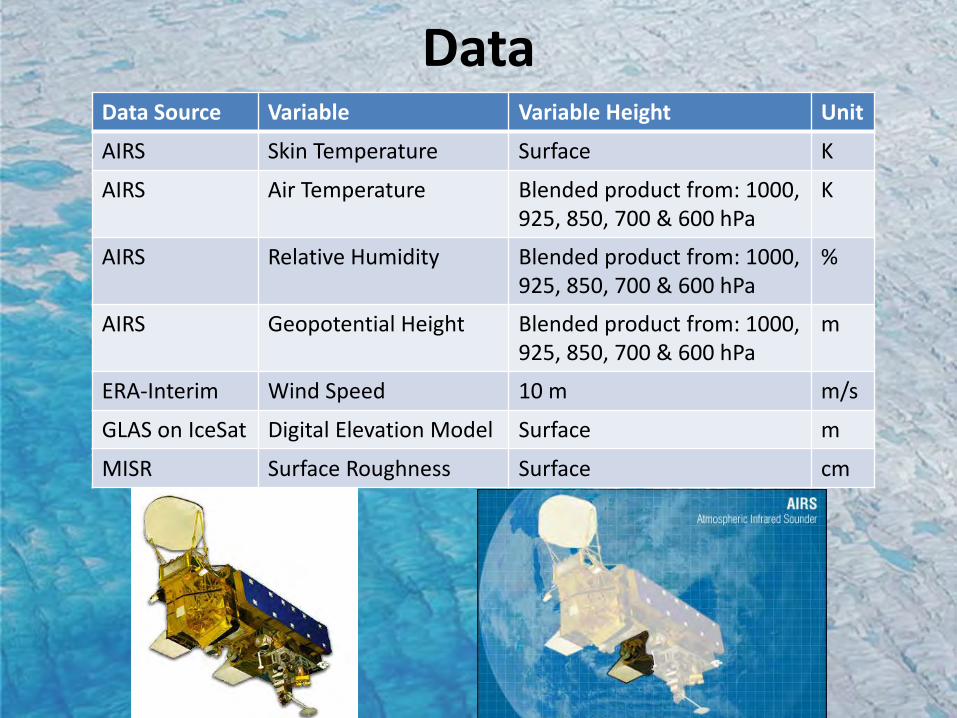
Data Data Source Variable Variable Height Unit
AIRS Skin Temperature Surface K
AIRS Air Temperature Blended product from: 1000, 925, 850, 700 & 600 hPa
K
AIRS Relative Humidity Blended product from: 1000, 925, 850, 700 & 600 hPa
%
AIRS Geopotential Height Blended product from: 1000, 925, 850, 700 & 600 hPa
m
ERA-Interim Wind Speed 10 m m/s
GLAS on IceSat Digital Elevation Model Surface m
MISR Surface Roughness Surface cm
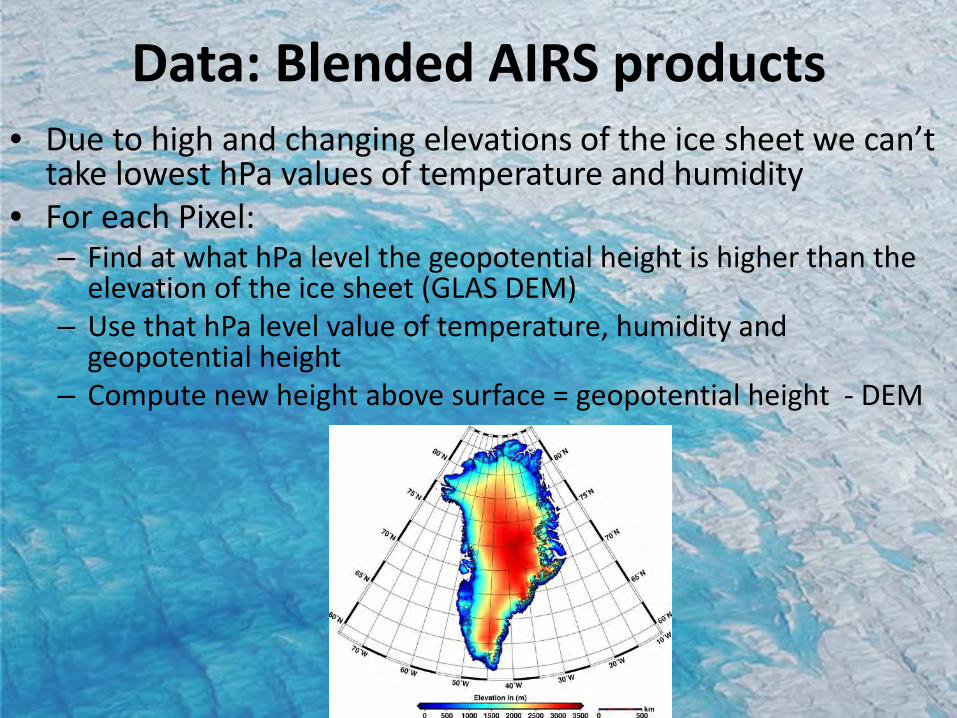
Data: Blended AIRS products • Due to high and changing elevations of the ice sheet we can’t
take lowest hPa values of temperature and humidity • For each Pixel:
– Find at what hPa level the geopotential height is higher than the elevation of the ice sheet (GLAS DEM)
– Use that hPa level value of temperature, humidity and geopotential height
– Compute new height above surface = geopotential height - DEM
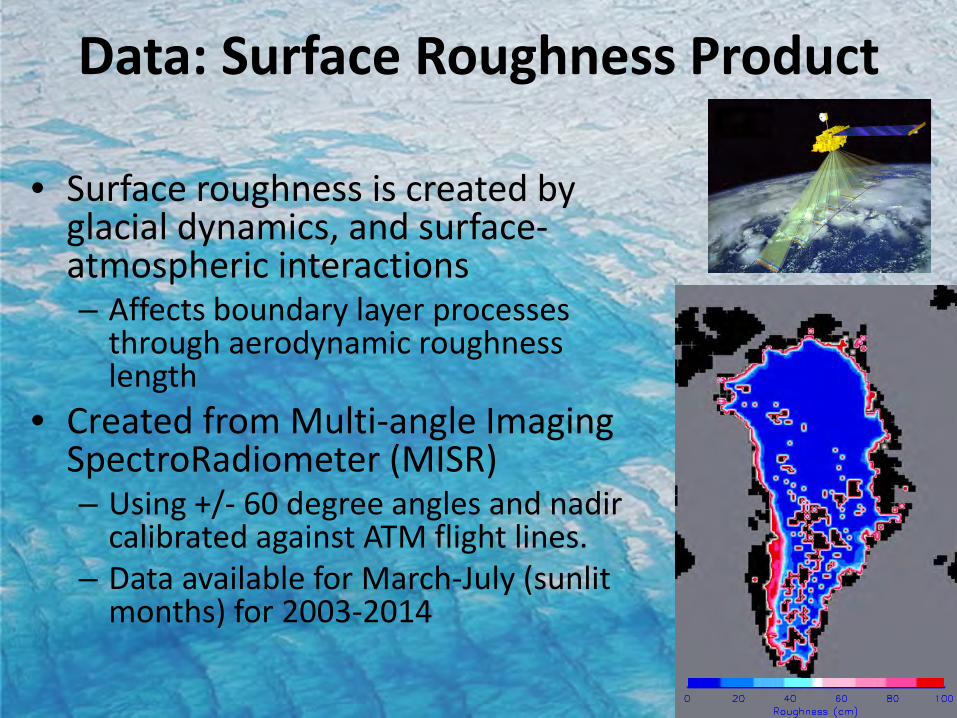
Data: Surface Roughness Product
• Surface roughness is created by glacial dynamics, and surface-atmospheric interactions – Affects boundary layer processes
through aerodynamic roughness length
• Created from Multi-angle Imaging SpectroRadiometer (MISR) – Using +/- 60 degree angles and nadir
calibrated against ATM flight lines. – Data available for March-July (sunlit
months) for 2003-2014

Sublimation Model
• Estimated using Monin-Obukhov Similarity Theory and an iterative calculation scheme based on Launiainen and Vihma [1990].
• Modifications: 1.) Use the flux algorithm of Grachev et al [2007] for stable conditions over ice. 2.) Use the effective wind speed, which includes a parameter for gustiness that is different in stable and unstable boundary conditions [Andreas et al., 2010].
• The iterative method allows for the use of input variables (i.e. air temperature, relative humidity and wind speed) to be measured at varying heights above the surface. – Uses input variables and together with the information on their
observed heights (i.e. the surface elevation minus the geopotential height), determines what they would be at the reference height, which in this case we take to be 2 meters.
E = ρ CEz Sr ( qs,i – qz )
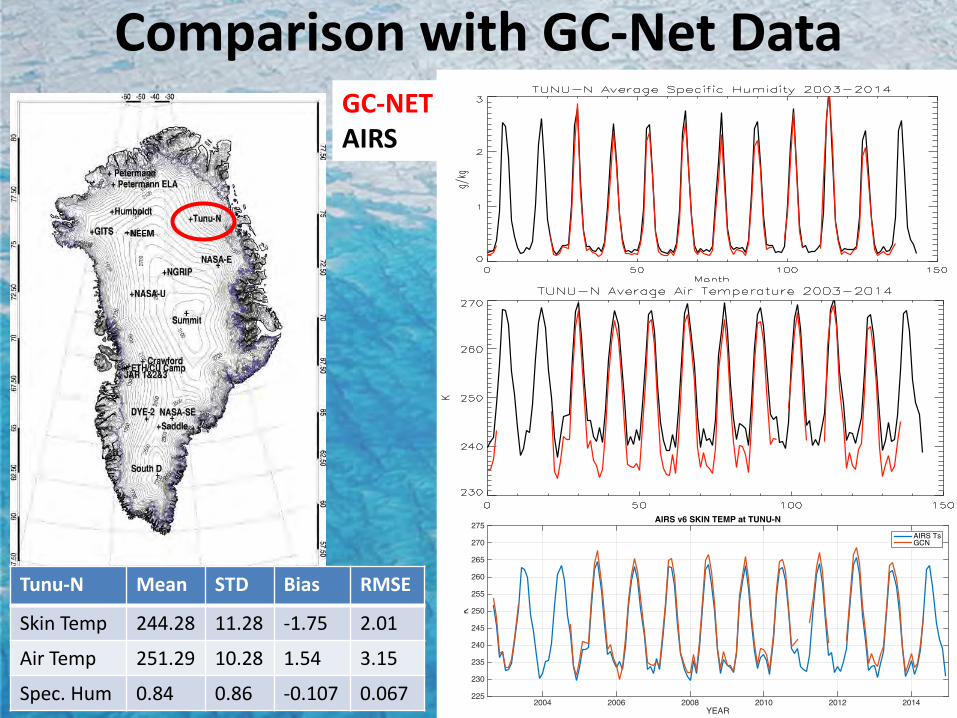
Comparison with GC-Net Data
Tunu-N Mean STD Bias RMSE
Skin Temp 244.28 11.28 -1.75 2.01
Air Temp 251.29 10.28 1.54 3.15
Spec. Hum 0.84 0.86 -0.107 0.067
GC-NET AIRS
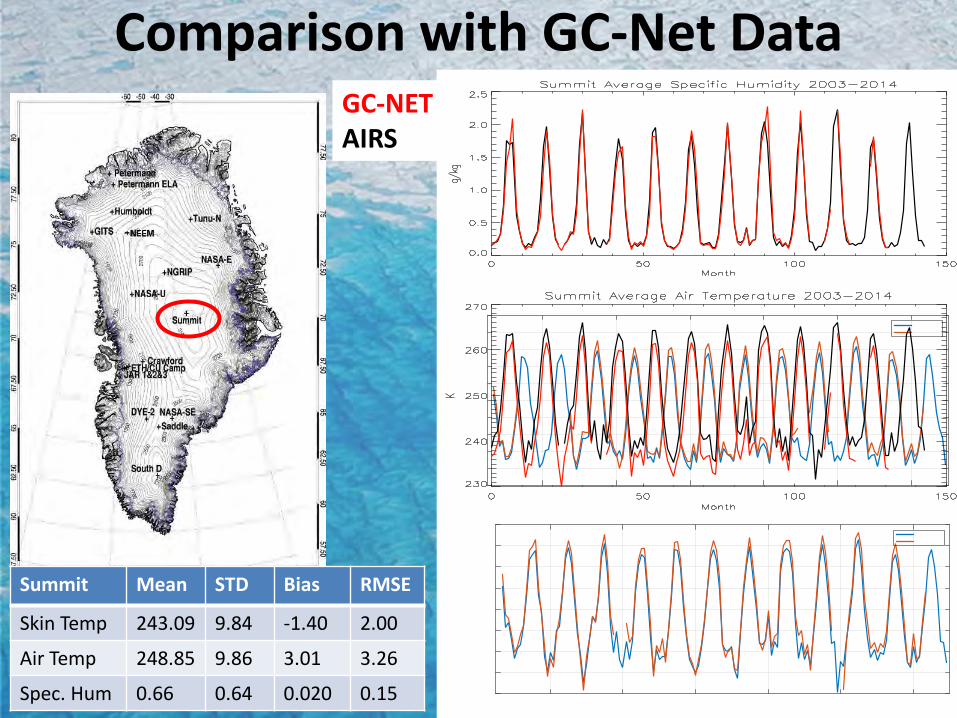
Comparison with GC-Net Data
Summit Mean STD Bias RMSE
Skin Temp 243.09 9.84 -1.40 2.00
Air Temp 248.85 9.86 3.01 3.26
Spec. Hum 0.66 0.64 0.020 0.15
GC-NET AIRS
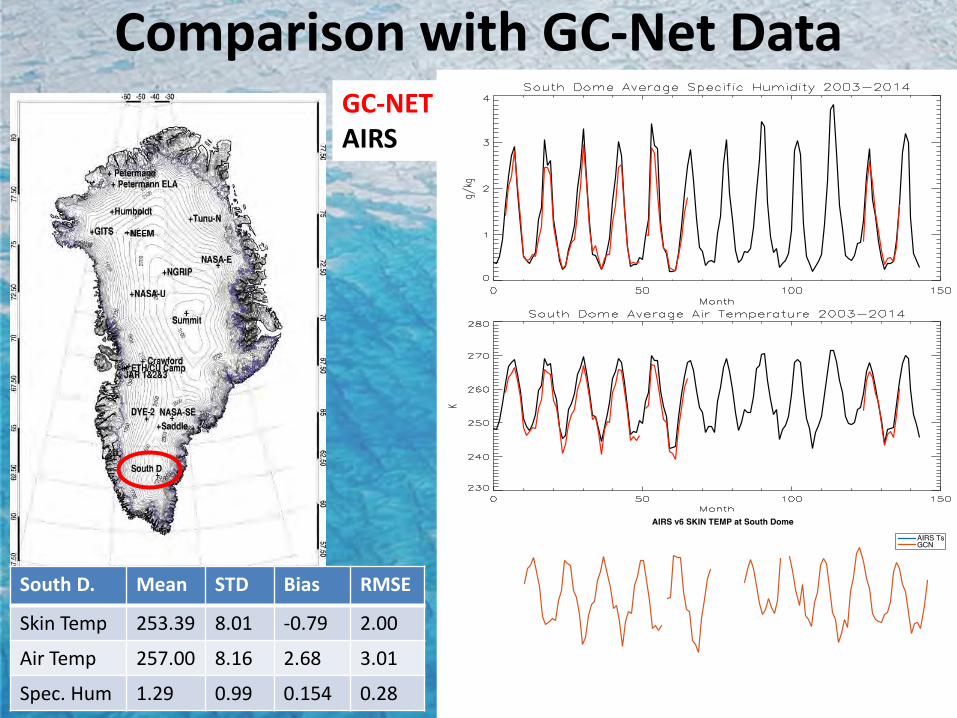
Comparison with GC-Net Data
South D. Mean STD Bias RMSE
Skin Temp 253.39 8.01 -0.79 2.00
Air Temp 257.00 8.16 2.68 3.01
Spec. Hum 1.29 0.99 0.154 0.28
GC-NET AIRS
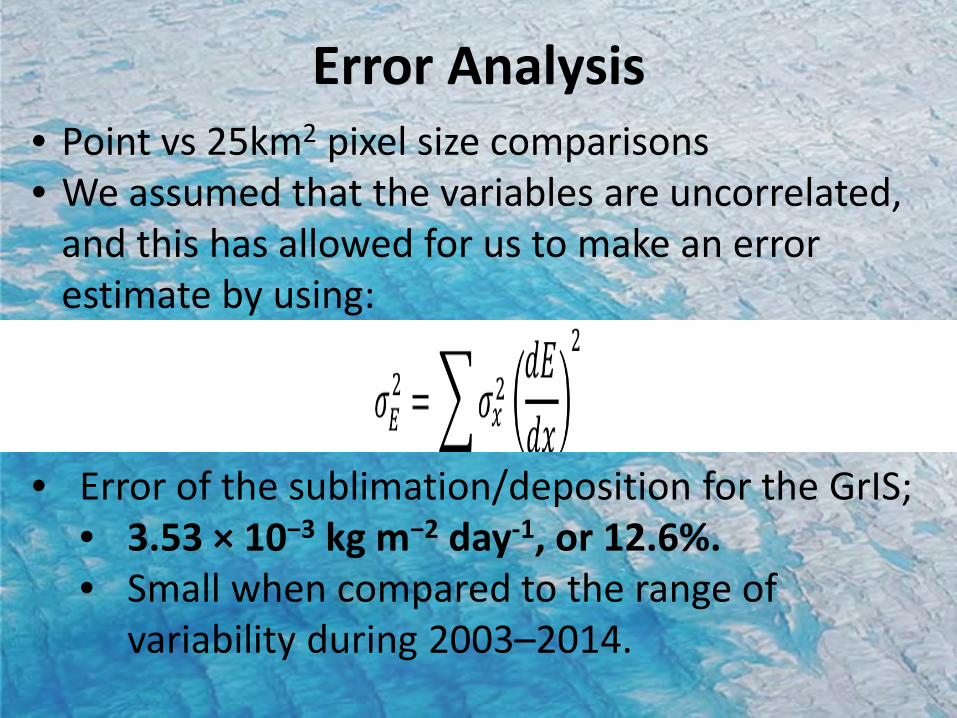
Error Analysis • Point vs 25km2 pixel size comparisons • We assumed that the variables are uncorrelated,
and this has allowed for us to make an error estimate by using:
• Error of the sublimation/deposition for the GrIS; • 3.53 × 10⁻³ kg m−2 day-1, or 12.6%. • Small when compared to the range of
variability during 2003–2014.
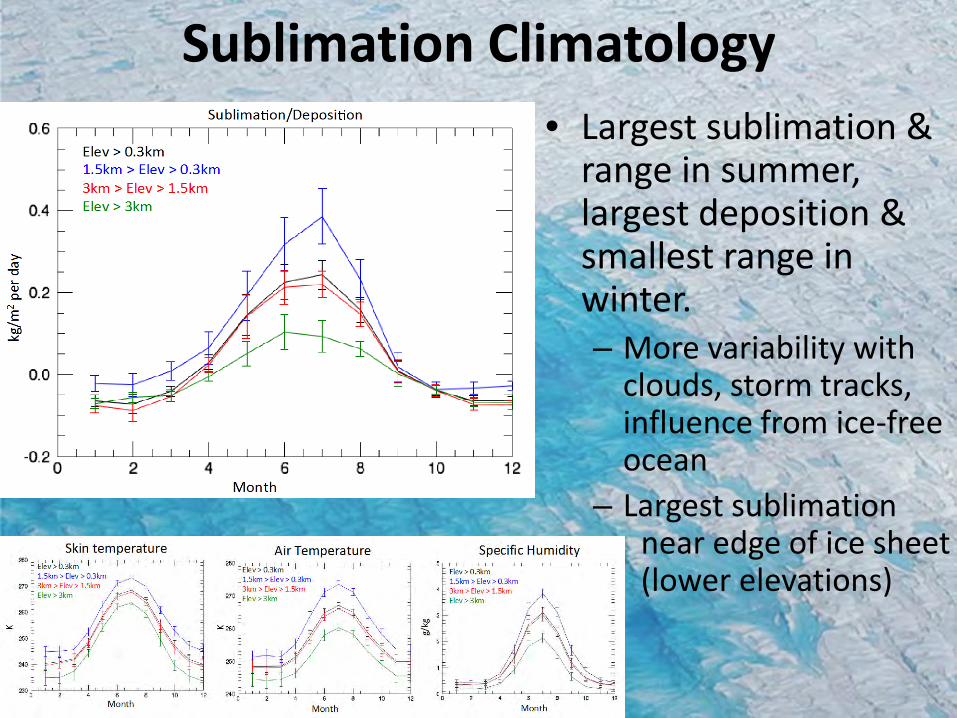
Sublimation Climatology • Largest sublimation &
range in summer, largest deposition & smallest range in winter. – More variability with
clouds, storm tracks, influence from ice-free ocean
– Largest sublimation near edge of ice sheet (lower elevations)

Sublimation Climatology
• Positive anomalies: 2003,2009,2010,2012 – Low humidity, high skin and air temps.
• Negative anomalies: 2005,2006,2011,2013,2014 – High humidity, low skin and air temps.
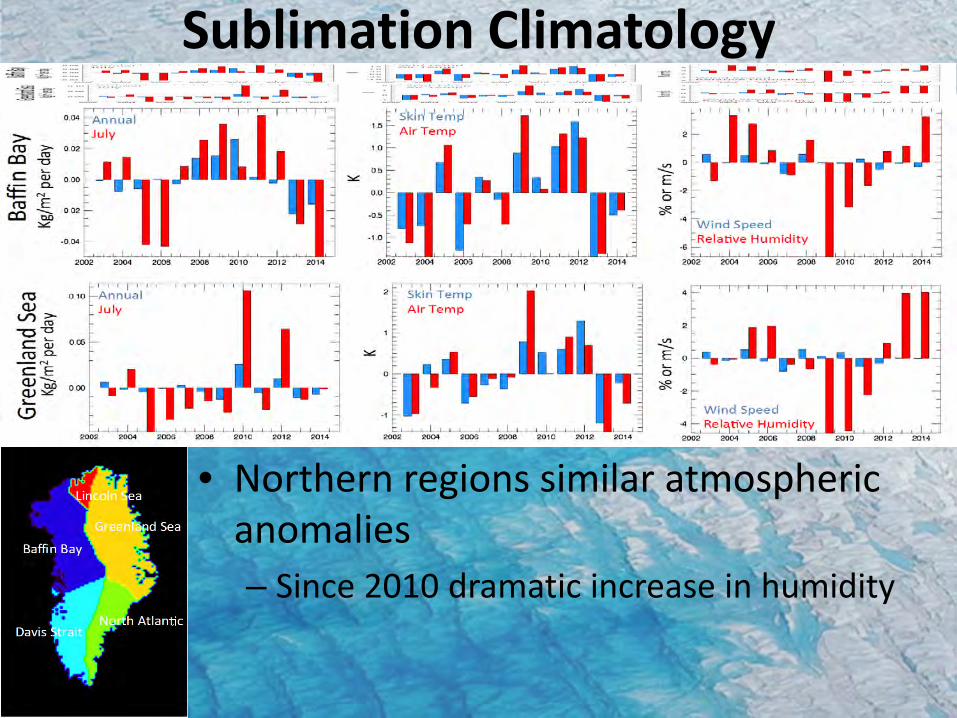
Sublimation Climatology
• Northern regions similar atmospheric anomalies – Since 2010 dramatic increase in humidity

Sublimation Climatology
• Southern regions similar atmospheric anomalies: warming temps 2003-2012
• Affected by storm tracks, and surface melt each year
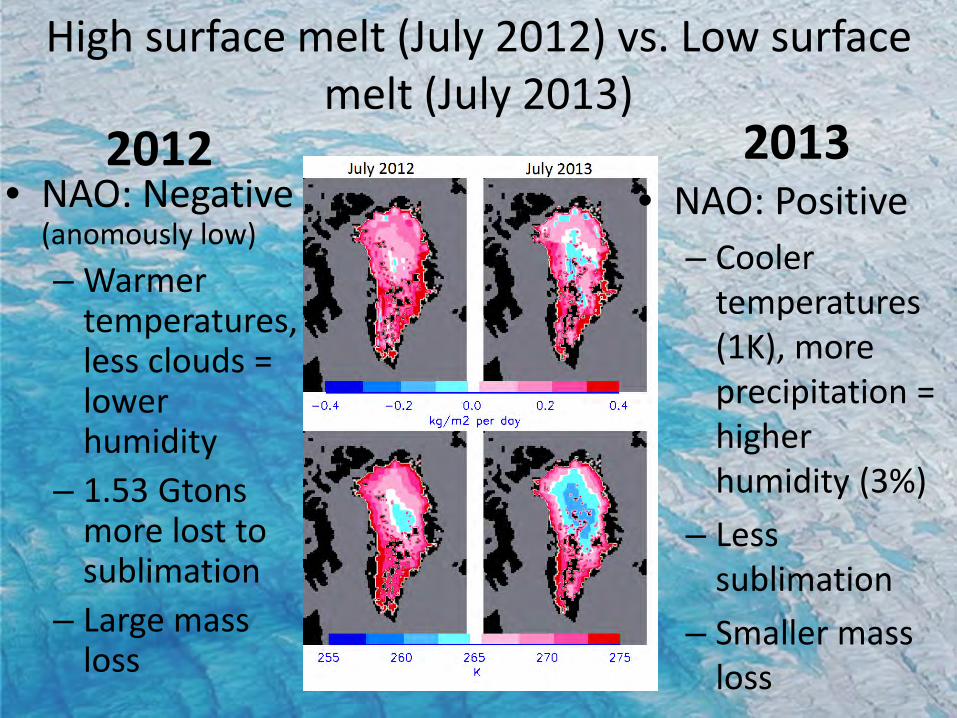
High surface melt (July 2012) vs. Low surface melt (July 2013)
• NAO: Negative (anomously low) – Warmer
temperatures, less clouds = lower humidity
– 1.53 Gtons more lost to sublimation
– Large mass loss
• NAO: Positive – Cooler
temperatures (1K), more precipitation = higher humidity (3%)
– Less sublimation
– Smaller mass loss
2012 2013
Comparison with RACMO2 • In the Polar Regions, where in situ observations are
sparse, near-surface data products are not guaranteed to be more accurate than a satellite product
• Regional Atmospheric Climate MOdel version 2 (RACMO2) – Combines dynamics from HIRLAM and physical processes
from ECMWF – Forced by ERA-Interim at lateral boundaries
• RACMO2 is capable of simulating the Greenland ice sheet temperature, wind speed [Ettema et al., 2010a] and SMB [Noel et al., 2014 ], but a detailed evaluation of sublimation has been hampered by the limited availability of observational data.

Comparison with RACMO2 • Taking the average loss of mass for 2003-2014 due to
sublimation/deposition from the ice sheet, – 23.8 Gt/yr from AIRS and our model (10.4% of SMB) – 14.2 Gt/yr from RACMO2 .(6.2% of SMB)

Comparison with RACMO2
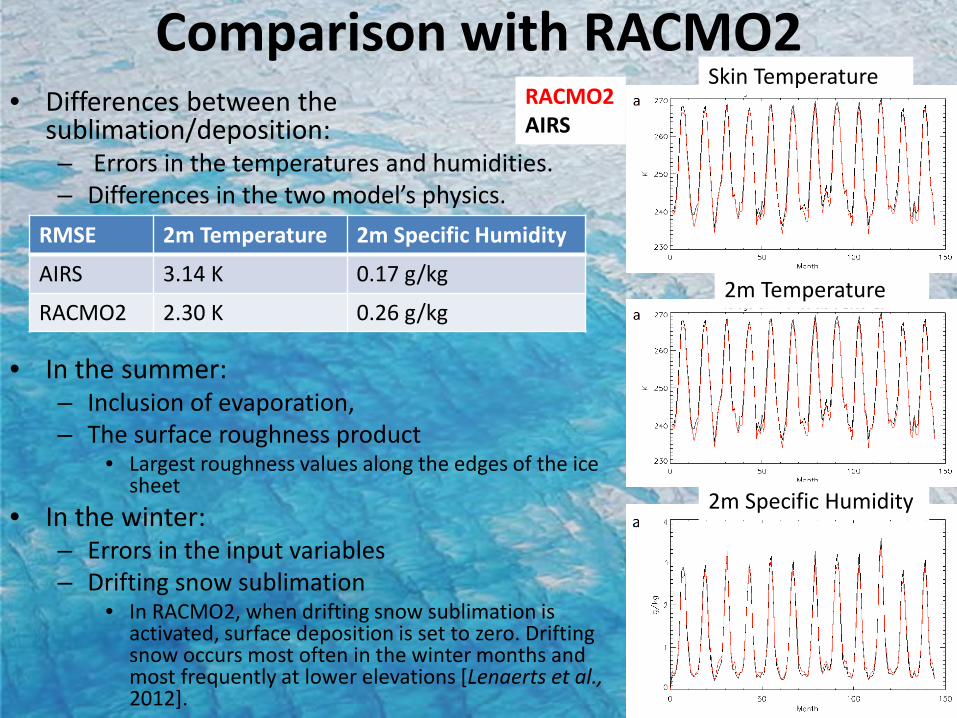
Comparison with RACMO2 • Differences between the
sublimation/deposition: – Errors in the temperatures and humidities. – Differences in the two model’s physics.
• In the summer: – Inclusion of evaporation, – The surface roughness product
• Largest roughness values along the edges of the ice sheet
• In the winter: – Errors in the input variables – Drifting snow sublimation
• In RACMO2, when drifting snow sublimation is activated, surface deposition is set to zero. Drifting snow occurs most often in the winter months and most frequently at lower elevations [Lenaerts et al., 2012].
RMSE 2m Temperature 2m Specific Humidity
AIRS 3.14 K 0.17 g/kg
RACMO2 2.30 K 0.26 g/kg
RACMO2 AIRS
Skin Temperature
2m Temperature
2m Specific Humidity
Conclusions
• In the future with a warming climate, the length and area that the Greenland ice sheet undergoes melt each summer is expected to increase. – The amount of sublimation could increase, especially
with increases in the amount of evaporation. • Will contribute to the surface mass loss by mitigating
increases in precipitation (changes are uncertain).
• Data products from AIRS can be useful for estimating the sublimation on the Greenland ice sheet.