
Using a Differential Item Functioning (DIF) Procedure to ...
22
Using a Differential Item Functioning (DIF) Procedure to Detect Differences in Opportunity to Learn (OTL): An Extension of Winfield’s Approach Lan Yu University of Pittsburgh Hoi K. Suen and Pui-Wa Lei Penn State University Abstract Conventional data collection and analyses to evaluate o��ortunity to learn data collection and analyses to evaluate o��ortunity to learn o��ortunity to learn (��L is ti�e and energy intensive. We �ro�ose an e�tension of an alternative ��L is ti�e and energy intensive. We �ro�ose an e�tension of an alternative is ti�e and energy intensive. We �ro�ose an e�tension of an alternative is ti�e and energy intensive. We �ro�ose an e�tension of an alternative We �ro�ose an e�tension of an alternative e �ro�ose an e�tension of an alternative an alternative approach suggested by Winfield (1993) by using a �ethod to detect di��erential a �ethod to detect differential differential ite� functioning (DIF to select ite�s. �hese ite�s are then used as initial to select ite�s. �hese ite�s are then used as initial to select ite�s. �hese ite�s are then used as initial indicators of �ossible difference in ��L in target schools. �his study e�a�ines in target schools. �his study e�a�ines �his study e�a�ines the feasibility of using the �antel-Haens�el DIF �ethod to detect different �antel-Haens�el DIF �ethod to detect different DIF �ethod to detect different ��Ls in rural and urban schools with data fro� the China Biology �ly��iads ��en E�a�. DIF results are found to be associated with teachers’ content coverage ratings and the theoretical ite� classification. It is concluded that the �ro�osed �ethod can be used as an initial ste� for ��L evaluation when the two ty�es of schools are equivalent on a�titude, and the test ite�s cover content area(s with ��L �roble�. Introduction The evaluation of opportunity to learn (OTL) has been an important challenge in education for both policy makers and educational researchers. OTL studies can be traced back to Carroll’s �odel of School Learning (Carroll, 1963). In this conceptual model, he specified five factors that affect students’ success in school: aptitude, ability to understand instruction, perseverance, quality of instruction, and time (opportunity) allowed for learning. �he first �he first three factors represented student capacities while the last two were situated in
Transcript of Using a Differential Item Functioning (DIF) Procedure to ...

Using a Differential Item Functioning (DIF) Procedure to Detect Differences in Opportunity to Learn (OTL): An Extension of Winfield’s Approach
Lan YuUniversity of Pittsburgh
Hoi K. Suen and Pui-Wa LeiPenn State University
AbstractConventional data collection and analyses to evaluate o��ortunity to learndata collection and analyses to evaluate o��ortunity to learno��ortunity to learn (��L�� is ti�e and energy intensive. We �ro�ose an e�tension of an alternative��L�� is ti�e and energy intensive. We �ro�ose an e�tension of an alternative�� is ti�e and energy intensive. We �ro�ose an e�tension of an alternative is ti�e and energy intensive. We �ro�ose an e�tension of an alternativeWe �ro�ose an e�tension of an alternativee �ro�ose an e�tension of an alternative an alternative approach suggested by Winfield (1993) by using a �ethod to detect di��erential a �ethod to detect differentialdifferential ite� functioning (DIF�� to select ite�s. �hese ite�s are then used as initial to select ite�s. �hese ite�s are then used as initialto select ite�s. �hese ite�s are then used as initial indicators of �ossible difference in ��L in target schools. �his study e�a�ines in target schools. �his study e�a�ines �his study e�a�ines the feasibility of using the �antel-Haens�el DIF �ethod to detect different�antel-Haens�el DIF �ethod to detect different DIF �ethod to detect different ��Ls in rural and urban schools with data fro� the China Biology �ly��iads ��en E�a�. DIF results are found to be associated with teachers’ content coverage ratings and the theoretical ite� classification. It is concluded that the �ro�osed �ethod can be used as an initial ste� for ��L evaluation when the two ty�es of schools are equivalent on a�titude, and the test ite�s cover content area(s�� with ��L �roble�.
Introduction
The evaluation of opportunity to learn (OTL) has been an important challenge in education for both policy makers and educational researchers. OTL studies can be traced back to Carroll’s �odel of School Learning (Carroll, 1963). In this conceptual model, he specified five factors that affect students’ success in school: aptitude, ability to understand instruction, perseverance, quality of instruction, and time (opportunity) allowed for learning. �he first�he first three factors represented student capacities while the last two were situated in

Journal of Educational Research & Policy Studies
�teachers and schools. The last factor, time allowed for learning, became the. The last factor, time allowed for learning, became the rudimental element of O�L. Carroll defined O�L as the actual time available to individual students to learn and the proper pacing of instruction.
This definition has been echoed by the International Association of Education Achievement as “Whether or not … students have had the opportunity to study a particular topic or learn how to solve a particular type of problem presented by the test” (Burstein, 1993, p. 33). In contrast to Carroll’s model, Husén (1967) defined O�L as the relationship between the content taught to the students and the content tested by the achievement test. One way to look at the distinctions between the two definitions was to treat Carroll’s as a “quantitative” (actual time spent on learning, p. 3,682) definition and Husén’s as a “qualitative” (the match between what is taught and what is tested, p. 3,682) definition (Anderson, 1985).
Some researchers have modified the labels of OTL to show the distinctions between the two definitions of O�L. For example, Wiley and Harnischfeger (1974) referred to Carroll’s OTL as “allocated time” (p. 11). For Husén’s conceptualization, Cooley and Leinhardt (1980) used the term “content coverage” (p. 8) while Leinhardt and Seewald (1981) described it as “content overlap” (p. 85).
In spite of the difference between these two O�L definitions, researchers do agree on the importance of assessing OTL. This sense of importance has come from both policy makers and education researchers. Herman, Klein and Abedi (2000) provided a comprehensive summary on the importance of assessing OTL. They stated that, from the perspective of policy makers, OTL measures can provide “critical information on how their policies are operating and essential feedback on whether assumptions underlying the policies are accurate” (p. 17). For education researchers, “data on O�L can verify that all students have the opportunity to engage in the kinds of curricula and instruction that would prepare them to achieve expected standards” (p. 17). More than that, an OTL study can provide useful information to schools to help decision-making in curricular or instructional reform (Yoon & Resnick, 1998).
Methods to Evaluate OTL
�o assess the O�L for a given educational organization, traditional measures have included the adequacies of content coverage, content exposure,

Spring 2008 / Volu�e 8, Nu�ber 1
3 content emphasis, and quality of instructional delivery (Wang, 1998). Common methods used for collecting OTL data have included curriculum analyses, questionnaires, and teacher and student interviews. Even though these common measures and methods exist, the actual process of assessing O�L can be rather complicated (Guiton & Oakes, 1995). �he difficulty comes from the multidimensional nature of O�L. Most researchers would agree O�L should reflect at least the resources that students can access, curriculum that schools have implemented, and instruction to which students have access (Burstein, 1993; Guiton & Oakes, 1995; Wiley & Yoon, 1995). �here are certainly many ways to collect data on each of these dimensions, such as classroom observation, curriculum inspection, and teacher interviews. The costs and efficiency of data collection, however, are inevitably of great concern.
Another difficulty of assessing O�L arises from how and from whom it is best to collect O�L data (Herman, Klein, & Abedi, 2000). It is not known whether OTL data collected from students are better than those from teachers, or vice versa. It is also not known which survey method is best for OTL data collection. �herefore, in the �hird International Mathematics and Science Study (�IMSS), Schmidt and McKnight (1995) chose to collect the most comprehensive data. They included teacher and student surveys, observations, and detailed information on instruction and curriculum from schools in over 40 countries. These researchers admitted that “the overall result was a massive, daunting collection of documents to be analyzed, tracked for procedural errors, subjected to a variety of quality assurance procedures, and entered into an appropriate database” (Schmidt & McKnight, 1995, p. 343).
Existing methods to evaluate the adequacy of O�L generally require an extensive program of data collection. It is time-consuming and requires the use of considerable resources. Further, these methods attempt to assess OTL at the global, system-wide level of schools as well as the sub-levels of classes and teachers within the larger organization. �hese methods all start from the top level. Perhaps a more efficient alternative is to start from the level of specific individual symptoms.
Focusing on the testing end of the equation of O�L, Winfield (1993) investigated test content and curriculum content overlap (i.e., curricular validity) by asking teachers to rate each test item on a 5-point scale in terms of content coverage. Specifically, each item was rated in the following six perspectives: (1) The number of times a concept was taught, (�) the frequency
Journal of Educational Research & Policy Studies
4of review of this concept, (3) the number of settings in which the particular test format was used to teach this concept, (4) the frequency of usage of the format, (5) the extent to which the concept was emphasized in the curriculum, and (6) teachers’ perception of student mastery of the concept. This placedThis placed a great deal of labor-intensive demand on the teachers. It was also not very cost-efficient as most of the test items were not problematic. In light of this. In light of thisIn light of this limitation, the author suggested an alternative by “having administrators or“having administrators or teachers pre-select several items, based on some criteria of presumed coverage or lack of coverage in the test, textbook, or curriculum...” (Winfield, 1993, p. 306). However, in terms of the criteria of test items pre-selection, Winfield offered no clear guidance.
The Use of DIF Methods to Guide OTL Evaluation
We suggest that it might be possible to seek such item selection guidance from the application of existing methods in differential item functioning (DIF) analysis. In test construction, DIF is a common procedure to identify items that function differentially across examinees from different groups. DIF refers to the differential probability of a correct response for examinees at the samethe differential probability of a correct response for examinees at the same trait level but from different groups (Pine, 1977). �raditional DIF analyses �raditional DIF analyses have typically contrasted the performances of two groups that differ in race (Park, Pearson, & Reckase, 2005), gender (Fletcher & Hattie, 2005), ethnicity (Freedle & Kostin, 1997), income (Gelin & Zumbo, 2003), first language spoken at home (Emenogu & Childs, 2003), or other similar demographic variables. While these analyses have been effective in detecting items that function differentially, the results offered no information as to why the itemsthe items have functioned differentially with respect to these variables.Although Ercikan with respect to these variables.Although Ercikan. Although Ercikan (2002) has studied the strategies of identifying the sources that had caused DIF, the most common explanations that have been offered to date for DIF have been related to a common theme of unequal O�Ls (e.g., Miller & Linn, 1988; Muthén et al., 1995). Given the perceived relationship between DIF and O�L, it would seem logical to use DIF methods to help select items in order to evaluate adequate coverage and thus O�L, as suggested by Winfield (1993).
This can be accomplished by identifying two types of schools suspected of offering different O�Ls and using DIF methods to analyze common test

Spring 2008 / Volu�e 8, Nu�ber 1
5 items. Items that are found to exhibit DIF would be potential indicators of Items that are found to exhibit DIF would be potential indicators of different OTLs between the two types of schools investigated. A further content coverage review on test items would either confirm or disconfirm that a difference in O�Ls is the source of the DIF found in those particular items. If O�L is found to be a source of DIF, a more comprehensive system-wide evaluation of O�L may then be warranted. Still, these DIF items would help evaluators to isolate possible areas of concern as they evaluate the OTL of the schools. If, on the other hand, the results show no DIF items, it would suggest that a system-wide large-scale evaluation of OTL may not be warranted.
Efficacy of the Proposed Use of DIF
In order to evaluate the feasibility of this proposed method, two types of schools were used in our study; namely, rural and urban high schools in one region of the Hebei province in China. The test content area was high school biology. In the area of biology, these two types of schools in the selected region share the same basic official curriculum but differ in resources on advanced topics (Y. E. Han, personal communication, October 15, 2004). Urbanrban schools in this region tend to have better resources such as new educationalthis region tend to have better resources such as new educational tend to have better resources such as new educational technologies, highly skilled teachers, and access to information on advancedadvanced topics in given content areas. But rural schools tend to have limited resourcess in given content areas. But rural schools tend to have limited resources But rural schools tend to have limited resources for the coverage of advanced topics, such as laboratory equipment, teachers with advanced training, advanced reference materials, and tutorial support.
The test used in this study was the China Biology Olympiads (CBO) the China Biology Olympiads (CBO) Open Exam, used in all urban and rural schools throughout Hebei province. �he 40 multiple-choice items within this exam were selected for DIF analyses. These items covered the following content areas: (a) molecular biology, biochemistry, and microbiology, (b) plant anatomy and physiology, (c) animal anatomy and physiology, (d) genetics and evolution, and (e) ecology. Each of these items had been classified by the Regional Chief Administrator in charge of biology instruction as either measuring basic curriculum or advanced topics (Y. E. Han, personal communication, October 15, 2004). �able 1 shows the content area measured by each item and whether the item belongs to basic curriculum or advanced topics.
The item-by-item responses from a sample of 684 students taking thetaking the CBO Open Exam in the targeted region of Hebei province were used in thisin the targeted region of Hebei province were used in thisregion of Hebei province were used in this Hebei province were used in thisused in this

Journal of Educational Research & Policy Studies
6Table 1Theoretical Ite� Classification and DIF Results
Item Al�ha � �-value �H D-DIF SE Label
1 (PP)a 1.�61 0.620 .431 -0.546 0.593 A
� (PP) 0.915 0.216 .64� 0.209 0.384 A
3 (PP)** 0.573 7.144 .008 1.309 0.475 B
4 (MM) 1.410 �.774 .096 -0.808 0.456 A
5 (MM) 1.018 0.000 .985 -0.043 0.407 A
6 (MM)*** 2.602 17.101 .000 -�.�48 0.537 C
7 (MM)*** 0.178 42.056 .000 4.057 0.657 C
8 (GE)** 1.709 6.847 .009 -1.259 0.463 B
9 (GE) 1.137 0.424 .515 -0.302 0.408 A
10 (GE) 1.�8� 1.934 .164 -0.583 0.393 A
11 (AP) 1.152 0.454 .500 -0.333 0.432 A
1� (GE) 0.799 0.748 .387 0.527 0.539 A
13 (MM)*** 2.522 13.665 .000 -�.174 0.589 C
14 (MM) 0.848 0.792 .373 0.388 0.399 A
15 (PP) 1.439 3.837 .050 -0.856 0.417 A
16 (PP) 1.�94 1.196 .�74 -0.606 0.504 A
17 (PP) 1.206 0.770 .380 -0.440 0.445 A
18 (EL) 0.940 0.083 .773 0.145 0.392 A
19 (PP) 0.783 1.680 .195 0.575 0.413 A
20 (GE) 0.684 3.384 .066 0.893 0.462 A

Spring 2008 / Volu�e 8, Nu�ber 1
7 Table 1 (continued)
Item Al�ha � �-value �H D-DIF SE Label
�1 (GE) 1.184 0.814 .367 -0.398 0.402 A
�� (PP)*** 0.480 19.390 .000 1.7�4 0.395 B
�3 (EL)*** 0.449 14.�8� .000 1.884 0.498 B
�4 (AP) 1.481 �.9�� .087 -0.923 0.507 A
25 (MM)*** 2.100 9.185 .002 -1.744 0.561 B
26 (GE)* 0.638 5.444 .020 1.056 0.436 B
27 (MM) 0.729 3.39� .066 0.743 0.390 A
�8 (EL)* 0.636 6.439 .011 1.065 0.410 B
29 (MM) 1.187 0.658 .417 -0.404 0.444 A
30 (GE) 1.347 2.351 .125 -0.700 0.430 A
31 (AP) 1.1�7 0.422 .516 -0.281 0.385 A
32 (PP) 1.159 0.578 .447 -0.346 0.407 A
33 (MM)*** �.1�3 9.840 .002 -1.770 0.557 B
34 (GE) 0.970 0.009 .9�� 0.072 0.397 A
35 (GE) 1.399 �.114 .146 -0.790 0.509 A
36 (EL) 0.995 0.004 .953 0.013 0.421 A
37 (AP)* 1.460 4.�38 .040 -0.889 0.418 A
38 (GE) 0.857 0.686 .407 0.362 0.397 A
39 (AP) 0.940 0.078 .781 0.145 0.398 A
40 (GE) 0.789 1.869 .17� 0.558 0.384 A
Note.Items in bold are those measuring advanced topics in the theoretical item classification. a. The letters in parentheses are the corresponding content areas for each item: MM=Molecular biology, biochemistry & microbiology; PP=Plant anatomy & physiology; AP=Animal anatomy & physiology; GE=Genetics & evolution; EL=Ecology. * stands for the corresponding �-value is significant at .05 level, ** for .01 level, and *** for .001 level.
Journal of Educational Research & Policy Studies
8study. Half of the students (n = 342) were randomly selected from rural schools and half (n = 34�) were selected from urban schools within this region. Students in this sample came from seven rural and three urban schools. Responses to the 40 multiple-choice items were analyzed using the Mantel-tems were analyzed using the Mantel- were analyzed using the Mantel-analyzed using the Mantel-Mantel-Haenszel (M-H) DIF method (Holland & �hayer, 1988). �he M-H procedure. �he M-H procedure �he M-H procedure was selected because of its simplicity, stability across populations and ease of interpretation (Clauser & Mazor, 1998).
�hrough the M-H DIF analyses, items on the CBO Open Exam that were identified as functioning differentially between rural and urban students, regardless of their directions, would be taken as indicators of potential areas of OTL problems in biology instruction in these two types of schools. To evaluate whether these DIF items indeed reflect O�L problems, a survey of content coverage was conducted in which teachers were asked to indicate whether they had provided coverage of the content area reflected in each of the items in the test. The discrepancy or consistency of ratings between rural and urban teachers serves as an indicator of different OTLs in these two types of schools. It was hypothesized that items showing DIF would be associated with discrepant ratings of content coverage between rural and urban teachers. Conversely, items showing no DIF would be associated with the consistent ratings of content coverage between rural and urban teachers.
Furthermore, as discussed above, basic curriculum was covered in regular classes but advanced topic required extra resources and/or extra tutorial support. Urban and rural classes differ in resources. Hence, our expectation was that advanced topic items would tend to exhibit DIF while basic curriculum items would not. To investigate this relationship, the correspondence between DIF/non-DIF and basic/advanced classification as had been determined by the Regional Chief Administrator was then analyzed.
Implementation of M-H DIF analyses �he program EZDIF version 1.0 developed by Waller (1998) was used
to implement the M-H DIF analyses. It provides a chi-square test of DIF for statistical significance as well as a measure of the magnitude of DIF based on a classification scheme proposed by the Educational �esting Services. Items can be categorized into three levels of DIF: �ype A exhibits negligible DIF, �ype B exhibits a moderate level of DIF and �ype C exhibits clear and strong DIF. �ype C items are generally of concern. For the purpose of the
Spring 2008 / Volu�e 8, Nu�ber 1
9 DIF analyses, students from rural schools were treated as the focal group (coded as 1); while those from urban schools were treated as the reference group (coded as 0). �he item response data from the sample were submitted to EZDIF for analyses. In order to control for ability, the total score of the 40 multiple-choice items was used as the matching variable in the first of a two-step iterative procedure suggested by Holland and Thayer (1988). In the second iteration, item(s) identified as �ype C DIF items were excluded from the total score in order to obtain a pure matching variable that was not affected by the presence of DIF items. �hat is, overall biology abilities as represented by the total score with those DIF items removed was used as the matching variable in the second iteration and that the final DIF items were the results after adjusting for those DIF items in the total score.
Implementation of Content Coverage Survey In order to examine whether observed DIF/non-DIF classification was
associated with a content coverage gap between rural and urban high schools, and thus difference in OTL, a questionnaire was administered to all teachers of biology in the region from which the biology exam data were collected. Each teacher was asked to rate the extent to which the content area in each of the 40 items had been covered in their own classes by selecting “never mentioned,” “mentioned once or twice,” or “taught briefly,” �his 3-point scale has been widely used in surveying high school biology teachers in their teaching in that region (Y. E. Han, personal communication, October 15, 2004). This questionnaire was distributed to all 19 biology teachers (nine teachers in rural schools and ten teachers in urban schools) from the same region by mail. Seven high school biology teachers responded to this questionnaire. Four of the respondents were from urban high schools and three were from rural high schools.
Comparing Results between DIF Analysis and Content Review Before DIF items were interpreted as an indirect indicator of differences in O�L between rural and urban schools, the consistencies/discrepancies ofconsistencies/discrepancies ofof content coverage between rural/urban teachers, which was taken as a proxybetween rural/urban teachers, which was taken as a proxys, which was taken as a proxy taken as a proxyas a proxy a proxy measure of possible differences in O�L, were examined., were examined. The proportion of teachers rating the item as “taught briefly” versus that rating it as “never mentioned” or “mentioned once or twice” (the latter two categories were
Journal of Educational Research & Policy Studies
10collapsed because mentioning no more than twice was not considered taught) was calculated separately for rural and urban teachers. Because of the small and unequal sample size of teachers, ratings were considered consistent if the proportions rating “taught briefly” were within .25 of one another. And if the difference in proportions rating between rural and urban teachers was larger than .25, ratings were considered discrepant. �o test the hypotheses of relationship of items flagged as DIF/non-DIF (i.e., �ype A items were considered non-DIF while �ypes B and C were considered DIF) and discrepant/consistent ratings between rural and urban school teachers, DIF results were compared against the consistency/discrepancy of rating results via a 2x2 contingency table analysis. The statistics including the overall hit rate, positive predictive power (hit rate for DIF items), the negative predictive power (hit rate for non-DIF items), false positive rate, false negative rate, specificity, sensitivity, and Fisher’s exact test were calculated.
Comparing Results between DIF Analysis and Theoretical Expectation It was hypothesized that items flagged as DIF/non-DIF were associated with items classified as basic/advanced by the Regional Chief Administrator. �o test that hypothesis, DIF results were compared against the content classification of items via a second 2x2 contingency table analysis. �he statistics including the overall hit rate, positive predictive power (hit rate for advanced items), the negative predictive power (hit rate for basic items), false positive rate, false negative rate, specificity, sensitivity, and Fisher’s exact probability test.
Resultsesults
Table � shows the descriptive statistics of total score for the whole sample as well as for the urban and rural sub-samples. The overall sample mean was 22.79. �he urban sample mean was 23.70, which was higher than the rural sample mean, 21.88. As had been expected, urban students performed better than rural students in the sample.
In the first round of M-H DIF analyses, items 6, 7 and 13 were identified as �ype C DIF items. �hese three items were excluded from the total score to obtain a pure matching variable in the second round of DIF analysis. In the second iteration, items 6, 7, and 13 were found to remain �ype C DIF

Spring 2008 / Volu�e 8, Nu�ber 1
11 Table ��Descri�tive Statistics of �otal Score
n � SD Skewness Kurtosis
Total Sample 684 ��.79 4.65 -0.28 (0.09) -0.37 (0.19)
Urban Sample 34� 23.70 4.06 -0.47 (0.13) 0.13 (0.26)
Rural Sample 34� �1.88 5.02 -0.01 (0.13) -0.60 (0.26)
Note. The numbers in parentheses are the corresponding standard errors.
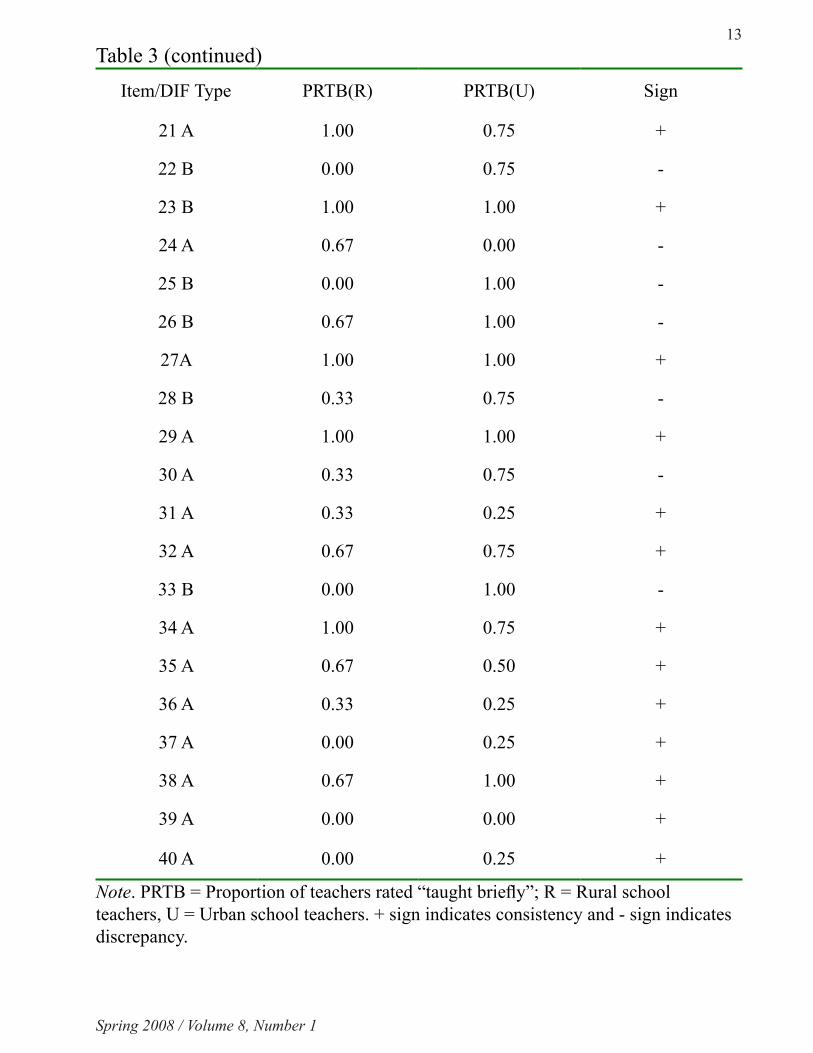
items. �able 1 shows the final DIF results of the 40 items along with the corresponding content areas. As shown in Table 1, items 6, 7, and 13 were found to exhibit large DIF (i.e., �ype C), and items 3, 8, 22, 23, 25, 26, 28, and 33 were classified as �ype B (moderate DIF). �able 3 shows the rating results as well as the signs indicating whether there was a consistency (a "+" sign was assigned) or a discrepancy (a "–" sign was assigned) of content coverage ratings between rural and urban school teachers.
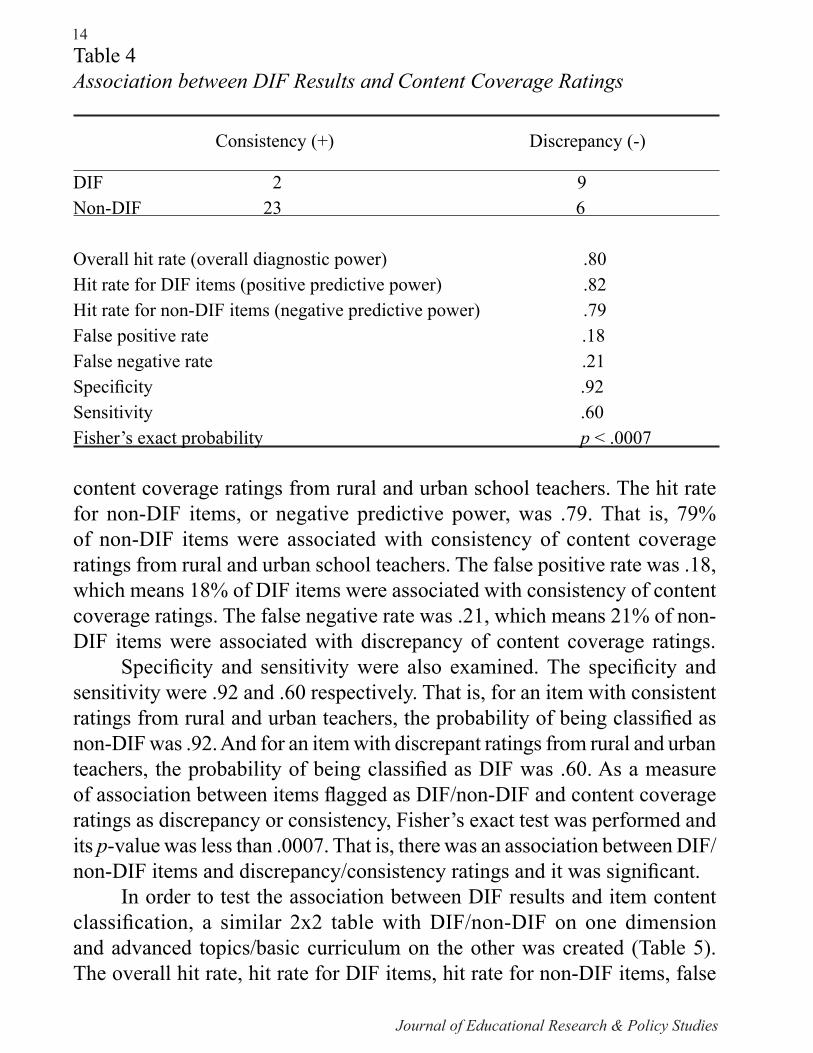
Based on the number of plus and minus signs and the number of DIF and non-DIF items, a 2x2 table with DIF/non-DIF on one dimension and discrepancy/consistency on the other was created (�able 4). �he overall hit rate, hit rate for DIF items, hit rate for non-DIF items, false positive rate, false negative rate, specificity, sensitivity, and Fisher’s exact test were also summarized in �able 4.
For the 11 items flagged as DIF, nine of them were found to show a discrepancy of content coverage ratings between rural and urban school teachers, and only two of them were found to reflect areas without discrepancies in O�L. For the other 29 items classified as non-DIF, 23 of them were found to have no discrepancy in OTL in terms of content coverage between rural and urban school teachers, and six of them showed a discrepancy. Based on this 2x2 table, several statistics measuring the association of DIF/non-DIF items and discrepancy/consistency of content ratings were calculated. �he overall hit rate, or the overall predictive power, was .80. �hat is, 80% of items were associated with content ratings as we expected (i.e., DIF items were associated with discrepancy of content coverage ratings while non-DIF items were associated with consistency of content coverage ratings). Specifically, the hit rate for DIF items, or called positive predictive power, was .82. �hat is, 82% of DIF items were associated with discrepancy of

Journal of Educational Research & Policy Studies
1�Table 3Rating Results fro� �hree Rural and Four Urban High School �eachers
Item/DIF �ype PRTB(R) PR�B(U) Sign
1 A 1.00 1.00 +
� A 0.00 0.75 -
3 B 0.00 0.00 +
4 A 0.67 0.75 +
5 A 1.00 1.00 +
6 C 0.00 1.00 -
7 C 0.67 1.00 -
8 B 0.00 1.00 -
9 A 1.00 1.00 +
10 A 1.00 0.50 -
11 A 0.67 0.75 +
1� A 1.00 1.00 +
13 C 0.00 1.00 -
14 A 1.00 0.75 +
15 A 0.00 0.75 -
16 A 0.00 0.25 +
17 A 0.00 0.00 +
18 A 0.00 0.00 +
19 A 0.00 0.00 +
20 A 1.00 0.75 +
Spring 2008 / Volu�e 8, Nu�ber 1
13 Table 3 (continued)
Item/DIF �ype PRTB(R) PR�B(U) Sign
�1 A 1.00 0.75 +
�� B 0.00 0.75 -
�3 B 1.00 1.00 +
�4 A 0.67 0.00 -
25 B 0.00 1.00 -
�6 B 0.67 1.00 -
�7A 1.00 1.00 +
�8 B 0.33 0.75 -
�9 A 1.00 1.00 +
30 A 0.33 0.75 -
31 A 0.33 0.25 +
3� A 0.67 0.75 +
33 B 0.00 1.00 -
34 A 1.00 0.75 +
35 A 0.67 0.50 +
36 A 0.33 0.25 +
37 A 0.00 0.25 +
38 A 0.67 1.00 +
39 A 0.00 0.00 +
40 A 0.00 0.25 +
Note. PR�B = Proportion of teachers rated “taught briefly”; R = Rural school teachers, U = Urban school teachers. + sign indicates consistency and - sign indicates discrepancy.
Journal of Educational Research & Policy Studies
14Table 4Association between DIF Results and Content Coverage Ratings
Consistency (+) Discrepancy (-)
DIF 2 9Non-DIF 23 6
Overall hit rate (overall diagnostic power) .80Hit rate for DIF items (positive predictive power) .82Hit rate for non-DIF items (negative predictive power) .79False positive rate .18False negative rate .21Specificity .92Sensitivity .60Fisher’s exact probability � < .0007
content coverage ratings from rural and urban school teachers. The hit rate for non-DIF items, or negative predictive power, was .79. �hat is, 79% of non-DIF items were associated with consistency of content coverage ratings from rural and urban school teachers. The false positive rate was .18, which means 18% of DIF items were associated with consistency of content coverage ratings. �he false negative rate was .21, which means 21% of non-DIF items were associated with discrepancy of content coverage ratings.
Specificity and sensitivity were also examined. �he specificity and sensitivity were .92 and .60 respectively. �hat is, for an item with consistent ratings from rural and urban teachers, the probability of being classified as non-DIF was .92. And for an item with discrepant ratings from rural and urban teachers, the probability of being classified as DIF was .60. As a measure of association between items flagged as DIF/non-DIF and content coverage ratings as discrepancy or consistency, Fisher’s exact test was performed and its �-value was less than .0007. �hat is, there was an association between DIF/non-DIF items and discrepancy/consistency ratings and it was significant.
In order to test the association between DIF results and item content classification, a similar 2x2 table with DIF/non-DIF on one dimension and advanced topics/basic curriculum on the other was created (�able 5). �he overall hit rate, hit rate for DIF items, hit rate for non-DIF items, false

Spring 2008 / Volu�e 8, Nu�ber 1
15 �able 5Association between DIF Results and Theoretical Ite� Classification
Basic (+) Advanced (-)
DIF 4 7Non-DIF 24 5
Overall hit rate (overall diagnostic power) Hit rate for DIF (positive predictive power) Hit rate for non-DIF (negative predictive power) False positive rate False negative rate Specificity Sensitivity Fisher's exact probability � < .007
rate, false negative rate, specificity, sensitivity, and Fisher’s exact test positive were also summarized in �able 5.
For the 11 items flagged as DIF, 7 of them were classified as advanced topics by the Regional Chief Administrator, and the other 4 items were classified as basic curriculum. For the other 29 items classified as non-DIF, 24 of them were classified as basic curriculum and the other 5 were classified as advanced topics. Based on this 2x2 table, several statistics measuring the association of DIF/non-DIF items and advanced/basic curriculum were calculated. The overall hit rate, or called the overall predictive power, was .78. �hat is, 78% of items were associated with item content classification as we expected (i.e., DIF items were associated with items classified as advanced topics while non-DIF items were associated with items classified as basic curriculum). Specifically, the hit rate for advanced items, or positive predictive power, was .64. �hat is, 64% of DIF items were associated with advanced items. The hit rate for basic items, or negative predictive power, was .83. �hat is, 83% of non-DIF items were associated with basic items. �he false positive rate was .36, which means 36% of DIF items were associated with basic items. �he false negative rate was .17, which means 17% of non-DIF items were associated with advanced items.
Specificity and sensitivity were also examined. �he specificity and
.78
.64
.83
.36
.17
.86
.58
Journal of Educational Research & Policy Studies
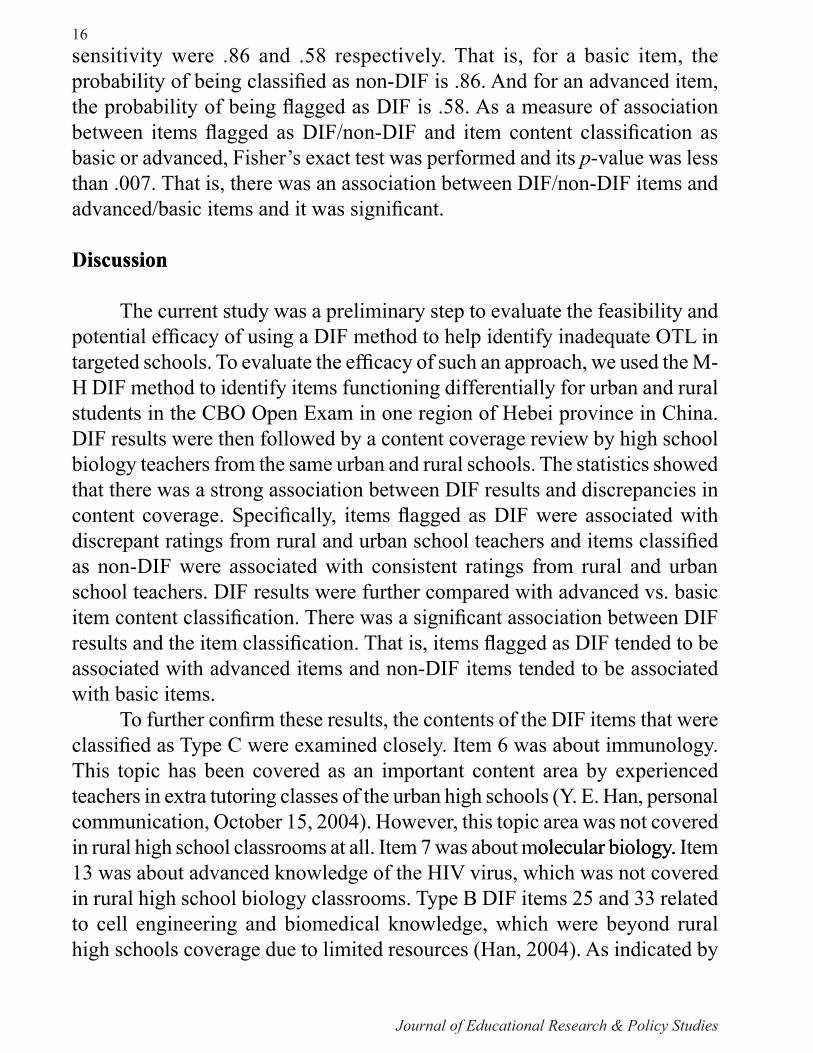
16sensitivity were .86 and .58 respectively. �hat is, for a basic item, the probability of being classified as non-DIF is .86. And for an advanced item, the probability of being flagged as DIF is .58. As a measure of association between items flagged as DIF/non-DIF and item content classification as basic or advanced, Fisher’s exact test was performed and its �-value was less than .007. �hat is, there was an association between DIF/non-DIF items and advanced/basic items and it was significant.
Discussioniscussion
The current study was a preliminary step to evaluate the feasibility and potential efficacy of using a DIF method to help identify inadequate O�L in targeted schools. �o evaluate the efficacy of such an approach, we used the M-H DIF method to identify items functioning differentially for urban and rural students in the CBO Open Exam in one region of Hebei province in China. DIF results were then followed by a content coverage review by high school biology teachers from the same urban and rural schools. The statistics showed that there was a strong association between DIF results and discrepancies in content coverage. Specifically, items flagged as DIF were associated with discrepant ratings from rural and urban school teachers and items classified as non-DIF were associated with consistent ratings from rural and urban school teachers. DIF results were further compared with advanced vs. basic item content classification. �here was a significant association between DIF results and the item classification. �hat is, items flagged as DIF tended to be associated with advanced items and non-DIF items tended to be associated with basic items.
�o further confirm these results, the contents of the DIF items that were classified as �ype C were examined closely. Item 6 was about immunology. �his topic has been covered as an important content area by experienced teachers in extra tutoring classes of the urban high schools (Y. E. Han, personal communication, October 15, 2004). However, this topic area was not covered in rural high school classrooms at all. Item 7 was about molecular biology.olecular biology.. Item 13 was about advanced knowledge of the HIV virus, which was not covered in rural high school biology classrooms. �ype B DIF items 25 and 33 related to cell engineering and biomedical knowledge, which were beyond rural high schools coverage due to limited resources (Han, 2004). As indicated by

Spring 2008 / Volu�e 8, Nu�ber 1
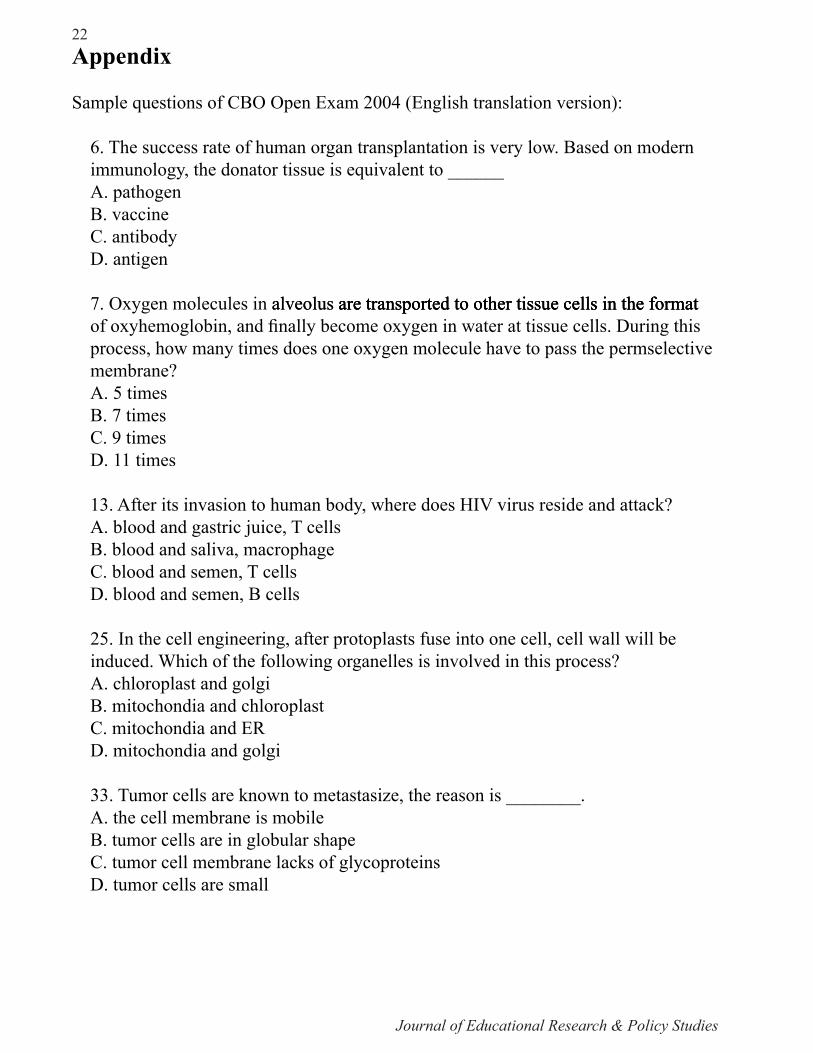
17 the results of this study, these 5 DIF items (45% of all DIF items) belonged to the first content area, molecular biology, biochemistry and microbiology.olecular biology, biochemistry and microbiology. and microbiology.and microbiology.. All items except item 25 were classified as advanced topics and all of them showed discrepant ratings from rural and urban teachers. The English version of these 5 DIF items is listed in the Appendix.
The remaining 6 Type B items belonged to another three content areas: Plant anatomy and physiology (items 3 and ��), genetics and evolution (items 8 and �6), and ecology (items �3 and �8). Items 3 and �� were about applying botany knowledge to explain commonly seen phenomena in daily life. Item 8 was about the specific experiment result of using a reagent. Item 26 was about contrasting four types of reproductions. Items �3 and �8 were about using ecological knowledge to prevent and solve environmental problems such as pollution. �hree of them (items 3, 8, and 26) were classified as advanced topics and four of them (items 8, ��, �6, and �8) showed discrepant ratings from rural and urban teachers. It is interesting to note that for item 3, none of the teachers surveyed reported this topic has been taught and all teachers reported the topic of item 23 has been taught. �his indicates these 2 DIF items may not be caused by different OTLs in rural and urban schools.
As for the 29 non-DIF items, six of them showed discrepancies in content coverage ratings from rural and urban school teachers (items 2, 10, 15, 24, 30, and 38) and five of them were classified as advanced topics (items 10, 19, 20, 32, and 36). A follow-up interview with the teachers surveyed or a further OTL investigation such as classroom observation or students’ ratings on these items may help understand how these discrepancies occurred or whether they are related to different OTLs.
�he limitations of this study include the small and unequal sample size of high school biology teachers for content review. Because of the unequal sample size of biology teachers from rural and urban high schools, the 3-point scale used in the questionnaire had to be collapsed to two for comparison. Consequently, we have to allow a small margin of error for the consistency measure of ratings between urban and rural teachers. Also, the results arehe results are dependent on the similarity of meaning of the matching variable – the scorevariable – the score – the score based on items assumed to have no DIF (i.e., an equal opportunity to learn). Since there is no way we can prove it one way or another based on the current data, we here suggest a line of follow-up research. Replications of this study in different settings such as different groups of students, and different tests
Journal of Educational Research & Policy Studies
18should be conducted in future studies.
�he directions of DIF (i.e., DIF items in favor of rural or urban students) have been ignored in the analysis as DIF items are typically reviewed regardless of direction in practice. �he dynamics between directions of DIF and discrepancies in OTL are very complicated and require further investigation that is beyond the scope of this study. Theoretically, a topic that is not covered in rural schools should show DIF against rural students or a topic that is covered in urban schools should not show DIF against urban students. However, an item covered in urban schools may show DIF against urban students because rural schools have limited topics to cover but more instructional time may be devoted to that item while urban schools have more topics to cover but limited instructional time on this specific item. Further O�L investigation on each DIF item will provide useful information in understanding the dynamics between directions of DIF and discrepancies in O�L.
To use the proposed method, item response data from students on a test need to be collected. �his is a departure from Winfield’s (1993) suggestion, which only requires that the items from a test be available to teachers for evaluation. As such, Winfield’s approach does not explicitly require item response data collection. However, an implicit assumption in Winfield’smplicit assumption in Winfield’sassumption in Winfield’sin Winfield’s method is that a relevant test, such as a test as a part of a statewide assessment program, exists in such a way that the contents of this test are related to what are supposed to be covered in the schools. Additionally, because of the potential consequences of doing poorly on this test, the items in the test could be meaningfully used as criteria to judge OTL. Therefore, we can safely assume that, in practice, when Winfield’s method is used, test data are already collected due to the fact that this is a province-wide high-stakes test. �herefore, our proposed method would not take any extra effort for data would not take any extra effort for datawould not take any extra effort for data collection beyond Winfield’s approach; but would provide a more effective means of identifying problem areas. �hat is, the difference between Winfield’she difference between Winfield’s method and our extension is that Winfield’s method can be used prior to the actual administration of the test. However, the selection of items to detect OTL in that case would only be based on guesswork. With our extension of the method, the selection of items for OTL evaluation would be based on actual performance of students.
In sum, it appears that the use of DIF techniques to select items for further OTL investigation is effective. Compared with conventional OTL
Spring 2008 / Volu�e 8, Nu�ber 1
19 study methods at the global, system-wide level of schools, this approach provides an efficient point of departure to evaluate the different O�Ls in rural an efficient point of departure to evaluate the different O�Ls in ruralthe different OTLs in rural OTLs in rurals in rural in ruralrural and urban schools from the individual test item level. When compared with. When compared withWhen compared with the alternative approach suggested by Winfield (1993), this approach utilizes the M-H DIF technique to pre-select items instead of asking administrators or teachers to do so. OTL as a variable is multi-dimensional in nature. It isOTL as a variable is multi-dimensional in nature. It is time and energy-consuming to collect data to evaluate possible inequalities in O�L. �his study demonstrates a quick and efficient test-driven method as a starting point for such an evaluation. This proposed method can be used for This proposed method can be used for OTL evaluation when the two types of schools are equivalent on aptitude, and the test items cover content area(s) with OTL problem.
References
Anderson, L. W. (1985). Opportunity to learn. In �. Husén & �.N. Postlethwaite (Eds.), �he international encyclo�edia of education (Vol. 6, pp. 3,68�-3,686). Oxford: Pergamon Press.
Burstein, L. (April, 1993). Validating national curriculu� indicators: A conce�tual overview of the RAND/CRESS� NSF Project. Paper presented at the 1993 annual meeting of the American Educational Research Association, Atlanta, GA.
Carroll, J. (1963). A model of school learning. �eachers College Record, 64, 7�3-733.
Clauser, B. E., & Mazor, K. M. (1998). Using statistical procedures to identify differentially functioning test items. Educational �easure�ent: Issues and Practice, 17(1), 31-44.
Cooley, W. W., & Leinhardt, G. (1980). �he instructional dimensions study. Educational Evaluation and Policy Analysis, 2(1), 7-25.
Emenogu, B., & Childs, R. A. (April, 2003). Curriculu� and translation differential ite� functioning: A co��arison of two DIF detection techniques. Paper presented at the 2003 annual meeting of the National Council on Measurement in Education, Chicago, IL.
Ercikan, K. (2002). Disentangling sources of differential item functioning in ultilanguage assessments. International Journal of �esting, 2(3&4), 199-215.
Journal of Educational Research & Policy Studies
20Fletcher, R., & Hattie, J. (2005). Gender differences in physical self-concept:
A multidimensional differential item functioning analysis. Educational and Psychological �easure�ent, 65(4), 657-667.
Freedle, R., & Kostin, I. (1997). Predicting black and white differential item functioning in verbal analogy performance. Intelligence, 24(3), 417-444.
Gelin, M. N., & Zumbo, B. D. (April, 2003). Differential do�ain functioning on the nu�eracy co��onent of the foundation skills assess�ent: Bringing the conte�t into �icture by investigating sociological/co��unity �oderated test and ite� bias. Paper presented at the 2003 annual meeting of the American Education Research Association, Chicago, IL.
Guiton, G., & Oakes, J. (1995). Opportunity to learn and conceptions of educational Equality. Educational Evaluation and Policy Analysis, 17(3), 3�3-336.
Herman, J. L., Klein, D. C., & Abedi, J. (2000). Assessing students’ opportunity to learn: Teacher and student perspectives. Educational �easure�ent: Issues and Practice, 19(4), 16-�4.
Husén, T. E. (1967). International study of achieve�ent in �athe�atics: A co��arison of twelve syste�s (Vols. 1-�). Stockholm, Sweden: Almqvist & Wiksell.
Holland, P. W., & �hayer, D. �. (1988). Differential item performance and the Mantel-Haenszel prodcedure. In H. Wainer & H. I. Braun (Eds.), �est validity (pp. 129-145). Hillsdale NJ: Erlbaum.
Leinhardt, G., & Seewald, A. M. (1981). Overlap: What’s tested, what’s taught? Journal of Educational �easure�ent, 18(2), 85-96.
Miller, M. D., & Linn, R. L. (1988). Invariance of item characteristic functions with variations in instructional coverage. Journal of Educational �easure�ent, 25, 205-219.
Muthén, B., Huang, L., Jo, B., Khoo, S., Goff, G. N., Novak, J. R., & Shih, J. C. (1995). Opportunity-to-learn effects on achievement: Analytical aspects. Educational Evaluation and Policy Analysis, 17, 371-403.
Park, H. S., Pearson, P. D., & Reckase, M. D. (2005). Assessing the effect of cohort, gender, and race on differential item functioning (DIF) in an adaptive test designed for multi-age groups. Reading Psychology, 26(1), 81-101.
Spring 2008 / Volu�e 8, Nu�ber 1
�1 Pine, S. M. (1977). Applications of item characteristic curve theory to the
problem of test bias. In D. J. Weiss (Ed.), A��lications of co��uteri�ed adaptive testing: Proceedings o� a sy�posiu� presented at the 18th annual convention of the �ilitary �esting Association (Research Rep. No. 77-1, pp. 37-43). Minneapolis: University of Minnesota, Department of Psychology, Psychometric Methods Program.
Schmidt, W. H., & McKnight, C. C. (1995). Surveying educational opportunity in mathematics and science: An international perspective. Educational Evaluation and Policy Analysis, 17(3), 337-353.
Waller, N. G. (1998). EZDIF: Detection of uniform and nonuniform differential item functioning with the Mantel-Haenszel and logistic regression procedures. A��lied Psychological �easure�ent, 22(4), 391.
Wang, J. (1998). Opportunity to learn: The impacts and policy implications. Educational Evaluation and Policy Analysis, 20(3), 137-156.
Wiley, D. E., & Harnischfeger, A. (1974). A 1974 explosion of a myth: Quantity of schooling and exposure to instruction, major educational vehicles. Educational Researchers, 4, 7-1�.
Wiley, D. E., & Yoon, B. (1995). �eacher reports on opportunity to learn: Analyses of the 1993 California Learning Assessment System (CLAS). Educational Evaluation and Policy Analysis, 17(3), 355-370.
Winfield, L. F. (1993). Investigating test content and curriculum content overlap to assess opportunity to learn. �he Journal of Negro Education, 62(3), 288-310.
Yoon, B., & Resnick, L. B. (1998). Instructional validity, o��ortunity to learn and equity: New standards e�a�inations for the California �athe�atics renaissance. Center for the Study of Evaluation Technical Report 484, July 1998.
Journal of Educational Research & Policy Studies
��Appendix
Sample questions of CBO Open Exam 2004 (English translation version):
6. The success rate of human organ transplantation is very low. Based on modern immunology, the donator tissue is equivalent to ______A. pathogenB. vaccineC. antibodyD. antigen
7. Oxygen molecules in alveolus are transported to other tissue cells in the formatalveolus are transported to other tissue cells in the format are transported to other tissue cells in the format of oxyhemoglobin, and finally become oxygen in water at tissue cells. During this process, how many times does one oxygen molecule have to pass the permselective membrane?A. 5 timesB. 7 timesC. 9 timesD. 11 times
13. After its invasion to human body, where does HIV virus reside and attack?A. blood and gastric juice, T cellsB. blood and saliva, macrophageC. blood and semen, T cellsD. blood and semen, B cells
25. In the cell engineering, after protoplasts fuse into one cell, cell wall will be induced. Which of the following organelles is involved in this process?A. chloroplast and golgiB. mitochondia and chloroplastC. mitochondia and ERD. mitochondia and golgi
33. �umor cells are known to metastasize, the reason is ________.A. the cell membrane is mobileB. tumor cells are in globular shape C. tumor cell membrane lacks of glycoproteinsD. tumor cells are small


![Running Head: DIFFERENTIAL ITEM FUNCTIONING OF THE SRQ …timo.gnambs.at/sites/default/files/gnambs+hanfstingl2013.pdf · DIF OF THE SRQ-A[G] 3 A Differential Item Functioning Analysis](https://static.fdocuments.us/doc/165x107/5b89a81a7f8b9a655f8cae19/running-head-differential-item-functioning-of-the-srq-timo-hanfstingl2013pdf.jpg)
