User's guide for the Pacific Tsunami Warning Center: enhanced
63
Intergovernmental Oceanographic Commission Technical Series 105 User’s Guide for the Pacific Tsunami Warning Center Enhanced Products for the Pacific Tsunami Warning System March 2013 UNESCO
Transcript of User's guide for the Pacific Tsunami Warning Center: enhanced

IOC
Technical S
eries, 105 P
age i
Intergovernmental Oceanographic Commission Technical Series 105
User’s Guide for the Pacific Tsunami Warning Center Enhanced Products for the Pacific Tsunami Warning System March 2013
UNESCO

Intergovernmental Oceanographic Commission Technical Series 105
User’s Guide for the Pacific Tsunami Warning Center Enhanced Products for the Pacific Tsunami Warning System March 2013
UNESCO 2013

IOC
Technical S
eries, 105 P
age iii
IOC Technical Series, 105 Honolulu and Paris, March 2013
English only
The designations employed and the presentation of the material in this publication do not imply the expression of any opinion whatsoever on the part of the Secretariats of UNESCO and IOC concerning the legal status of any country or territory, or its authorities, or concerning the delimitation of the frontiers of any country or territory.
For bibliographic purposes, this document should be cited as follows:
Users Guide for the Pacific Tsunami Warning Center Enhanced Products for the Pacific Tsunami Warning System. IOC Technical Series No 105. UNESCO/IOC 2013 (English only)
Guide prepared by: Pacific Tsunami Warning Center International Tsunami Information Center PTWS Task Team on Enhanced Products
Published in 2013 by United Nations Educational, Scientific and Cultural Organization 7, Place de Fontenoy, 75352 Paris 07 SP
(IOC/2013/TS/105 rev.)
UNESCO 2013 Printed in France

IOC Technical Series, 105 Page (i)
IOC
Technical S
eries, 105 P
age i
Table of Contents
page
EXECUTIVE SUMMARY ...................................................................................................... ii
1. OVERVIEW ............................................................................................................... 1
1.1 Introduction .................................................................................................................. 1 1.2 Implementation Timeline .............................................................................................. 1 1.3 New Enhanced Products .............................................................................................. 2 1.4 New Enhanced Products Limitations ............................................................................ 3
2. PTWC CAPABILITIES AND PROCEDURES – TIMELINE FOR PRODUCT ISSUANCE .......... 3
3. RIFT FORECAST MODEL DESCRIPTION AND LIMITATIONS ......................................... 5
3.1 RIFT Description .......................................................................................................... 5 3.2 RIFT Limitations ........................................................................................................... 6 3.3 Detailed Explanation of Green's Law and the Limitations of Model Forecast. ......................................................................... 6 3.4 Key Assumptions of Green's Law ................................................................................. 6 3.5 RIFT References.......................................................................................................... 7
4. DESCRIPTION OF NEW PRODUCTS ............................................................................ 7
4.1 Threat Levels ............................................................................................................... 7 4.2 Text Products ............................................................................................................... 8 4.3 Forecast Polygon Map ................................................................................................. 9 4.4 Forecast Polygon Table ............................................................................................... 9 4.5 Energy Forecast Map ................................................................................................... 9 4.6 Coastal Forecast Map .................................................................................................. 9 4.7 Coastal Forecast KMZ File ........................................................................................... 9
5. GENERAL RESPONSE GUIDANCE ............................................................................. 10
APPENDICES
I. BACKGROUND AND MOTIVATION .......................................................................... 12
II. EXAMPLES OF PTWS PTWC NEW ENHANCED PRODUCTS ........................................ 13
A. Tsunami Information Statement (earthquake with no tsunami threat) .................. 13
B. Tsunami Information Statement (earthquake with minimal tsunami threat) .......... 14
C. Tsunami Threat Message (earthquake with low-level tsunami threat) ................. 15
D. Tsunami Threat Message (earthquake with major tsunami threat) ...................... 29
III. LIST OF PLACES COVERED IN THE PTWS PTWC NEW PRODUCTS .............................. 50
IV. LIST OF PTWS PTWC FORECAST POLYGONS ............................................................ 51
IOC Technical Series, 105 Page (ii) Executive Summary
The Pacific Tsunami Warning Center (PTWC), as the operational headquarters for the IOC-coordinated Intergovernmental Coordination Group for the Pacific Tsunami Warning and Mitigation System (ICG/PTWS), has provided international tsunami alerts to countries of the Pacific since 1965. In order to provide timely services, alerts (warnings and watches) have been based primarily on seismic data and the rapid determination of an earthquake’s hypocenter and magnitude, followed by the monitoring of coastal sea level gauges to confirm a tsunami and its severity. Over the last 5-10 years, however, seismic and sea level data availability, analysis methods, computational capabilities, and communications have improved significantly. Additionally, better and faster numerical models, and specifically models that can incorporate the actual earthquake source, are now able to provide much more accurate forecasts of tsunami impacts along different coasts. Accordingly, and since 2007 with the guidance and approval of Member States of the ICG/PTWS, the PTWC is enhancing and evolving its existing products in 2013–2014 so as to provide countries with more useful tsunami forecast products that will give detailed tsunami threat assessments of their coasts. The PTWC will begin the issuance of its enhanced tsunami products in an experimental phase to Member States of the ICG/PTWS on 15 April 2013. The enhanced products will be sent by email to IOC officially-designated Tsunami Warning Focal Points (TWFP) in parallel with its existing products. This introduction and familiarization period will also provide lead time for training on the new products and for countries to incorporate the necessary changes to their TWFP and National Tsunami Warning Center (NTWC) Standard Operating Procedures (SOPs). The IOC and International Tsunami Information Center will work together to meet the training requests of PTWS countries. At the Twenty-fifth Session of the ICG/PTWS (September, 2013), Member States will be asked to review and discuss the new products, and if ready, approve the products and agree on a changeover date in 2014. The User’s Guide provides a description and examples of the PTWC new enhanced products. Both improved text and additional graphical products will be available. The text products include improvements in the order and type of information provided, and in its readability. The graphical products are expected to provide more information and at a much greater level of detail than will be possible using only text products. These include maps that show the forecast directionality of the tsunami energy, the forecast position of the initial wave through time, as well as the expected maximum wave amplitudes offshore and at the coast.
IOC Technical Series, 105
IOC
Technical S
eries, 105 P
age 1
1. OVERVIEW
1.1 Introduction
The Pacific Tsunami Warning Center (PTWC), operated by the United States National Oceanic and Atmospheric Administration’s National Weather Service (NOAA/NWS), has served since 1965 as the operational tsunami warning center for Member States of the Intergovernmental Coordination Group for the Pacific Tsunami Warning and Mitigation System (ICG/PTWS). The ICG/PTWS is a subsidiary body of UNESCO’s Intergovernmental Oceanographic Commission (IOC), and the IOC’s Tsunami Unit oversees the coordination of the global tsunami warning and mitigation system. The ICG/PTWS, begun as an international response after the 1960 M9.5 Chile earthquake and tsunami, is the oldest of the four regional tsunami systems. Systems in the Indian Ocean, Caribbean and Adjacent Seas, and Northeastern Atlantic and Mediterranean were established after the 2004 Indian Ocean Tsunami.
The suite of text tsunami products issued by PTWC to countries around the Pacific in support of this mission has evolved over time as seismic and sea level data, analysis methods, computational capabilities, and communications have all improved. With order of magnitude increases in data availability and quality over the last 10 years enabling reliable real-time earthquake source characterization and more timely, detailed tsunami monitoring, and with better numerical models providing more accurate forecasts of tsunami impacts in real time, it is now time to enhance and evolve the existing PTWC products to provide countries with more informative and useful tsunami threat assessments to their coasts.
Accordingly, the Twenty-second Session of the ICG/PTWS (2007) started the process of improving the PTWS international alert products, starting first with the products of the PTWC. The Twenty-fourth Session of the ICG/PTWS (May, 2011) approved PTWC’s Enhanced Tsunami Products proposal and asked them to proceed with their development. Exercise Pacific Wave 2011 (November) introduced those products and the PTWS Steering Committee met in May 2012 to review the feedback and approve the final implementation timeline. Exercise Pacific Wave 2013 (April) will be conducted to validate the products. At the Twenty-fifth Session of the ICG/PTWS (2013), Member States will be asked to approve the final products and agree on a changeover date. A more detailed background and summary is provided in Appendix I.
PTWC’s New Enhanced Product suite, as described in this Users Guide with examples given in Appendix II, will be first issued in parallel with PTWC’s existing products in order to familiarize recipients – the designated national Tsunami Warning Focal Points (TWFPs) -- with the new products’ timing and content. Note, however, that the highest priority activity at PTWC will continue to be the issuance of the existing operational products. As a consequence, the new products may lag somewhat behind existing products at the beginning of an event and may also be issued on a different schedule. This introduction and familiarization period will also provide lead time for training on the new products and for countries to incorporate the necessary changes to their TWFP and National Tsunami Warning Center (NTWC) Standard Operating Procedures (SOPs).
1.2 Implementation Timeline
The PTWC New Products familiarization phase will begin on April 15, 2013, and be conducted through the remainder of 2013.
To support the transition to the new products, the PTWS will conduct Exercise Pacific Wave 2013 (PacWave13) between May 1-15, 2013, to encourage countries to examine and

IOC Technical Series, 105 Page 2
IOC
Technical S
eries, 105 P
age 2
interpret the new products using a destructive tsunami scenario. It is recommended that countries conduct a Tabletop Tsunami Exercise as part of PacWave13. As part of the PacWave13 post-exercise evaluation, countries are asked to provide feedback on the new products and their readiness for the changeover to the new products. Information, including the PacWave13 Exercise Manual and PTWC New Enhanced Product Messages, can be found at http://www.pacwave.info
The PTWS PacWave13 Task Team is overseeing the planning, conduct, and post-exercise evaluation of the new products, and working with the PTWS Enhancing Tsunami Products for the successful implementation, and ITIC and the IOC are working with the PTWC to provide the necessary training in 2013 and 2014 for the successful transition and changeover.
At the Twenty-Fifth Session of the Intergovernmental Coordination Group (ICG) of the Pacific Tsunami Warning and Mitigation System, to be held 11-13 September 2013, Member States will approve their use and agree on a timeline for the full implementation of the PTWC New Products suite. If approved, a date will be agreed to in 2014 to officially retire the existing products and changeover fully to the new products.
1.3 New Enhanced Products
There are important differences between PTWC’s existing and its new enhanced products. Existing products use terminology that describes a level of alert for each country. Specifically, a country is currently designated by PTWC as being in a Tsunami Watch or a Tsunami Warning depending upon the tsunami threat presented by the event, as well as the time remaining until tsunami impact. Over the last several years, however, use of the Warning and Watch terms have caused confusion when the PTWC-designated levels of alert conflict with a country’s independently-derived levels of alert. As each country is sovereign and thus responsible for the safety of its own population, the PTWC new products will change to avoid using the Warning and Watch terms, and instead provide forecast levels of impact along coasts.
The levels of expected impact will be provided as expected wave amplitudes within four categories, which are waves ‘< 0.3 m’, ‘0.3 to less than 1 m’, ‘1 m to less than 3 m’, and ‘over 3 m’; a fourth category will be ‘not threat computed’ to reflect locations where a forecast has not yet been made. With this, the designation of Alert levels, such as a Tsunami Warning, will then become the sole responsibility of the NTWCs. A list of countries and country sub-jurisdictions for which PTWC will provide forecasts is given in Appendix III, and the list of PTWC forecast polygons that divide extended coasts into segments or that surround particular island groups is given in Appendix IV. During the trial period, countries are asked to review the list and recommend changes if needed.
Further, present PTWC procedures for designating levels of alert in the existing products are extremely conservative and most places that come under a warning alert usually do not finally experience a destructive tsunami. This was in large part due to PTWC’s reliance on limited historical data, and at the time the criteria were conceived and approved by the ICG/PTWS, the lack of numerical model forecasting for the Pacific in real time.
While numerical forecasts provided in the new product suite will continue to still be conservative, the provision of forecast information should nonetheless significantly reduce over-warning. In addition, by providing an expected level of impact, it is expected that national and local authorities will now be able to determine and enable more appropriate levels of response. For example, the distribution of forecast values along a coast may provide justification for national or local authorities to evacuate only a part of the coast, or to only clear beaches and harbors because a smaller tsunami is expected in these zones.

IOC Technical Series, 105 Page 3
IOC
Technical S
eries, 105 P
age 3
The PTWC new products will consist of both improved text products, and graphical products (examples in Appendix II). The text products include improvements in the order and type of information provided, and in its readability. The graphical products are expected to provide more information and at a much greater level of detail than will be possible using only text products. These include maps that show the forecast directionality of the tsunami energy, the forecast position of the initial wave through time, as well as the expected maximum wave amplitudes offshore and at the coast. The graphical products may also be helpful for communicating the threat quickly and clearly when time is of the essence.
1.4 New Enhanced Products Limitations
It is important to note that while the new products and the procedures behind them represent a significant improvement over the current ones, there will still be limitations that need to be recognized and understood by every country, and especially by their National Tsunami Warning Centers. The science of accurately forecasting tsunamis is still in its infancy. The greatest unknown about the tsunami in real-time (and even later) is its source. Specifically, as most tsunamis are generated by earthquakes, how did the seafloor deform when the earthquake occurred? How much was the seafloor displaced up or down, over what areas, and over what time period? The tsunami forecast models that PTWC uses must make assumptions about the source based upon the best available seismic analysis, or later, based upon the available nearby sea level gauge readings. But this only permits an approximation of the real source, and that approximation can evolve from the first few minutes after an earthquake to several hours after the earthquake when more data and analysis results become available.
The second greatest unknown is how the tsunami will interact with the coast. In most situations, a general approximation (Green’s Law) must be used. Unfortunately, even when detailed bathymetry and coastal inundation models are available, properly and accurately capturing coastal resonances, trapped wave energy, and multiple wave interactions after even a few wave cycles, and in real-time as the tsunami is approaching, is not currently possible. For these reasons, the forecast model information provided in the PTWC New Products should be viewed and interpreted with care, taking into consideration the limitations that are explained later in this document.
2. PTWC CAPABILITIES AND PROCEDURES – TIMELINE FOR PRODUCT ISSUANCE
The new product suite is tied closely to PTWC new capabilities and procedures. This section of the User’s Guide provides an overview of those capabilities and procedures and how they will drive the new products. The overview is presented in terms of a timeline of events that occur as an event unfolds. Times indicated are only approximate, but are typical.
Note that during the trial period beginning April 15, 2013, the new products may lag behind the existing products, because the existing products will remain PTWC’s highest priority. The timeline below is expected to be fully realized after the official changeover when the new products will become as the only products issued by the PTWC.
00h00m A large earthquake occurs in the Pacific region.
00h02m Vibrations from the earthquake reach seismic stations near the earthquake epicenter, triggering event alarms at PTWC. PTWC duty analysts respond to the operations center and begin to analyze the event. [PTWC currently monitors over 400 seismic stations from around the world, with data collected at most of those stations reaching PTWC within a minute of when it is collected.]

IOC Technical Series, 105 Page 4
IOC
Technical S
eries, 105 P
age 4
00h08m Using a combination of automatic and interactive analyses, duty analysts complete their preliminary determination of the earthquake epicenter, depth, and magnitude. These parameters, adjusted conservatively if necessary to account for error, are used to initiate a RIFT numerical tsunami forecast model run for a limited region near the epicenter. [RIFT is one of three numerical forecast models in use at PTWC, each of which has its own strengths and weaknesses. RIFT is the model upon which the new products are primarily based. Forecasts from the other two models, SIFT and ATFM, are compared for consistency. For this initial RIFT run, the earthquake fault mechanism is based upon the mechanism of historical nearby earthquakes.]
00h09m The RIFT run completes within 5-20 seconds, providing a preliminary forecast of tsunami amplitudes for coasts generally within about 3 hours tsunami travel time of the earthquake.
00h10m Based on the RIFT forecast, initial products are issued.
If forecast coastal tsunami amplitudes are less than 0.3m everywhere, then only a text Tsunami Information Statement is issued, indicating no tsunami threat. This is the only statement issued unless further analysis indicates a greater threat or to report observed tsunami waves.
If forecast coastal amplitudes are above 0.3m in some places, then a text Tsunami Threat Message is issued along with accompanying maps showing the forecast tsunami travel times, energy distribution and coastal amplitudes, a table summarizing forecast coastal amplitudes, and a kmz file of the individual coastal forecast points. These products will be followed by later product sets, at least one per hour, which may refine the forecast and report observations until the threat has largely passed.
00h20m The seismic analyses continue as data from additional seismic stations arrive and are processed. If the earthquake parameters change significantly then RIFT is re-run. If there is a significant change in the forecast then appropriate supplemental products, similar to those described above, are issued.
00h25m For earthquakes above about magnitude 7.0, the preliminary W-phase Centroid Moment Tensor (WCMT) analysis based upon broadband seismic data completes. The WCMT analysis not only gives a more accurate estimate of the earthquake location, depth and magnitude, but also an estimate of the earthquake’s mechanism – the strike angle of the fault, the dip angle of the fault, and the direction of slip along the fault. These parameters help constrain the estimate of seafloor deformation that is the tsunami source, and they are used to drive a subsequent run of RIFT that covers the entire Pacific.
00h35m For events with forecast coastal amplitudes above 0.3 m, then based upon the updated RIFT result a supplemental Tsunami Threat Message is issued along with accompanying maps, table, and KMZ file that cover the entire Pacific region and marginal seas of the PTWS.
00h30m to
02h00m
Sea level gauges are monitored for tsunami signals. Within the first 30 minutes to an hour the tsunami may arrive on the nearest one or two coastal gauges and one or two deep-ocean gauges. Tsunami amplitudes are measured and compared, when possible, with forecast amplitudes produced by the models. Model forecasts may be adjusted to be more consistent with observations.
Beyond 2h
The process of refining the earthquake parameters and collecting additional sea level observations continues, with that information used to constrain the forecast. The tsunami is monitored as it advances. When it is likely that there is no longer a significant tsunami threat then a final product is issued.

IOC Technical Series, 105 Page 5
IOC
Technical S
eries, 105 P
age 5
3. RIFT FORECAST MODEL DESCRIPTION AND LIMITATIONS
The PTWC will use the Real-time Forecast of Tsunamis (RIFT) model as the basis for its international forecast products for the PTWS. Developed by PTWC, RIFT is currently an experimental tsunami forecast model of NOAA that is based on the linear shallow water equations. Studies of its accuracy for a wide variety of sources and coasts are continuing. However, because of its general success in forecasting impacts from several recent tsunamis, including the February 2010 Chile tsunami and the March 2011 Japan tsunami, and its unique capability to use real-time estimates of the actual earthquake fault geometry as the primary source constraint and its capability to produce comprehensive forecast for all coasts around the world in real time, it was decided that RIFT should become the foundation of PTWC’s international tsunami forecast operations. It should be noted PTWC also uses several other forecast models during an event, including NOAA’s SIFT (Short-term Inundation Forecasting for Tsunamis) and ATFM (Alaska Tsunami Forecast Model), but in general these cannot be universally applied to all coasts and countries around the Pacific.
3.1 RIFT Description
Definitions: z2p=maximum absolute value of RIFT zero to peak wave amplitude z2t=maximum absolute value of RIFT zero to trough wave amplitude
RIFT Deep-Ocean Maximum Tsunami Wave Amplitude Map At each model grid point in the ocean, RIFT produces a time series of the sea level fluctuations caused by the passing tsunami waves. Shown on the map is the maximum amplitude of those fluctuations, Amax, defined by:
Amax = 0.5 * (z2p + z2t) in meters
These are the maximum deep-ocean tsunami amplitudes. Maximum coastal amplitudes can be much larger. RIFT Coastal Maximum Tsunami Wave Amplitude Map For each model grid point near the coast, the tsunami amplitude at the coast can be estimated based upon Green's Law.
Green's Law: Acoast=Aoffshore * ( Doffshore / Dcoast )¼
where Acoast is the tsunami amplitude at the coast Aoffshore is the tsunami amplitude at the offshore grid point Dcoast is the depth of the ocean at the coast
Doffshore is the depth of the ocean at the offshore grid point, and The offshore ocean depth can vary from about 15m to 1000 m, depending upon the resolution at which RIFT is run - 30 arc-sec, 1 arc-min, 2 arc-min or 4 arc-min. The coastal ocean depth is set to be 1 m. The off-shore point is the closest model grid point with a water depth greater than the offshore water depth of the model coastal point. If the distance from the coastal point to the offshore point is greater than 100 km, then no forecast is made for the coastal point. There is no confidence in the quality of the coastal forecast if Green's Law is applied over distances > 100 km. Consequently, there might not be a forecast for coasts with wide continental shelves at 4-arc-min. resolution. In those cases, a RIFT run at finer than 4 arc-min resolution is required for RIFT to produce a Green's Law coastal forecast.

IOC Technical Series, 105 Page 6
IOC
Technical S
eries, 105 P
age 6
3.2 RIFT Limitations
The following are overall known limitations of RIFT:
1. Initial results can vary easily by a factor of two, because of uncertainties in the preliminary magnitude, depth and assumed mechanism of the earthquake. Later results, constrained by the earthquake centroid moment tensor as well as by deep-ocean observations should be more reliable.
2. For small islands (e.g., islands less than 30 km in diameter), Green's Law can overestimate the coastal amplitude. In those cases, a forecast amplitude between the offshore and Green's Law amplitude may be more appropriate.
3. For resonant harbors, the Green's Law amplitude can underestimate the actual wave amplitude. Green's Law amplitude should be interpreted as average wave amplitude at the open coast, not necessarily the maximum amplitude inside a harbor or at a sea-level gauge.
4. The RIFT forecast coastal amplitude is not necessarily indicative of inundation depth, which is a function of the local topography. A 30-meter coastal amplitude from Green's Law does not mean the inundation depth will reach 30 meters. But it does indicate a major tsunami impact. 5. In the near field, Green’s law amplitude does not necessarily takes into account wave propagation and dissipation. Thus, a coastal amplitude of 20-30 meters can be misleading, it should also simply be interpreted as a major tsunami.
3.3 Detailed explanation of Green's law and the limitations of model forecast.
Additionally, there can be significant uncertainties in the RIFT forecast because of its assumptions and uncertainties of the earthquake source parameters. These include:
1. The forecast is sensitive to the earthquake magnitude. A difference of 0.2 in the earthquake magnitude results in factor of two in the tsunami wave amplitude.
2. The forecast is sensitive to the earthquake focal mechanism. For example, two earthquakes of magnitude 7.5 with different focal mechanisms can give vastly different results, easily by a factor of two or more. For the initial forecast without a computed mechanism, RIFT assumes the earthquake is of the shallow-thrust type to be conservative, even if the earthquake is located in regions of historical strike-slip earthquakes.
3. Experience shows that when RIFT is forced by the earthquake’s computed centroid moment tensors (CMT) mechanism, it tends to give a much better result. However, the CMT will not be become available until 25-30 minutes after the earthquake occurs. The initial CMT can be off by 0.2 or more in magnitude for large earthquakes, resulting in a factor of two difference in the RIFT tsunami wave forecast.
3.4 Key Assumptions of Green's Law
1. The coastline in question is linear and exposed to the open ocean.
2. Tsunami waves near the coast behave as one-dimensional plane waves.
3. There are no significant wave reflections and no dissipation by turbulence.
4. The bathymetry varies slowly compared to the wavelength of the tsunami waves. Thus, for steep bathymetry, the Green's Law forecast can overestimate the tsunami wave amplitudes.
5. Cliff boundary conditions are used. In other words, the coast is assumed to be a vertical wall.
IOC Technical Series, 105 Page 7
IOC
Technical S
eries, 105 P
age 7
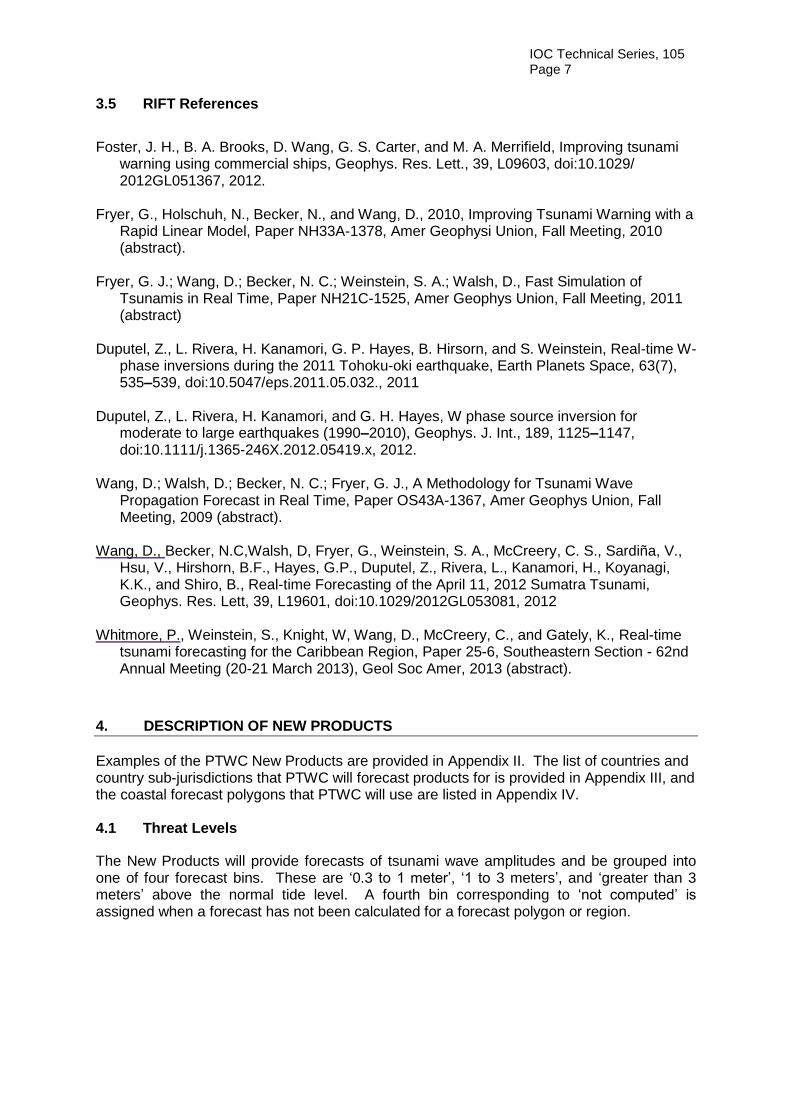
3.5 RIFT References
Foster, J. H., B. A. Brooks, D. Wang, G. S. Carter, and M. A. Merrifield, Improving tsunami
warning using commercial ships, Geophys. Res. Lett., 39, L09603, doi:10.1029/ 2012GL051367, 2012.
Fryer, G., Holschuh, N., Becker, N., and Wang, D., 2010, Improving Tsunami Warning with a
Rapid Linear Model, Paper NH33A-1378, Amer Geophysi Union, Fall Meeting, 2010 (abstract).
Fryer, G. J.; Wang, D.; Becker, N. C.; Weinstein, S. A.; Walsh, D., Fast Simulation of
Tsunamis in Real Time, Paper NH21C-1525, Amer Geophys Union, Fall Meeting, 2011 (abstract)
Duputel, Z., L. Rivera, H. Kanamori, G. P. Hayes, B. Hirsorn, and S. Weinstein, Real-time W-
phase inversions during the 2011 Tohoku-oki earthquake, Earth Planets Space, 63(7), 535–539, doi:10.5047/eps.2011.05.032., 2011
Duputel, Z., L. Rivera, H. Kanamori, and G. H. Hayes, W phase source inversion for
moderate to large earthquakes (1990–2010), Geophys. J. Int., 189, 1125–1147, doi:10.1111/j.1365-246X.2012.05419.x, 2012.
Wang, D.; Walsh, D.; Becker, N. C.; Fryer, G. J., A Methodology for Tsunami Wave
Propagation Forecast in Real Time, Paper OS43A-1367, Amer Geophys Union, Fall Meeting, 2009 (abstract).
Wang, D., Becker, N.C,Walsh, D, Fryer, G., Weinstein, S. A., McCreery, C. S., Sardiña, V.,
Hsu, V., Hirshorn, B.F., Hayes, G.P., Duputel, Z., Rivera, L., Kanamori, H., Koyanagi, K.K., and Shiro, B., Real-time Forecasting of the April 11, 2012 Sumatra Tsunami, Geophys. Res. Lett, 39, L19601, doi:10.1029/2012GL053081, 2012
Whitmore, P., Weinstein, S., Knight, W, Wang, D., McCreery, C., and Gately, K., Real-time
tsunami forecasting for the Caribbean Region, Paper 25-6, Southeastern Section - 62nd Annual Meeting (20-21 March 2013), Geol Soc Amer, 2013 (abstract).
4. DESCRIPTION OF NEW PRODUCTS
Examples of the PTWC New Products are provided in Appendix II. The list of countries and country sub-jurisdictions that PTWC will forecast products for is provided in Appendix III, and the coastal forecast polygons that PTWC will use are listed in Appendix IV. 4.1 Threat Levels
The New Products will provide forecasts of tsunami wave amplitudes and be grouped into one of four forecast bins. These are ‘0.3 to 1 meter’, ‘1 to 3 meters’, and ‘greater than 3 meters’ above the normal tide level. A fourth bin corresponding to ‘not computed’ is assigned when a forecast has not been calculated for a forecast polygon or region.

IOC Technical Series, 105 Page 8
IOC
Technical S
eries, 105 P
age 8
4.2 Text Products
Text products are organized into the following discreet sections.
Headers At the top of each text product are some header lines that include the World Meteorological Organization Product ID and issue date/time, an AWIPS ID, a product type line, an issuing office line, and an issuance date/time line.
Headline Immediately below the header lines is a brief headline, leading and trailing with an ellipsis (…). The headline indicates either an information statement or a tsunami threat message.
Target Area Below the headline is a statement indicating the geographic area that the product is intended for. The products are for most of the Pacific except those parts exclusively covered by other centers. This statement is to help avoid confusion in areas not covered by the product.
Tsunami Threat Forecast Within this section, in bulleted form, are indicated the levels of threat that have been forecast and to which countries or places they apply. The levels are tsunami heights of 0.3-1 meter, 1-3 meters, and greater than 3 meters above the normal tide level.
Evaluation The evaluation section always includes a narrative statement describing the key earthquake parameters. It may also include one or two short statements about the tsunami threat.
Recommended Actions This section gives brief statements about recommended actions. Since the product is intended primarily for government agencies and not the public, the recommended actions are left very general to avoid conflicting with actions directed by the local authoritative government agencies.
Estimated Times of Arrival Within this section are listed, in table form, estimated first tsunami wave arrival times for specific points within or near areas identified with a tsunami threat of at least 0.3 meters above the tide. These times should only be viewed as approximate. For a long-duration event, estimated arrival times more than an hour in the past will be removed from the list.
Potential Impacts This section contains brief statements about tsunami behavior and the hazard presented by each level of threat.
Tsunami Observations Within this section are readings of the maximum tsunami height recorded so far on certain coastal and/or deep-ocean sea-level gauges.
Preliminary Earthquake Parameters The earthquake parameters, origin time, epicenter coordinates, depth, magnitude, and descriptive location are provided here in bulleted form.
Next Update and Additional Information This final section indicates when the next product, if any, can be expected. It is usually within an hour. It also tells where additional information about the event may be found.

IOC Technical Series, 105 Page 9
IOC
Technical S
eries, 105 P
age 9
4.3 Forecast Polygon Map
The forecast polygon map provides a quick and general view of the tsunami threat. All coastal areas of the Pacific covered by the product are enclosed within a set of polygons. Some countries or places are covered by a single polygon and some by multiple polygons. Each polygon is given a color depending upon its maximum level of threat. Some polygons are uncolored because either 1) the forecast model domain did not include those areas, or 2) the forecast model could not make a forecast because its resolution was insufficient in areas of shallow water.
The forecast polygons that divide extended coasts into segments or that surround particular island groups were chosen and named somewhat arbitrarily based upon geological and political boundaries. During the trail period, Member States are encouraged to review the polygons and recommend changes in boundaries or names to make the polygons more useful.
4.4 Forecast Polygon Table
The forecast polygon table shows, for each polygon with a threat, the maximum, mean, and median forecast coastal tsunami height as well as the maximum, mean, and median offshore tsunami height. Offshore heights are translated to coastal heights using Green’s Law. Rows are ordered by the maximum Green’s Law value, from largest to smallest. For places like islands that have dimensions much smaller than the tsunami wavelength, Green’s Law overestimates and the offshore height may be more appropriate. In all cases, height is measured relative to the tide level. Also provided are the standard deviation of the values, the total number of forecast points within each polygon, and a descriptive name for each polygon. Polygons shown in the Forecast Polygon Map are colored according to the maximum coastal height as given in this table.
4.5 Energy Forecast Map
The energy map shows the maximum tsunami amplitude at each place in the deep ocean. It shows how the tsunami is directed away from the earthquake, how it is focused and defocused by the shape of the seafloor, and how it diminishes by spreading. It is useful for understanding why some areas may be more threatened because they are in a “beam” of directed tsunami energy. The color scale is chosen to best depict the range of expected forecasts, with the maximum forecast indicated as the largest value on the scale.
4.6 Coastal Forecast Map
This map shows the individual coastal forecast points colored according to the forecast tsunami height at each point. It provides significantly more spatial detail than the polygons. This can be useful for identifying when only part of a coast within a polygon is under threat. The accuracy of individual points, however, is less than points as a group. The color scale is according to the threat level ranges, with the maximum forecast indicated as the largest value on the scale.
4.7 Coastal Forecast KMZ File
Also provided with each forecast is a KMZ file containing the individual tsunami forecast height values for each forecast point. When combined with a program like GoogleEarth, the user can drill down into the forecast to examine individual forecast points. Again, however, it is important to note that the accuracy of individual points is less than the group value.

IOC Technical Series, 105 Page 10
IOC
Technical S
eries, 105 P
age 10
GoogleEarth screenshot of sample RIFT coastal tsunami forecast points around the Galapagos Islands. By mousing over and clicking on a forecast point, the metadata for the point is shown.
5. GENERAL RESPONSE GUIDANCE
In the existing products, a warning for a particular coast means that there is a possibility of destructive tsunami waves, and the criterion for issuing a warning is the possibility of tsunami waves that will be more than one meter above normal tide level (or mean sea level). Without additional information, the conservative response to a PTWC warning should be the maximum evacuation of entire coastal areas.
In the PTWC New Products, there are four categories of forecast tsunami threat that are based on the maximum wave amplitude forecast. These categories are: less than 0.3 meters, 0.3 to 1 meter, 1 to 3 meters, and more than 3 meters. The categories are intended to generally correspond to different levels of public safety response.
A tsunami that is forecast to have less than 0.3 meter fluctuations from mean sea level is generally not a hazard, and the tsunami would usually not be observed except in places where there is still water, or on sea level gauges.
A tsunami that is forecast to have sea level fluctuations of 0.3 to 1 meter above and below mean sea level is usually a hazard only for ocean recreation activities, such as swimming, diving, and leisure boating, due to strong and unusual near-shore ocean currents, and to minor flooding of beaches and harbors immediately adjacent to the coast. It does not necessarily require a full evacuation of coastal areas, but may require safety actions that recommend swimmers and divers to exit the ocean and persons in low-lying areas of beaches and harbors to stay aware from the ocean or evacuate.
A tsunami that is forecast to have sea level fluctuations of 1 to 3 meters above or below mean sea level is a much more dangerous hazard and in most cases would require a significant evacuation of the coast to protect lives. However, in places with elevated

IOC Technical Series, 105 Page 11
IOC
Technical S
eries, 105 P
age 11
coastlines, or places where multiple evacuation zones have been designated, a public safety action that is less than the maximum evacuation may be appropriate.
A tsunami that is forecast to reach more than 3 meters above mean sea level is a very serious threat that would require a maximum evacuation.
Standard response procedures for the PTWC forecast threat levels should be developed nationally and/or locally, taking into consideration the character of the coast, the range and state of the tides, the various vulnerabilities at the coast, and the capability of emergency officials to issue evacuation notices to vulnerable communities in a timely manner.
Further definitions and guidance on warning centers and their products, threat levels, and other terms used in tsunami warning and emergency response can be found in Section 5 (Tsunami Warning System, Acronyms, & Organizations) of the 2013 Tsunami Glossary (Intergovernmental Oceanographic Commission. Revised Edition 2013. Tsunami Glossary, 2013. Paris, UNESCO. IOC Technical Series, 85. (English) (IOC/2008/TS/85 rev.). The 2013 Tsunami Glossary was updated to reflect the establishment of warning centers in the Indian Ocean and North Atlantic and Mediterranean region, and to reflect that PTWS PTWC New Products. PTWC’s existing products (Tsunami Watch, Warnings, and Information Bulletins) are described in Section 5 Acronyms & Organizations of the 2008 Tsunami Glossary.
Both documents can be downloaded in low-resolution from the ITIC web site at: http://itic.ioc-unesco.org/index.php?option=com_content&view=article&id=1328&Itemid=2305&lang=en

IOC Technical Series, 105 Page 12
IOC
Technical S
eries, 105 P
age 12
APPENDIX I. BACKGROUND AND MOTIVATION
Over the past decade, PTWC has gone from ingesting data from only about 10 seismic stations outside of Hawaii to over 400 stations now. In addition, its seismic data processing capabilities have become faster and more accurate due to a combination of a better information technology and communications infrastructure, as well as improved science and techniques of its implementation. Within the past five years, and especially since the 2004 Indian Ocean tsunami, the quantity, quality, and timeliness of sea level observations available to PTWC have also increased dramatically. Notably, data are now being received from 39 deep-ocean tsunami gauges in the Pacific that provide measurements of tsunami waveforms unaltered by non-linear effects near the coast, and over 400 sea level stations along country coasts. Lastly, numerical forecast models implemented into PTWC’s operations over the past several years have demonstrated that they are capable of providing much more detailed and precise guidance on the expected level of tsunami impacts than was previously possible using PTWC’s current PTWS warning procedures based only on limited historical data and general properties of tsunami generation, propagation and impact. While the predictive capabilities of the forecast models are not perfect, it is felt that they are now accurate enough to provide reliable guidance on the expected levels of impact to areas that are threatened, and thus should greatly reduce the number of areas warned unnecessarily.
During the Twenty-second and Twenty-third sessions of the ICG/PTWS (2007, 2009), the PTWC reported on operational enhancements that are now permitting the PTWC to provide more timely and accurate assessments of tsunami threat, and asked Member States for input on how PTWC can improve its services. In response, Recommendation ICG/PTWS-XXIII.1 established a Task Team on Enhancing Tsunami Warning Products under the PTWS Working Group on Detection, Warning and Dissemination (WG 2) to review current capabilities, obtain customer feedback, consider best practices, and develop recommendations to improve existing or create new products, and improve dissemination for more effective, functional, and timely delivery.
At the Twenty-fourth session of the ICG/PTWS (May, 2011), Recommendation ICG/PTWS-XXIV.1 asked PTWC to proceed with its development of improved tsunami procedures and products with the Task Team on Enhancing Products guiding and providing feedback and related documentation to PTWC and the ICG/PTWS regarding these changes and the proposed implementation timeline. Any new products and procedures should be exercised in an experimental mode as they are developed and until they are approved for official use by the ICG/PTWS-XXV or later. Recommendation ICG/PTWS-XXIV.3 on PTWS Exercises asked the Working Group Two Task Team on PacWave11 to oversee the conduct of Exercise Pacific Wave 2011 (PacWave11); PacWave11 took place in November 2011 as an international exercise aimed at improving local and regional tsunami response and additionally, introduced the new products to Member States. Through the post-exercise evaluation, comments were received on the staging, format, and contents of the new products.
In May 2012, the Task Teams on PacWave11 and Enhanced Products met to review the feedback on the new products from PacWave11 and other tsunami meetings, and provided recommendations to the following PTWS Steering Committee (PTWS-SC). The PTWS-SC endorsed the recommendations, approved a revised timeline for implementation, and asked the Task Team on PacWave11 to continue and organize Exercise Pacific Wave 2013 to further validate the new products. Since 2009, the Task Teams on Enhanced Products and Exercise Pacific Wave have worked closely to develop, exercise, and obtain feedback from Member States for the implementation and changeover to the new products that is expected in 2014.

IOC Technical Series, 105 Page 13
IOC
Technical S
eries, 105 P
age 13
APPENDIX II. EXAMPLES OF PTWS PTWC NEW ENHANCED PRODUCTS
A. Tsunami Information Statement (earthquake with no tsunami threat)
a. Initial Product
i. Text Product
ZCZC
WEPA42 PHEB 081118
TIBPAC
TSUNAMI INFORMATION STATEMENT NUMBER 1
NWS PACIFIC TSUNAMI WARNING CENTER EWA BEACH HI
1118 UCT FRI FEB 8 2013
...TSUNAMI INFORMATION STATEMENT...
THIS STATEMENT IS FOR ALL COASTAL AREAS OF THE PACIFIC AND ITS
ADJACENT SEAS EXCEPT THOSE OF U.S. STATES AND BRITISH COLUMBIA.
IT IS ISSUED AS ADVICE IN SUPPORT OF THE UNESCO/IOC PACIFIC
TSUNAMI WARNING SYSTEM.
EVALUATION
----------
* AN EARTHQUAKE WITH A PRELIMINARY MAGNITUDE OF 6.7 OCCURRED
OFF THE COAST OF CENTRAL CHILE AT 1112 UTC ON FRIDAY FEBRUARY
8 2013.
* BASED ON ALL AVAILABLE DATA... THERE IS NO TSUNAMI THREAT
FROM THIS EARTHQUAKE.
RECOMMENDED ACTIONS
-------------------
* NO ACTION IS REQUIRED.
PRELIMINARY EARTHQUAKE PARAMETERS
---------------------------------
* MAGNITUDE 6.7
* ORIGIN TIME 1112 UTC FEB 8 2013
* COORDINATES 33.7 SOUTH 72.3 WEST
* DEPTH 20 KM / 12 MILES
* LOCATION OFF THE COAST OF CENTRAL CHILE
NEXT UPDATE AND ADDITIONAL INFORMATION
--------------------------------------
* THIS WILL BE THE ONLY STATEMENT ISSUED FOR THIS EVENT UNLESS
ADDITIONAL DATA ARE RECEIVED OR THE SITUATION CHANGES.
* COASTAL REGIONS OF HAWAII SHOULD REFER TO PACIFIC TSUNAMI
WARNING CENTER MESSAGES FOR HAWAII THAT CAN BE FOUND AT
PTWC.WEATHER.GOV.
* COASTAL REGIONS OF CALIFORNIA... OREGON... WASHINGTON...
BRITISH COLUMBIA AND ALASKA SHOULD REFER TO WEST COAST AND
ALASKA TSUNAMI WARNING CENTER MESSAGES THAT CAN BE FOUND AT
WCATWC.ARH.NOAA.GOV.
* AUTHORITATIVE INFORMATION ABOUT THE EARTHQUAKE FROM THE U.S.
GEOLOGICAL SURVEY CAN BE FOUND ON THE INTERNET AT
EARTHQUAKE.USGS.GOV/EARTHQUAKES/MAP.
* FURTHER INFORMATION ABOUT THIS EVENT MAY BE FOUND AT
PTWC.WEATHER.GOV AND AT WWW.TSUNAMI.GOV.
$$

IOC Technical Series, 105 Page 14
IOC
Technical S
eries, 105 P
age 14
B. Tsunami Information Statement (earthquake with minimal tsunami threat)
a. Initial Product
i. Text Product
ZCZC
WEPA42 PHEB 081119
TIBPAC
TSUNAMI INFORMATION STATEMENT NUMBER 1
NWS PACIFIC TSUNAMI WARNING CENTER EWA BEACH HI
1119 UCT FRI FEB 8 2013
...TSUNAMI INFORMATION STATEMENT...
THIS STATEMENT IS FOR ALL COASTAL AREAS OF THE PACIFIC AND ITS
ADJACENT SEAS EXCEPT THOSE OF U.S. STATES AND BRITISH COLUMBIA.
IT IS ISSUED AS ADVICE IN SUPPORT OF THE UNESCO/IOC PACIFIC
TSUNAMI WARNING SYSTEM.
EVALUATION
----------
* AN EARTHQUAKE WITH A PRELIMINARY MAGNITUDE OF 6.7 OCCURRED
OFF THE COAST OF CENTRAL CHILE AT 1112 UTC ON FRIDAY FEBRUARY
8 2013.
* BASED ON ALL AVAILABLE DATA... THERE IS NO TSUNAMI THREAT
FROM THIS EARTHQUAKE ALTHOUGH SOME MINOR SEA LEVEL
FLUCTUATIONS MAY OCCUR.
RECOMMENDED ACTIONS
-------------------
* PERSONS ALONG COASTAL AREAS NEAR THE EARTHQUAKE SHOULD BE
OBSERVANT AND EXERCISE NORMAL CAUTION. OTHERWISE... NO ACTION
IS REQUIRED.
POTENTIAL IMPACTS
-----------------
* MINOR SEA LEVEL FLUCTUATIONS UP TO 0.3 METERS ABOVE AND BELOW
THE NORMAL TIDE MAY OCCUR IN COASTAL AREAS NEAR THE EARTHQUAKE
OVER THE NEXT FEW HOURS.
PRELIMINARY EARTHQUAKE PARAMETERS
---------------------------------
* MAGNITUDE 6.7
* ORIGIN TIME 1112 UTC FEB 8 2013
* COORDINATES 33.7 SOUTH 72.3 WEST
* DEPTH 20 KM / 12 MILES
* LOCATION OFF THE COAST OF CENTRAL CHILE
NEXT UPDATE AND ADDITIONAL INFORMATION
--------------------------------------
* THIS WILL BE THE ONLY STATEMENT ISSUED FOR THIS EVENT UNLESS
ADDITIONAL DATA ARE RECEIVED OR THE SITUATION CHANGES.
* COASTAL REGIONS OF HAWAII SHOULD REFER TO PACIFIC TSUNAMI
WARNING CENTER MESSAGES FOR HAWAII THAT CAN BE FOUND AT
PTWC.WEATHER.GOV.
* COASTAL REGIONS OF CALIFORNIA... OREGON... WASHINGTON...
BRITISH COLUMBIA AND ALASKA SHOULD REFER TO WEST COAST AND
ALASKA TSUNAMI WARNING CENTER MESSAGES THAT CAN BE FOUND AT
WCATWC.ARH.NOAA.GOV.

IOC Technical Series, 105 Page 15
IOC
Technical S
eries, 105 P
age 15
* AUTHORITATIVE INFORMATION ABOUT THE EARTHQUAKE FROM THE U.S.
GEOLOGICAL SURVEY CAN BE FOUND ON THE INTERNET AT
EARTHQUAKE.USGS.GOV/EARTHQUAKES/MAP.
* FURTHER INFORMATION ABOUT THIS EVENT MAY BE FOUND AT
PTWC.WEATHER.GOV AND AT WWW.TSUNAMI.GOV.
$$
C. Tsunami Threat Message (earthquake with low-level tsunami threat)
a. Initial Products (initial forecast)
i. Text Product
ZCZC
WEPA40 PHEB 081119
TSUPAC
TSUNAMI MESSAGE NUMBER 1
NWS PACIFIC TSUNAMI WARNING CENTER EWA BEACH HI
1119 UCT FRI FEB 8 2013
...TSUNAMI THREAT MESSAGE...
THIS MESSAGE IS FOR ALL COASTAL AREAS OF THE PACIFIC AND ITS
ADJACENT SEAS EXCEPT THOSE OF U.S. STATES AND BRITISH COLUMBIA.
IT IS ISSUED AS ADVICE IN SUPPORT OF THE UNESCO/IOC PACIFIC
TSUNAMI WARNING SYSTEM.
TSUNAMI THREAT FORECAST
-----------------------
* TSUNAMI WAVES REACHING 0.3 TO 1 METERS ABOVE THE NORMAL TIDE
ARE FORECAST FOR COASTS IN
CHILE.
EVALUATION
----------
* AN EARTHQUAKE WITH A PRELIMINARY MAGNITUDE OF 7.1 OCCURRED
OFF THE COAST OF CENTRAL CHILE AT 1112 UTC ON FRIDAY FEBRUARY
8 2013.
* BASED ON THE PRELIMINARY SEISMIC PARAMETERS... HAZARDOUS
TSUNAMI WAVES ARE FORECAST FOR SOME COASTS.
RECOMMENDED ACTIONS
-------------------
* GOVERNMENT AGENCIES RESPONSIBLE FOR THREATENED COASTAL AREAS
SHOULD TAKE ACTION TO INFORM AND INSTRUCT ANY COASTAL
POPULATIONS AT RISK IN ACCORDANCE WITH THEIR OWN EVALUATION...
PROCEDURES AND THE LEVEL OF THREAT.
* PERSONS LOCATED IN THREATENED COASTAL AREAS SHOULD STAY ALERT
FOR INFORMATION AND FOLLOW INSTRUCTIONS FROM LOCAL
AUTHORITIES.
ESTIMATED TIMES OF ARRIVAL
--------------------------
* ESTIMATED TIMES OF ARRIVAL -ETA- OF THE INITIAL TSUNAMI WAVE
ARE GIVEN BELOW. ACTUAL ARRIVAL TIMES MAY DIFFER AND THE
INITIAL WAVE MAY NOT BE THE LARGEST. A TSUNAMI IS A SERIES OF
WAVES AND THE TIME BETWEEN WAVES CAN BE FIVE MINUTES TO ONE
HOUR.

IOC Technical Series, 105 Page 16
IOC
Technical S
eries, 105 P
age 16
LOCATION REGION COORDINATES ETA(UTC)
------------------------------------------------------------
VALPARAISO CHILE 33.0S 71.6W 1130 02/08
COQUIMBO CHILE 29.9S 71.4W 1153 02/08
TALCAHUANO CHILE 36.7S 73.1W 1204 02/08
CALDERA CHILE 27.1S 70.8W 1213 02/08
CORRAL CHILE 39.8S 73.5W 1235 02/08
PUERTO MONTT CHILE 41.5S 73.0W 1531 02/08
POTENTIAL IMPACTS
-----------------
* TSUNAMI WAVES OF 0.3 TO 1 METER MAY CAUSE STRONG AND UNUSUAL
OCEAN CURRENTS AND MINOR FLOODING OF BEACH AND HARBOR AREAS.
* A TSUNAMI IS A SERIES OF WAVES. THE TIME BETWEEN WAVE CRESTS
CAN VARY FROM 5 MINUTES TO AN HOUR. THE HAZARD MAY PERSIST FOR
MANY HOURS OR LONGER AFTER THE INITIAL WAVE.
* IMPACTS CAN VARY SIGNIFICANTLY FROM ONE SECTION OF COAST TO
THE NEXT DUE TO LOCAL BATHYMETRY AND THE SHAPE AND ELEVATION
OF THE SHORELINE.
* IMPACTS CAN ALSO VARY DEPENDING UPON THE STATE OF THE TIDE AT
THE TIME OF THE MAXIMUM TSUNAMI WAVES.
PRELIMINARY EARTHQUAKE PARAMETERS
---------------------------------
* MAGNITUDE 7.1
* ORIGIN TIME 1112 UTC FEB 8 2013
* COORDINATES 33.7 SOUTH 72.3 WEST
* DEPTH 20 KM / 12 MILES
* LOCATION OFF THE COAST OF CENTRAL CHILE
NEXT UPDATE AND ADDITIONAL INFORMATION
--------------------------------------
* THE NEXT MESSAGE WILL BE ISSUED IN ONE HOUR... OR SOONER IF
THE SITUATION WARRANTS.
* COASTAL REGIONS OF HAWAII SHOULD REFER TO PACIFIC TSUNAMI
WARNING CENTER MESSAGES FOR HAWAII THAT CAN BE FOUND AT
PTWC.WEATHER.GOV.
* COASTAL REGIONS OF CALIFORNIA... OREGON... WASHINGTON...
BRITISH COLUMBIA AND ALASKA SHOULD REFER TO WEST COAST AND
ALASKA TSUNAMI WARNING CENTER MESSAGES THAT CAN BE FOUND AT
WCATWC.ARH.NOAA.GOV.
* AUTHORITATIVE INFORMATION ABOUT THE EARTHQUAKE FROM THE U.S.
GEOLOGICAL SURVEY CAN BE FOUND ON THE INTERNET AT
EARTHQUAKE.USGS.GOV/EARTHQUAKES/MAP.
* FURTHER INFORMATION ABOUT THIS EVENT MAY BE FOUND AT
PTWC.WEATHER.GOV AND AT WWW.TSUNAMI.GOV.
$$

IO
C T
echnical Series, 105
Page 17
ii. Forecast Polygons Map

IO
C T
echnical Series, 105
Page 18
iii. Forecast Polygons Table
PTWC RIFT Tsunami Forecast Model - Run ID: 2013020812443
Earthquake - Origin: 02/08/2013 11:12:13 UTC Coordinates: 33.7S 72.3W Depth: 020km Magnitude: 7.1
Coastal Forecast (meters) Offshore Forecast (meters) Total
Maximum Mean Median STD Maximum Mean Median STD Points Region Name
0.65 0.26 0.18 0.16 0.58 0.18 0.12 0.13 132 North Central Chile
0.62 0.20 0.16 0.10 0.62 0.14 0.12 0.09 138 South Central Chile

IOC Technical Series, 105 Page 19
IOC
Technical S
eries, 105 P
age 19
iv. Energy Forecast Map

IOC Technical Series, 105 Page 20
IOC
Technical S
eries, 105 P
age 20 v. Coastal Forecast Map

IOC Technical Series, 105 Page 21
IOC
Technical S
eries, 105 P
age 21
b. Supplemental Products (revised forecast and observations)
i. Text Product
ZCZC
WEPA40 PHEB 081151
TSUPAC
TSUNAMI MESSAGE NUMBER 2
NWS PACIFIC TSUNAMI WARNING CENTER EWA BEACH HI
1151 UCT FRI FEB 8 2013
...TSUNAMI THREAT MESSAGE...
THIS MESSAGE IS FOR ALL COASTAL AREAS OF THE PACIFIC AND ITS
ADJACENT SEAS EXCEPT THOSE OF U.S. STATES AND BRITISH COLUMBIA.
IT IS ISSUED AS ADVICE IN SUPPORT OF THE UNESCO/IOC PACIFIC
TSUNAMI WARNING SYSTEM.
TSUNAMI THREAT FORECAST
-----------------------
* TSUNAMI WAVES REACHING 0.3 TO 1 METERS ABOVE THE NORMAL TIDE
ARE FORECAST FOR COASTS IN
CHILE.
EVALUATION
----------
* AN EARTHQUAKE WITH A PRELIMINARY MAGNITUDE OF 7.1 OCCURRED
OFF THE COAST OF CENTRAL CHILE AT 1112 UTC ON FRIDAY FEBRUARY
8 2013.
* TSUNAMI WAVES HAVE BEEN OBSERVED.
* BASED ON ALL AVAILABLE DATA... HAZARDOUS TSUNAMI WAVES ARE
FORECAST FOR SOME COASTS.
RECOMMENDED ACTIONS
-------------------
* GOVERNMENT AGENCIES RESPONSIBLE FOR THREATENED COASTAL AREAS
SHOULD TAKE ACTION TO INFORM AND INSTRUCT ANY COASTAL
POPULATIONS AT RISK IN ACCORDANCE WITH THEIR OWN EVALUATION...
PROCEDURES AND THE LEVEL OF THREAT.
* PERSONS LOCATED IN THREATENED COASTAL AREAS SHOULD STAY ALERT
FOR INFORMATION AND FOLLOW INSTRUCTIONS FROM LOCAL
AUTHORITIES.
ESTIMATED TIMES OF ARRIVAL
--------------------------
* ESTIMATED TIMES OF ARRIVAL -ETA- OF THE INITIAL TSUNAMI WAVE
ARE GIVEN BELOW. ACTUAL ARRIVAL TIMES MAY DIFFER AND THE
INITIAL WAVE MAY NOT BE THE LARGEST. A TSUNAMI IS A SERIES OF
WAVES AND THE TIME BETWEEN WAVES CAN BE FIVE MINUTES TO ONE
HOUR.
LOCATION REGION COORDINATES ETA(UTC)
------------------------------------------------------------
VALPARAISO CHILE 33.0S 71.6W 1130 02/08
COQUIMBO CHILE 29.9S 71.4W 1153 02/08
TALCAHUANO CHILE 36.7S 73.1W 1204 02/08
CALDERA CHILE 27.1S 70.8W 1213 02/08
CORRAL CHILE 39.8S 73.5W 1235 02/08
PUERTO MONTT CHILE 41.5S 73.0W 1531 02/08

IOC Technical Series, 105 Page 22
IOC
Technical S
eries, 105 P
age 22 POTENTIAL IMPACTS
-----------------
* TSUNAMI WAVES OF 0.3 TO 1 METER MAY CAUSE STRONG AND UNUSUAL
OCEAN CURRENTS AND MINOR FLOODING OF BEACH AND HARBOR AREAS.
* A TSUNAMI IS A SERIES OF WAVES. THE TIME BETWEEN WAVE CRESTS
CAN VARY FROM 5 MINUTES TO AN HOUR. THE HAZARD MAY PERSIST FOR
MANY HOURS OR LONGER AFTER THE INITIAL WAVE.
* IMPACTS CAN VARY SIGNIFICANTLY FROM ONE SECTION OF COAST TO
THE NEXT DUE TO LOCAL BATHYMETRY AND THE SHAPE AND ELEVATION
OF THE SHORELINE.
* IMPACTS CAN ALSO VARY DEPENDING UPON THE STATE OF THE TIDE AT
THE TIME OF THE MAXIMUM TSUNAMI WAVES.
TSUNAMI OBSERVATIONS
--------------------
* THE FOLLOWING ARE TSUNAMI WAVE OBSERVATIONS FROM COASTAL
AND/OR DEEP-OCEAN SEA LEVEL GAUGES AT THE INDICATED LOCATIONS.
THE MAXIMUM TSUNAMI HEIGHT IS MEASURED WITH RESPECT TO THE
NORMAL TIDE LEVEL.
GAUGE TIME OF MAXIMUM WAVE
COORDINATES MEASURE TSUNAMI PERIOD
GAUGE LOCATION LAT LON (UTC) HEIGHT (MIN)
-------------------------------------------------------------
VALPARAISO CL 33.0S 71.6W 1113 0.6M/ 2.1FT 30
PRELIMINARY EARTHQUAKE PARAMETERS
---------------------------------
* MAGNITUDE 7.1
* ORIGIN TIME 1112 UTC FEB 8 2013
* COORDINATES 33.7 SOUTH 72.3 WEST
* DEPTH 20 KM / 12 MILES
* LOCATION OFF THE COAST OF CENTRAL CHILE
NEXT UPDATE AND ADDITIONAL INFORMATION
--------------------------------------
* THE NEXT MESSAGE WILL BE ISSUED IN ONE HOUR... OR SOONER IF
THE SITUATION WARRANTS.
* COASTAL REGIONS OF HAWAII SHOULD REFER TO PACIFIC TSUNAMI
WARNING CENTER MESSAGES FOR HAWAII THAT CAN BE FOUND AT
PTWC.WEATHER.GOV.
* COASTAL REGIONS OF CALIFORNIA... OREGON... WASHINGTON...
BRITISH COLUMBIA AND ALASKA SHOULD REFER TO WEST COAST AND
ALASKA TSUNAMI WARNING CENTER MESSAGES THAT CAN BE FOUND AT
WCATWC.ARH.NOAA.GOV.
* AUTHORITATIVE INFORMATION ABOUT THE EARTHQUAKE FROM THE U.S.
GEOLOGICAL SURVEY CAN BE FOUND ON THE INTERNET AT
EARTHQUAKE.USGS.GOV/EARTHQUAKES/MAP.
* FURTHER INFORMATION ABOUT THIS EVENT MAY BE FOUND AT
PTWC.WEATHER.GOV AND AT WWW.TSUNAMI.GOV.
$$

IOC
Technical S
eries, 105 P
age 23
ii. Forecast Polygons Map

IO
C T
echnical Series, 105
Page 24
iii. Forecast Polygons Table
PTWC RIFT Tsunami Forecast Model - Run ID: 2013020812460
Earthquake - Origin: 02/08/2013 11:12:13 UTC Coordinates: 33.7S 72.3W Depth: 020km Magnitude: 7.1
Coastal Forecast (meters) Offshore Forecast (meters) Total
Maximum Mean Median STD Maximum Mean Median STD Points Region Name
0.58 0.05 0.02 0.08 0.19 0.03 0.01 0.03 160 South Central Chile
0.58 0.09 0.04 0.09 0.17 0.04 0.02 0.04 120 North Central Chile
0.06 0.03 0.03 0.01 0.03 0.01 0.01 0.01 27 Marquesas Islands
0.05 0.02 0.01 0.01 0.02 0.01 0.00 0.00 145 Hawaii
0.04 0.02 0.02 0.00 0.02 0.01 0.01 0.00 101 Central Peru
0.03 0.03 0.03 0.00 0.01 0.01 0.01 0.00 1 Easter Island
0.03 0.03 0.03 0.00 0.02 0.01 0.01 0.01 4 Tuamotu Archipelago
0.03 0.03 0.03 0.00 0.01 0.01 0.01 0.00 1 Pitcairn Island
0.03 0.03 0.03 0.00 0.02 0.01 0.01 0.00 73 Southern Peru
0.03 0.02 0.02 0.00 0.01 0.01 0.01 0.00 119 Northern Chile
0.02 0.02 0.02 0.00 0.00 0.00 0.00 0.00 1 Palmyra Island
0.02 0.02 0.02 0.00 0.01 0.00 0.00 0.00 36 Society Islands
0.02 0.01 0.01 0.00 0.01 0.01 0.01 0.01 2 Cook Islands
0.02 0.01 0.01 0.00 0.01 0.00 0.00 0.00 89 Galapagos Islands
0.02 0.01 0.01 0.00 0.01 0.00 0.00 0.00 32 Jalisco Mexico
0.02 0.01 0.01 0.00 0.01 0.01 0.01 0.00 48 Pacific Side of Baja Sud Mexico
0.02 0.01 0.01 0.00 0.01 0.00 0.00 0.00 72 Oaxaca Mexico
0.02 0.01 0.01 0.00 0.00 0.00 0.00 0.00 37 El Salvador
0.02 0.01 0.01 0.00 0.01 0.00 0.00 0.00 56 Guerrero Mexico
0.02 0.01 0.01 0.00 0.01 0.00 0.00 0.00 77 Pacific Coast of Costa Rica
0.02 0.01 0.01 0.00 0.01 0.00 0.00 0.00 101 Northern Peru
0.02 0.01 0.01 0.00 0.01 0.00 0.00 0.00 3 Line Islands
0.02 0.01 0.01 0.00 0.01 0.00 0.00 0.00 46 Gulf Side of Baja Sud Mexico
0.02 0.01 0.01 0.00 0.01 0.00 0.00 0.00 328 Southern Chile
0.01 0.01 0.01 0.00 0.01 0.00 0.00 0.00 27 Michoacan Mexico
0.01 0.01 0.01 0.00 0.00 0.00 0.00 0.00 12 Colima Mexico
0.01 0.01 0.01 0.00 0.00 0.00 0.00 0.00 28 Chiapas Mexico
0.01 0.01 0.01 0.00 0.00 0.00 0.00 0.00 32 Pacific Coast of Guatemala
0.01 0.01 0.01 0.00 0.00 0.00 0.00 0.00 27 Nayarit Mexico
0.01 0.01 0.01 0.00 0.00 0.00 0.00 0.00 43 Sinaloa Mexico
0.01 0.01 0.01 0.00 0.00 0.00 0.00 0.00 1 Jarvis Island
0.01 0.01 0.01 0.00 0.00 0.00 0.00 0.00 37 Pacific Side of Nicaragua

IOC
Technical S
eries, 105 P
age 25
0.01 0.01 0.01 0.00 0.01 0.00 0.00 0.00 89 Pacific Side of Panama
0.01 0.01 0.01 0.00 0.00 0.00 0.00 0.00 99 Ecuador
0.01 0.01 0.01 0.00 0.01 0.00 0.00 0.00 96 Pacific Coast of Colombia

IOC Technical Series, 105 Page 26
IOC
Technical S
eries, 105 P
age 26
iv. Energy Forecast Map

IOC Technical Series, 105 Page 27
IOC
Technical S
eries, 105 P
age 27
v. Coastal Forecast Map
Note that only a small section of Chilean coast is forecast to have amplitudes between 0.3 and 1 meter. Its yellow color can be seen through the star (which indicates the earthquake epicenter).

IOC Technical Series, 105 Page 28
IOC
Technical S
eries, 105 P
age 28
c. Final Product (threat ended)
i. Text Product
ZCZC
WEPA40 PHEB 081235
TSUPAC
TSUNAMI MESSAGE NUMBER 3
NWS PACIFIC TSUNAMI WARNING CENTER EWA BEACH HI
1235 UCT FRI FEB 8 2013
...FINAL TSUNAMI THREAT MESSAGE...
THIS MESSAGE IS FOR ALL COASTAL AREAS OF THE PACIFIC AND ITS
ADJACENT SEAS EXCEPT THOSE OF U.S. STATES AND BRITISH COLUMBIA.
IT IS ISSUED AS ADVICE IN SUPPORT OF THE UNESCO/IOC PACIFIC
TSUNAMI WARNING SYSTEM.
TSUNAMI THREAT FORECAST
-----------------------
* THERE IS NO LONGER A TSUNAMI THREAT FROM THIS EARTHQUAKE.
EVALUATION
----------
* AN EARTHQUAKE WITH A PRELIMINARY MAGNITUDE OF 7.1 OCCURRED
OFF THE COAST OF CENTRAL CHILE AT 1112 UTC ON FRIDAY FEBRUARY
8 2013.
* BASED ON ALL AVAILABLE DATA... THE TSUNAMI THREAT FROM THIS
EARTHQUAKE HAS PASSED AND THERE IS NO FURTHER THREAT.
RECOMMENDED ACTIONS
-------------------
* REMAIN OBSERVANT AND EXERCISE NORMAL CAUTION NEAR THE SEA.
OTHERWISE... NO ACTION IS REQUIRED.
POTENTIAL IMPACTS
-----------------
* MINOR SEA LEVEL FLUCTUATIONS OF UP TO 0.3 METERS ABOVE AND
BELOW THE NORMAL TIDE MAY CONTINUE OVER THE NEXT FEW HOURS.
TSUNAMI OBSERVATIONS
--------------------
* THE FOLLOWING ARE TSUNAMI WAVE OBSERVATIONS FROM COASTAL
AND/OR DEEP-OCEAN SEA LEVEL GAUGES AT THE INDICATED LOCATIONS.
THE MAXIMUM TSUNAMI HEIGHT IS MEASURED WITH RESPECT TO THE
NORMAL TIDE LEVEL.
GAUGE TIME OF MAXIMUM WAVE
COORDINATES MEASURE TSUNAMI PERIOD
GAUGE LOCATION LAT LON (UTC) HEIGHT (MIN)
-------------------------------------------------------------
VALPARAISO CL 33.0S 71.6W 1113 0.6M/ 2.1FT 30
IOC Technical Series, 105 Page 29
IOC
Technical S
eries, 105 P
age 29
PRELIMINARY EARTHQUAKE PARAMETERS
---------------------------------
* MAGNITUDE 7.1
* ORIGIN TIME 1112 UTC FEB 8 2013
* COORDINATES 33.7 SOUTH 72.3 WEST
* DEPTH 20 KM / 12 MILES
* LOCATION OFF THE COAST OF CENTRAL CHILE
NEXT UPDATE AND ADDITIONAL INFORMATION
--------------------------------------
* THIS WILL BE THE FINAL STATEMENT ISSUED FOR THIS EVENT UNLESS
NEW INFORMATION IS RECEIVED OR THE SITUATION CHANGES.
* COASTAL REGIONS OF HAWAII SHOULD REFER TO PACIFIC TSUNAMI
WARNING CENTER MESSAGES FOR HAWAII THAT CAN BE FOUND AT
PTWC.WEATHER.GOV.
* COASTAL REGIONS OF CALIFORNIA... OREGON... WASHINGTON...
BRITISH COLUMBIA AND ALASKA SHOULD REFER TO WEST COAST AND
ALASKA TSUNAMI WARNING CENTER MESSAGES THAT CAN BE FOUND AT
WCATWC.ARH.NOAA.GOV.
* AUTHORITATIVE INFORMATION ABOUT THE EARTHQUAKE FROM THE U.S.
GEOLOGICAL SURVEY CAN BE FOUND ON THE INTERNET AT
EARTHQUAKE.USGS.GOV/EARTHQUAKES/MAP.
* FURTHER INFORMATION ABOUT THIS EVENT MAY BE FOUND AT
PTWC.WEATHER.GOV AND AT WWW.TSUNAMI.GOV.
$$
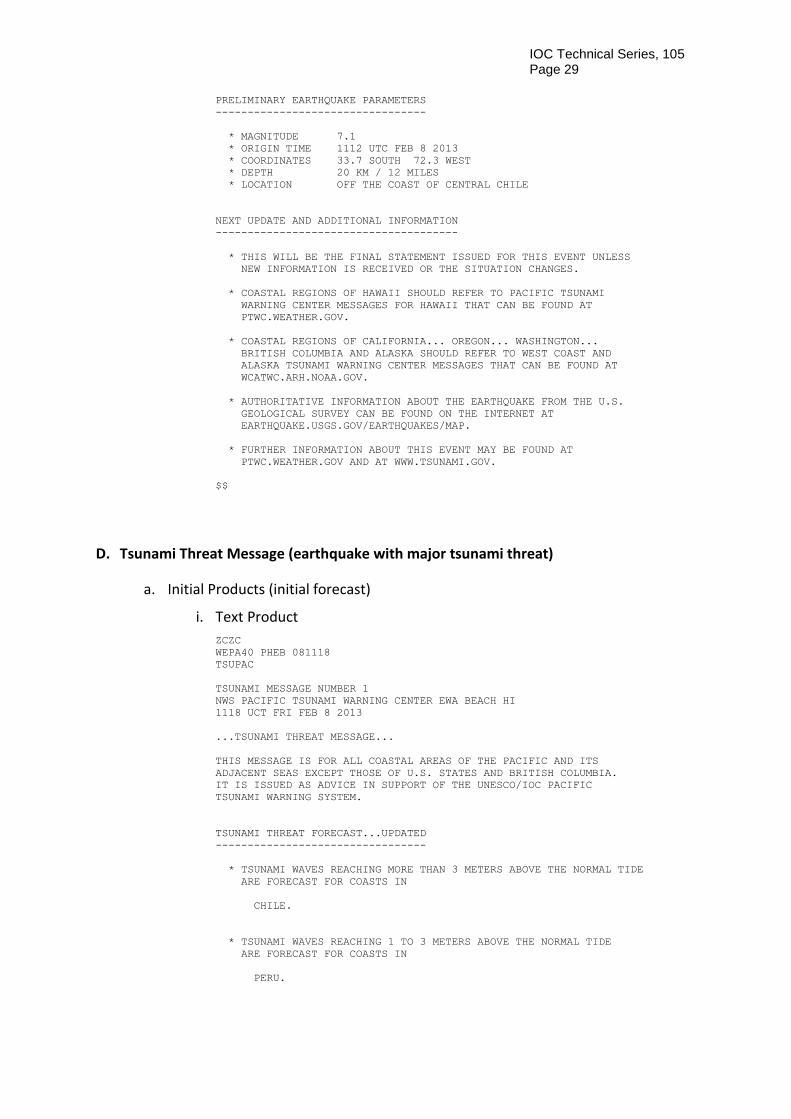
D. Tsunami Threat Message (earthquake with major tsunami threat)
a. Initial Products (initial forecast)
i. Text Product
ZCZC
WEPA40 PHEB 081118
TSUPAC
TSUNAMI MESSAGE NUMBER 1
NWS PACIFIC TSUNAMI WARNING CENTER EWA BEACH HI
1118 UCT FRI FEB 8 2013
...TSUNAMI THREAT MESSAGE...
THIS MESSAGE IS FOR ALL COASTAL AREAS OF THE PACIFIC AND ITS
ADJACENT SEAS EXCEPT THOSE OF U.S. STATES AND BRITISH COLUMBIA.
IT IS ISSUED AS ADVICE IN SUPPORT OF THE UNESCO/IOC PACIFIC
TSUNAMI WARNING SYSTEM.
TSUNAMI THREAT FORECAST...UPDATED
---------------------------------
* TSUNAMI WAVES REACHING MORE THAN 3 METERS ABOVE THE NORMAL TIDE
ARE FORECAST FOR COASTS IN
CHILE.
* TSUNAMI WAVES REACHING 1 TO 3 METERS ABOVE THE NORMAL TIDE
ARE FORECAST FOR COASTS IN
PERU.

IOC Technical Series, 105 Page 30
IOC
Technical S
eries, 105 P
age 30
EVALUATION
----------
* AN EARTHQUAKE WITH A PRELIMINARY MAGNITUDE OF 8.7 OCCURRED
OFF THE COAST OF CENTRAL CHILE AT 1112 UTC ON FRIDAY FEBRUARY
8 2013.
* BASED ON THE PRELIMINARY SEISMIC PARAMETERS... HAZARDOUS
TSUNAMI WAVES ARE FORECAST FOR SOME COASTS.
RECOMMENDED ACTIONS
-------------------
* GOVERNMENT AGENCIES RESPONSIBLE FOR THREATENED COASTAL AREAS
SHOULD TAKE ACTION TO INFORM AND INSTRUCT ANY COASTAL
POPULATIONS AT RISK IN ACCORDANCE WITH THEIR OWN EVALUATION...
PROCEDURES AND THE LEVEL OF THREAT.
* PERSONS LOCATED IN THREATENED COASTAL AREAS SHOULD STAY ALERT
FOR INFORMATION AND FOLLOW INSTRUCTIONS FROM LOCAL
AUTHORITIES.
ESTIMATED TIMES OF ARRIVAL
--------------------------
* ESTIMATED TIMES OF ARRIVAL -ETA- OF THE INITIAL TSUNAMI WAVE
ARE GIVEN BELOW. ACTUAL ARRIVAL TIMES MAY DIFFER AND THE
INITIAL WAVE MAY NOT BE THE LARGEST. A TSUNAMI IS A SERIES OF
WAVES AND THE TIME BETWEEN WAVES CAN BE FIVE MINUTES TO ONE
HOUR.
LOCATION REGION COORDINATES ETA(UTC)
------------------------------------------------------------
VALPARAISO CHILE 33.0S 71.6W 1130 02/08
COQUIMBO CHILE 29.9S 71.4W 1153 02/08
TALCAHUANO CHILE 36.7S 73.1W 1204 02/08
CALDERA CHILE 27.1S 70.8W 1213 02/08
ANTOFAGASTA CHILE 23.3S 70.4W 1235 02/08
CORRAL CHILE 39.8S 73.5W 1235 02/08
IQUIQUE CHILE 20.2S 70.1W 1307 02/08
ARICA CHILE 18.5S 70.3W 1319 02/08
MOLLENDO PERU 17.1S 72.0W 1326 02/08
SAN JUAN PERU 15.3S 75.2W 1344 02/08
GOLFO DE PENAS CHILE 47.1S 74.9W 1348 02/08
LA PUNTA PERU 12.1S 77.2W 1436 02/08
PUERTO MONTT CHILE 41.5S 73.0W 1531 02/08
POTENTIAL IMPACTS
-----------------
* TSUNAMI WAVES OF MORE THAN 3 METERS ARE CAPABLE OF CAUSING
ALMOST COMPLETE DESTRUCTION OF COASTAL STRUCTURES AND
INFRASTRUCTURE IN LOW-LYING COASTAL AREAS.
* TSUNAMI WAVES OF 1 TO 3 METERS ARE CAPABLE OF FLOODING AND
DAMAGING STRUCTURES AND INFRASTRUCTURE IN LOW-LYING COASTAL
AREAS.
* PERSONS CAUGHT IN THE WATER OF A TSUNAMI MAY DROWN... BE
CRUSHED BY DEBRIS IN THE WATER... OR BE SWEPT OUT TO SEA.
* A TSUNAMI IS A SERIES OF WAVES. THE TIME BETWEEN WAVE CRESTS
CAN VARY FROM 5 MINUTES TO AN HOUR. THE HAZARD MAY PERSIST FOR
MANY HOURS OR LONGER AFTER THE INITIAL WAVE.
* IMPACTS CAN VARY SIGNIFICANTLY FROM ONE SECTION OF COAST TO
THE NEXT DUE TO LOCAL BATHYMETRY AND THE SHAPE AND ELEVATION
OF THE SHORELINE.
* IMPACTS CAN ALSO VARY DEPENDING UPON THE STATE OF THE TIDE AT
THE TIME OF THE MAXIMUM TSUNAMI WAVES.

IOC Technical Series, 105 Page 31
IOC
Technical S
eries, 105 P
age 31
PRELIMINARY EARTHQUAKE PARAMETERS
---------------------------------
* MAGNITUDE 8.7
* ORIGIN TIME 1112 UTC FEB 8 2013
* COORDINATES 33.7 SOUTH 72.3 WEST
* DEPTH 20 KM / 12 MILES
* LOCATION OFF THE COAST OF CENTRAL CHILE
NEXT UPDATE AND ADDITIONAL INFORMATION
--------------------------------------
* THE NEXT MESSAGE WILL BE ISSUED IN ONE HOUR... OR SOONER IF
THE SITUATION WARRANTS.
* COASTAL REGIONS OF HAWAII SHOULD REFER TO PACIFIC TSUNAMI
WARNING CENTER MESSAGES FOR HAWAII THAT CAN BE FOUND AT
PTWC.WEATHER.GOV.
* COASTAL REGIONS OF CALIFORNIA... OREGON... WASHINGTON...
BRITISH COLUMBIA AND ALASKA SHOULD REFER TO WEST COAST AND
ALASKA TSUNAMI WARNING CENTER MESSAGES THAT CAN BE FOUND AT
WCATWC.ARH.NOAA.GOV.
* AUTHORITATIVE INFORMATION ABOUT THE EARTHQUAKE FROM THE U.S.
GEOLOGICAL SURVEY CAN BE FOUND ON THE INTERNET AT
EARTHQUAKE.USGS.GOV/EARTHQUAKES/MAP.
* FURTHER INFORMATION ABOUT THIS EVENT MAY BE FOUND AT
PTWC.WEATHER.GOV AND AT WWW.TSUNAMI.GOV.
$$

IOC
Technical S
eries, 105 P
age 32
ii. Forecast Polygons Map

IOC
Technical S
eries, 105 P
age 33
iii. Forecast Polygons Table PTWC RIFT Tsunami Forecast Model - Run ID: 2013020812482
Earthquake - Origin: 02/08/2013 11:12:13 UTC Coordinates: 33.7S 72.3W Depth: 020km Magnitude: 8.7
Coastal Forecast (meters) Offshore Forecast (meters) Total
Maximum Mean Median STD Maximum Mean Median STD Points Region Name
10.87 2.78 1.08 3.21 5.80 1.17 0.63 1.19 160 South Central Chile
10.14 3.82 2.08 3.18 6.83 1.50 0.80 1.47 120 North Central Chile
1.37 1.12 1.13 0.10 0.47 0.33 0.31 0.07 73 Southern Peru
1.22 0.89 0.84 0.16 0.65 0.39 0.38 0.09 71 Central Peru
1.19 0.91 0.87 0.12 0.53 0.25 0.21 0.09 119 Northern Chile
0.64 0.37 0.41 0.14 0.33 0.14 0.13 0.06 299 Southern Chile

IOC Technical Series, 105 Page 34
iv. Energy Forecast Map

IOC Technical Series, 105 Page 35
IOC
Technical S
eries, 105 P
age 35
v. Coastal Forecast Map

IOC Technical Series, 105 Page 36
IOC
Technical S
eries, 105 P
age 36
b. Supplemental Products (updated forecast and observations)
i. Text Product
ZCZC
WEPA40 PHEB 081340
TSUPAC
TSUNAMI MESSAGE NUMBER 4
NWS PACIFIC TSUNAMI WARNING CENTER EWA BEACH HI
1340 UCT FRI FEB 8 2013
...TSUNAMI THREAT MESSAGE...
THIS MESSAGE IS FOR ALL COASTAL AREAS OF THE PACIFIC AND ITS
ADJACENT SEAS EXCEPT THOSE OF U.S. STATES AND BRITISH COLUMBIA.
IT IS ISSUED AS ADVICE IN SUPPORT OF THE UNESCO/IOC PACIFIC
TSUNAMI WARNING SYSTEM.
TSUNAMI THREAT FORECAST...UPDATED
---------------------------------
* TSUNAMI WAVES REACHING MORE THAN 3 METERS ABOVE THE NORMAL TIDE
ARE FORECAST FOR COASTS IN
CHILE... AND FRENCH POLYNESIA.
* TSUNAMI WAVES REACHING 1 TO 3 METERS ABOVE THE NORMAL TIDE
ARE FORECAST FOR COASTS IN
MEXICO... ECUADOR... PERU... ANTARCTICA... JAPAN...
PHILIPPINES... NEW ZEALAND... MARSHALL ISLANDS... FIJI...
SAMOA... COOK ISLANDS... VANUATU... KIRIBATI... MIDWAY ISLAND...
JARVIS ISLAND... PALMYRA ISLAND... TONGA... PITCAIRN... SOLOMON
ISLANDS... PAPUA NEW GUINEA... AND RUSSIA.
* TSUNAMI WAVES REACHING 0.3 TO 1 METERS ABOVE THE NORMAL TIDE
ARE FORECAST FOR COASTS IN
EL SALVADOR... GUATEMALA... COSTA RICA... NICARAGUA...
PANAMA... COLOMBIA... AUSTRALIA... NEW CALEDONIA... TAIWAN...
CHINA... MINAMITORISHIMA... NORTHERN MARIANAS... GUAM...
YAP... AMERICAN SAMOA... TOKELAU... NAURU... WAKE ISLAND...
HOWLAND AND BAKER... TUVALU... WALLIS AND FUTUNA... NIUE...
AND INDONESIA.
EVALUATION
----------
* AN EARTHQUAKE WITH A PRELIMINARY MAGNITUDE OF 8.9 OCCURRED
OFF THE COAST OF CENTRAL CHILE AT 1112 UTC ON FRIDAY FEBRUARY
8 2013.
* TSUNAMI WAVES HAVE BEEN OBSERVED.
* BASED ON ALL AVAILABLE DATA... HAZARDOUS TSUNAMI WAVES ARE
FORECAST FOR SOME COASTS.
RECOMMENDED ACTIONS
-------------------
* GOVERNMENT AGENCIES RESPONSIBLE FOR THREATENED COASTAL AREAS
SHOULD TAKE ACTION TO INFORM AND INSTRUCT ANY COASTAL
POPULATIONS AT RISK IN ACCORDANCE WITH THEIR OWN EVALUATION...
PROCEDURES AND THE LEVEL OF THREAT.
* PERSONS LOCATED IN THREATENED COASTAL AREAS SHOULD STAY ALERT
FOR INFORMATION AND FOLLOW INSTRUCTIONS FROM LOCAL
AUTHORITIES.
ESTIMATED TIMES OF ARRIVAL
--------------------------

IOC Technical Series, 105 Page 37
IOC
Technical S
eries, 105 P
age 37
* ESTIMATED TIMES OF ARRIVAL -ETA- OF THE INITIAL TSUNAMI WAVE
ARE GIVEN BELOW. ACTUAL ARRIVAL TIMES MAY DIFFER AND THE
INITIAL WAVE MAY NOT BE THE LARGEST. A TSUNAMI IS A SERIES OF
WAVES AND THE TIME BETWEEN WAVES CAN BE FIVE MINUTES TO ONE
HOUR.
LOCATION REGION COORDINATES ETA(UTC)
------------------------------------------------------------
IQUIQUE CHILE 20.2S 70.1W 1307 02/08
ARICA CHILE 18.5S 70.3W 1319 02/08
MOLLENDO PERU 17.1S 72.0W 1326 02/08
SAN JUAN PERU 15.3S 75.2W 1344 02/08
GOLFO DE PENAS CHILE 47.1S 74.9W 1348 02/08
LA PUNTA PERU 12.1S 77.2W 1436 02/08
TALARA PERU 4.6S 81.5W 1523 02/08
CHIMBOTE PERU 9.0S 78.8W 1530 02/08
PUERTO MONTT CHILE 41.5S 73.0W 1531 02/08
LA LIBERTAD ECUADOR 2.2S 81.2W 1544 02/08
PIMENTAL PERU 6.9S 80.0W 1555 02/08
EASTER ISLAND CHILE 27.1S 109.4W 1629 02/08
ESMERELDAS ECUADOR 1.2N 79.8W 1632 02/08
TUMACO COLOMBIA 1.8N 78.9W 1651 02/08
BAHIA SOLANO COLOMBIA 6.3N 77.4W 1722 02/08
PUERTO PINA PANAMA 7.4N 78.0W 1732 02/08
PUNTA MALA PANAMA 7.5N 80.0W 1734 02/08
BALTRA ISLAND ECUADOR 0.5S 90.3W 1734 02/08
BUENAVENTURA COLOMBIA 3.8N 77.2W 1738 02/08
THURSTON ISLAND ANTARCTICA 72.0S 100.0W 1744 02/08
CABO MATAPALO COSTA RICA 8.4N 83.3W 1746 02/08
PUNTA BURICA PANAMA 8.0N 82.9W 1746 02/08
PUERTO QUEPOS COSTA RICA 9.4N 84.2W 1819 02/08
CABO SAN ELENA COSTA RICA 10.9N 86.0W 1836 02/08
SAN JUAN DL SUR NICARAGUA 11.2N 85.9W 1902 02/08
PUERTO SANDINO NICARAGUA 12.2N 86.8W 1914 02/08
CORINTO NICARAGUA 12.5N 87.2W 1914 02/08
PITCAIRN ISLAND PITCAIRN 25.1S 130.1W 1927 02/08
ACAJUTLA EL SALVADOR 13.6N 89.8W 1933 02/08
SIPICATE GUATEMALA 13.9N 91.2W 1947 02/08
BALBOA HEIGHTS PANAMA 9.0N 79.6W 1950 02/08
PUERTO MADERO MEXICO 14.8N 92.5W 1954 02/08
AMAPALA HONDURAS 13.2N 87.6W 2000 02/08
RIKITEA FRENCH POLYNESIA 23.1S 135.0W 2015 02/08
ACAPULCO MEXICO 16.9N 99.9W 2016 02/08
SALINA CRUZ MEXICO 16.5N 95.2W 2018 02/08
LAZARO CARDENAS MEXICO 17.9N 102.2W 2040 02/08
MANZANILLO MEXICO 19.1N 104.3W 2101 02/08
PUERTO VALLARTA MEXICO 20.6N 105.3W 2124 02/08
CAPE ADARE ANTARCTICA 71.0S 170.0E 2130 02/08
HIVA OA FRENCH POLYNESIA 10.0S 139.0W 2142 02/08
CABO SAN LUCAS MEXICO 22.8N 110.0W 2154 02/08
MAZATLAN MEXICO 23.2N 106.4W 2155 02/08
SAN BLAS MEXICO 21.5N 105.3W 2158 02/08
PAPEETE FRENCH POLYNESIA 17.5S 149.6W 2220 02/08
RAROTONGA COOK ISLANDS 21.2S 159.8W 2250 02/08
GUAYMAS MEXICO 27.9N 110.9W 2256 02/08
PUNTA ABREOJOS MEXICO 26.7N 113.6W 2307 02/08
FLINT ISLAND KIRIBATI 11.4S 151.8W 2308 02/08
NIUE ISLAND NIUE 19.0S 170.0W 2355 02/08
PENRYN ISLAND COOK ISLANDS 8.9S 157.8W 2356 02/08
ENSENADA MEXICO 31.8N 116.8W 2357 02/08
MALDEN ISLAND KIRIBATI 3.9S 154.9W 2358 02/08
GISBORNE NEW ZEALAND 38.7S 178.0E 0018 02/09
NUKUALOFA TONGA 21.0S 175.2W 0022 02/09
EAST CAPE NEW ZEALAND 37.7S 178.5E 0024 02/09
DUNEDIN NEW ZEALAND 45.9S 170.5E 0025 02/09
WELLINGTON NEW ZEALAND 41.3S 174.8E 0028 02/09
PUKAPUKA ISLAND COOK ISLANDS 10.8S 165.9W 0028 02/09
PAGO PAGO AMERICAN SAMOA 14.3S 170.7W 0032 02/09
APIA SAMOA 13.8S 171.8W 0046 02/09
NORTH CAPE NEW ZEALAND 34.4S 173.3E 0050 02/09
JARVIS ISLAND JARVIS ISLAND 0.4S 160.1W 0050 02/09
CHRISTMAS ISLAN KIRIBATI 2.0N 157.5W 0053 02/09
MILFORD SOUND NEW ZEALAND 44.6S 167.9E 0059 02/09
NAPIER NEW ZEALAND 39.5S 176.9E 0100 02/09
WALLIS ISLAND WALLIS AND FUTUN 13.3S 176.3W 0105 02/09
NUKUNONU ISLAND TOKELAU 9.2S 171.8W 0109 02/09
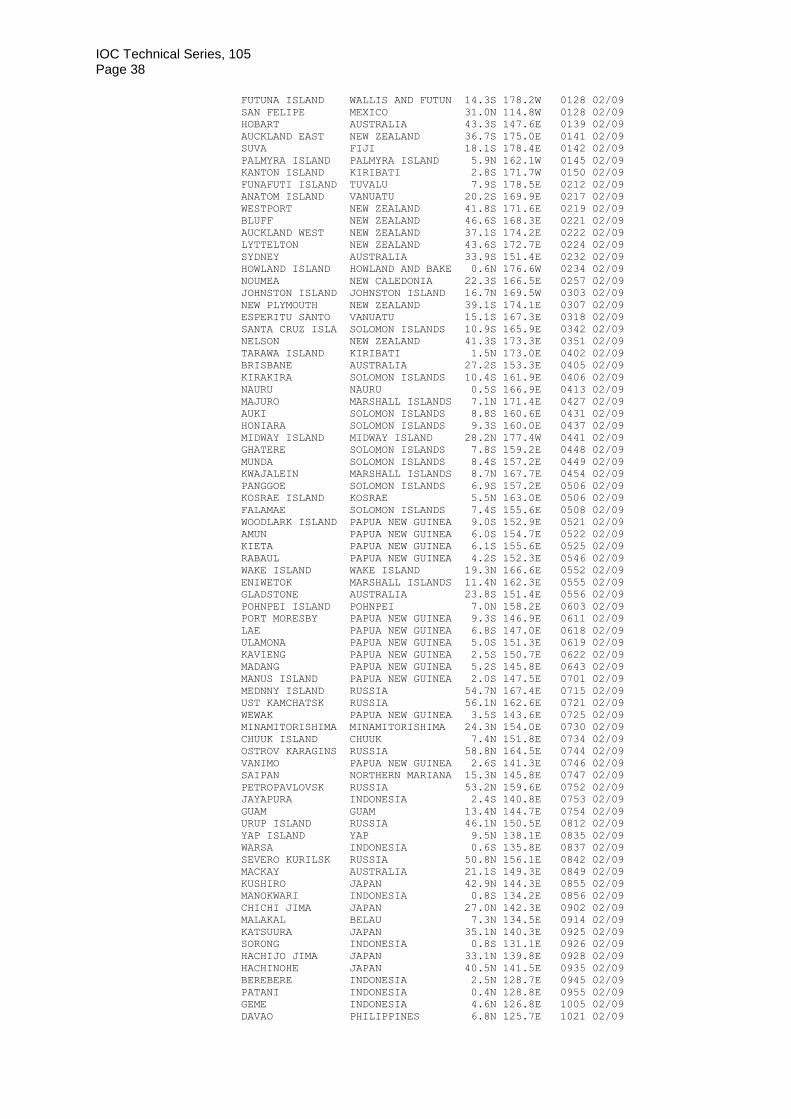
IOC Technical Series, 105 Page 38
IOC
Technical S
eries, 105 P
age 38
FUTUNA ISLAND WALLIS AND FUTUN 14.3S 178.2W 0128 02/09
SAN FELIPE MEXICO 31.0N 114.8W 0128 02/09
HOBART AUSTRALIA 43.3S 147.6E 0139 02/09
AUCKLAND EAST NEW ZEALAND 36.7S 175.0E 0141 02/09
SUVA FIJI 18.1S 178.4E 0142 02/09
PALMYRA ISLAND PALMYRA ISLAND 5.9N 162.1W 0145 02/09
KANTON ISLAND KIRIBATI 2.8S 171.7W 0150 02/09
FUNAFUTI ISLAND TUVALU 7.9S 178.5E 0212 02/09
ANATOM ISLAND VANUATU 20.2S 169.9E 0217 02/09
WESTPORT NEW ZEALAND 41.8S 171.6E 0219 02/09
BLUFF NEW ZEALAND 46.6S 168.3E 0221 02/09
AUCKLAND WEST NEW ZEALAND 37.1S 174.2E 0222 02/09
LYTTELTON NEW ZEALAND 43.6S 172.7E 0224 02/09
SYDNEY AUSTRALIA 33.9S 151.4E 0232 02/09
HOWLAND ISLAND HOWLAND AND BAKE 0.6N 176.6W 0234 02/09
NOUMEA NEW CALEDONIA 22.3S 166.5E 0257 02/09
JOHNSTON ISLAND JOHNSTON ISLAND 16.7N 169.5W 0303 02/09
NEW PLYMOUTH NEW ZEALAND 39.1S 174.1E 0307 02/09
ESPERITU SANTO VANUATU 15.1S 167.3E 0318 02/09
SANTA CRUZ ISLA SOLOMON ISLANDS 10.9S 165.9E 0342 02/09
NELSON NEW ZEALAND 41.3S 173.3E 0351 02/09
TARAWA ISLAND KIRIBATI 1.5N 173.0E 0402 02/09
BRISBANE AUSTRALIA 27.2S 153.3E 0405 02/09
KIRAKIRA SOLOMON ISLANDS 10.4S 161.9E 0406 02/09
NAURU NAURU 0.5S 166.9E 0413 02/09
MAJURO MARSHALL ISLANDS 7.1N 171.4E 0427 02/09
AUKI SOLOMON ISLANDS 8.8S 160.6E 0431 02/09
HONIARA SOLOMON ISLANDS 9.3S 160.0E 0437 02/09
MIDWAY ISLAND MIDWAY ISLAND 28.2N 177.4W 0441 02/09
GHATERE SOLOMON ISLANDS 7.8S 159.2E 0448 02/09
MUNDA SOLOMON ISLANDS 8.4S 157.2E 0449 02/09
KWAJALEIN MARSHALL ISLANDS 8.7N 167.7E 0454 02/09
PANGGOE SOLOMON ISLANDS 6.9S 157.2E 0506 02/09
KOSRAE ISLAND KOSRAE 5.5N 163.0E 0506 02/09
FALAMAE SOLOMON ISLANDS 7.4S 155.6E 0508 02/09
WOODLARK ISLAND PAPUA NEW GUINEA 9.0S 152.9E 0521 02/09
AMUN PAPUA NEW GUINEA 6.0S 154.7E 0522 02/09
KIETA PAPUA NEW GUINEA 6.1S 155.6E 0525 02/09
RABAUL PAPUA NEW GUINEA 4.2S 152.3E 0546 02/09
WAKE ISLAND WAKE ISLAND 19.3N 166.6E 0552 02/09
ENIWETOK MARSHALL ISLANDS 11.4N 162.3E 0555 02/09
GLADSTONE AUSTRALIA 23.8S 151.4E 0556 02/09
POHNPEI ISLAND POHNPEI 7.0N 158.2E 0603 02/09
PORT MORESBY PAPUA NEW GUINEA 9.3S 146.9E 0611 02/09
LAE PAPUA NEW GUINEA 6.8S 147.0E 0618 02/09
ULAMONA PAPUA NEW GUINEA 5.0S 151.3E 0619 02/09
KAVIENG PAPUA NEW GUINEA 2.5S 150.7E 0622 02/09
MADANG PAPUA NEW GUINEA 5.2S 145.8E 0643 02/09
MANUS ISLAND PAPUA NEW GUINEA 2.0S 147.5E 0701 02/09
MEDNNY ISLAND RUSSIA 54.7N 167.4E 0715 02/09
UST KAMCHATSK RUSSIA 56.1N 162.6E 0721 02/09
WEWAK PAPUA NEW GUINEA 3.5S 143.6E 0725 02/09
MINAMITORISHIMA MINAMITORISHIMA 24.3N 154.0E 0730 02/09
CHUUK ISLAND CHUUK 7.4N 151.8E 0734 02/09
OSTROV KARAGINS RUSSIA 58.8N 164.5E 0744 02/09
VANIMO PAPUA NEW GUINEA 2.6S 141.3E 0746 02/09
SAIPAN NORTHERN MARIANA 15.3N 145.8E 0747 02/09
PETROPAVLOVSK RUSSIA 53.2N 159.6E 0752 02/09
JAYAPURA INDONESIA 2.4S 140.8E 0753 02/09
GUAM GUAM 13.4N 144.7E 0754 02/09
URUP ISLAND RUSSIA 46.1N 150.5E 0812 02/09
YAP ISLAND YAP 9.5N 138.1E 0835 02/09
WARSA INDONESIA 0.6S 135.8E 0837 02/09
SEVERO KURILSK RUSSIA 50.8N 156.1E 0842 02/09
MACKAY AUSTRALIA 21.1S 149.3E 0849 02/09
KUSHIRO JAPAN 42.9N 144.3E 0855 02/09
MANOKWARI INDONESIA 0.8S 134.2E 0856 02/09
CHICHI JIMA JAPAN 27.0N 142.3E 0902 02/09
MALAKAL BELAU 7.3N 134.5E 0914 02/09
KATSUURA JAPAN 35.1N 140.3E 0925 02/09
SORONG INDONESIA 0.8S 131.1E 0926 02/09
HACHIJO JIMA JAPAN 33.1N 139.8E 0928 02/09
HACHINOHE JAPAN 40.5N 141.5E 0935 02/09
BEREBERE INDONESIA 2.5N 128.7E 0945 02/09
PATANI INDONESIA 0.4N 128.8E 0955 02/09
GEME INDONESIA 4.6N 126.8E 1005 02/09
DAVAO PHILIPPINES 6.8N 125.7E 1021 02/09
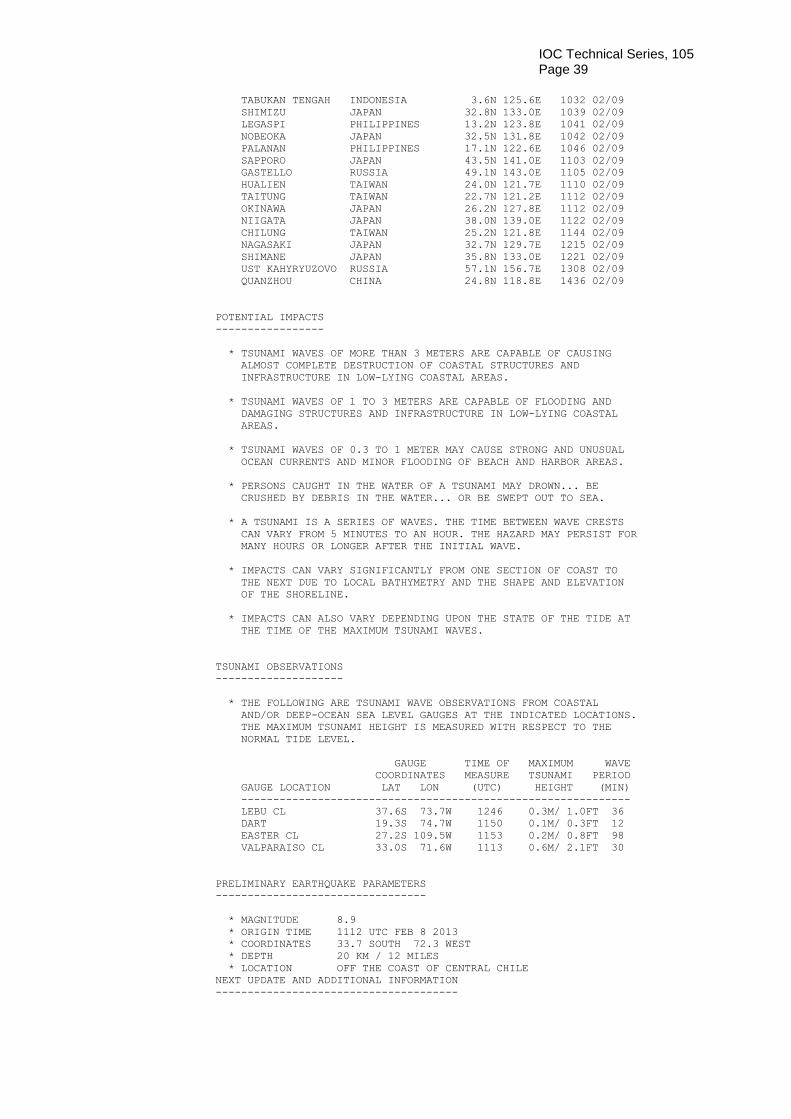
IOC Technical Series, 105 Page 39
IOC
Technical S
eries, 105 P
age 39
TABUKAN TENGAH INDONESIA 3.6N 125.6E 1032 02/09
SHIMIZU JAPAN 32.8N 133.0E 1039 02/09
LEGASPI PHILIPPINES 13.2N 123.8E 1041 02/09
NOBEOKA JAPAN 32.5N 131.8E 1042 02/09
PALANAN PHILIPPINES 17.1N 122.6E 1046 02/09
SAPPORO JAPAN 43.5N 141.0E 1103 02/09
GASTELLO RUSSIA 49.1N 143.0E 1105 02/09
HUALIEN TAIWAN 24.0N 121.7E 1110 02/09
TAITUNG TAIWAN 22.7N 121.2E 1112 02/09
OKINAWA JAPAN 26.2N 127.8E 1112 02/09
NIIGATA JAPAN 38.0N 139.0E 1122 02/09
CHILUNG TAIWAN 25.2N 121.8E 1144 02/09
NAGASAKI JAPAN 32.7N 129.7E 1215 02/09
SHIMANE JAPAN 35.8N 133.0E 1221 02/09
UST KAHYRYUZOVO RUSSIA 57.1N 156.7E 1308 02/09
QUANZHOU CHINA 24.8N 118.8E 1436 02/09
POTENTIAL IMPACTS
-----------------
* TSUNAMI WAVES OF MORE THAN 3 METERS ARE CAPABLE OF CAUSING
ALMOST COMPLETE DESTRUCTION OF COASTAL STRUCTURES AND
INFRASTRUCTURE IN LOW-LYING COASTAL AREAS.
* TSUNAMI WAVES OF 1 TO 3 METERS ARE CAPABLE OF FLOODING AND
DAMAGING STRUCTURES AND INFRASTRUCTURE IN LOW-LYING COASTAL
AREAS.
* TSUNAMI WAVES OF 0.3 TO 1 METER MAY CAUSE STRONG AND UNUSUAL
OCEAN CURRENTS AND MINOR FLOODING OF BEACH AND HARBOR AREAS.
* PERSONS CAUGHT IN THE WATER OF A TSUNAMI MAY DROWN... BE
CRUSHED BY DEBRIS IN THE WATER... OR BE SWEPT OUT TO SEA.
* A TSUNAMI IS A SERIES OF WAVES. THE TIME BETWEEN WAVE CRESTS
CAN VARY FROM 5 MINUTES TO AN HOUR. THE HAZARD MAY PERSIST FOR
MANY HOURS OR LONGER AFTER THE INITIAL WAVE.
* IMPACTS CAN VARY SIGNIFICANTLY FROM ONE SECTION OF COAST TO
THE NEXT DUE TO LOCAL BATHYMETRY AND THE SHAPE AND ELEVATION
OF THE SHORELINE.
* IMPACTS CAN ALSO VARY DEPENDING UPON THE STATE OF THE TIDE AT
THE TIME OF THE MAXIMUM TSUNAMI WAVES.
TSUNAMI OBSERVATIONS
--------------------
* THE FOLLOWING ARE TSUNAMI WAVE OBSERVATIONS FROM COASTAL
AND/OR DEEP-OCEAN SEA LEVEL GAUGES AT THE INDICATED LOCATIONS.
THE MAXIMUM TSUNAMI HEIGHT IS MEASURED WITH RESPECT TO THE
NORMAL TIDE LEVEL.
GAUGE TIME OF MAXIMUM WAVE
COORDINATES MEASURE TSUNAMI PERIOD
GAUGE LOCATION LAT LON (UTC) HEIGHT (MIN)
-------------------------------------------------------------
LEBU CL 37.6S 73.7W 1246 0.3M/ 1.0FT 36
DART 19.3S 74.7W 1150 0.1M/ 0.3FT 12
EASTER CL 27.2S 109.5W 1153 0.2M/ 0.8FT 98
VALPARAISO CL 33.0S 71.6W 1113 0.6M/ 2.1FT 30
PRELIMINARY EARTHQUAKE PARAMETERS
---------------------------------
* MAGNITUDE 8.9
* ORIGIN TIME 1112 UTC FEB 8 2013
* COORDINATES 33.7 SOUTH 72.3 WEST
* DEPTH 20 KM / 12 MILES
* LOCATION OFF THE COAST OF CENTRAL CHILE
NEXT UPDATE AND ADDITIONAL INFORMATION
--------------------------------------

IOC Technical Series, 105 Page 40
IOC
Technical S
eries, 105 P
age 40
* THE NEXT MESSAGE WILL BE ISSUED IN ONE HOUR... OR SOONER IF
THE SITUATION WARRANTS.
* COASTAL REGIONS OF HAWAII SHOULD REFER TO PACIFIC TSUNAMI
WARNING CENTER MESSAGES FOR HAWAII THAT CAN BE FOUND AT
PTWC.WEATHER.GOV.
* COASTAL REGIONS OF CALIFORNIA... OREGON... WASHINGTON...
BRITISH COLUMBIA AND ALASKA SHOULD REFER TO WEST COAST AND
ALASKA TSUNAMI WARNING CENTER MESSAGES THAT CAN BE FOUND AT
WCATWC.ARH.NOAA.GOV.
* AUTHORITATIVE INFORMATION ABOUT THE EARTHQUAKE FROM THE U.S.
GEOLOGICAL SURVEY CAN BE FOUND ON THE INTERNET AT
EARTHQUAKE.USGS.GOV/EARTHQUAKES/MAP.
* FURTHER INFORMATION ABOUT THIS EVENT MAY BE FOUND AT
PTWC.WEATHER.GOV AND AT WWW.TSUNAMI.GOV.
$$

IOC
Technical S
eries, 105 P
age 41
ii. Forecast Polygons Map

IO
C T
echnical Series, 105
Page 42
iii. Forecast Polygons Table
PTWC RIFT Tsunami Forecast Model - Run ID: 2013020812511
Earthquake - Origin: 02/08/2013 11:12:13 UTC Coordinates: 33.7S 72.3W Depth: 020km Magnitude: 8.9
Coastal Forecast (meters) Offshore Forecast (meters) Total
Maximum Mean Median STD Maximum Mean Median STD Points Region Name
14.48 6.05 3.29 4.53 6.60 2.12 1.40 1.69 120 North Central Chile
13.81 4.39 1.78 4.52 7.65 1.83 1.21 1.41 160 South Central Chile
6.28 3.66 3.44 1.24 2.47 0.89 0.72 0.57 27 Marquesas Islands
2.47 2.47 2.47 0.00 0.41 0.41 0.41 0.00 1 Palmyra Island
2.23 1.18 1.08 0.35 0.98 0.36 0.31 0.15 145 Hawaii
2.20 1.75 1.77 0.43 1.09 0.82 0.86 0.24 4 Tuamotu Archipelago
2.09 1.39 1.37 0.23 1.01 0.71 0.71 0.14 101 Central Peru
1.95 1.69 1.65 0.09 1.00 0.53 0.51 0.12 73 Southern Peru
1.92 1.37 1.20 0.39 0.40 0.25 0.18 0.10 3 Line Islands
1.89 1.89 1.89 0.00 0.42 0.42 0.42 0.00 1 Easter Island
1.74 1.41 1.40 0.15 1.17 0.45 0.38 0.18 119 Northern Chile
1.71 1.41 1.44 0.16 0.64 0.32 0.28 0.12 36 Society Islands
1.62 1.10 0.85 0.37 0.24 0.17 0.14 0.05 3 Cook Islands
1.58 1.05 1.01 0.21 1.56 0.62 0.60 0.25 149 Pacific Coast of Kamchatka
1.56 0.91 0.86 0.18 1.72 0.46 0.41 0.22 398 East Coast of Japanese Main Islands
1.49 1.49 1.49 0.00 0.46 0.46 0.46 0.00 1 Pitcairn Island
1.48 1.01 0.93 0.19 0.86 0.53 0.56 0.19 15 Tonga
1.32 1.01 0.98 0.14 1.12 0.47 0.47 0.16 87 East Side of North Island New Zealand
1.32 0.80 0.82 0.20 0.85 0.43 0.41 0.14 328 Southern Chile
1.30 1.02 1.00 0.16 1.09 0.36 0.28 0.20 41 Samoa
1.30 0.85 0.83 0.17 1.09 0.38 0.36 0.18 154 Fiji
1.29 0.55 0.46 0.28 0.67 0.21 0.16 0.14 98 Urup Etorofu Kunashiri Shikotan and Habomai
Islands
1.28 0.83 0.82 0.24 0.64 0.23 0.21 0.09 202 Vanuatu
1.25 0.63 0.56 0.26 1.03 0.27 0.22 0.19 100 Kuril Islands
1.24 0.95 0.93 0.12 0.77 0.29 0.27 0.11 89 Galapagos Islands
1.22 1.22 1.22 0.00 0.69 0.69 0.69 0.00 1 Gilbert Islands
1.15 0.83 0.82 0.15 1.32 0.62 0.60 0.28 101 Northern Peru
1.12 0.94 0.94 0.08 0.80 0.48 0.47 0.10 75 Pacific Side of Baja Mexico
1.11 0.93 0.91 0.10 1.27 0.55 0.54 0.16 110 Pacific Side of Baja Sud Mexico
1.11 0.83 0.81 0.14 1.09 0.49 0.46 0.16 155 East Side of South Island New Zealand
1.08 0.62 0.60 0.16 0.43 0.17 0.16 0.08 103 Gulf Side of Baja Sud Mexico

IOC
Technical S
eries, 105 P
age 43
1.07 0.78 0.75 0.17 1.16 0.33 0. 30 0.17 79 Nansei Islands
1.06 1.01 1.06 0.07 0.55 0.55 0.55 0.00 3 Midway Island
1.06 0.81 0.79 0.09 0.62 0.34 0.33 0.09 56 Guerrero Mexico
1.06 0.66 0.66 0.19 2.13 0.26 0.24 0.18 350 Pacific Side of the Philippines
1.05 1.05 1.05 0.00 0.17 0.17 0.17 0.00 1 Jarvis Island
1.03 0.80 0.80 0.12 1.15 0.38 0.31 0.27 14 Marshall Islands
1.03 0.79 0.78 0.11 0.65 0.27 0.23 0.12 19 Santa Cruz Islands
1.03 0.71 0.72 0.13 1.12 0.19 0.17 0.10 2438 Pacific Side of Antarctica
1.02 0.77 0.76 0.08 0.80 0.48 0.47 0.10 113 North Side of North Island New Zealand
1.02 0.69 0.64 0.15 0.60 0.20 0.16 0.11 132 New Ireland
0.99 0.83 0.80 0.10 0.49 0.28 0.28 0.07 27 Michoacan Mexico
0.99 0.46 0.48 0.08 0.67 0.26 0.25 0.09 316 Bering Sea Coast of Eastern Russia
0.98 0.88 0.87 0.07 0.85 0.34 0.31 0.14 32 Jalisco Mexico
0.98 0.80 0.74 0.10 0.32 0.29 0.31 0.03 5 Wallis and Futuna
0.97 0.78 0.76 0.06 0.83 0.38 0.36 0.14 72 Oaxaca Mexico
0.97 0.56 0.48 0.20 1.03 0.21 0.17 0.14 329 Choisel to Philip Solomon Islands
0.96 0.96 0.96 0.00 0.28 0.28 0.28 0.00 2 American Samoa
0.96 0.63 0.69 0.24 1.12 0.31 0.27 0.17 73 Bouganville Papua New Guinea
0.96 0.47 0.39 0.24 0.53 0.17 0.14 0.11 194 Halmahera Indonesia
0.94 0.80 0.76 0.08 0.42 0.18 0.16 0.06 52 Eastern Coast of Taiwan
0.94 0.75 0.75 0.07 0.69 0.41 0.49 0.18 27 Nayarit Mexico
0.93 0.74 0.75 0.10 0.72 0.45 0.47 0.14 72 Sinaloa Mexico
0.91 0.91 0.91 0.00 0.27 0.27 0.27 0.00 1 Tokelau
0.91 0.85 0.90 0.07 0.69 0.38 0.35 0.12 12 Colima Mexico
0.91 0.76 0.76 0.07 0.83 0.50 0.48 0.09 28 Chiapas Mexico
0.89 0.89 0.89 0.00 0.14 0.14 0.14 0.00 1 Minamitorishima
0.89 0.73 0.71 0.06 0.53 0.37 0.37 0.06 32 Pacific Coast of Guatemala
0.89 0.69 0.67 0.09 0.66 0.42 0.45 0.15 22 Manus Island Papua New Guinea
0.89 0.49 0.50 0.11 0.55 0.24 0.25 0.11 128 West Side of South Island New Zealand
0.89 0.48 0.66 0.29 0.53 0.23 0.26 0.16 149 Ecuador
0.89 0.16 0.05 0.24 0.76 0.07 0.03 0.09 445 West Coast of Japanese Main Islands
0.88 0.88 0.88 0.00 0.31 0.31 0.31 0.00 1 Johnston Atoll
0.88 0.79 0.78 0.07 0.69 0.33 0.32 0.10 77 Pacific Coast of Costa Rica
0.86 0.86 0.86 0.00 0.16 0.15 0.16 0.01 3 Wake Island
0.86 0.86 0.86 0.00 0.12 0.12 0.12 0.00 1 Niue
0.86 0.78 0.77 0.06 0.67 0.41 0.41 0.07 37 El Salvador
0.86 0.61 0.60 0.10 0.58 0.21 0.17 0.10 147 Bismarck Sea Side of Papua New Guinea
0.81 0.70 0.71 0.06 1.38 0.47 0.44 0.29 15 Chuuk State Micronesia
0.81 0.69 0.68 0.08 0.44 0.25 0.24 0.09 10 Pohnpei State Micronesia
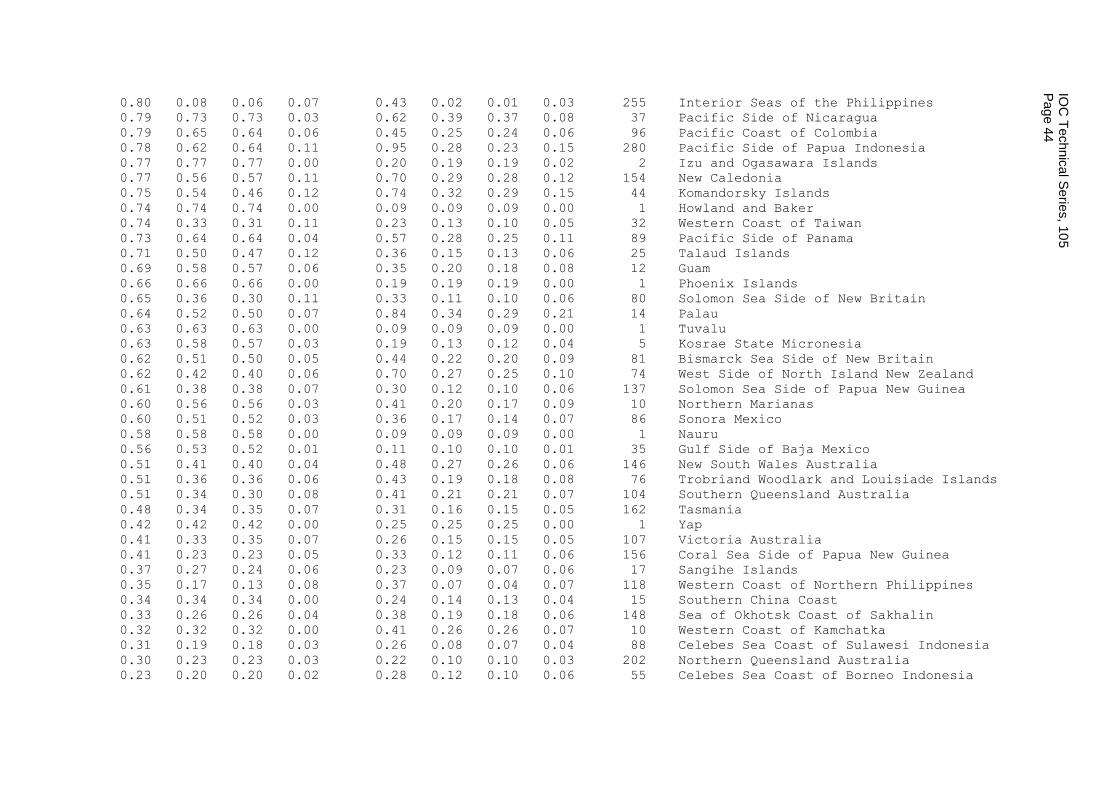
IO
C T
echnical Series, 105
Page 44
0.80 0.08 0.06 0.07 0.43 0.02 0.01 0.03 255 Interior Seas of the Philippines
0.79 0.73 0.73 0.03 0.62 0.39 0.37 0.08 37 Pacific Side of Nicaragua
0.79 0.65 0.64 0.06 0.45 0.25 0.24 0.06 96 Pacific Coast of Colombia
0.78 0.62 0.64 0.11 0.95 0.28 0.23 0.15 280 Pacific Side of Papua Indonesia
0.77 0.77 0.77 0.00 0.20 0.19 0.19 0.02 2 Izu and Ogasawara Islands
0.77 0.56 0.57 0.11 0.70 0.29 0.28 0.12 154 New Caledonia
0.75 0.54 0.46 0.12 0.74 0.32 0.29 0.15 44 Komandorsky Islands
0.74 0.74 0.74 0.00 0.09 0.09 0.09 0.00 1 Howland and Baker
0.74 0.33 0.31 0.11 0.23 0.13 0.10 0.05 32 Western Coast of Taiwan
0.73 0.64 0.64 0.04 0.57 0.28 0.25 0.11 89 Pacific Side of Panama
0.71 0.50 0.47 0.12 0.36 0.15 0.13 0.06 25 Talaud Islands
0.69 0.58 0.57 0.06 0.35 0.20 0.18 0.08 12 Guam
0.66 0.66 0.66 0.00 0.19 0.19 0.19 0.00 1 Phoenix Islands
0.65 0.36 0.30 0.11 0.33 0.11 0.10 0.06 80 Solomon Sea Side of New Britain
0.64 0.52 0.50 0.07 0.84 0.34 0.29 0.21 14 Palau
0.63 0.63 0.63 0.00 0.09 0.09 0.09 0.00 1 Tuvalu
0.63 0.58 0.57 0.03 0.19 0.13 0.12 0.04 5 Kosrae State Micronesia
0.62 0.51 0.50 0.05 0.44 0.22 0.20 0.09 81 Bismarck Sea Side of New Britain
0.62 0.42 0.40 0.06 0.70 0.27 0.25 0.10 74 West Side of North Island New Zealand
0.61 0.38 0.38 0.07 0.30 0.12 0.10 0.06 137 Solomon Sea Side of Papua New Guinea
0.60 0.56 0.56 0.03 0.41 0.20 0.17 0.09 10 Northern Marianas
0.60 0.51 0.52 0.03 0.36 0.17 0.14 0.07 86 Sonora Mexico
0.58 0.58 0.58 0.00 0.09 0.09 0.09 0.00 1 Nauru
0.56 0.53 0.52 0.01 0.11 0.10 0.10 0.01 35 Gulf Side of Baja Mexico
0.51 0.41 0.40 0.04 0.48 0.27 0.26 0.06 146 New South Wales Australia
0.51 0.36 0.36 0.06 0.43 0.19 0.18 0.08 76 Trobriand Woodlark and Louisiade Islands
0.51 0.34 0.30 0.08 0.41 0.21 0.21 0.07 104 Southern Queensland Australia
0.48 0.34 0.35 0.07 0.31 0.16 0.15 0.05 162 Tasmania
0.42 0.42 0.42 0.00 0.25 0.25 0.25 0.00 1 Yap
0.41 0.33 0.35 0.07 0.26 0.15 0.15 0.05 107 Victoria Australia
0.41 0.23 0.23 0.05 0.33 0.12 0.11 0.06 156 Coral Sea Side of Papua New Guinea
0.37 0.27 0.24 0.06 0.23 0.09 0.07 0.06 17 Sangihe Islands
0.35 0.17 0.13 0.08 0.37 0.07 0.04 0.07 118 Western Coast of Northern Philippines
0.34 0.34 0.34 0.00 0.24 0.14 0.13 0.04 15 Southern China Coast
0.33 0.26 0.26 0.04 0.38 0.19 0.18 0.06 148 Sea of Okhotsk Coast of Sakhalin
0.32 0.32 0.32 0.00 0.41 0.26 0.26 0.07 10 Western Coast of Kamchatka
0.31 0.19 0.18 0.03 0.26 0.08 0.07 0.04 88 Celebes Sea Coast of Sulawesi Indonesia
0.30 0.23 0.23 0.03 0.22 0.10 0.10 0.03 202 Northern Queensland Australia
0.23 0.20 0.20 0.02 0.28 0.12 0.10 0.06 55 Celebes Sea Coast of Borneo Indonesia

IOC
Technical S
eries, 105 P
age 45
0.23 0.20 0.19 0.02 0.17 0.07 0.06 0.03 35 Celebes Sea Coast of Sabah Malaysia
0.23 0.19 0.19 0.01 0.20 0.06 0.05 0.03 75 Celebes Sea Side of the Philippines
0.20 0.15 0.17 0.05 0.12 0.05 0.05 0.02 57 Sulu Archipelago Philippines
0.14 0.14 0.14 0.00 0.10 0.07 0.07 0.02 21 Northern Coast of Vietnam
0.14 0.09 0.09 0.02 0.12 0.05 0.05 0.02 84 Southern Coast of Vietnam
0.13 0.12 0.12 0.00 0.08 0.05 0.05 0.01 47 Hainan Island
0.13 0.08 0.08 0.03 0.09 0.04 0.04 0.02 144 Palawan Island Philippines
0.12 0.05 0.05 0.02 0.05 0.01 0.01 0.01 119 Sulu Sea Coast of the Philippines
0.10 0.09 0.09 0.00 0.04 0.04 0.04 0.00 21 Southwest Coast of Sabah Malaysia
0.09 0.09 0.09 0.01 0.06 0.05 0.05 0.00 15 Brunei
0.08 0.07 0.07 0.00 0.06 0.04 0.04 0.01 54 Northwest Coast of Sabah Malaysia
0.07 0.06 0.06 0.01 0.07 0.03 0.03 0.01 45 Tatarskiy Straight Coast of Sakhalin
0.07 0.06 0.05 0.01 0.08 0.04 0.03 0.01 46 Sulu Sea Coast of Sabah Malaysia
0.06 0.04 0.04 0.01 0.03 0.02 0.02 0.01 28 East Coast of Russia on the Tatarskiy
Straight
0.05 0.04 0.04 0.00 0.06 0.02 0.01 0.01 55 Eastern Coast of the Republic of Korea
0.05 0.04 0.04 0.00 0.05 0.01 0.01 0.01 88 Eastern Coast of DPR of Korea
0.04 0.03 0.03 0.00 0.04 0.01 0.01 0.01 151 East Coast of Russia North of Korean
Peninsula

IOC Technical Series, 105 Page 46
IOC
Technical S
eries, 105 P
age 46
iv. Energy Forecast Map

IOC Technical Series, 105 Page 47
IOC
Technical S
eries, 105 P
age 47
v. Coastal Forecast Map

IOC Technical Series, 105 Page 48
IOC
Technical S
eries, 105 P
age 48 c. Final Products (end of threat)
i. Text Product
ZCZC
WEPA40 PHEB 091228
TSUPAC
TSUNAMI MESSAGE NUMBER 18
NWS PACIFIC TSUNAMI WARNING CENTER EWA BEACH HI
1228 UCT SAT FEB 9 2013
...FINAL TSUNAMI THREAT MESSAGE...
THIS MESSAGE IS FOR ALL COASTAL AREAS OF THE PACIFIC AND ITS
ADJACENT SEAS EXCEPT THOSE OF U.S. STATES AND BRITISH COLUMBIA.
IT IS ISSUED AS ADVICE IN SUPPORT OF THE UNESCO/IOC PACIFIC
TSUNAMI WARNING SYSTEM.
TSUNAMI THREAT FORECAST
-----------------------
* THE TSUNAMI THREAT HAS NOW LARGELY PASSED.
EVALUATION
----------
* AN EARTHQUAKE WITH A PRELIMINARY MAGNITUDE OF 8.9 OCCURRED
OFF THE COAST OF CENTRAL CHILE AT 1112 UTC ON FRIDAY FEBRUARY
8 2013.
* BASED ON ALL AVAILABLE DATA... THE TSUNAMI THREAT FROM THIS
EARTHQUAKE HAS LARGELY PASSED ALTHOUGH SEA LEVEL FLUCTUATIONS
CAN CONTINUE IN IMPACTED AREAS FOR MANY HOURS.
RECOMMENDED ACTIONS
-------------------
* GOVERNMENT AGENCIES RESPONSIBLE FOR ANY IMPACTED COASTAL
AREAS SHOULD MONITOR CONDITIONS AT THE COAST TO DETERMINE IF
AND WHEN IT IS SAFE TO RESUME NORMAL ACTIVITIES.
* PERSONS LOCATED NEAR IMPACTED COASTAL AREAS SHOULD STAY ALERT
FOR INFORMATION AND FOLLOW INSTRUCTIONS FROM LOCAL
AUTHORITIES.
* REMAIN OBSERVANT AND EXERCISE NORMAL CAUTION NEAR THE SEA.
POTENTIAL IMPACTS
-----------------
* MINOR SEA LEVEL FLUCTUATIONS OF UP TO 0.3 METERS ABOVE AND
BELOW THE NORMAL TIDE MAY CONTINUE OVER THE NEXT FEW HOURS.
PRELIMINARY EARTHQUAKE PARAMETERS
---------------------------------
* MAGNITUDE 8.9
* ORIGIN TIME 1112 UTC FEB 8 2013
* COORDINATES 33.7 SOUTH 72.3 WEST
* DEPTH 20 KM / 12 MILES
* LOCATION OFF THE COAST OF CENTRAL CHILE
IOC Technical Series, 105 Page 49
IOC
Technical S
eries, 105 P
age 49
NEXT UPDATE AND ADDITIONAL INFORMATION
--------------------------------------
* THIS WILL BE THE FINAL STATEMENT ISSUED FOR THIS EVENT UNLESS
NEW INFORMATION IS RECEIVED OR THE SITUATION CHANGES.
* COASTAL REGIONS OF HAWAII SHOULD REFER TO PACIFIC TSUNAMI
WARNING CENTER MESSAGES FOR HAWAII THAT CAN BE FOUND AT
PTWC.WEATHER.GOV.
* COASTAL REGIONS OF CALIFORNIA... OREGON... WASHINGTON...
BRITISH COLUMBIA AND ALASKA SHOULD REFER TO WEST COAST AND
ALASKA TSUNAMI WARNING CENTER MESSAGES THAT CAN BE FOUND AT
WCATWC.ARH.NOAA.GOV.
* AUTHORITATIVE INFORMATION ABOUT THE EARTHQUAKE FROM THE U.S.
GEOLOGICAL SURVEY CAN BE FOUND ON THE INTERNET AT
EARTHQUAKE.USGS.GOV/EARTHQUAKES/MAP.
* FURTHER INFORMATION ABOUT THIS EVENT MAY BE FOUND AT
PTWC.WEATHER.GOV AND AT WWW.TSUNAMI.GOV.
$$

IOC Technical Series, 105 Page 50
IOC
Technical S
eries, 105 P
age 50 APPENDIX III. LIST OF PLACES COVERED IN THE PTWS PTWC NEW PRODUCTS
The countries and country sub-jurisdictions where the PTWC will provide forecasts are listed below. During the trial period, Member States are asked to review the places and recommend changes as needed.
1. AMERICAN_SAMOA 2. ANTARCTICA 3. AUSTRALIA 4. BELAU 5. BRUNEI 6. CAMBODIA 7. CHILE 8. CHINA 9. CHUUK 10. COLOMBIA 11. COOK_ISLANDS 12. COSTA_RICA 13. DPR_OF_KOREA 14. ECUADOR 15. EL_SALVADOR 16. FIJI 17. FRENCH_POLYNESIA 18. GUAM 19. GUATEMALA 20. HONDURAS 21. HOWLAND_AND_BAKER 22. INDONESIA 23. JAPAN 24. JARVIS_ISLAND 25. JOHNSTON_ISLAND 26. KERMADEC_ISLAND 27. KIRIBATI 28. KOSRAE 29. MALAYSIA 30. MARSHALL_ISLANDS 31. MEXICO
32. MIDWAY_ISLAND 33. MINAMITORISHIMA 34. NAURU 35. NEW_CALEDONIA 36. NEW_ZEALAND 37. NICARAGUA 38. NIUE 39. NORTHERN_MARIANAS 40. PALMYRA_ISLAND 41. PANAMA 42. PAPUA_NEW_GUINEA 43. PERU 44. PHILIPPINES 45. PITCAIRN 46. POHNPEI 47. REPUBLIC_OF_KOREA 48. RUSSIA 49. SAMOA 50. SINGAPORE 51. SOLOMON_ISLANDS 52. TAIWAN 53. THAILAND 54. TOKELAU 55. TONGA 56. TUVALU 57. VANUATU 58. VIETNAM 59. WAKE_ISLAND 60. WALLIS_AND_FUTUNA 61. YAP

IOC Technical Series, 105 Page 51
IOC
Technical S
eries, 105 P
age 51
APPENDIX IV. LIST OF PTWS PTWC FORECAST POLYGONS
The forecast polygons that divide extended coasts into segments or that surround particular island groups are listed below. These were chosen and named somewhat arbitrarily based upon geological, geographic, and/or political boundaries. During the trial period, Member States are encouraged to review the polygons and recommend changes in boundaries or names so as to make the polygons more useful. 1. Pacific Side of Antarctica 2. New South Wales Australia 3. Northern Queensland Australia 4. Southern Queensland Australia 5. Tasmania 6. Victoria Australia 7. Brunei 8. Cambodia 9. Northern Chile 10. North Central Chile 11. South Central Chile 12. Southern Chile 13. Easter Island 14. Pitcairn Island 15. Hainan Island 16. Eastern China Coast 17. Southeastern China Coast 18. Southern China Coast 19. Northeastern China Coast 20. Pacific Coast of Colombia 21. Pacific Coast of Costa Rica 22. Eastern Coast of DPR of Korea 23. Western Coast of DPR of Korea 24. Ecuador 25. El Salvador 26. Pacific Coast of Guatemala 27. Pacific Coast of Honduras 28. Western Borneo Indonesia 29. Halmahera Indonesia 30. Pacific Side of Papua Indonesia 31. Celebes Sea Coast of Borneo
Indonesia 32. Celebes Sea Coast of Sulawesi
Indonesia 33. Southeast Coast of Sumatra
Indonesia 34. East Coast of Japanese Main
Islands 35. West Coast of Japanese Main
Islands 36. Western Coast of the Malay
Peninsula Malaysia 37. Celebes Sea Coast of Sabah
Malaysia
38. Northwest Coast of Sabah Malaysia
39. Southwest Coast of Sabah Malaysia
40. Sulu Sea Coast of Sabah Malaysia 41. Pacific Side of Baja Mexico 42. Pacific Side of Baja Sud Mexico 43. Gulf Side of Baja Sud Mexico 44. Gulf Side of Baja Mexico 45. Sonora Mexico 46. Sinaloa Mexico 47. Nayarit Mexico 48. Jalisco Mexico 49. Colima Mexico 50. Michoacan Mexico 51. Guerrero Mexico 52. Oaxaca Mexico 53. Chiapas Mexico 54. East Side of North Island New
Zealand 55. North Side of North Island New
Zealand 56. West Side of North Island New
Zealand 57. East Side of South Island New
Zealand 58. West Side of South Island New
Zealand 59. Pacific Side of Nicaragua 60. Pacific Side of Panama 61. Bismarck Sea Side of Papua New
Guinea 62. Bouganville Papua New Guinea 63. Coral Sea Side of Papua New
Guinea 64. Manus Island Papua New Guinea 65. Bismarck Sea Side of New Britain 66. Solomon Sea Side of New Britain 67. New Ireland 68. Solomon Sea Side of Papua New
Guinea 69. Northern Peru 70. Central Peru 71. Southern Peru

IOC Technical Series, 105 Page 52
IOC
Technical S
eries, 105 P
age 52 72. Celebes Sea Side of the
Philippines 73. Interior Seas of the Philippines 74. Pacific Side of the Philippines 75. Palawan Island Philippines 76. Western Coast of Northern
Philippines 77. Sulu Sea Coast of the Philippines 78. Eastern Coast of the Republic of
Korea 79. Western Coast of the Republic of
Korea 80. Bering Sea Coast of Eastern
Russia 81. East Coast of Russia North of
Korean Peninsula 82. East Coast of Russia on the Sea of
Okhotsk 83. East Coast of Russia on the
Tatarskiy Straight 84. Western Coast of Kamchatka 85. Pacific Coast of Kamchatka 86. Sea of Okhotsk Coast of Sakhalin 87. Tatarskiy Straight Coast of
Sakhalin 88. Singapore 89. Eastern Coast of Taiwan 90. Western Coast of Taiwan 91. Eastern Gulf Coast of Thailand 92. Western Gulf Coast of Thailand 93. Northern Coast of Vietnam 94. Southern Coast of Vietnam 95. Cook Islands 96. Galapagos Islands 97. Fiji 98. Marquesas Islands 99. Tuamotu Archipelago 100. Society Islands 101. Austral Islands 102. New Caledonia 103. Wallis and Futuna 104. Bangka Islands Belitung 105. Natuna Islands
106. Sangihe Islands 107. Talaud Islands 108. Izu and Ogasawara Islands 109. Minamitorishima 110. Nansei Islands 111. Gilbert Islands 112. Line Islands 113. Phoenix Islands 114. Marshall Islands 115. Chuuk State Micronesia 116. Kosrae State Micronesia 117. Pohnpei State Micronesia 118. Yap State Micronesia 119. Nauru 120. Niue 121. Palau 122. Trobriand Woodlark and Louisiade
Islands 123. Sulu Archipelago Philippines 124. Jeju Island 125. Komandorsky Islands 126. Kuril Islands 127. Urup Etorofu Kunashiri Shikotan
and Habomai Islands 128. Samoa 129. Choisel to Philip Solomon Islands 130. Santa Cruz Islands 131. Tokelau 132. Tonga 133. Tuvalu 134. American Samoa 135. Guam 136. Hawaii 137. Howland and Baker 138. Jarvis Island 139. Johnston Atoll 140. Midway Island 141. Northern Hawaiian Islands 142. Northern Marianas 143. Palmyra Island 144. Wake Island 145. Vanuatu

IOC Technical Series, 105 Page 53
IOC
Technical S
eries, 105 P
age 53

(continued)
IOC Technical Series
No. Title Languages
1 Manual on International Oceanographic Data Exchange. 1965 (out of stock)
2 Intergovernmental Oceanographic Commission (Five years of work). 1966 (out of stock)
3 Radio Communication Requirements of Oceanography. 1967 (out of stock)
4 Manual on International Oceanographic Data Exchange - Second revised
edition. 1967
(out of stock)
5 Legal Problems Associated with Ocean Data Acquisition Systems (ODAS).
1969
(out of stock)
6 Perspectives in Oceanography, 1968 (out of stock)
7 Comprehensive Outline of the Scope of the Long-term and Expanded
Programme of Oceanic Exploration and Research. 1970
(out of stock)
8 IGOSS (Integrated Global Ocean Station System) - General Plan
Implementation Programme for Phase I. 1971
(out of stock)
9 Manual on International Oceanographic Data Exchange - Third Revised
Edition. 1973
(out of stock)
10 Bruun Memorial Lectures, 1971 E, F, S, R
11 Bruun Memorial Lectures, 1973 (out of stock)
12 Oceanographic Products and Methods of Analysis and Prediction. 1977 E only
13 International Decade of Ocean Exploration (IDOE), 1971-1980. 1974 (out of stock)
14 A Comprehensive Plan for the Global Investigation of Pollution in
the Marine Environment and Baseline Study Guidelines. 1976
E, F, S, R
15 Bruun Memorial Lectures, 1975 - Co-operative Study of the Kuroshio
and Adjacent Regions. 1976
(out of stock)
16 Integrated Ocean Global Station System (IGOSS) General Plan
and Implementation Programme 1977-1982. 1977
E, F, S, R
17 Oceanographic Components of the Global Atmospheric Research
Programme (GARP) . 1977
(out of stock)
18 Global Ocean Pollution: An Overview. 1977 (out of stock)
19 Bruun Memorial Lectures - The Importance and Application
of Satellite and Remotely Sensed Data to Oceanography. 1977
(out of stock)
20 A Focus for Ocean Research: The Intergovernmental Oceanographic
Commission - History, Functions, Achievements. 1979
(out of stock)
21 Bruun Memorial Lectures, 1979: Marine Environment and Ocean Resources.
1986
E, F, S, R
22 Scientific Report of the Interealibration Exercise of the
IOC-WMO-UNEP Pilot Project on Monitoring Background Levels
of Selected Pollutants in Open Ocean Waters. 1982
(out of stock)
23 Operational Sea-Level Stations. 1983 E, F, S, R
24 Time-Series of Ocean Measurements. Vol.1. 1983 E, F, S, R
25 A Framework for the Implementation of the Comprehensive Plan
for the Global Investigation of Pollution in the Marine Environment. 1984
(out of stock)
26 The Determination of Polychlorinated Biphenyls in Open-ocean Waters. 1984 E only
27 Ocean Observing System Development Programme. 1984 E, F, S, R
28 Bruun Memorial Lectures, 1982: Ocean Science for the Year 2000. 1984 E, F, S, R
29 Catalogue of Tide Gauges in the Pacific. 1985 E only
30 Time-Series of Ocean Measurements. Vol. 2. 1984 E only
31 Time-Series of Ocean Measurements. Vol. 3. 1986 E only
32 Summary of Radiometric Ages from the Pacific. 1987 E only
33 Time-Series of Ocean Measurements. Vol. 4. 1988 E only

No. Title Languages
34 Bruun Memorial Lectures, 1987: Recent Advances in Selected Areas of Ocean
Sciences in the Regions of the Caribbean, Indian Ocean and the Western
Pacific. 1988
Composite
E, F, S
35 Global Sea-Level Observing System (GLOSS) Implementation Plan. 1990 E only
36 Bruun Memorial Lectures 1989: Impact of New Technology on Marine
Scientific Research. 1991
Composite
E, F, S
37 Tsunami Glossary - A Glossary of Terms and Acronyms Used in the
Tsunami Literature. 1991
E only
38 The Oceans and Climate: A Guide to Present Needs. 1991 E only
39 Bruun Memorial Lectures, 1991: Modelling and Prediction in Marine Science.
1992
E only
40 Oceanic Interdecadal Climate Variability. 1992 E only
41 Marine Debris: Solid Waste Management Action for the Wider Caribbean.
1994
E only
42 Calculation of New Depth Equations for Expendable Bathymerographs Using a
Temperature-Error-Free Method (Application to Sippican/TSK T-7, T-6 and T-
4 XBTS. 1994
E only
43 IGOSS Plan and Implementation Programme 1996-2003. 1996 E, F, S, R
44 Design and Implementation of some Harmful Algal Monitoring Systems. 1996 E only
45 Use of Standards and Reference Materials in the Measurement of Chlorinated
Hydrocarbon Residues. 1996
E only
46 Equatorial Segment of the Mid-Atlantic Ridge. 1996 E only
47 Peace in the Oceans: Ocean Governance and the Agenda for Peace; the
Proceedings of Pacem in Maribus XXIII, Costa Rica, 1995. 1997
E only
48 Neotectonics and fluid flow through seafloor sediments in the Eastern
Mediterranean and Black Seas - Parts I and II. 1997
E only
49 Global Temperature Salinity Profile Programme: Overview and Future. 1998 E only
50 Global Sea-Level Observing System (GLOSS) Implementation Plan-1997.
1997
E only
51 L'état actuel de 1'exploitation des pêcheries maritimes au Cameroun et leur
gestion intégrée dans la sous-région du Golfe de Guinée (cancelled)
F only
52 Cold water carbonate mounds and sediment transport on the Northeast Atlantic
Margin. 1998
E only
53 The Baltic Floating University: Training Through Research in the Baltic,
Barents and White Seas - 1997. 1998
E only
54 Geological Processes on the Northeast Atlantic Margin (8th training-through-
research cruise, June-August 1998). 1999
E only
55 Bruun Memorial Lectures, 1999: Ocean Predictability. 2000 E only
56 Multidisciplinary Study of Geological Processes on the North East Atlantic and
Western Mediterranean Margins (9th training-through-research cruise, June-
July 1999). 2000
E only
57 Ad hoc Benthic Indicator Group - Results of Initial Planning Meeting, Paris,
France, 6-9 December 1999. 2000
E only
58 Bruun Memorial Lectures, 2001: Operational Oceanography – a perspective
from the private sector. 2001
E only
59 Monitoring and Management Strategies for Harmful Algal Blooms in Coastal
Waters. 2001
E only
60 Interdisciplinary Approaches to Geoscience on the North East Atlantic Margin
and Mid-Atlantic Ridge (10th training-through-research cruise, July-August
2000). 2001
E only
61 Forecasting Ocean Science? Pros and Cons, Potsdam Lecture, 1999. 2002 E only

(continued)
No. Title Languages
62 Geological Processes in the Mediterranean and Black Seas and North East
Atlantic (11th training-through-research cruise, July- September 2001). 2002
E only
63 Improved Global Bathymetry – Final Report of SCOR Working Group 107.
2002
E only
64 R. Revelle Memorial Lecture, 2006: Global Sea Levels, Past, Present
and Future. 2007
E only
65 Bruun Memorial Lectures, 2003: Gas Hydrates – a potential source of energy
from the oceans. 2003
E only
66 Bruun Memorial Lectures, 2003: Energy from the Sea: the potential and
realities of Ocean Thermal Energy Conversion (OTEC). 2003
E only
67 Interdisciplinary Geoscience Research on the North East Atlantic Margin,
Mediterranean Sea and Mid-Atlantic Ridge (12th training-through-research
cruise, June-August 2002). 2003
E only
68 Interdisciplinary Studies of North Atlantic and Labrador Sea Margin
Architecture and Sedimentary Processes (13th training-through-research cruise,
July-September 2003). 2004
E only
69 Biodiversity and Distribution of the Megafauna / Biodiversité et distribution de
la mégafaune. 2006
Vol.1 The polymetallic nodule ecosystem of the Eastern Equatorial Pacific
Ocean / Ecosystème de nodules polymétalliques de l’océan Pacifique
Est équatorial
Vol.2 Annotated photographic Atlas of the echinoderms of the Clarion-
Clipperton fracture zone / Atlas photographique annoté des
échinodermes de la zone de fractures de Clarion et de Clipperton
Vol.3 Options for the management and conservation of the biodiversity — The
nodule ecosystem in the Clarion Clipperton fracture zone: scientific,
legal and institutional aspects
E F
70 Interdisciplinary geoscience studies of the Gulf of Cadiz and Western
Mediterranean Basin (14th training-through-research cruise, July-September
2004). 2006
E only
71 Indian Ocean Tsunami Warning and Mitigation System, IOTWS.
Implementation Plan, 7–9 April 2009 (2nd
Revision). 2009
E only
72 Deep-water Cold Seeps, Sedimentary Environments and Ecosystems of the
Black and Tyrrhenian Seas and the Gulf of Cadiz (15th training-through-
research cruise, June–August 2005). 2007
E only
73 Implementation Plan for the Tsunami Early Warning and Mitigation System in
the North-Eastern Atlantic, the Mediterranean and Connected Seas
(NEAMTWS), 2007–2011. 2007 (electronic only)
E only
74 Bruun Memorial Lectures, 2005: The Ecology and Oceanography of Harmful
Algal Blooms – Multidisciplinary approaches to research and management.
2007
E only
75 National Ocean Policy. The Basic Texts from: Australia, Brazil, Canada,
China, Colombia, Japan, Norway, Portugal, Russian Federation, United States
of America. (Also Law of Sea Dossier 1). 2008
E only
76 Deep-water Depositional Systems and Cold Seeps of the Western
Mediterranean, Gulf of Cadiz and Norwegian Continental margins (16th
training-through-research cruise, May–July 2006). 2008
E only
77 Indian Ocean Tsunami Warning and Mitigation System (IOTWS) – 12
September 2007 Indian Ocean Tsunami Event. Post-Event Assessment of
IOTWS Performance. 2008
E only
78 Tsunami and Other Coastal Hazards Warning System for the Caribbean and
Adjacent Regions (CARIBE EWS) – Implementation Plan 2008. 2008
E only

No. Title Languages
79 Filling Gaps in Large Marine Ecosystem Nitrogen Loadings Forecast for 64
LMEs – GEF/LME global project Promoting Ecosystem-based Approaches to
Fisheries Conservation and Large Marine Ecosystems. 2008
E only
80 Models of the World’s Large Marine Ecosystems. GEF/LME Global Project
Promoting Ecosystem-based Approaches to Fisheries Conservation and Large
Marine Ecosystems. 2008
E only
81 Indian Ocean Tsunami Warning and Mitigation System (IOTWS) –
Implementation Plan for Regional Tsunami Watch Providers (RTWP). 2008
E only
82 Exercise Pacific Wave 08 – A Pacific-wide Tsunami Warning and
Communication Exercise, 28–30 October 2008. 2008
E only
83. Cancelled
84. Global Open Oceans and Deep Seabed (GOODS) Bio-geographic
Classification. 2009
E only
85. Tsunami Glossary E, F, S
86 Pacific Tsunami Warning System (PTWS) Implementation Plan
(under preparation)
87. Operational Users Guide for the Pacific Tsunami Warning and Mitigation
System (PTWS) – Second Edition. 2011
E only
88. Exercise Indian Ocean Wave 2009 (IOWave09) – An Indian Ocean-wide
Tsunami Warning and Communication Exercise – 14 October 2009. 2009
E only
89. Ship-based Repeat Hydrography: A Strategy for a Sustained Global
Programme. 2009
E only
90. 12 January 2010 Haiti Earthquake and Tsunami Event Post-Event Assessment
of CARIBE EWS Performance. 2010
E only
91. Compendium of Definitions and Terminology on Hazards, Disasters,
Vulnerability and Risks in a coastal context
Under
preparation
92. 27 February 2010 Chile Earthquake and Tsunami Event – Post-Event
Assessment of PTWS Performance (Pacific Tsunami Warning System). 2010
E only
93. Exercise CARIBE WAVE 11 / LANTEX 11—A Caribbean Tsunami Warning
Exercise, 23 March 2011
Vol. 1 Participant Handbook / Exercise CARIBE WAVE 11 —Exercice
d’alerte au tsunami dans les Caraïbes, 23 mars 2011. Manuel du
participant / Ejercicio Caribe Wave 11. Un ejercicio de alerta de
tsunami en el Caribe, 23 de marzo de 2011. Manual del participante.
2010
Vol. 2 Report. 2011
Vol. 3 Supplement: Media Reports. 2011
E/F/S
E only
E/F/S
94. Cold seeps, coral mounds and deep-water depositional systems of the Alboran
Sea, Gulf of Cadiz and Norwegian continental margin (17th training-through-
research cruise, June–July 2008)
Under
preparation
95. International Post-Tsunami Survey for the 25 October 2010 Mentawai,
Indonesia Tsunami
Under
preparation
96. Pacific Tsunami Warning System (PTWS) 11 March 2011 Off Pacific coast
of Tohoku, Japan, Earthquake and Tsunami Event. Post-Event Assessment
of PTWS Performance
Under
preparation
97. Exercise PACIFIC WAVE 11: A Pacific-wide Tsunami Warning and
Communication Exercise, 9–10 November 2011
Vol. 1 Exercise Manual. 2011
E only
98. Tsunami Early Warning and Mitigation System in the North-Eastern Atlantic,
the Mediterranean and connected seas. First Enlarged Communication Test
Exercise (ECTE1). Exercise Manual and Evaluation Report. 2011
E only
99. Exercise INDIAN OCEAN WAVE 2011 – An Indian Ocean-wide Tsunami
Warning and Communication Exercise
Under
preparation

No. Title Languages
100. Global Sea Level Observing System (GLOSS) Implementation Plan – 2012.
2012
E only
101. Exercise Caribe Wave/Lantex 13. A Caribbean Tsunami Warning Exercise, 20
March 2013. Volume 1: Participant Handbook. 2012
E only
102. (In preparation)
103. Exercise NEAMWAVE 12. A Tsunami Warning and Communication Exercise
for the North-eastern Atlantic, the Mediterranean, and Connected Seas Region,
27–28 November 2012, Volume I: Exercise Manual. 2012
E only
104. Seísmo y tsunami del 27 de agosto de 2012 en la costa del Pacífico frente a El
Salvador, y seísmo del 5 de septiembre de 2012 en la costa del Pacífico frente a
Costa Rica. Evaluación subsiguiente sobre el funcionamiento del Sistema de
Alerta contra los Tsunamis y Atenuación de sus Efectos en el Pacífico. 2012
Español
solamente
(resumen en
inglés y francés)
105. Users Guide for the Pacific Tsunami Warning Center Enhanced Products for
the Pacific Tsunami Warning System. 2013
E, S