USER’S GUIDE FOR - EPA Archives · USER’S GUIDE FOR SURROGATE MATRIX NORMALIZATION...
68
Transcript of USER’S GUIDE FOR - EPA Archives · USER’S GUIDE FOR SURROGATE MATRIX NORMALIZATION...

USER’S GUIDE FOR
SURROGATE MATRIX NORMALIZATION
(SMCREPORTER)
Prepared For:U.S. Environmental Protection Agency
National Exposure Research LaboratoryEnvironmental Sciences Division (NERL-ESD)
P.O. Box 93478Las Vegas, Nevada 89193-3478
Prepared by:Anteon Corporation
4220 S. Maryland Parkway, Suite 408BLas Vegas, Nevada 89119
September 2003
Draft

User’s Guide for Surrogate Matrix Normalization
______________________________________________________________________________Draft
ii
DISCLAIMER
This document is a draft. It was developed under funding provided by the U.S. EnvironmentalProtection Agency (EPA) National Environmental Research Laboratory (NERL). It has not beenformally reviewed or released by the U.S. EPA.
Mention of trade names or commercial products does not constitute endorsement orrecommendation for use.

User’s Guide for Surrogate Matrix Normalization
______________________________________________________________________________Draft
iii
TABLE OF CONTENTS
INTRODUCTION . . . . . . . . . . . . . . . . . . . . . . . . . . . . . . . . . . . . . . . . . . . . . . . . . . . . . . . . . . . . . 11.1 System Purpose . . . . . . . . . . . . . . . . . . . . . . . . . . . . . . . . . . . . . . . . . . . . . . . . . . . 11.2 Document Organization . . . . . . . . . . . . . . . . . . . . . . . . . . . . . . . . . . . . . . . . . . . . . 11.3 User Profile . . . . . . . . . . . . . . . . . . . . . . . . . . . . . . . . . . . . . . . . . . . . . . . . . . . . . . 11.4 Conventions . . . . . . . . . . . . . . . . . . . . . . . . . . . . . . . . . . . . . . . . . . . . . . . . . . . . . . 1
SYSTEM OVERVIEW . . . . . . . . . . . . . . . . . . . . . . . . . . . . . . . . . . . . . . . . . . . . . . . . . . . . . . . . . 22.1 System Requirements . . . . . . . . . . . . . . . . . . . . . . . . . . . . . . . . . . . . . . . . . . . . . . . 22.2 Essential Concepts . . . . . . . . . . . . . . . . . . . . . . . . . . . . . . . . . . . . . . . . . . . . . . . . . 2
2.2.1 Basis and Terminology . . . . . . . . . . . . . . . . . . . . . . . . . . . . . . . . . . . . . . . 32.2.2 Text Input Files . . . . . . . . . . . . . . . . . . . . . . . . . . . . . . . . . . . . . . . . . . . . . . 3
2.2.2.1 The Compound Library . . . . . . . . . . . . . . . . . . . . . . . . . . . . . . . . . 32.2.2.2 Quantitation Results File . . . . . . . . . . . . . . . . . . . . . . . . . . . . . . . . 52.2.2.3 Surrogate File Essentials . . . . . . . . . . . . . . . . . . . . . . . . . . . . . . . . 52.2.2.4 Surrogate Files . . . . . . . . . . . . . . . . . . . . . . . . . . . . . . . . . . . . . . . 82.2.2.5 MDL File . . . . . . . . . . . . . . . . . . . . . . . . . . . . . . . . . . . . . . . . . . . . 9
SYSTEM OPERATION . . . . . . . . . . . . . . . . . . . . . . . . . . . . . . . . . . . . . . . . . . . . . . . . . . . . . . . 113.1 Smcreporter Operation . . . . . . . . . . . . . . . . . . . . . . . . . . . . . . . . . . . . . . . . . . . . . 11
3.1.1 Starting Smcreporter . . . . . . . . . . . . . . . . . . . . . . . . . . . . . . . . . . . . . . . . 113.1.2 File Menu . . . . . . . . . . . . . . . . . . . . . . . . . . . . . . . . . . . . . . . . . . . . . . . . . 11
3.1.2.1 Open Library... . . . . . . . . . . . . . . . . . . . . . . . . . . . . . . . . . . . . . . 113.1.2.2 Update Library... . . . . . . . . . . . . . . . . . . . . . . . . . . . . . . . . . . . . . 123.1.2.3 Create Surrogate File... . . . . . . . . . . . . . . . . . . . . . . . . . . . . . . . . 143.1.2.4 Open Surrogate File... . . . . . . . . . . . . . . . . . . . . . . . . . . . . . . . . . 143.1.2.5 Edit Surrogate File... . . . . . . . . . . . . . . . . . . . . . . . . . . . . . . . . . . 153.1.2.6 Surrogate Limits Dialog . . . . . . . . . . . . . . . . . . . . . . . . . . . . . . . 183.1.2.7 Copy Surrogate File... . . . . . . . . . . . . . . . . . . . . . . . . . . . . . . . . . 193.1.2.8 Open Calibration File... . . . . . . . . . . . . . . . . . . . . . . . . . . . . . . . . 193.1.2.9 Create/Edit MDL File... . . . . . . . . . . . . . . . . . . . . . . . . . . . . . . . 203.1.2.10 Exit . . . . . . . . . . . . . . . . . . . . . . . . . . . . . . . . . . . . . . . . . . . . . . 22
3.1.3 Calibration Menu . . . . . . . . . . . . . . . . . . . . . . . . . . . . . . . . . . . . . . . . . . . . 223.1.3.1 Create/New... . . . . . . . . . . . . . . . . . . . . . . . . . . . . . . . . . . . . . . . 223.1.3.2 Identify Standard Level Dialog . . . . . . . . . . . . . . . . . . . . . . . . . . 243.1.3.3 Review... (Calibration) . . . . . . . . . . . . . . . . . . . . . . . . . . . . . . . . 253.1.3.4 Print Calibration . . . . . . . . . . . . . . . . . . . . . . . . . . . . . . . . . . . . . 27

User’s Guide for Surrogate Matrix Normalization
______________________________________________________________________________Draft
iv
3.1.3.5 Check Calibration... . . . . . . . . . . . . . . . . . . . . . . . . . . . . . . . . . . 273.1.4 Quantitation Menu . . . . . . . . . . . . . . . . . . . . . . . . . . . . . . . . . . . . . . . . . . 29
3.1.4.1 Process Sample Files... . . . . . . . . . . . . . . . . . . . . . . . . . . . . . . . . 293.1.4.2 File Processing Input Dialog . . . . . . . . . . . . . . . . . . . . . . . . . . . . 32
LIST OF FIGURES
Figure 1 – Update Library Dialog Box . . . . . . . . . . . . . . . . . . . . . . . . . . . . . . . . . . . . . . . . . . . . 12Figure 2 – Surrogate Data Dialog Box . . . . . . . . . . . . . . . . . . . . . . . . . . . . . . . . . . . . . . . . . . . . . 15Figure 3 – Surrogate Limits Dialog Box . . . . . . . . . . . . . . . . . . . . . . . . . . . . . . . . . . . . . . . . . . . 17Figure 4 – Create/Edit MDL Dialog Box . . . . . . . . . . . . . . . . . . . . . . . . . . . . . . . . . . . . . . . . . . . 20Figure 5 – Create Calibration File Dialog Box . . . . . . . . . . . . . . . . . . . . . . . . . . . . . . . . . . . . . . 23Figure 6 – Identify Standard Level Dialog Box . . . . . . . . . . . . . . . . . . . . . . . . . . . . . . . . . . . . . . 24Figure 7 – Review Calibration Dialog Box . . . . . . . . . . . . . . . . . . . . . . . . . . . . . . . . . . . . . . . . . 26Figure 8 – Check Calibration Standard Dialog Box . . . . . . . . . . . . . . . . . . . . . . . . . . . . . . . . . . 27Figure 9 – Check Calibration Review Dialog Box . . . . . . . . . . . . . . . . . . . . . . . . . . . . . . . . . . . 28Figure 10 – Process Files Dialog Box . . . . . . . . . . . . . . . . . . . . . . . . . . . . . . . . . . . . . . . . . . . . . 29Figure 11 – File Processing Input Dialog Box . . . . . . . . . . . . . . . . . . . . . . . . . . . . . . . . . . . . . . . 31
LIST OF APPENDICES
APPENDIX 1 INSTALLED PROGRAM FILES . . . . . . . . . . . . . . . . . . . . . . . . . . . . . . 33APPENDIX 2 VERIFYING SMCREPORTER INSTALLATION . . . . . . . . . . . . . . . . . 34APPENDIX 3 REGRESSION SELECTION ALGORITHM . . . . . . . . . . . . . . . . . . . . . 36APPENDIX 4 WINDOWS INITIALIZATION FILE (INI) FORMAT . . . . . . . . . . . . . . 37APPENDIX 5 METHOD 8261 CALCULATIONS . . . . . . . . . . . . . . . . . . . . . . . . . . . . 39
1. Quantitative Analysis – Calibration . . . . . . . . . . . . . . . . . . . . . . . . . . . . . . . . . . 392. Quantitative Analysis - Sample Corrections . . . . . . . . . . . . . . . . . . . . . . . . . . . . 443. Quantitative Analysis - Check Calibration . . . . . . . . . . . . . . . . . . . . . . . . . . . . . 45
APPENDIX 6 SAMPLE 8261 COMPOUND LIBRARY LISTING . . . . . . . . . . . . . . . 46APPENDIX 7 CALIBRATION REPORT . . . . . . . . . . . . . . . . . . . . . . . . . . . . . . . . . . . 48APPENDIX 8 SURROGATE REPORT . . . . . . . . . . . . . . . . . . . . . . . . . . . . . . . . . . . . . 50APPENDIX 9 QUANTITATION REPORT . . . . . . . . . . . . . . . . . . . . . . . . . . . . . . . . . . 56APPENDIX 10 CHECK CALIBRATION REPORT . . . . . . . . . . . . . . . . . . . . . . . . . . . . 59APPENDIX 11 MDL REPORT . . . . . . . . . . . . . . . . . . . . . . . . . . . . . . . . . . . . . . . . . . . . 62APPENDIX 12 LIBRARY SYNCHRONIZATION PRINTOUT . . . . . . . . . . . . . . . . . . . 63

User’s Guide for Surrogate Matrix Normalization
______________________________________________________________________________Draft
i
SECTION 1INTRODUCTION
1.1 System Purpose
Smcreporter is a program to simplify and standardize EPA method 8261 surrogate matrixnormalization for volatile organic compounds in a variety of environmental matrices (adescription of method 8261 is available at http://www.epa.gov/sw-846/pdfs/8261.pdf).
1.2 Document Organization
This User’s Guide is intended to enable users to access functions of the Smcreporter application.Use of the application to perform Method 8261 normalization will be described in detail.
Section 2 – System Overview – describes technical details of Smcreporter. This section includessystem requirements and a discussion of essential concepts for use of the application.
Section 3 – System Operation – provides a description of the software user interface as currentlyimplemented and a step-through list for performing Method 8261 normalization procedures.
1.3 User Profile
Users of this system are expected to be experienced technical personnel, familiar with GC/MS,microcomputers and Windows operating systems. They should be familiar with method 8261procedures and concepts.
1.4 Conventions
To help the user to easily interpret information in this manual, certain conventions will be used:• When indicating information to be entered from the keyboard, text will be shown in
COURIER font. Specific keys will be identified by label, enclosed in angle brackets. Forexample, Type this.<Enter> means to type in the phrase: Type this. Then pressthe Enter key.
• Nested menu selections will be separated by a vertical bar ( | ). File | Exit means to selectthe ‘File’ menu option in the top-level menu, then select ‘Exit’ from the next menu.
• The standard DOS directory and file conventions will be used.

User’s Guide for Surrogate Matrix Normalization
1 Hiatt, M.H; Farr C.M. Volatile Organic Compound Determinations Using Surrogate- Based Correction for Method and Matrix Effects, Analytical Chemistry, 1995, 67, 426- 433.
2 Hiatt, M.H. Vacuum Distillation Coupled with Gas Chromatography/Mass Spectrometry for the Analysis of Environmental Samples, Analytical Chemistry, 1995, 67, 4044-4052.
______________________________________________________________________________Draft
2
SECTION 2SYSTEM OVERVIEW
2.1 System Requirements
Smcreporter was written, tested, and has been demonstrated to work for stand-alone data analysison PCs using Windows 98, Windows NT version 4, and Windows 2000 operating systems.
Systems used to run Smcreporter must meet the following minimum requirements:• Windows operating system (Windows 98, Windows NT version 4, or Windows 2000)• Pentium 166 MHz• Super VGA display (800 x 600 resolution)• 2 GB hard disk• CD-ROM drive• 64 MB RAM.
2.2 Essential Concepts
The purpose of Smcreporter is to simplify the application of Method 8261 surrogate matrixnormalization computations. Method 8261 provides a basis to determine the concentration ofvolatile organic compounds (VOCs) in various matrices. The method is described in an on-lineEPA document – Volatile Organic Compounds by Vacuum Distillation in Combination WithGas Chromatography/Mass Spectrometry (VD/GC/MS), available athttp://www.epa.gov/epaoswer/hazwaste/test/ txup4b.htm. The experimental basis of the methodis explained in previous publications.1,2 The method will be broadly discussed and terminologyintroduced in section 2.3.1.

User’s Guide for Surrogate Matrix Normalization
______________________________________________________________________________Draft
3
2.2.1 Basis and Terminology
Method 8261 employs an instrument calibration using spiked samples of VOCs to calculateanalyte recoveries from vacuum distillation and cryogenic trapping. VOCs used in spikedsamples are referred to as surrogates. By introducing known amounts of surrogates into fieldsamples, the sample analyte recoveries can be calculated based on the measured recovery of thesurrogates.
The physical properties of interest for recovery of VOCs by vacuum distillation and cryogenictrapping are relative volatility1 and boiling point. In keeping with other publications, thefollowing terms will be used:• Relative volatility describes the potential of a compound to be extracted from a matrix.• Relative volatility surrogates ( -surrogates) are compounds used to assess relative
volatility effects on analyte recoveries.• Boiling point describes the potential of a compound to condense.• Boiling point surrogates ( -surrogates) are compounds used to assess condensation
effects on analyte recoveries.
2.2.2 Text Input Files
There are various text files that are required inputs for this program. Only two – the compoundlibrary file and quantitation results file – must be created by the user. Other files – surrogatelibrary, calibration file, and minimum detectible limits (MDL) file – are created and maintainedusing program subroutines and, although they are text files, it is recommended that they not bemanually edited.
2.2.2.1 The Compound Library
Smcreporter maintains a library (compound library) of compounds and parameters necessary forMethod 8261 calculations. The compound library should contain the same set of compounds asthe instrument software. The compound library file is a tab-delimited text file in the followingformat:• A header line which reads: COMPOUND LIBRARY. This line is required.• A list of compound names, each on a separate line. The compound name must be
followed by a tab character. These lines are required.• For each compound, the following optional fields may be included following the

User’s Guide for Surrogate Matrix Normalization
______________________________________________________________________________Draft
4
compound name:� a compound type string beginning with ‘a’ or ‘s’ (case insensitive) to indicate
whether the compound is an analyte (‘a’) or a surrogate (‘s’)� the relative volatility – water to air (RVW)� the boiling point (BP)� the relative volatility – octanol to air (RVO)� the partition coefficient (Part Coef)� up to five concentrations (C1-C5) for spiked calibration standards.Entries for each field must be concluded with a tab character. For any optional fields notincluded in the file, the program will assign default values. The order of fields anddefault values are shown in Table X. Defaults are not intended as reasonableapproximations to be used in calculations, they are flag placeholders until actual valuesare entered. Optional fields are like default arguments in common programminglanguages – in order to specify a value for a field, all previous fields must also bespecified.
Table X – Order of Library File Fields and Default ValuesCompoundName
CompoundType (A/S)
RVW BP RVO Part.Coef C1 C2 C3 C4 C5
Default None analyte 999 999 999 999 99 99 99 99 99
A portion of a library file with some example records is shown below:
COMPOUND LIBRARYdiethylether-d10 S 32.5 32acetone-C13 A 600 57 999 999 3100 3100 3100 3100 3100ethanol-d3
For acetone-C13, notice that in order to specify concentrations (C1-C5), values for RVOand Part Coef must be included (in this example, values equal to program defaults wereused).
To create the compound library text file:• Import a text report from the GC/MS into a spreadsheet. Importing a GC/MS report
generally provides a listing of all compounds in the GC/MS software and ensuresconsistent spelling of compound names.

User’s Guide for Surrogate Matrix Normalization
______________________________________________________________________________Draft
5
• Check that compound names are correct and complete (they may be truncated in thereport, or by the spreadsheet’s import routine).
• Delete any unnecessary information and add any desired optional fields as indicatedabove.
• Save the spreadsheet as a text file.� Excel: Use File | Save As... and select Save as type: Text (Tab delimited)(*.txt).� QuatroPro: Use File | Save As... and select File Type: ASCII Text (Tab delimited).� Lotus 1-2-3: Select the desired fields and save them to the clipboard. Paste the
selection into Notepad. Use File | Save to save the selection as a file.
The library file can be updated through the ‘Update Library...’ menu option (see section 3.1.2.2).
2.2.2.2 Quantitation Results File
The quantitation results file lists compounds and area counts resulting from a GC/MSquantitation. It is a tab delimited file. A sample is shown below:
DATA FILE diethylether-d10 262976.00
acetone-C13 2451460.00ethanol-d3 5.750E05
The heading ‘DATA FILE’ is required. The list of compounds must be the same spellings andorder as the compound library and each compound must have area counts (surrogates shouldnever have area counts of zero; zero is acceptable for analytes). Follow the same procedures asthose for creating the compound library file (see section 2.2.2.1).
2.2.2.3 Surrogate File Essentials
Surrogate compounds are selected to cover the range of relative volatilities and boiling points for analytes being measured. There are four classes of surrogate compounds:� First pass surrogates attempt to estimate the effects of relative volatility on compound
recoveries, as independently of boiling point effects as possible. First pass surrogatesshould have low boiling points (< 100°C) to minimize any boiling point effects.
� Boiling point surrogates reflect the effect of boiling point on compound recovery.� Relative volatility surrogates estimate the effect of relative volatility on compound

User’s Guide for Surrogate Matrix Normalization
______________________________________________________________________________Draft
6
recovery.� Check surrogates are used as quality assurance checks on the Method 8261 calculations.
First pass, boiling point, and relative volatility surrogates are grouped in smaller ranges to moreaccurately depict the expected recovery of compounds. Linear regressions are used tocharacterize recoveries for each surrogate grouping.
Surrogate groups are maintained using the Surrogate Data dialog box (section 3.1.2.7). In theSurrogate Data dialog box, all compounds selected as surrogates in the 8261 library are listed.
Smcreporter requires that there be at least three first pass surrogates. Select first pass surrogatesby indicating ‘Yes’ in the ‘First Pass?’ list box. First pass surrogates are first ordered byincreasing relative volatility, then automatically assigned to groups of two. Table 1 showsexample first pass surrogates and groupings.
Table 1 - First Pass Surrogate Groups
Compounds Group Relative Volatility Range
Hexafluorobenzene / Fluorobenzene 1 0.86 - 3.5
Fluorobenzene / 1,2-dichloroethane-d4 2 3.5 - 20
1,2-dichloroethane-d4 / Teterahydrofuran 3 20 - 355
In Table 1, there are four first pass surrogates defined to cover the range of relative volatilitiesfrom 0.86 to 355. Note that adjacent groups share compounds. The high relative volatility for thefirst group becomes the low relative volatility for the second group, etc. First pass surrogatesmust be selected to cover the range of relative volatilities for boiling point surrogates.
Boiling point and relative volatility surrogates are manually assigned to groups in the SurrogateData form, using the ‘Boiling Point Group’ and ‘Relative Volatility Group’ check boxes (seesection 3.1.2.5). There must be at least three compounds per group and at least two groups foreach surrogate type. Up to six groups can be defined. Table 2 shows example groups.
Table 2 - Example Surrogate Groupings

User’s Guide for Surrogate Matrix Normalization
______________________________________________________________________________Draft
7
Group Boiling Point Relative Volatility
1 Pentafluorobenzene (85)Toluene-d8 (111)Bromobenzene-d5 (155)
Hexafluorobenzene (0.86)Fluorobenzene (3.5)1,4-difluorobenzene (3.83 )
2 Bromobenzene-d5 (155)1,2-dichlorobenzene-d4 (181)1,2,4-trichlorobenzene-d3 (213)
Fluorobenzene (3.5)1,4-difluorobenzene (3.83 ) O-xylene-d10 (6.14)Chlorobenzene-d5 (6.27)
3 1,2,4-trichlorobenzene-d3 (213)Naphthalene-d8 (217)1-methylnaphthalene-d10 (245)
O-xylene-d10 (6.14)Chlorobenzene-d5 (6.27)1,2-dibromoethane-d4 (26)1,1,2-trichloroethane-d3 (26.6)
4 1,2-dibromoethane-d4 (26)1,1,2-trichloroethane-d3 (26.6)Tetrahydrofuran-d8 (355)Acetone-c13 (600)
5 Tetrahydrofuran-d8 (355)Acetone-c13 (600)1,4-dioxane-d8 (5800)Pyridine-d5 (15000)
Notice that the groups are defined so that there are one or two compounds common to adjacentgroups. There cannot be any gap between groups. In the Surrogate Data form, check two groupboxes for compounds that are shared; i.e., check boxes 4 and 5 for Tetrahydrofuran-d8.
Linear regressions determined by each group are used to calculate expected recoveries forcompounds. The selection of limits for the regression lines affects which regression will be usedto calculate recoveries. Some care must be taken in the selection of surrogate groups to ensurethat the desired regression is used. The algorithm for selecting regressions is included inAppendix 3.
2.2.2.4 Surrogate Files

User’s Guide for Surrogate Matrix Normalization
______________________________________________________________________________Draft
8
The surrogate files are Windows initialization (.ini) format files (see Appendix 3). An .ini file issimply a text file. However, it has a structure which allows Windows to quickly find data. Data isorganized in sections. Each section starts with a title in brackets. Under each section are keyswith associated values.
An example surrogate file follows:
[compound1]name=diethylether-d10LibCmpndNum=1bpgroup1=0bpgroup2=0bpgroup3=0bpgroup4=0bpgroup5=0bpgroup6=0rvwgroup1=0rvwgroup2=1rvwgroup3=1rvwgroup4=0rvwgroup5=0rvwgroup6=0first_pass=0checked_surrogate=0[header]number_comps=1[limits]MinBP=85MaxBP=231MinRVW=0.86MaxRVW=9327.3790530888
There are 1..n compound sections, one for each compound. The header section has one key – thenumber of compounds listed in the file. The limits section is optional. If it exists, all four keysmust be included.

User’s Guide for Surrogate Matrix Normalization
______________________________________________________________________________Draft
9
Surrogate files can be created using ‘File | Create Surrogate File...’ or ‘File | Copy SurrogateFile...’ (see sections 3.1.2.3 and 3.1.2.7). Use ‘File | Edit Surrogate File...’ (see section 3.1.2.5) toassign compounds to groups. While the files can be edited using a text editor, it is recommendedthat they be created and maintained using program menu options.
2.2.2.5 MDL File
MDL files are semicolon delimited text files. An example follows:
Creation Date;7/5/2002 4:52:28 PMCompound Library File:C:\HPCHEM\1\METHODS\TESTMETH.M\8261dir\lib8261.iniSurrogate File;C:\HPCHEM\1\METHODS\TESTMETH.M\8261dir\Surrogates\2groups.ini12.00;sludge;ng/lOther;diethylether-d10;4.00dichlorodifluoromethane;1.00chloromethane;3.00bromomethane;4.30chloroethane;2.10
There are five required header lines. These lines include information to identify properties ofsamples the MDLs apply to. The labels on the first three lines and the fifth line are required. Thefourth line shows the sample size, matrix type, and reporting units. The fifth line is a commentline. Each compound and associated MDL are listed on the following lines. Compounds must belisted in the same order as in the compound library. It is not necessary to list all compounds, butthere cannot be any gaps in the compounds listed.
MDL files can be created and maintained using the ‘File | Create/Edit MDL File...’ menu option(see section 3.1.2.9). It is recommended that the menu option be used to manipulate MDL files.

User’s Guide for Surrogate Matrix Normalization
______________________________________________________________________________Draft
10
SECTION 3SYSTEM OPERATION
3.1 Smcreporter Operation
3.1.1 Starting Smcreporter
The install procedure adds a program icon to the Windows Start menu. Click ‘Start’ | ‘Programs’| ‘Smcreporter’ to start the program. The program main window is titled ‘Surrogate MatrixCorrection’.
The program main menu has four options – File, Calibration, Quantitation, and Help – whichallow access to all program functions. Each main menu option has an associated drop-downmenu. All menu options will be explained in the following sections. Whenever it is necessary toreference a menu item on a separate drop-down menu, the main menu and drop-down items willbe listed, separated by a vertical line, e.g. ‘File’ | ‘Open Library...’.
Menu options are enabled or disabled based on user selections and logical choices available.Options may be disabled following error messages, due to possibly corrupted memory structures.
3.1.2 File Menu
The ‘File’ main menu provides access to routines to manage compound library, surrogate,calibration, and minimum detectable limit (MDL) files. Drop-down menu items are separatedinto functional groups by file type. The program ‘Exit’ option is on this menu.
3.1.2.1 Open Library...
The ‘Open Library...’ menu option allows selection of a library file – a tab-delimited text filelisting all compounds of interest and their physical properties. Selecting this option brings up astandard file open dialog box, which allows access to the full directory structure to select aproperly formatted library file.
In the open dialog box, select a file. Click the ‘Open’ button to open the selected file, or ‘Cancel’to close the Open dialog without opening a library file.

User’s Guide for Surrogate Matrix Normalization
______________________________________________________________________________Draft
11
Figure 1 – Update Library Dialog Box
The following menu changes will occur when selecting a library file:• If a library file is not previously loaded, the ‘Update Library...’, ‘Create Surrogate File...’,
‘Open Surrogate File...’, and ‘Create/Edit MDL File...’ menu options will be enabledwhen a library file is opened.
• The ‘Update Library...’ menu option will be modified to show the library file currently inprogram memory.
• If a calibration file was previously loaded in memory, it is no longer valid when thelibrary file is opened. The ‘Calibration’ and ‘Quantitation’ main menu options will bedisabled when a library file is opened.
3.1.2.2 Update Library...
This option allows updating of the library file by entering compound type, physical properties,and calibration concentrations for each library compound. A dialog box titled ‘Update Library’,followed by the library file name, will be displayed (Figure 1).

User’s Guide for Surrogate Matrix Normalization
______________________________________________________________________________Draft
12
The full path name of the text file opened in ‘Open Library...’ (see section 3.1.2.1) is shown inthe ‘Library’ edit box. This box is read-only. It may be necessary to scroll right to see the full filepath.
The ‘Compound Name’ box displays the compound currently selected for updating. Thecompound name may be edited in this box. All compound names should appear exactly as theydo the GC/MS software. Use the ‘End’ key or scroll right to check for superfluous characters inthe name. Save changes using the ‘SaveAs’ button (a reminder to save changes is displayed onexiting this form).
Compounds may be added or deleted from the compound list using the ‘Delete Compound’ and‘Add Compound (Above)’ buttons. When the ‘Delete Compound’ button is pressed, the currentselected compound will be deleted from the compound list. When the ‘Add Compound (Above)’button is pressed, a blank compound will be added to the compound list before the currentselected compound. A compound name must be entered before moving to another compound.After pressing either button, the ‘Cancel Changes’ button has no effect. Use these buttons againto replace or delete a compound.
To select a different compound, select from the list box at the right of the form, or enter thecompound number (the compound’s sequential number in the compound list) in the ‘Record #’box. Press <Tab> rather than <Enter> to accept the entry. Compounds may also besequentially accessed using the Next and Previous buttons, or <Alt-N> and <Alt-P>.
Enter the relative volatility to water and the boiling point in the appropriate boxes. A negativenumber is not allowed for the relative volatility as calculations use the natural log (ln). Therelative volatility organic (relative volatility – water to octanol) and the octanol-water partitioncoefficient are not currently used.
In the ‘Compound Category’ selection list, indicate whether the current compound is an analyteor a surrogate. The selected choice is highlighted in blue.
The boxes labeled ‘Conc1' through ‘Conc5' are for recording various concentrations of analytesand surrogates in spiked calibration samples. All samples (calibration and field) are spiked withsurrogates at a constant concentration (ng); thus, only one box (‘Conc1') will be displayed forsurrogate compounds. For analytes, boxes are provided for up to five different calibrationsample concentrations.
User’s Guide for Surrogate Matrix Normalization
______________________________________________________________________________Draft
13
Any changes made to a compound are saved in memory when the user selects another compound.Prior to selecting another compound, the ‘Cancel Changes’ button can be used to restore originalcompound entries.
Any changes made during the editing session will be lost unless they are saved. The ‘Save As’button will write all changes to the library text file.
The ‘Print’ button prints a listing of the compound library and all compound entries.
The ‘Exit’ button exits the form. If there are any unsaved changes, the user will be prompted tosave or cancel changes on exit.
3.1.2.3 Create Surrogate File...
This option creates a new surrogate file from the library file currently in memory. This optioncreates a new surrogate file and populates fields with default values. It will often be better to savean existing surrogate file under a new name (see section 3.1.2.5).
A file Open dialog box will be displayed. Enter a new file name for the surrogate file. Click‘Open’ to create the new surrogate file. You will be prompted for another file name if the filealready exists. Click the ‘OK’ button to return to the file open dialog and enter a new file name.The ‘Cancel’ button exits without creating a new surrogate file.
Creating a new surrogate file does not automatically load that surrogate file into the program.Use the ‘Open Surrogate File...’ (see section 3.1.2.4) option to load the file before any furtherprocessing.
3.1.2.4 Open Surrogate File...
This option allows the selection of a surrogate file to be used in Method 8261 calibrations andcalculations. Surrogates may be selected and grouped in various ways, thus, there may benumerous surrogate files associated with a given library file.
When this option is selected, a file Open dialog box will be displayed. Select a file and click the‘Open’ button. Warnings will be displayed if a nonexistent file is entered, or the file is not asurrogate file. Click ‘OK’ to return to the file open box and select another file. The ‘Cancel’

User’s Guide for Surrogate Matrix Normalization
______________________________________________________________________________Draft
14
Figure 2 – Surrogate Data Dialog Box
button exits without opening a surrogate file.
If a surrogate file is not already in memory, the ‘Edit Surrogate File...’, ‘Copy Surrogate File...’,and ‘Calibration’ | ‘Create/New...’ menu options will be enabled when a surrogate file is opened.
The ‘Edit Surrogate File...’ menu option will be modified to show the surrogate file currently inprogram memory.
3.1.2.5 Edit Surrogate File...
This option is used to identify and group specific surrogates to be used in Method 8261calculations. The ‘Surrogate Data’ dialog box will be displayed (Figure 2).
The library and surrogate files must be synchronized, i.e. they must have the identical list ofsurrogate compounds, listed in the same order. If the files are not synchronized, a warningmessage will be displayed that shows library and surrogate compound names that do not agree,with the prompt, “Is this a rename?”. If the library compound was renamed and the surrogate

User’s Guide for Surrogate Matrix Normalization
______________________________________________________________________________Draft
15
compound is equivalent to the old name, click the ‘OK’ button. The surrogate name will beupdated to match the library name. Otherwise, a new surrogate file must be created from thelibrary (see section 3.1.2.3). A report will be printed showing the current surrogate settings (seeAppendix 12). The currently-selected surrogate file is shown in the ‘Surrogate Library’ edit box. This is a read-only box. The user may scroll through the box to see the entire file path.
The current compound is identified in the ‘Compound Name’ box. This box is read-only. Thesurrogate number shown in the ‘surrogate number’ box is the sequence number of the selectedsurrogate in the surrogate file. This number may or may not correspond to the sequence numberof the surrogate compound in the 8261 library file; i.e., if a compound is the second compound inthe library, but the first surrogate, it will have surrogate number 1 and compound library number2. Surrogate compounds can be selected by entering the surrogate file or the 8261 library filesequence number, or by using the ‘Next’ button (or <Alt-N>) or ‘Previous’ button (or <Alt-P>).Press <Tab> to accept the entry.
The relative volatility and boiling point are displayed for reference. They are important indetermining surrogate groupings. These are read-only boxes. These values are changed by editingthe compound library (see section 3.1.2.2).
All changes made to the current surrogate compound are saved in memory when the user selectsa different surrogate.
In the Edit Surrogate File dialog box, place a checkmark in each group the compound is amember of. A compound may belong to one or two groups. Compounds that belong to twogroups determine the endpoints for regression lines representing expected recoveries over thegroup interval. However, the only programmatic requirement for surrogate groups is that theymust contain at least three compounds. Ordinarily, a compound should not be both a boilingpoint and a relative volatility surrogate.
First pass surrogates are used to estimate the effects of relative volatility on boiling pointsurrogates. First pass surrogates should have boiling points below 100°C to minimize any boilingpoint effects. They must be selected to cover the full range of relative volatilities for the boilingpoint surrogates. Select between three and five first pass surrogates by highlighting ‘Yes’ (inblue) in the ‘First Pass?’ box.

User’s Guide for Surrogate Matrix Normalization
______________________________________________________________________________Draft
16
Figure 3 – Surrogate Limits Dialog Box
Check surrogates are surrogates that will be added to samples as a check on the Method 8261calculations. These compounds are not ordinarily included in other surrogate groups. Selectcheck surrogates by highlighting ‘Yes’ (in blue) in the ‘Check Surrogate?’ box.
The Set Limits button is used to define minimum and maximum limits for calculations.Experience using the Method 8261 normalization algorithm has shown that it is possible to havenegative recoveries, especially near the minimum and maximum surrogate limits. For this reason,the user may specify limits to boiling points and relative volatilities used in calculations. TheSurrogate Limits dialog box (Figure 3) is displayed when the ‘Set Limits’ button is pressed (seesection 3.1.2.6).
Any changes made during the editing session will be lost unless they are saved. Use the ‘SaveAs’ button to save all changes to the surrogate file.
Except when first creating a surrogate file, it is recommended that any changes to a surrogate filebe saved to a different file name. After a surrogate file has been used for sample quantitations, it

User’s Guide for Surrogate Matrix Normalization
______________________________________________________________________________Draft
17
eRV RVln( ) ln( )1 2
2+
should be maintained on disk. If the surrogate file is edited, save it to another file name byselecting the ‘Save As’ button. A ‘Save As’ dialog box will be shown. The current surrogate filename may be selected (although it is strongly discouraged). A dialog will warn that the currentfile will be overwritten. The user may elect to proceed (‘Yes’ button) or enter another file name(‘No’ button).
Exit the form by clicking the ‘Exit’ button. If there are any unsaved changes, a prompt will bedisplayed to save or cancel changes.
3.1.2.6 Surrogate Limits Dialog
This dialog (Figure 3) allows the user to specify minimum and maximum boiling points andrelative volatilities for Method 8261 calculations. This limits extrapolation recovery curves at theextremes of data and reduces the chances for negative recoveries. Default values and ranges thatmay be entered are as follows:
• Minimum boiling point – The minimum boiling point must fall within the range ofboiling point group 1. If group 1 has three compounds, the default minimum boiling pointis the group’s minimum boiling point and the range is the group’s minimum to maximumvalues. For more compounds, the default is the average of the group’s lowest two boilingpoints and the range is the average of the group’s two lowest to the average of the twohighest boiling points. When a compound’s boiling point is below the user-specifiedminimum, the predicted recovery is assumed as 1 (100%).
• Maximum boiling point – The maximum boiling point must fall within the range of thehighest boiling point group. The default maximum is always the average of the twohighest boiling points. The range minimum is either the group minium for group of threecompounds, or the average of the two minimum points for larger groups. The predictedrecovery for compounds with boiling points above that specified will be equal to thepredicted recovery for the maximum specified boiling point.
• Minimum relative volatility – The minimum relative volatility and range are determined
using relative volatility group 1 in the same manner as the minimum boiling point above. Theaverage relative volatility is the log average:

User’s Guide for Surrogate Matrix Normalization
______________________________________________________________________________Draft
18
where RV1 and RV2 are the relative volatilities being averaged.Relative volatilities below the user-defined value, will have a predicted recovery equal tothe specified minimum.
• Maximum relative volatility – The maximum relative volatility and range are determinedusing the highest relative volatility group in the same manner as the maximum boilingpoint above. The average relative volatility is the log average. Relative volatilities abovethe user-defined value, will have a predicted recovery equal to the specified maximum.
On exiting the dialog box, values will be checked. If values are out of range, they will be reset tothe nearest value within the range. The dialog box will remain active until closed.
3.1.2.7 Copy Surrogate File...
This option allows the user to save the current surrogate file with a new name. This minimizesinputs required when slight modifications are desired in a surrogate file.• A message will be displayed confirming that you have the desired surrogate file selected. • A standard file save dialog box will allow you to choose the new file name. If the file
already exists, you will be prompted to confirm overwriting the existing file.
The new file will not be automatically loaded. Use the ‘Open Surrogate File...’ menu option toload the new file.
3.1.2.8 Open Calibration File...
The ‘Open Calibration File...’ menu option allows selection of a calibration file. A calibrationfile is created using the ‘Calibration’ | ‘Create/New...’ menu option (see section 3.1.3.1).Selecting this option brings up a standard file open dialog box, which allows access to the fulldirectory structure to select a properly formatted calibration file.
In the open dialog box, select a file. Click the ‘Open’ button to open the selected file, or ‘Cancel’to close the Open dialog without opening a calibration file.
The following menu changes will occur when a calibration file is opened:• If a calibration file was not previously loaded, all ‘Calibration’ drop-down menu items
(except ‘Create/New...’) and ‘Quantitation’ drop-down menu items will be enabled when
User’s Guide for Surrogate Matrix Normalization
______________________________________________________________________________Draft
19
Figure 4 – Create/Edit MDL Dialog Box
the calibration file is opened.• If a library file was previously loaded, it will no longer be valid. The ‘Update Library...’,
‘Create Surrogate File...’, ‘Open Surrogate File...’, ‘Edit Surrogate...’, ‘Copy SurrogateFile...’, ‘Create/Edit MDL File...’, and ‘Calibration’ | ‘Create/New’ will be disabled whenthe calibration is opened.
• The calibration file name will be appended to the ‘Open Calibration File...’ menu option.
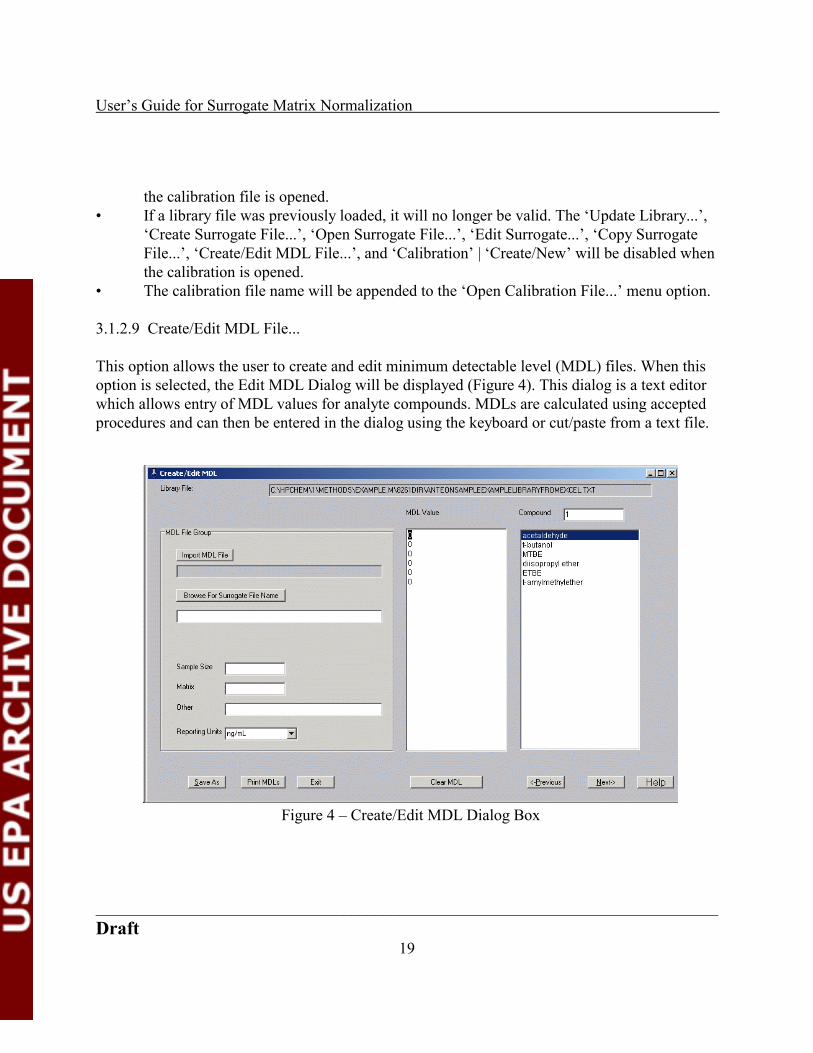
3.1.2.9 Create/Edit MDL File...
This option allows the user to create and edit minimum detectable level (MDL) files. When thisoption is selected, the Edit MDL Dialog will be displayed (Figure 4). This dialog is a text editorwhich allows entry of MDL values for analyte compounds. MDLs are calculated using acceptedprocedures and can then be entered in the dialog using the keyboard or cut/paste from a text file.

User’s Guide for Surrogate Matrix Normalization
______________________________________________________________________________Draft
20
To complete this dialog:• The Library File edit box displays the current 8261 library file. It is read-only.• The MDL File Group displays identifying information about the MDL file.
� An existing MDL file can be loaded by clicking the ‘Import MDL File’ button. AnOpen File Dialog will be presented to select the MDL file. If an existing file isimported, all other edit boxes in the MDL File Group (the grouped edit boxes onthe left of the dialog) will be filled automatically.
Otherwise:� Click the ‘Browse For Surrogate File Name’ button to select the surrogate file
used in calculating MDLs. An open file dialog will be displayed. This is arequired field.
� Enter the sample size used in calculating MDLs. This is a required field.• Enter the appropriate matrix. This is strictly a comment field, but is required for complete
documentation.� Any further comments can be entered in the ‘Other’ field.� Select the appropriate reporting units from the drop-down list box.
• Navigation among compounds in this dialog is can be accomplished using the ‘Next’ and‘Previous’ buttons, arrow keys, and the compound list scrollbar (when the analyte list isover 23 compounds), or entering a compound number in the ‘Compound’ edit box (abovethe compound list box). The cursor in the MDL Value box will maintain alignment withthe compound list box.It is possible to add more MDL values than there are analyte compounds. If the MDLvalue cursor is moved past the end of the compound list, zero (0) will be shown in the‘Compound’ edit box and there will not be a compound highlighted in the compound listas there is no correspondence between the cursor and the compound list. When the cursorreturns to a line that corresponds to the compound list, the two boxes will besynchronized.
• MDLs are entered using the text box labeled ‘MDL Value’. MDLs can be entered byplacing the cursor on the appropriate line and entering a value from the keyboard; orvalues may be cut (Ctrl-C) and pasted (Ctrl-V) from a text file, or from a Microsoft Excelspreadsheet (values from any other spreadsheet should be exported to a text editor beforecutting and pasting). The text file must be formatted as a single entry per line, forexample:
2.453.675.00
User’s Guide for Surrogate Matrix Normalization
______________________________________________________________________________Draft
21
etc.Values are associated with compounds strictly on a positional basis; i.e. the first valuewill be associated with the first compound, the second value with the second compound,etc. Enter a zero (0) for any compounds which do not have an MDL.Values may also be selected and cut (Ctrl-C) and pasted (Ctrl-V) within the MDL Valuebox.
• The ‘Clear MDL’ button is used to reset all MDLs to zero.• Click the ‘Save As’ button to save all information to a data file. A Save As Dialog will be
displayed.• The ‘Print’ button will print a listing of compounds and MDLs.• Click ‘Exit’ to close this dialog.
3.1.2.10 Exit
The ‘Exit’ menu option closes the Surrogate Matrix Correction Method window and cleanlycloses the application. All information has previously been saved in previous dialogs.
3.1.3 Calibration Menu
The ‘Calibration’ main menu option invokes a drop-down menu that provides functions to create,review and edit, and print calibration files. A second functional group allows comparison ofsample surrogate recovery results with the calibration expected recovery.
3.1.3.1 Create/New...
A calibration must be performed before a quantitation on environmental samples can be done.The calibration consists of measuring known samples, calculating recoveries versus a selectedsample (the ‘surrogate reference’), and estimating the effects of boiling point and relativevolatility on the recovery. The result is a set of response factors (area counts/ng) that can beapplied to field samples.
In creating a calibration file, the user selects a set of known samples and a surrogate reference.When the ‘Create Calibration File’ option is selected, a message box will be shown confirmingthe surrogate file that will be used for the calibration. Click ‘OK’ to open the ‘Create CalibrationFile’ dialog (Figure 5). If the desired surrogate file is not shown, click the ‘Cancel’ button andload the desired file (see section 3.1.2.4).

User’s Guide for Surrogate Matrix Normalization
______________________________________________________________________________Draft
22
Figure 5 – Create Calibration File Dialog Box
The top two fields - ‘Compound Library:’ and ‘Surrogate Library:’ are read-only. They confirmthe libraries that will be used in calibration calculations.
To complete this form and create a calibration file:• Select between one and five standard samples to process. Click the ‘Add Standard’
button. This will display a file open dialog. Select a quantitation results file (see section2.2.2.2).
• The ‘Identify Standard Level’ dialog box (Figure 6, see section 3.1.3.2) will be displayed.This dialog is used to select the appropriate concentration (ng) for the sample.
• Control will return to the create calibration file dialog on exiting the ‘Identify StandardLevel’ dialog. The data directory and concentration selected will be displayed in the ‘DataDirectory’ and ‘Concentration’ list boxes.
• After all standards have been chosen, select a surrogate reference. Click the ‘AddSurrogate Reference’ button or simply click inside the ‘Surrogate Reference:’ edit box. Afile open dialog will be displayed to select the surrogate reference.
• A standard can be deleted from the list by highlighting the desired entry and clicking the

User’s Guide for Surrogate Matrix Normalization
______________________________________________________________________________Draft
23
Figure 6 – Identify Standard Level Dialog Box
‘Delete’ button.• To perform calculations and review the results of the calibration, click the ‘Review’
button. The results of the calibration will be shown in a ‘Review Calibration’ dialog box(see section 3.1.3.3).
• Click the ‘Print’ button to print a record of the calibration shown. To suppress printing ofa surrogate report for each standard used, check the ‘DO NOT print Surrogate report’box. See Appendices 6 and 7 for explanations of the calibration report and the surrogatereport.
• Press the ‘Save’ button to save the calibration to a file. There is no automatic saving ofthe calibration information. The file selection is accomplished using a standard file savedialog box.
• Click ‘Exit’ to close this form. The user will not be prompted to save the currentcalibration.
3.1.3.2 Identify Standard Level Dialog
This dialog is used to identify the concentration of compounds in a calibration sample. In the‘Update Library...’ menu option, up to five concentrations can be entered for each compound. In
User’s Guide for Surrogate Matrix Normalization
______________________________________________________________________________Draft
24
this dialog, radio buttons correspond to the standard concentrations entered in the ‘UpdateLibrary’ screen (see section 3.1.2.2). A concentration may also be entered as a dilution ofstandard concentration 1. For example, if a sample is created using a 2:1 dilution of standardconcentration 1, the dilution factor is 0.5. Use the radio buttons to select a standard concentrationor a dilution of standard concentration 1. Enter the dilution factor if a dilution is used.
NOTE: A dilution is ordinarily indicated by a fraction less than one. However, thedilution factor edit box will accept numbers greater than one. This allowspreparation of calibration samples with higher concentrations than concentration1, but bypasses inputting individual concentrations for each compound –substantially reducing inputs.
3.1.3.3 Review... (Calibration)
The results of a calibration, or a saved calibration file, can be viewed using the ‘ReviewCalibration’ dialog (Figure 7). This dialog allows the user to review and select calibrationsamples to be used in determining the final response factor. It also displays important calibrationstatistics for each compound in the compound method library.
The ‘Calibration File:’ box shows the name of the calibration file displayed. The names of eachstandard directory and the surrogate reference directory are shown on the next row. It may benecessary to scroll right to see the full directory name.
The concentrations (ng) of the compound in the standard solutions are shown in the‘Concentrations’ row.
The ‘Area’ row contains the area counts for the compound from the quantitation result file in thedata directory indicated.
The row labeled ‘Average’ shows the average response factor for the columns selected. The textbox under ‘Standard Levels’ lists of the analyte amounts for the selected columns. The average(mean), deviation (standard deviation), and percent deviation (the standard deviation as a percentof the average) are shown for the selected samples.

User’s Guide for Surrogate Matrix Normalization
______________________________________________________________________________Draft
25
Figure 7 – Review Calibration Dialog Box
To complete this form and determine response factors for each compound:• Select the desired compound by entering the record number in the Record Number box,
using the ‘Previous’ (<Alt-P>) and ‘Next’ (<Alt-N>) buttons to navigate thecompound list, or select the compound from the list box in the upper right corner of theform. The current compound will be shown in the Compound edit box.
• Information for each standard solution used in the calibration will be displayed inseparate columns. Review the information shown for each standard solution. To exclude astandard solution from the final calculations, uncheck the check box in the standardcolumn. The average response factor, deviation and percent deviation for the compound(shown in the bottom row of edit boxes) will be updated as boxes are checked orunchecked.
• Click the ‘Save As’ button to save changes. It is suggested that changes be saved to adifferent calibration file. A standard file save box will be displayed. The currentcalibration file may be selected – a warning will be displayed about overwriting the file.
• Click the ‘Print’ button to print the calibration results (Appendix 7). A surrogate report

User’s Guide for Surrogate Matrix Normalization
______________________________________________________________________________Draft
26
Figure 8 – Check Calibration Standard Dialog Box
(Appendix 8) will be printed for each sample, unless the DO NOT print Surrogate Reportcheck box is checked..
• Click the ‘Exit’ button to close the form. If any changes have been made, a prompt willbe displayed to save or discard changes.
3.1.3.4 Print Calibration
Selecting this option prints a report listing response factors for all compounds in the Method8261 library. An example report is included in the Appendix 7.
3.1.3.5 Check Calibration...
The ‘Check Calibration...’ menu option compares the calculated response factors of varioussurrogates in a sample file with those for in the calibration file. To perform a check calibration:
• Select a quantitation results file from a file Open dialog box.• The ‘Check Calibration Standard’ dialog box will be displayed (Figure 8). The edit boxes
on the left side of this form are all read-only and indicate selected files.

User’s Guide for Surrogate Matrix Normalization
______________________________________________________________________________Draft
27
Figure 9 – Check Calibration Review Dialog Box
• Select a standard concentration for the check standard file. A dilution of standardconcentration 1 may also be used – select the ‘Concentration as Dilution of Conc. 1' radiobutton and enter the dilution factor.
• Check the ‘DO NOT Print Surrogate Report’ checkbox if a surrogate report for theselected check standard is not desired.
• Click ‘Print’ to receive a printout of the results. A check calibration report is included in Appendix 10.
• Select ‘Review’ to examine the check calibration results (see section 3.1.3.6).• Click ‘Exit’ to exit the form.
3.1.3.6 Check Calibration Review Dialog
This dialog (Figure 9) shows check calibration results for each compound in the compoundlibrary. Compounds may be selected by entering a compound number (Record Number edit box),by selecting a compound from the list box, or using the ‘Previous’ and ‘Next’ buttons.
The response and deviation listed under the calibration file are the average response factor anddeviation from the calibration file. Under the check standard edit box, the concentration, area

User’s Guide for Surrogate Matrix Normalization
______________________________________________________________________________Draft
28
Figure 10 – Process Files Dialog Box
counts, and response for the check standard file are listed. The difference percent is thedifference between the calibration response factor and the response factor calculated for thecheck standard. The ‘Print’ button is the same as ‘Print’ on the ‘Check Calibration Standard’form.
3.1.4 Quantitation Menu
The ‘Quantitation’ main menu option has a single drop-down option that allows quantitation ofmultiple sample results.
3.1.4.1 Process Sample Files...
This final processing option is used to apply Method 8261 calculations to samples. Up to 20sample files can be processed at one time, using the selected method, surrogates, and calibrationfile. The ‘Process Files’ dialog box (Figure 10) allows selection of multiple files. To completefile processing:
• Click the ‘Add File’ button. A file Open dialog will be shown to allow selection of asample quantitation file. Following selection of a quantitation file, the ‘File Processing

User’s Guide for Surrogate Matrix Normalization
______________________________________________________________________________Draft
31
Figure 11 – File Processing Input Dialog Box
Input’ dialog box (Figure 11) will be displayed. This dialog is used to enter specificinformation about the sample and how it will be reported (see section 3.1.4.2).
• Repeat the steps above to enter up to 100 files to process. To remove a file from the list,highlight the file and press ‘Delete File’.
• Press ‘Process’ to perform Method 8261 calculations for all selected files. Results foreach file will be printed. See Appendix 9 for a sample report. For each sample file, a textfile of the report will be created. The text file will be located in the directory with the

User’s Guide for Surrogate Matrix Normalization
______________________________________________________________________________Draft
32
sample file. The name will be the same as the sample file, with a numeric sequencenumber appended, and will have a .prn extension. For example, if the sample file isXYZ.txt and this is the second time the file has been processed, the text file name will beXYZ.txt2.prn.
• The ‘Review’ button displays a quantitation report. Highlight any sample file in the listbox and click ‘Review’ to display a report for that sample (the first sample in the list willbe displayed if a selection is not made). This report is displayed in Notepad and can besaved as a file using the Files | Save As menu option. This is a semicolon delimited textfile. See Appendix 10 for a sample report.
• Click ‘Exit’ to close this form.
3.1.4.2 File Processing Input Dialog
This dialog box accepts inputs which describe the sample file and define report options:• The current sample file name is displayed in a read-only field.• Use the ‘List MDL’ radio buttons to select whether to apply MDLs to final calculations.
The default is ‘No’. If ‘Yes’ is selected, a ‘Reporting Limits (Number of StandardDeviations)’ drop-down list and the ‘Browse for MDL File’ button and edit box will bedisplayed. Click the ‘Browse for MDL File’ button to display an Open file dialog. Selecta reporting limit from the drop-down list – the numbers 0 - 4 are the number of standarddeviations to apply to reporting limits in the quantitation report. A value of ‘0' willdisplay any concentrations below the MDL as not detectable (ND). Selecting a numberfrom 1 to 3 will only indicate ND if the measured value plus the number of standarddeviations is less than the MDL. The reporting units, sample size, matrix and ‘Other’fields will be automatically filled when an MDL file is selected.
• Select the reporting units from the drop-down list box.• Enter the sample size (milliliters or grams). This is a required field.• Enter the matrix type.• The ‘Other’ and comment fields can be used for any documentation or notes associated
with the quantitation.• Check the ‘DO NOT Print Surrogate report’ check box if a surrogate report is not desired.• Press ‘Enter’ to return to the ‘Process Files’ dialog.

User’s Guide for Surrogate Matrix Normalization
______________________________________________________________________________Draft
33
APPENDIX 1INSTALLED PROGRAM FILES
The program files installed by Smcreporter are listed below, sorted by directories.
Directory File Name
Install Directory Smcreporter.exe
Window System32 directory(This is OS specific and is determined byInstallShield)
Borlndmm.dllCp3245mt.dllDclusr40.bplVcl40.bplVclx40.bpl

User’s Guide for Surrogate Matrix Normalization
______________________________________________________________________________Draft
34
APPENDIX 2VERIFYING SMCREPORTER INSTALLATION
Verification of the installation consists of performing a calibration and checking the calibrationagainst a calibration file included in the installation.
• The Smcreporter menu will initially have only one option: ‘File | Open Library’.� Click ‘Open Library...’. A file open dialog box will be displayed.� Select the file ‘ExampleLibrary.txt’. The path will depend on what directory was
entered for the installation directory during installation. For example, if theinstallation directory was entered as “c:\smcreporter”, the full path ofExampleLibrary.txt will be “c:\smcreporter\ExampleLibrary.txt”. All default pathsspecified below assume the initial directory given in this example.
• Click ‘Open Surrogate File...’ and select ‘ExampleSurrogate.ini’ as the surrogate file. Thedefault path will be “c:\smcreporter\ExampleSurrogate.ini”.
• Click ‘Calibration | Create/New...’.� The Create Calibration File dialog box will be displayed (Figure 5).� Press “Add Standard” and select ‘Example1.txt’ as the standard directory. The
default path is “c:\smcreporter\example1.txt”.� The Identify Standard Level dialog (Figure 6) will be displayed. Select ‘Conc1' as
the standard concentration for Example1. Press “Exit”.� Press “Add Surrogate Reference” and select ‘Example2.txt’ as the surrogate
reference file. The default path is “c:\smcreporter\example3.txt”.� Press “Review”. A Review Calibration dialog box (Figure 7) will be displayed.� Press “Save As”. A file open dialog box will be displayed. Enter a new unique
name for the calibration.� Check the boxes ‘DO NOT print Surrogate report’ and ‘DO NOT Include
Surrogate informtion on Calibration report’.� Press “Print”.� Press “Exit”.
• Click ‘Load Calibration File’ and select ‘Example1and2.cal’ as the calibration file. Thedefault path is “c:\smcreporter\Example1and2.cal’.
• Select ‘Edit Calibration File’.� On the Review Calibraton dialog box (Figure 7), check ‘DO NOT print Surrogate
Report’ and ‘DO NOT Include Surrogate informtion on Calibration report’.� Click the “Print” button. A calibration report for Example1and2.cal will be

User’s Guide for Surrogate Matrix Normalization
______________________________________________________________________________Draft
35
printed.� Press “Exit”.
The calibration reports for Example1and2.cal and the new calibration should match. If not,contact Steven McLemore – Anteon Corporation – at (702) 784-8324 [email protected].

User’s Guide for Surrogate Matrix Normalization
______________________________________________________________________________Draft
36
APPENDIX 3REGRESSION SELECTION ALGORITHM
For each surrogate group, a regression line is calculated. The independent variable (x) is thevalue of the appropriate physical property (boiling point or relative volatility). The followingprocedure is used to determine the appropriate regression to calculate the expected recovery for acompound:
! For each line, determine the absolute minimum and maximum group surrogate values. ! For each line, determine the limits of the regression line.
• For a group of three surrogates, the limits are the two extreme values (limits equalabsolute minimum and maximum)..
• For groups of four or more surrogates, the lower limit is the average of the twolowest values and the upper limit is the average of the two highest values (limitsare different than absolute minimum and maximum).
1) Start with group 1.2) If the compound value is less than the lower limit of group 1, assign the group 1
regression.3) If group is 1, go to step 6.4) If the value is less than the group absolute minimum, assign the previous group
regression.5) If the value is less than the group lower limit, assign the current group regression.6) If the value falls within the group limits, assign the group regression.7) Go to the next group.8) If the group number is less than or equal to the highest group, go to step 4.9) If the value is greater than the group’s upper limit, use the last group regression.

User’s Guide for Surrogate Matrix Normalization
______________________________________________________________________________Draft
37
APPENDIX 4WINDOWS INITIALIZATION FILE (INI) FORMAT
This section explains the Windows initialization file (.ini) format. An INI file is simply a textfile. However, it has a structure which allows Windows to find data in it. It can be thought of as athree-field data table, where the first two fields are keys. The first key is called the ‘Application’or ‘Section’ (in the rest of this document, ‘section’ will be used). The second key is simply calledthe ‘Key’. The third field is the ‘Value’.
Here is an example INI file (taken from the 8261lib.ini file).
[compound1]name=diethylether-d10bp=35rvW=32.5cmpndType=surrogate The word in brackets is the section field. Each word on the left of an equal sign is a key, and thewords to the right of the equal signs are the values.
Keys must be unique within a given section, but they may be duplicated in two or more sections.If the INI file is edited manually (using Notepad or another text editor), non-unique keys could becreated. Windows will simply use the first one it finds and ignore the rest.
INI files were used because they are part of the Windows Application Programming Interface(API). Windows provides functions to access them quickly and easily. The Windows applicationprogramming interface (API) functions that allow reading and writing of INI files areGetPrivateProfileString( ) and WritePrivateProfileString( ). They are implemented inChemStation macro language as GetIniString$( ) and SetIniString( ), and in C++Builder asTiniFile::ReadString() and TIniFile::WriteString(). Use of these functions is documented on theWeb, or through ChemStation or C++Builder online documentation.
INI files do have some important limitations:• When reading an INI file, a default value is specified to return in case the keys provided
are not found. This means that the INI file operations work just fine, even if the INI file

User’s Guide for Surrogate Matrix Normalization
______________________________________________________________________________Draft
38
does not exist. The API functions which retrieve data from INI files do not even tell thecalling function whether the value it is returning came from the INI file, or is simply acopy of the default value.
• INI files cannot be over 64 KB in length.

User’s Guide for Surrogate Matrix Normalization
3 Hiatt, M.H. Method 8261: Volatile Organic Compounds by Vacuum Distillation inCombination with Gas Chromatography/Mass Spectrometry (VD/GC/MS), Draft Update IVB ofSW-846 On-line, URL: http://www.epa.gov/epaoswer/hazwaste/ test/txup4b.htm.
______________________________________________________________________________Draft
39
APPENDIX 5METHOD 8261 CALCULATIONS
1. Quantitative Analysis – Calibration
An instrument calibration must be performed before any quantitation of environmental samples.Spiked samples are used for the calibration. Following measurement of the samples3, thecalibration involves the following steps to calculate response factors (area counts/ng) for eachcompound in the sample: estimate relative volatility effects on boiling point surrogates using firstpass surrogates(f); calculate boiling point ( ) and relative volatility ( ) effects on surrogaterecoveries; combine these effects to estimate total recoveries of compounds; and, finally,calculate a response factor for each compound based on area counts, mass of the compoundpresent, and the estimated recovery. This section presents a step-wise approach to thecalculations.
In the following discussion, various variables will be introduced. These variables may beassociated with first pass, relative volatility, or boiling point surrogates. Subscripts will be usedto clarify the distinction. For example, equation 1 is used to calculate the relative recovery (R). Rfis used for a relative recovery associated with first pass surrogates, R for relative volatilitysurrogates, and R for boiling point surrogates.
• Select results of 1 to 5 spiked samples, of various concentrations, as calibration files.Select a spiked sample file as a ‘surrogate reference’. The surrogate reference represents100% recovery of target compounds.
• First pass surrogates:� For each first pass surrogate, calculate the relative recovery (Rf) as:
Equation 1
Ra ca cs s
r r=
//

User’s Guide for Surrogate Matrix Normalization
______________________________________________________________________________Draft
40
whereR = relative recoveryas = sample area countscs = sample amount (ng)ar = reference area countscr = reference amount (ng).
� Arrange first pass surrogates in order of relative volatility.� For each adjacent pair of first pass surrogates, calculate a linear regression slope
(mf), intercept (bf), and associated standard error (lstderrf):
Equation 2
m = .( )
( )n xy x y
n x x
−
−
∑∑∑∑∑ 2 2
Equation 3
b = .( ) ( )( )
y x x xy
n x x
2
2 2
∑∑ ∑∑∑∑
−
−
Equation 4
lstderr = ( ) ( ) [ ]( )
12
2 22
2 2n nn y y
n xy x y
n x x−
− −−
−
∑ ∑∑∑
∑∑∑
= 0 for first pass surrogates (two first pass surrogates determine a line)wheren = the number of points determining the linex = ln rw (natural log of relative volatility) for points determining the liney = relative recovery (Rf) for first pass surrogates determining the line.
lstderr is a measure of the error in the relative recovery, predicted from theregression, for each natural log of relative volatility (ln rw).

User’s Guide for Surrogate Matrix Normalization
______________________________________________________________________________Draft
41
• Boiling point surrogates:� For each boiling point surrogate, calculate the relative recovery (R - Equation 1).� For each boiling point surrogate, determine the first pass predicted recovery (Rpf)
from the first pass regressions above:
Equation 5
Rp rw m bf f f= × +ln
whererw = surrogate relative volatilityUse the slope and intercept for the calculated line segment that includes the givenln rw. Do not extrapolate lines. Set the relative volatility equal to the nearestendpoint if it is outside the range of first pass relative volatilities.
� For each boiling point surrogate, calculate the first pass adjusted relative recovery(Ra ) as:
Equation 6
RaRRp f
ββ
=
� For each boiling point surrogate group, calculate a linear regression (m , b , andlstderr ) as in Equations 2,3, and 4 above:wherex = boiling point for each surrogate in the groupy = Ra for each surrogate in the group.These linear regressions will yield a predicted recovery for any compound basedon that compound’s boiling point.
• Relative volatility surrogates:� For each relative volatility surrogate, calculate the relative recovery (R -
Equation 1).� For each relative volatility surrogate, determine the boiling point predicted
recovery (Rp ) from the boiling point regressions above:

User’s Guide for Surrogate Matrix Normalization
______________________________________________________________________________Draft
42
Rp rw m bα α α= × +ln
Equation 7
Rp bp m bβ β β= × +
wherebp = surrogate boiling point. Note: If bp exceeds the maximum boiling point for
the surrogate file(see section 3.1.2.5), set bp equal to the maximum value.
The slope and intercept are for the calculated line segment that includes the givenbp. Rp = 1 for boiling points less than the surrogate file minimum. These boilingpoints will ordinarily be less than 100°C and it is assumed that boiling pointeffects will be negligible.
� For each relative volatility surrogate, calculate the boiling point adjusted relativerecovery (Ra ) as:
Equation 8
RaRRp
αα
β=
� For each relative volatility surrogate group, calculate a linear regression (m , b ,and lstderr ) as in Equations 2,3, and 4 above:wherex = ln rw for each surrogate in the groupy = Ra for each surrogate in the group.
• For each surrogate and analyte in the sample:� Calculate the boiling point predicted recovery (Rp - Equation 7) and the relative
volatility predicted recovery (Rp - Equation 9) :
Equation 9
User’s Guide for Surrogate Matrix Normalization
______________________________________________________________________________Draft
43
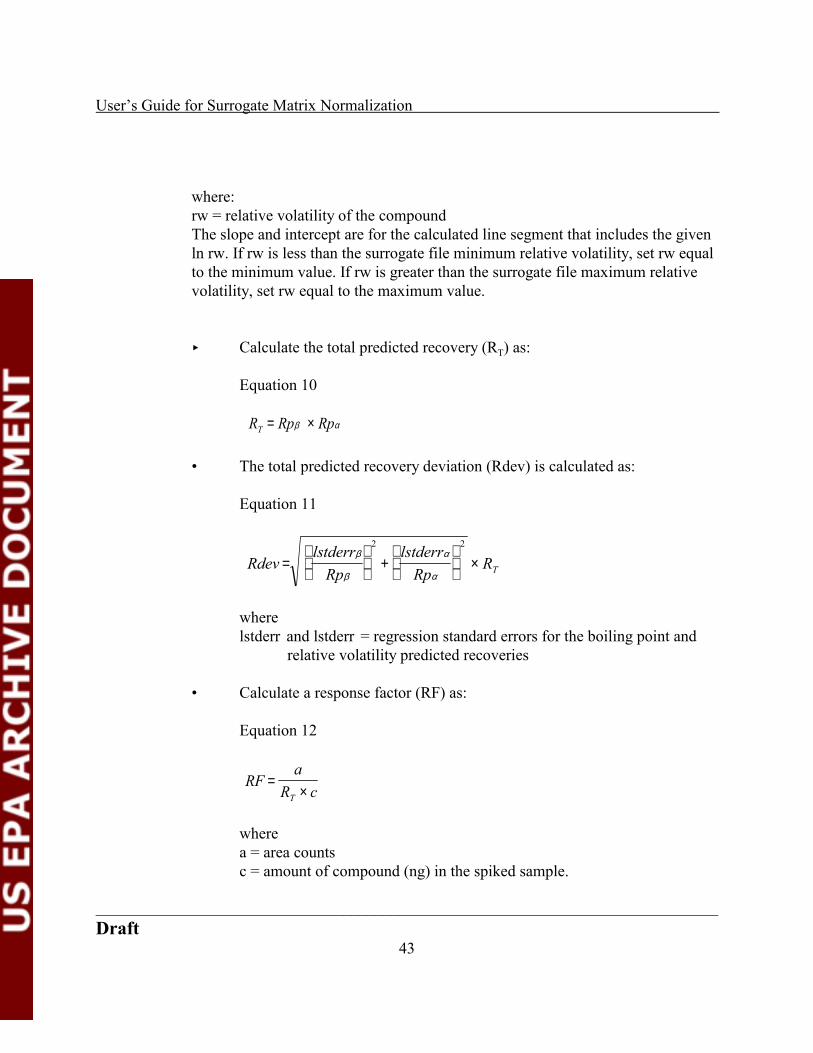
where:rw = relative volatility of the compoundThe slope and intercept are for the calculated line segment that includes the givenln rw. If rw is less than the surrogate file minimum relative volatility, set rw equalto the minimum value. If rw is greater than the surrogate file maximum relativevolatility, set rw equal to the maximum value.
� Calculate the total predicted recovery (RT) as:
Equation 10
R Rp RpT = ×β α
• The total predicted recovery deviation (Rdev) is calculated as:
Equation 11
RdevlstderrRp
lstderrRp
RT=
+
×
β
β
α
α
2 2
wherelstderr and lstderr = regression standard errors for the boiling point and
relative volatility predicted recoveries
• Calculate a response factor (RF) as:
Equation 12
RFa
R cT=
×
wherea = area countsc = amount of compound (ng) in the spiked sample.
User’s Guide for Surrogate Matrix Normalization
______________________________________________________________________________Draft
44
Ra
c RFs
s
=×
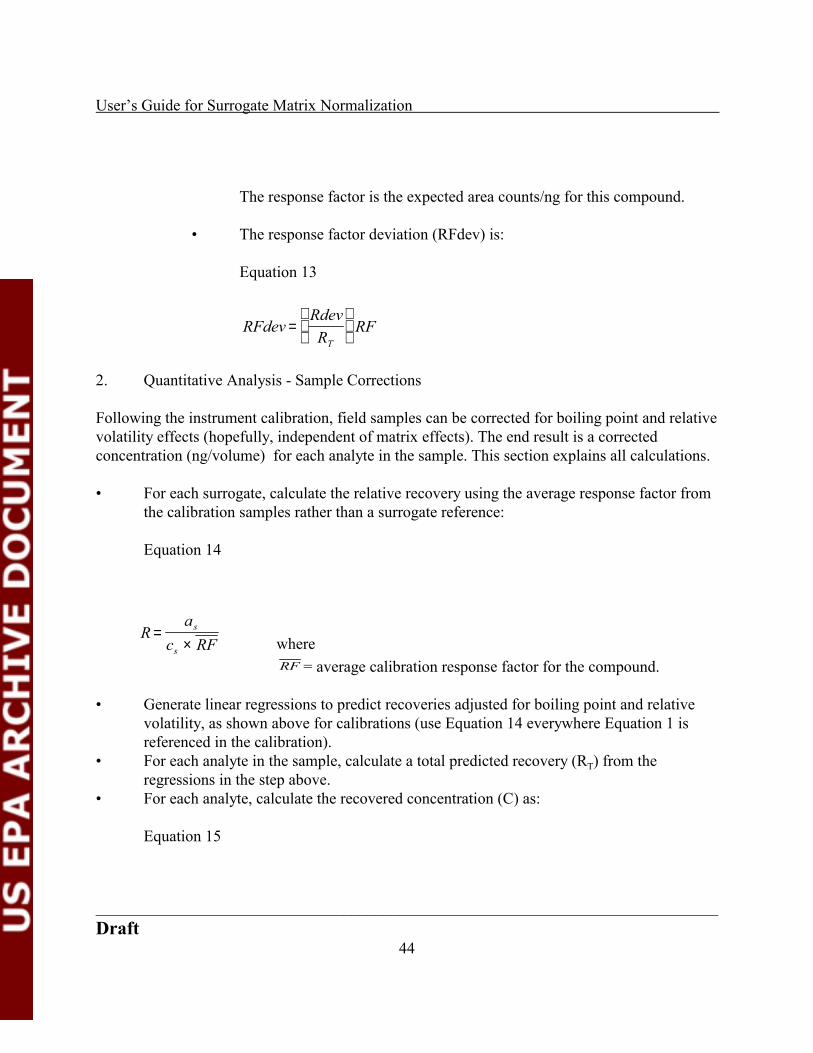
The response factor is the expected area counts/ng for this compound.
• The response factor deviation (RFdev) is:
Equation 13
RFdevRdevR
RFT
=
2. Quantitative Analysis - Sample Corrections
Following the instrument calibration, field samples can be corrected for boiling point and relativevolatility effects (hopefully, independent of matrix effects). The end result is a correctedconcentration (ng/volume) for each analyte in the sample. This section explains all calculations.
• For each surrogate, calculate the relative recovery using the average response factor fromthe calibration samples rather than a surrogate reference:
Equation 14
where= average calibration response factor for the compound.RF
• Generate linear regressions to predict recoveries adjusted for boiling point and relativevolatility, as shown above for calibrations (use Equation 14 everywhere Equation 1 isreferenced in the calibration).
• For each analyte in the sample, calculate a total predicted recovery (RT) from theregressions in the step above.
• For each analyte, calculate the recovered concentration (C) as:
Equation 15

User’s Guide for Surrogate Matrix Normalization
______________________________________________________________________________Draft
45
Ca
RF R ss
T
=× ×
wheres = sample size.
• The concentration deviation is calculated as:
Equation 16
Cdev CRdevRT
=
3. Quantitative Analysis - Check Calibration
A check calibration is performed to compare response factors from a sample run with thosecalculated by a calibration. This aids in determining the quality of the data. A check calibrationconsists of the following:• Calculate response factors (RF) for each compound in a sample using the same
procedures shown for a calibration above. Use Equation 14 in place of Equation 1 tocalculate relative recoveries..
• The percent difference (%Diff) between the calibration and sample response factors isgiven by:
Equation 17
%DiffRF RF
RFcheck=
−
×100
whereRFcheck = response factor for the sample file.

User’s Guide for Surrogate Matrix Normalization
______________________________________________________________________________Draft
46
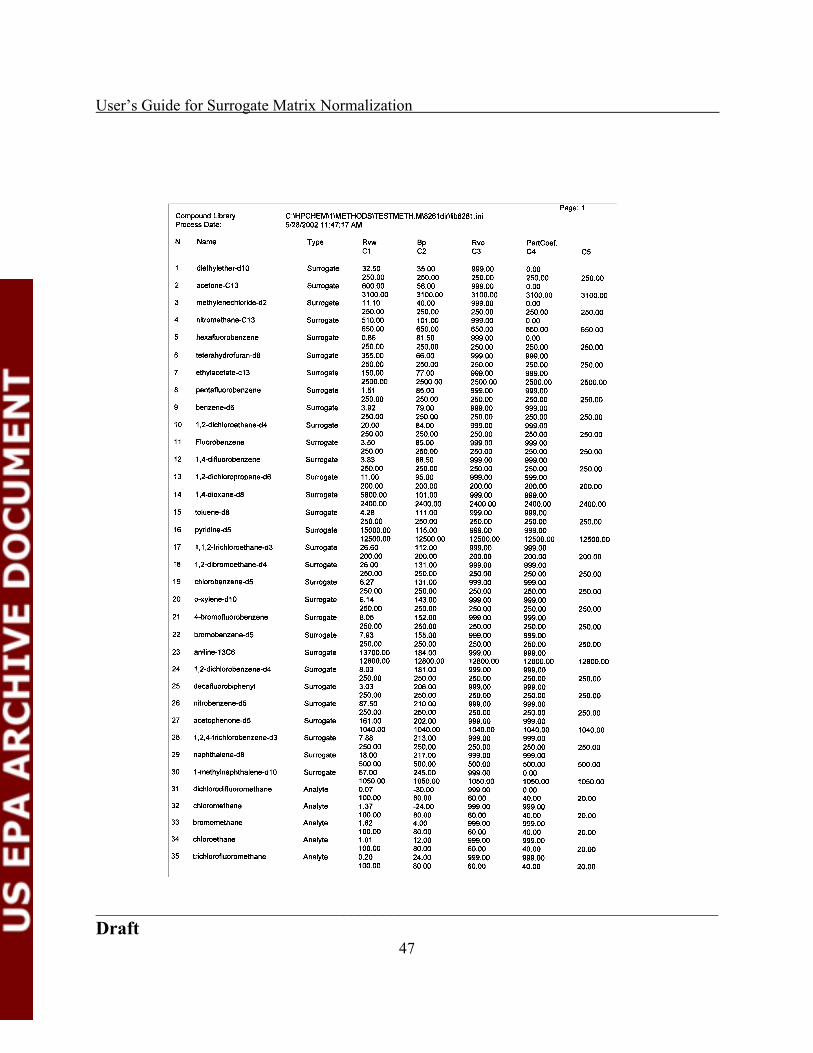
APPENDIX 6SAMPLE 8261 COMPOUND LIBRARY LISTING
The following page is a sample listing of the 8261 compound library. This listing is printed fromthe compound edit dialog box (Figure 6) “Print” button. The columns and rows of this listingcontain the following items:• The compound number (N) in the 8261 library is equivalent to the position of the
compound in the ChemStation quantitation library.• The compound name (Name).• The compound type (Type) – surrogate or analyte.• The rest of the row lists the relative volatility – water (Rvw), boiling point (Bp), relative
volatility – organic (Rvo), and partition coefficient (PartCoef.).. 999's in this row aredefault values meaning there has been no user entry made.
• The next row (C1 - C5) lists the calibration concentrations prepared for this compound.99s in this row are default values. Surrogates are present at the same concentration in allsamples, thus all entries are the same for surrogates.
User’s Guide for Surrogate Matrix Normalization
______________________________________________________________________________Draft
47

User’s Guide for Surrogate Matrix Normalization
______________________________________________________________________________Draft
48
APPENDIX 7CALIBRATION REPORT
The calibration report is printed from the create calibration or review calibration forms (Figures10 and 12), or from the ‘Print Calibration File’ option of the Method 8261 menu. A samplecalibration report is included in this appendix. It shows the response factors (area counts/ng) foreach compound in the calibration standard samples.
The report header lists:• The calibration file, if the calibration has been saved.• The date and time the report was printed.• The surrogate file.• The 8261 library file.• The file names for the standard samples included in the calibration.• The surrogate reference file.
For 1 to N compounds, the report shows:• Compound name and the concentrations (ng) of the compound in each standard sample.• For each calibration standard sample, the response factor (resp) and the recovery percent
deviation (%dev).• The average response factor (Ave), standard deviation of the response factors (dev), and
percent standard deviation (rel dev).
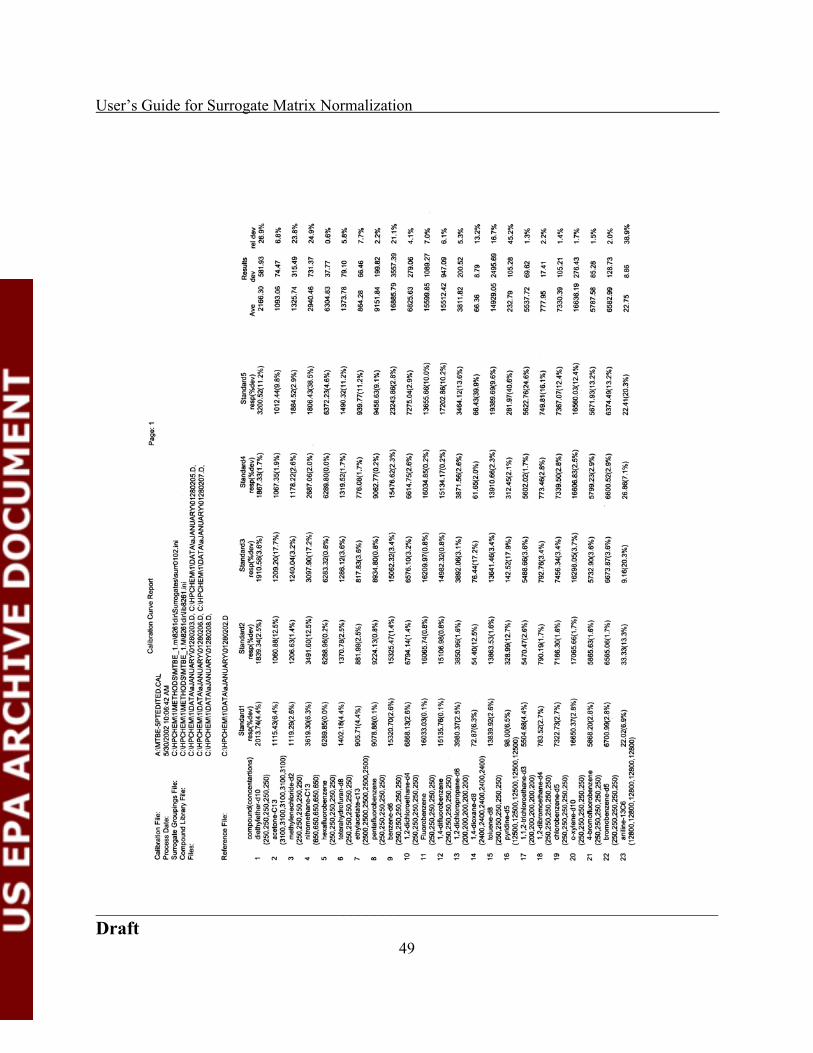
User’s Guide for Surrogate Matrix Normalization
______________________________________________________________________________Draft
49

User’s Guide for Surrogate Matrix Normalization
______________________________________________________________________________Draft
50
APPENDIX 8SURROGATE REPORT
The surrogate report depicts the calibration ‘curves’ (set of linear regressions) for a sample.These curves characterize the boiling point and relative volatility effects for sample surrogates.The two pages of a surrogate report are explained in this appendix, along with samplecalculations based on equations in Appendix 5.
Page 1 of the surrogate report includes the following:
• The report header lists:� The report date and time.� The 8261 library file.� The surrogate data file.� The sample data path – the actual data file is the path name + ‘\results.ini’. The
Method 8261 program creates results.ini. This file contains area counts.� The surrogate reference data path – the actual data file is the path name +
‘\results.ini’.
• First pass surrogates� The first pass surrogate groupings are shown. First pass surrogate groupings
always consist of two surrogates. In this example, there are four first passsurrogates comprising three first pass groups. The surrogates are listed, followedby the boiling point (BP) and relative volatility-water (rw).
� The measured recovery (Meas.) is calculated as shown in Appendix 5, Equation 1or 14 (depending on whether the surrogate reports is for a calibration or aquantitation - this example report is from a quantitation, so Equation 14 is used),with the final result expressed as a percent. For hexafluorobenzene:• as (from c:\hpchem\1\data\aJanuary\01280205.D\results.ini) = 1045950• cs (from lib8261.ini) = 250• = 6304.83 (the average response factor for hexafluorobenzene - shownRF
in the Calibration Report - Appendix 6).
66 361045950 250
6304 83100.
/.
= ×

User’s Guide for Surrogate Matrix Normalization
______________________________________________________________________________Draft
51

User’s Guide for Surrogate Matrix Normalization
______________________________________________________________________________Draft
52
• The slope, intercept (Int.), and regression error express as a percent (Err%) arecalculated for each first pass group using X = measured recovery (not as apercent) and Y = ln(rw). Since the linear regression has only two points, the erroris 0.NOTE: There is a distortion in the graphs introduced by the fact that results inthis report are expressed in percent, but actual calculations are not.
• The predicted recovery (Recovery(%)) is predicted from the curve (Appendix 5,Equation 5). Since hexafluorobenzene is an endpoint of the curve, the predictedrecovery is the same as the measured recovery.
• Boiling point surrogates� For pentafluorobenzene, the measured recovery is:
70161605270 250
915184100.
/.
= ×
� The predicted recovery is the measured recovery divided by the predicted recovery for pentafluorobenzene using the first pass curves (Appendix 5, Equations 5 and6). Use the regression for first pass group 1, as the relative volatility of 1.51 fallswithin that group:
( )98 797016
151 0 08279 0 6761.
.ln . . .
=× +
� The slope, intercept, and regression error are calculated for each boiling pointgroup defined in the surrogate file. X = predicted recovery (not percent) and Y =boiling point (BP).
• Relative volatility surrogates� For hexafluorobenzene, the measured recovery is 66.36.� The predicted recovery is the measured recovery divided by the predicted recovery
for hexafluorobenzene using the boiling point curve. In Appendix 5, it is notedthat for boiling points less than the lowest boiling point surrogate (in this case,85°C), the predicted recovery is 1 (100%). Thus the predicted recovery forhexafluorobenzene (bp 81.5°C) is the same as the measured recovery.
� Pyridine-d5 has a boiling point of 115°C. The predicted recovery for pyridine-d5,

User’s Guide for Surrogate Matrix Normalization
______________________________________________________________________________Draft
53
11172135560 650
2940 46100.
/.
= ×
using the first boiling point group, is:
( )17110166 74
115 0 0006627 08983.
.. .
=× +
� The slope, intercept, and regression error are calculated for each relative volatility group defined in the surrogate file. X = predicted recovery (not percent) and Y =ln rw.
Page 2 of the surrogate report shows predicted results for check surrogates. It includes thefollowing information:
• The report header lists:� The report date and time.� The 8261 library file.� The surrogate data file.� The sample data path – the actual data file is the path name + ‘\results.ini’.� The calibration file.
• The check surrogates are grouped by physical properties. For each check surrogate, thefollowing information is shown:� Compound name� Boiling point� Relative volatility-water� The relative recovery (Recovery) is based on the sample area counts and the
calibration response factor. For nitromethane-C13, the calibration response factoris shown in Appendix 6:
� The boiling point predicted recovery and error (B.P. Predict/err) are found usingboiling point group one:
( )965 101 0 0006627 08983 100. . .= × + ×

User’s Guide for Surrogate Matrix Normalization
______________________________________________________________________________Draft
54

User’s Guide for Surrogate Matrix Normalization
______________________________________________________________________________Draft
55
9 9066965
055734
0 978 1002 2
...
.
..=
+
× ×
44 20655965
309908
1275 1002 2
...
.
..=
+
× ×
error = .0655
� The relative volatilitypredicted recovery and error
(R.V. Predict/err) are found using relative volatility group five (because groups 4 and 5 shareendpoints, the low endpoint of group 5 is 477.5 - see Appendix 3):
( )( )908 510 01618 01011 100. ln . .= × + − ×error = .309
� The total predicted recovery (Total Predict) is the product of the boiling point andrelative volatility predicted recoveries:
( )87 6 0 965 0 908 100. . . .= × ×
� The total predicted error (in percent) is given by Equation 11, Appendix 5:
30 40655965
309908
876 1002 2
...
.
..=
+
× ×
� The corrected recovery (Recovery) is the measured recovery divided by thepredicted recovery:
127 5111787 6
...
=
� The corrected recovery error (in percent) is given by:
• The group averages are arithmetic means.

User’s Guide for Surrogate Matrix Normalization
______________________________________________________________________________Draft
56
APPENDIX 9QUANTITATION REPORT
The quantitation report shows correction results for analytes only. There are two version of thisreport – a printout and a semicolon delimited text file – that are printed from the Process Filesdialog box (Figure 16). The printout includes the following information:
• Report header� ‘File Identification’ is the sample file being reported. This is a directory path. The
file which contains the sample area counts is the path + ‘\results.ini’.� The date and time the report was printed.� The sample size (ml or g).� The sample type.� Comments.� The calibration file used for calculations.� The 8261 library file used.� The surrogate file used to define surrogate groups.
• For each analyte:� The compound name.� The concentration (ng/volume) of the analyte in the sample.� The concentration deviation (ng/volume).� The predicted total recovery.� The total recovery deviation.
Calculations used in this report are explained in Appendix 5, section 2. The specific surrogatereport for the quantitation must be used to duplicate the values in the report. See Appendix 8 foran explanation of the surrogate report.
The second example listing is the semicolon delimited text file. This report is automaticallysaved in each data directory in the Process Files dialog list box (see section 3.1.4.1 – “Process”button). It can also be displayed in a NotePad window (section 2.1.2.15 – “Review” button). Thisreport can be imported into a spreadsheet for any desired further processing. The listing includescolumn headings (PM refers to the ± sign).

User’s Guide for Surrogate Matrix Normalization
______________________________________________________________________________Draft
57

User’s Guide for Surrogate Matrix Normalization
______________________________________________________________________________Draft
58

User’s Guide for Surrogate Matrix Normalization
______________________________________________________________________________Draft
59
APPENDIX 10CHECK CALIBRATION REPORT
This report compares analyte recoveries from a sample run with the analyte recoveries in thecalibration. It includes the following information:
• Report header� The calibration file used for calculations.� The date and time the report was printed.� The surrogate file containing the surrogate groups used.� The check standard file being reported. This is a directory path. The file which
contains the sample area counts is the path + ‘\results.ini’.• For each analyte:
� The response factor shown in the calibration file shown in the header.� The response factor deviation listed the calibration file.� The concentration (ng) of the analyte in the check standard.� The predicted recovery for the check standard.� The recovery deviation for the check standard.� The response factor for the check standard.� The percent difference between the calibration response factor and the check
standard response factor.
Calculations in this report are shown in Appendix 5, section 3. The specific surrogate report forthe check calibration must be used to duplicate the values in the report. See Appendix 8 for anexplanation of the surrogate report.

User’s Guide for Surrogate Matrix Normalization
______________________________________________________________________________Draft
60
User’s Guide for Surrogate Matrix Normalization
______________________________________________________________________________Draft
61

User’s Guide for Surrogate Matrix Normalization
______________________________________________________________________________Draft
62
APPENDIX 11MDL REPORT
This is about as simple as it gets. Zeros for MDLs indicate that there is no MDL calculated.

User’s Guide for Surrogate Matrix Normalization
______________________________________________________________________________Draft
63
APPENDIX 12LIBRARY SYNCHRONIZATION PRINTOUT
This report is produced when the Method 8261 library and the surrogate file are not synchronized– that is, the surrogate file does not include same surrogate compounds as the Method 8261library and in the same order. On the left side, the surrogate compounds are listed, along withsurrogate groupings. ‘CS’ and ‘FP’ following a compound mean that the compound is a checksurrogate or first pass surrogate. Relative volatility and boiling point groups are indicated byrvwg# and bpg#, where # is replaced by the appropriate group number. On the right side thecorresponding Method 8261 library compounds are listed.
For example, in the following report:• Surrogate compound 1 – diethylether-d10 – is a member of relative volatility groups 3
and 4. Library compound 1 is diethylether-d10 – the ‘=’ sign shows that the compoundsare the same in both libraries.
• Surrogate compound 4 – nitromethane-C13 – is a check surrogate. Library compound 4 isalso nitromethane-C13.
• Surrogate compound 24 – 1,2-dichlorobenzene-d5 – is a member of boiling point group2. The Method 8261 library shows compound 24 as 1,2-dichlorobenzene-d4. If thespelling of this compound was changed from 1,2-dichlorobenzene-d5, the surrogatecompound can safely be renamed to match. However, if the libraries have distinctlydifferent compounds, the surrogate file must be recreated to match the Method 8261library. Because all surrogate settings are listed, the surrogate file can largely berecreated.
• All analytes are listed, but have no corresponding entries in the surrogate file.

User’s Guide for Surrogate Matrix Normalization
______________________________________________________________________________Draft
64

User’s Guide for Surrogate Matrix Normalization
______________________________________________________________________________Draft
65