User Guide - srtr.org Health (INIM). The report has three main sections: A. Program Summary B....
33
Indiana University Health Center Code: INIM Transplant Program (Organ): Lung Release Date: January 7, 2019 Based on Data Available: October 31, 2018 SRTR Program-Specific Report Feedback?: [email protected] 1.877.970.SRTR (7787) http://www.srtr.org The data reported here were prepared by the Scientific Registry of Transplant Recipients (SRTR) under contract with the Health Resources and Services Administration (HRSA). Page: i User Guide This report contains a wide range of useful information about the lung transplant program at Indiana University Health (INIM). The report has three main sections: A. Program Summary B. Waiting List Information C. Transplant Information The Program Summary is a one-page summary highlighting characteristics of the program, including the number of candidates on the waiting list, the number of transplants performed at the program, the number of patients being cared for by the program, and patient outcomes, including outcomes while on the waiting list (the transplant rate and the death rate while on the waiting list) and outcomes after transplant (patient and graft survival probabilities). If the program performed transplants in both adults and children, survival probabilities for adults and children (pediatrics) are provided separately. For each of the outcomes measures presented, a comparison is provided showing what would be expected at this program if it were performing as similar programs around the country perform when treating similar patients. More details regarding these outcome measures are provided in Sections B and C of the report. The Waiting List Information section contains more detailed information on how many candidates are on the waiting list at the program, the types of candidates on the waiting list, how long candidates typically have to wait for a transplant at this program, how frequently candidates successfully receive a transplant, and how often candidates on the waiting list die before receiving a transplant. Table B1 shows the activity on this program's waiting list during two recent 1-year periods and provides comparisons to all programs within this program's OPTN region (see http://optn.transplant.hrsa.gov/members/regions.asp for information on OPTN regions) and the nation as a whole. Tables B2 and B3 describe the candidates on the waiting list at this program, with comparisons to candidates waiting in the same donor service area (OPO/DSA) the OPTN region, and the nation as a whole. Table B4 shows how many candidates were removed from the waiting list because they received a transplant. The program's transplant rate is calculated as the number of candidates who received a transplant divided by the person-years observed at the program (person-years is a combination of how many candidates were on the waiting list along with how long each candidate was followed since some candidates are not on the waiting list for the entire year). The transplant rate and comparisons to what would be expected at this program are presented in Figures B1 and B2. Figure B1 shows the transplant rate compared to what was expected at this program. The expected transplant rate is an estimate of what we would expect at this program if it were performing transplants at rates similar to other programs in the US with similar candidates on their waiting lists. The expected rate is only an estimate, and is made with a certain level of uncertainty. This uncertainty is shown in Figure B2. Figure B2 displays the ratio of the observed to the expected transplant rate. A ratio of 1 indicates that the observed transplant rate was equal to the expected transplant rate, while a ratio less than 1 indicates the observed rate was lower than expected rate and a ratio greater than 1 indicates the observed rate was higher than the expected rate. However, the level of uncertainty must be considered when interpreting these numbers. The 95% interval is also shown on Figure B2. This interval provides a range within which the true ratio of observed to expected transplant rates is likely to be. If this
Transcript of User Guide - srtr.org Health (INIM). The report has three main sections: A. Program Summary B....

Indiana University HealthCenter Code: INIMTransplant Program (Organ): LungRelease Date: January 7, 2019Based on Data Available: October 31, 2018
SRTR Program-Specific ReportFeedback?: [email protected] (7787)http://www.srtr.org
The data reported here were prepared by the Scientific Registry of Transplant Recipients (SRTR)under contract with the Health Resources and Services Administration (HRSA). Page: i
User Guide
This report contains a wide range of useful information about the lung transplant program at IndianaUniversity Health (INIM). The report has three main sections:
A. Program SummaryB. Waiting List InformationC. Transplant Information
The Program Summary is a one-page summary highlighting characteristics of the program, includingthe number of candidates on the waiting list, the number of transplants performed at the program, thenumber of patients being cared for by the program, and patient outcomes, including outcomes while onthe waiting list (the transplant rate and the death rate while on the waiting list) and outcomes aftertransplant (patient and graft survival probabilities). If the program performed transplants in both adultsand children, survival probabilities for adults and children (pediatrics) are provided separately. For eachof the outcomes measures presented, a comparison is provided showing what would be expected atthis program if it were performing as similar programs around the country perform when treating similarpatients. More details regarding these outcome measures are provided in Sections B and C of thereport.
The Waiting List Information section contains more detailed information on how many candidates areon the waiting list at the program, the types of candidates on the waiting list, how long candidatestypically have to wait for a transplant at this program, how frequently candidates successfully receive atransplant, and how often candidates on the waiting list die before receiving a transplant.
Table B1 shows the activity on this program's waiting list during two recent 1-year periods and providescomparisons to all programs within this program's OPTN region (seehttp://optn.transplant.hrsa.gov/members/regions.asp for information on OPTN regions) and the nationas a whole. Tables B2 and B3 describe the candidates on the waiting list at this program, withcomparisons to candidates waiting in the same donor service area (OPO/DSA) the OPTN region, andthe nation as a whole.
Table B4 shows how many candidates were removed from the waiting list because they received atransplant. The program's transplant rate is calculated as the number of candidates who received atransplant divided by the person-years observed at the program (person-years is a combination of howmany candidates were on the waiting list along with how long each candidate was followed since somecandidates are not on the waiting list for the entire year). The transplant rate and comparisons to whatwould be expected at this program are presented in Figures B1 and B2. Figure B1 shows thetransplant rate compared to what was expected at this program. The expected transplant rate is anestimate of what we would expect at this program if it were performing transplants at rates similar toother programs in the US with similar candidates on their waiting lists. The expected rate is only anestimate, and is made with a certain level of uncertainty. This uncertainty is shown in Figure B2. FigureB2 displays the ratio of the observed to the expected transplant rate. A ratio of 1 indicates that theobserved transplant rate was equal to the expected transplant rate, while a ratio less than 1 indicatesthe observed rate was lower than expected rate and a ratio greater than 1 indicates the observed ratewas higher than the expected rate. However, the level of uncertainty must be considered wheninterpreting these numbers. The 95% interval is also shown on Figure B2. This interval provides arange within which the true ratio of observed to expected transplant rates is likely to be. If this

Indiana University HealthCenter Code: INIMTransplant Program (Organ): LungRelease Date: January 7, 2019Based on Data Available: October 31, 2018
SRTR Program-Specific ReportFeedback?: [email protected] (7787)http://www.srtr.org
The data reported here were prepared by the Scientific Registry of Transplant Recipients (SRTR)under contract with the Health Resources and Services Administration (HRSA). Page: ii
User Guide
confidence interval includes (crosses) 1.0, then we cannot say that this program's observed transplantrate is different from what would be expected. The observed deceased donor transplant rate at thisprogram was 567.5 per 100 person-years. Transplant rates are also provided for adult and pediatricpatients separately along with comparisons to adult and pediatric rates in the DSA, the OPTN region,and the nation. Please refer to the PSR Technical Methods documentation available athttp://www.srtr.org for more detail regarding how expected rates are calculated.
The death rate (also known as the mortality rate) for candidates on the waiting list is presented in TableB5 and Figures B4-B6. These data are presented in the same way as the transplant rate data in theprevious section. The intent of these tables and figures is to describe risk of death once candidates arelisted rather than while they are listed. Therefore, time at risk and deaths after removal from the waitinglist for reasons other than transplant, transfer to another transplant program, or recovery (no longerneeding a transplant), and before any subsequent transplant, are included. As with transplant rates,mortality rates should be interpreted carefully taking into consideration the interval displayed in FigureB5. For a complete description of how observed and expected mortality rates are calculated, pleaserefer to the technical documentation available at http://www.srtr.org.
Table B6 presents information on what happens to candidates on the waiting list by three different timepoints after listing: 6 months, 12 months, and 18 months. The table displays percentages of candidateswho have died, been removed from the waiting list, been transplanted, or been transferred orlost-to-follow-up. Tables B7 and B8 provide more detail regarding how many candidates have receiveda deceased donor transplant by certain time points during the first 3 years after being put on thetransplant waiting list. Each row of Tables B7 and B8 presents the percent of candidates who receiveda deceased donor transplant by each time point. Table B9 presents data on the time it took for differentpercentages of patients to be transplanted for candidates added to the list between 07/01/2012 and12/31/2017. The time it took for 5% (the 5th percentile) of patients to receive a transplant at thisprogram was 0.1 months. If "Not Observed" is displayed in the table, then too few candidates receivedtransplants before 06/30/2018 to calculate a particular percentile of transplant times.
Table B10 contains a summary of the offer acceptance practices of the program. The offer acceptanceratio indicates whether the program is more or less likely to accept offers than the average program. Ifthe offer acceptance ratio is greater than 1.0, then the program tends to accept more offers thanaverage; if the offer acceptance ratio is less than 1.0, then the program tends to accept fewer offersthan average. Figures B7 shows the distribution of program offer acceptance rates as well as the offeracceptance rate for this program. Figures B8 - B11 similarly show offer acceptance rates for subsets ofoffers.
The Transplant Information section begins with descriptions of transplant recipients in Tables C1 andC2. Data on recipients of deceased donor transplants are presented (Tables C1D and C2D); ifapplicable, data on recipients of living donor transplants are presented separately (Tables C1L andC2L). Comparisons to the region and the nation as a whole are provided. A description of thedeceased donors used at this program is provided in Table C3D, along with characteristics of livingdonors in Table C3L, if applicable. Finally, information on the transplant procedure for deceased andliving donor transplants is presented in Tables C4D and C4L, respectively.

Indiana University HealthCenter Code: INIMTransplant Program (Organ): LungRelease Date: January 7, 2019Based on Data Available: October 31, 2018
SRTR Program-Specific ReportFeedback?: [email protected] (7787)http://www.srtr.org
The data reported here were prepared by the Scientific Registry of Transplant Recipients (SRTR)under contract with the Health Resources and Services Administration (HRSA). Page: iii
User Guide
Starting with Table C5, transplant outcomes are presented along with comparisons to what would beexpected at this program and what happened in the nation as a whole. Tables C5-C10 presentinformation on graft survival (survival of the transplanted organ), with data presented separately foradult and pediatric recipients. Patients are followed from the time of transplant until either failure of thetransplanted organ or death, whichever comes first. Please refer to the technical methods for moreinformation on these calculations (http://www.srtr.org).
While Tables C5-C10 present data on graft survival, Tables C11-C16 present information on patientsurvival. For these tables, patients are followed from the time of transplant until death, regardless ofwhether the transplant is functioning or the patient required another transplant to survive.
Tables C17 and C18 summarize the multiorgan transplant outcomes at this program. The summarystatistics in these tables are descriptive and are not risk-adjusted for different donor and candidatecharacteristics.
Additional information regarding the technical methods and the risk adjustment models used toestimate expected event rates is available on the SRTR website at http://www.srtr.org. We welcomeand encourage feedback on these reports. Please feel free to share feedback with the SRTR at thefollowing e-mail: [email protected].

Indiana University HealthCenter Code: INIMTransplant Program (Organ): LungRelease Date: January 7, 2019Based on Data Available: October 31, 2018
SRTR Program-Specific ReportFeedback?: [email protected] (7787)http://www.srtr.org
The data reported here were prepared by the Scientific Registry of Transplant Recipients (SRTR)under contract with the Health Resources and Services Administration (HRSA). Page: iv
Table of Contents
Section Page
User Guide iA. Program SummaryProgram Summary 1B. Waiting List InformationWaiting list activity 2Demographic characteristics of waiting list candidates 3Medical characteristics of waiting list candidates 4Deceased donor transplant rates 5Waiting list mortality rates 6Waiting list candidate status after listing 7Percent of candidates with deceased donor transplants: demographic characteristics 8Percent of candidates with deceased donor transplants: medical characteristics 9Time to transplant for waiting list candidates 10Offer acceptance practices 11C. Transplant InformationDeceased donor transplant recipient demographic characteristics 13Deceased donor transplant recipient medical characteristics 14Deceased donor characteristics 15Deceased donor transplant characteristics 16Deceased donor graft survival 17Deceased donor patient survival 23Multi-organ transplant graft survival 29Multi-organ transplant patient survival 29

Indiana University HealthCenter Code: INIMTransplant Program (Organ): LungRelease Date: January 7, 2019Based on Data Available: October 31, 2018
SRTR Program-Specific ReportFeedback?: [email protected] (7787)http://www.srtr.org
The data reported here were prepared by the Scientific Registry of Transplant Recipients (SRTR)under contract with the Health Resources and Services Administration (HRSA). Page: 1
A. Program Summary
Figure A1. Waiting list and transplant activity
Totaltransplants
New additionsto the waiting list
Activeon waiting list*
Totalon waiting list*
60
63
62
73
10
11
11
12
* At the end of the 12-month period07/01/2016 - 06/30/2017 07/01/2017 - 06/30/2018
Table A1. Census of transplant recipients
07/01/2016- 07/01/2017-Recipients
06/30/2017 06/30/2018
Transplanted at this center 63 60Followed by this center* 327 352
...transplanted at this program 319 345
...transplanted elsewhere 8 7
* Recipients followed are transplant recipients for whom thecenter has submitted a post-transplant follow-up form for atransplant that took place before the 12-month interval foreach column.
Figure A2. Transplant rates07/01/2016 - 06/30/2018
Rat
e p
er 1
00P
erso
n Y
ears
Deceased donortransplant rate
0
100
200
300
400
500
600
700
567.5 227.1
Observed Expected
Figure A3. Waiting list mortality rates07/01/2016 - 06/30/2018
Rat
e p
er 1
00P
erso
n Y
ears
Waiting listmortality rate
0
5
10
15
13.6 9.9
Observed Expected
Figure A4. First-year adult graft and patientsurvival: 07/01/2015 - 12/31/2017
Graft Failures(145 transplants)
Patient Deaths(144 transplants)
0
5
10
15
10.0
0
14.0
7
9.00
13.9
4
Observed Expected
Figure A5. First-year pediatric graft and patientsurvival: 07/01/2015 - 12/31/2017
This center did not perform anytransplants relevant to
this figure during07/01/2015-12/31/2017

Indiana University HealthCenter Code: INIMTransplant Program (Organ): LungRelease Date: January 7, 2019Based on Data Available: October 31, 2018
SRTR Program-Specific ReportFeedback?: [email protected] (7787)http://www.srtr.org
The data reported here were prepared by the Scientific Registry of Transplant Recipients (SRTR)under contract with the Health Resources and Services Administration (HRSA). Page: 2
B. Waiting List Information
Table B1. Waiting list activity summary: 07/01/2016 - 06/30/2018
Activity for 07/01/2017 to 06/30/2018Counts for
as percent of registrants on waiting listthis center
on 07/01/2017Waiting List Registrations 07/01/2016- 07/01/2017- This Center OPTN Region U.S.
06/30/2017 06/30/2018 (%) (%) (%)
On waiting list at start 4 12 100.0 100.0 100.0Additions
New listings at this center 73 62 516.7 178.8 225.0Removals
Transferred to another center 0 0 0.0 1.5 1.3Received living donor transplant* 0 0 0.0 0.0 0.0Received deceased donor transplant* 63 60 500.0 156.7 176.2Died 2 0 0.0 14.8 16.2Transplanted at another center 0 0 0.0 2.0 3.1Deteriorated 0 2 16.7 9.4 10.0Recovered 0 0 0.0 1.0 3.2Other reasons 0 1 8.3 6.9 10.0
On waiting list at end of period 12 11 91.7 86.7 105.0
* These patients were removed from waiting list with removal code indicating transplant; this may not equal thenumber of transplants performed at this center during the specified period.
Indiana University HealthCenter Code: INIMTransplant Program (Organ): LungRelease Date: January 7, 2019Based on Data Available: October 31, 2018
SRTR Program-Specific ReportFeedback?: [email protected] (7787)http://www.srtr.org
The data reported here were prepared by the Scientific Registry of Transplant Recipients (SRTR)under contract with the Health Resources and Services Administration (HRSA). Page: 3
B. Waiting List Information
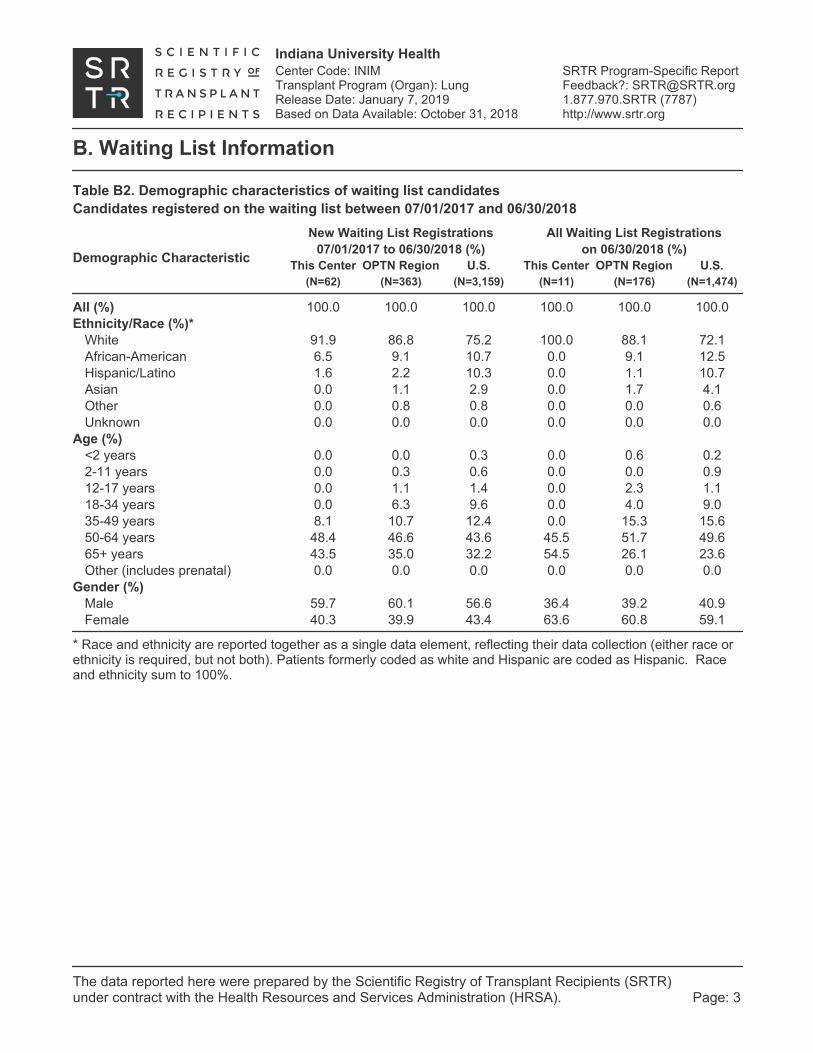
Table B2. Demographic characteristics of waiting list candidatesCandidates registered on the waiting list between 07/01/2017 and 06/30/2018
New Waiting List Registrations All Waiting List Registrations07/01/2017 to 06/30/2018 (%) on 06/30/2018 (%)
Demographic CharacteristicThis Center OPTN Region U.S. This Center OPTN Region U.S.
(N=62) (N=363) (N=3,159) (N=11) (N=176) (N=1,474)
All (%) 100.0 100.0 100.0 100.0 100.0 100.0Ethnicity/Race (%)*
White 91.9 86.8 75.2 100.0 88.1 72.1African-American 6.5 9.1 10.7 0.0 9.1 12.5Hispanic/Latino 1.6 2.2 10.3 0.0 1.1 10.7Asian 0.0 1.1 2.9 0.0 1.7 4.1Other 0.0 0.8 0.8 0.0 0.0 0.6Unknown 0.0 0.0 0.0 0.0 0.0 0.0
Age (%)<2 years 0.0 0.0 0.3 0.0 0.6 0.22-11 years 0.0 0.3 0.6 0.0 0.0 0.912-17 years 0.0 1.1 1.4 0.0 2.3 1.118-34 years 0.0 6.3 9.6 0.0 4.0 9.035-49 years 8.1 10.7 12.4 0.0 15.3 15.650-64 years 48.4 46.6 43.6 45.5 51.7 49.665+ years 43.5 35.0 32.2 54.5 26.1 23.6Other (includes prenatal) 0.0 0.0 0.0 0.0 0.0 0.0
Gender (%)Male 59.7 60.1 56.6 36.4 39.2 40.9Female 40.3 39.9 43.4 63.6 60.8 59.1
* Race and ethnicity are reported together as a single data element, reflecting their data collection (either race orethnicity is required, but not both). Patients formerly coded as white and Hispanic are coded as Hispanic. Raceand ethnicity sum to 100%.

Indiana University HealthCenter Code: INIMTransplant Program (Organ): LungRelease Date: January 7, 2019Based on Data Available: October 31, 2018
SRTR Program-Specific ReportFeedback?: [email protected] (7787)http://www.srtr.org
The data reported here were prepared by the Scientific Registry of Transplant Recipients (SRTR)under contract with the Health Resources and Services Administration (HRSA). Page: 4
B. Waiting List Information
Table B3. Medical characteristics of waiting list candidatesCandidates registered on the waiting list between 07/01/2017 and 06/30/2018
New Waiting List Registrations All Waiting List Registrations07/01/2017 to 06/30/2018 (%) on 06/30/2018 (%)
Medical CharacteristicThis Center OPTN Region U.S. This Center OPTN Region U.S.
(N=62) (N=363) (N=3,159) (N=11) (N=176) (N=1,474)
All (%) 100.0 100.0 100.0 100.0 100.0 100.0Blood Type (%)
O 48.4 46.0 47.7 54.5 49.4 53.1A 37.1 40.2 36.8 45.5 39.8 31.2B 12.9 9.9 11.6 0.0 8.0 12.3AB 1.6 3.9 3.9 0.0 2.8 3.5Unknown 0.0 0.0 0.0 0.0 0.0 0.0
Previous Transplant (%)Yes 0.0 1.7 3.6 0.0 0.6 2.2No 100.0 98.3 96.4 100.0 99.4 97.8Unknown 0.0 0.0 0.0 0.0 0.0 0.0
Primary Disease (%)Idiopathic Pulmonary ArterialHypertension 1.6 6.3 6.8 0.0 8.0 8.3
Cystic Fibrosis 3.2 7.7 10.2 0.0 5.7 8.9Idiopathic Pulmonary Fibrosis 48.4 54.3 55.7 45.5 31.8 41.9Emphysema/COPD 40.3 28.4 24.4 54.5 51.7 37.2Other 6.5 3.3 2.9 0.0 2.8 3.7Missing 0.0 0.0 0.0 0.0 0.0 0.0

Indiana University HealthCenter Code: INIMTransplant Program (Organ): LungRelease Date: January 7, 2019Based on Data Available: October 31, 2018
SRTR Program-Specific ReportFeedback?: [email protected] (7787)http://www.srtr.org
The data reported here were prepared by the Scientific Registry of Transplant Recipients (SRTR)under contract with the Health Resources and Services Administration (HRSA). Page: 5
B. Waiting List Information
Table B4D. Deceased donor transplant rates: 07/01/2016 - 06/30/2018
Waiting List Registrations This Center OPO/DSA Region U.S.
All CandidatesCount on waiting list at start* 4 4 214 1,436Person Years** 21.7 21.7 400.4 2,831.8Removals for Transplant 123 123 649 4,818
Adult (18+) CandidatesCount on waiting list at start* 4 4 210 1,400Person Years** 21.7 21.7 392.0 2,761.7Removals for transpant 123 123 644 4,725
Pediatric (<18) CandidatesCount on waiting list at start* -- -- -- --Person Years** -- -- -- --Removals for transplant -- -- -- --
* Counts in this table may be lower than similar counts in other waiting list tables, such as Table B1. A smallpercentage (~1%) of patients are found to have died or been transplanted before being removed from the waitinglist, so these patients are excluded if the event occurs prior to the start of the study period. Inactive time on thewaiting list is included in the calculations for this table.** Person years are calculated as days (converted to fractional years). The number of days from July 1 or fromthe date of first wait listing until death, transplant, removal from the waiting list or June 30.
Figure B1D. Observed and expected deceased donortransplant rates: 07/01/2016 - 06/30/2018
Rat
e p
er 1
00P
erso
n Y
ears
All Adult Pediatric0
100200300400500600
567.
5
227.
1
567.
5
227.
1
NA
NA
Observed Expected
Figure B2D. Deceased donortransplant rate ratio estimate
0.2
0.5
1.0
2.0
5.0
2.03
2.892.44
Est
imat
ed T
ran
spla
nt
Rat
e R
atio
Figure B3D. Observed adult (18+) and pediatric (<18)deceased donor transplant rates: 07/01/2016 - 06/30/2018
Rat
e p
er 1
00P
erso
n Y
ears
Adult (18+)0
100200300400500600
567.
5
567.
5 164.
3
171.
1
Pediatric (<18)0.0
0.2
0.4
0.6
0.8
1.0
NA
NA
NA
NA
This Center OPO/DSA Region U.S.

Indiana University HealthCenter Code: INIMTransplant Program (Organ): LungRelease Date: January 7, 2019Based on Data Available: October 31, 2018
SRTR Program-Specific ReportFeedback?: [email protected] (7787)http://www.srtr.org
The data reported here were prepared by the Scientific Registry of Transplant Recipients (SRTR)under contract with the Health Resources and Services Administration (HRSA). Page: 6
B. Waiting List Information
Table B5. Waiting list mortality rates: 07/01/2016 - 06/30/2018
Waiting List Registrations This Center OPO/DSA Region U.S.
All CandidatesCount on waiting list at start* 4 4 214 1,436Person Years** 22.0 22.0 442.1 3,245.1Number of deaths 3 3 90 592
Adult (18+) CandidatesCount on waiting list at start* 4 4 210 1,400Person Years** 22.0 22.0 431.6 3,164.0Number of deaths 3 3 90 572
Pediatric (<18) CandidatesCount on waiting list at start* -- -- -- --Person Years** -- -- -- --Number of deaths -- -- -- --
* Counts in this table may be lower than similar counts in other waiting list tables, such as Table B1. A smallpercentage (~1%) of patients are found to have died or been transplanted before being removed from the waitinglist, so these patients are excluded if the event occurs prior to the start of the study period. Inactive time on thewaiting list is included in the calculations for this table.** Person years are calculated as days (converted to fractional years). The number of days from July 1 or fromthe date of first wait listing until death, transplant, 60 days after recovery, transfer or June 30.
Figure B4. Observed and expected waiting list mortality rates:07/01/2016 - 06/30/2018
Rat
e p
er 1
00P
erso
n Y
ears
All Adult Pediatric02468
101214
13.6
9.9
13.6
9.9
NA
NA
Observed Expected
Figure B5. Waiting list mortalityrate ratio estimate
0.2
0.5
1.0
2.0
5.0
0.39
2.45
1.19
Est
imat
ed M
ort
alit
y R
ate
Rat
io
Figure B6. Observed adult (18+) and pediatric (<18)waiting list mortality rates: 07/01/2016 - 06/30/2018
Rat
e p
er 1
00P
erso
n Y
ears
Adult (18+)0
5
10
15
20
13.6
13.6
20.9
18.1
Pediatric (<18)0.0
0.2
0.4
0.6
0.8
1.0
NA
NA
NA
NA
This Center OPO/DSA Region U.S.

Indiana University HealthCenter Code: INIMTransplant Program (Organ): LungRelease Date: January 7, 2019Based on Data Available: October 31, 2018
SRTR Program-Specific ReportFeedback?: [email protected] (7787)http://www.srtr.org
The data reported here were prepared by the Scientific Registry of Transplant Recipients (SRTR)under contract with the Health Resources and Services Administration (HRSA). Page: 7
B. Waiting List Information
Table B6. Waiting list candidate status after listingCandidates registered on waiting list between 01/01/2016 and 12/31/2016
This Center (N=57) U.S. (N=2,789)Waiting list status (survival status) Months Since Listing Months Since Listing
6 12 18 6 12 18
Alive on waiting list (%) 10.5 1.8 0.0 25.3 13.4 8.1Died on the waiting list without transplant (%) 1.8 1.8 1.8 4.1 4.8 5.3Removed without transplant (%):
Condition worsened (status unknown) 0.0 0.0 0.0 3.3 3.8 4.1Condition improved (status unknown) 0.0 0.0 0.0 0.2 0.5 0.6Refused transplant (status unknown) 0.0 0.0 0.0 0.1 0.3 0.4Other 0.0 0.0 0.0 0.9 1.7 2.3
Transplant (living or deceased donor) (%):Functioning (alive) 82.5 89.5 52.6 61.7 65.2 45.7Failed-Retransplanted (alive) 0.0 0.0 0.0 0.1 0.3 0.4Failed-alive not retransplanted 0.0 0.0 0.0 0.0 0.1 0.0Died 5.3 5.3 5.3 3.5 6.5 9.9Status Yet Unknown* 0.0 1.8 40.4 0.6 3.2 23.1
Lost or Transferred (status unknown) (%) 0.0 0.0 0.0 0.1 0.1 0.2
TOTAL (%) 100.0 100.0 100.0 100.0 100.0 100.0
Total % known died on waiting list or after transplant 7.0 7.0 7.0 7.5 11.3 15.2Total % known died or removed as unstable 7.0 7.0 7.0 10.9 15.1 19.3Total % removed for transplant 87.7 96.5 98.2 65.9 75.3 79.1Total % with known functioning transplant (alive) 82.5 89.5 52.6 61.7 65.2 45.7
* Follow-up form covering specified time period not yet completed, and possibly has not become due.

Indiana University HealthCenter Code: INIMTransplant Program (Organ): LungRelease Date: January 7, 2019Based on Data Available: October 31, 2018
SRTR Program-Specific ReportFeedback?: [email protected] (7787)http://www.srtr.org
The data reported here were prepared by the Scientific Registry of Transplant Recipients (SRTR)under contract with the Health Resources and Services Administration (HRSA). Page: 8
B. Waiting List Information
Table B7. Percent of candidates with deceased donor transplants: demographic characteristicsCandidates registered on the waiting list between 07/01/2012 and 06/30/2015
Percent transplanted at time periods since listingCharacteristic This Center United States
N 30 day 1 year 2 years 3 years N 30 day 1 year 2 years 3 years
All 140 40.0 91.4 94.3 94.3 7,572 25.7 65.8 71.9 74.2Ethnicity/Race*
White 133 40.6 92.5 94.7 94.7 6,126 26.1 66.8 73.0 75.3African-American 7 28.6 71.4 85.7 85.7 692 22.4 61.3 66.8 68.5Hispanic/Latino 0 -- -- -- -- 549 26.6 64.1 69.0 71.4Asian 0 -- -- -- -- 163 21.5 57.7 61.3 62.0Other 0 -- -- -- -- 42 28.6 57.1 78.6 81.0Unknown 0 -- -- -- -- 0 -- -- -- --
Age<2 years 0 -- -- -- -- 32 25.0 62.5 62.5 62.52-11 years 0 -- -- -- -- 78 6.4 50.0 53.8 56.412-17 years 2 100.0 100.0 100.0 100.0 140 20.7 50.7 56.4 56.418-34 years 8 37.5 87.5 87.5 87.5 841 21.3 58.1 65.2 67.835-49 years 13 7.7 84.6 92.3 92.3 990 21.8 58.0 64.8 67.950-64 years 77 41.6 92.2 96.1 96.1 3,524 24.9 66.4 73.4 75.965+ years 40 45.0 92.5 92.5 92.5 1,967 32.3 73.7 77.7 79.2Other (includes prenatal) 0 -- -- -- -- 0 -- -- -- --
GenderMale 74 44.6 90.5 91.9 91.9 4,269 31.4 73.9 78.3 79.6Female 66 34.8 92.4 97.0 97.0 3,303 18.4 55.4 63.7 67.1
* Race and ethnicity are reported together as a single data element, reflecting their data collection (either race orethnicity is required, but not both). Patients formerly coded as white and Hispanic are coded as Hispanic. Raceand ethnicity sum to 100%.

Indiana University HealthCenter Code: INIMTransplant Program (Organ): LungRelease Date: January 7, 2019Based on Data Available: October 31, 2018
SRTR Program-Specific ReportFeedback?: [email protected] (7787)http://www.srtr.org
The data reported here were prepared by the Scientific Registry of Transplant Recipients (SRTR)under contract with the Health Resources and Services Administration (HRSA). Page: 9
B. Waiting List Information
Table B8. Percent of candidates with deceased donor transplants: medical characteristicsCandidates registered on the waiting list between 07/01/2012 and 06/30/2015
Percent transplanted at time periods since listingCharacteristic This Center United States
N 30 day 1 year 2 years 3 years N 30 day 1 year 2 years 3 years
All 140 40.0 91.4 94.3 94.3 7,572 25.7 65.8 71.9 74.2Blood Type
O 56 33.9 92.9 96.4 96.4 3,451 25.4 65.6 71.8 74.0A 62 45.2 88.7 91.9 91.9 2,950 26.0 65.2 71.8 74.3B 16 43.8 100.0 100.0 100.0 859 24.9 66.8 71.8 73.6AB 6 33.3 83.3 83.3 83.3 312 29.2 72.1 75.3 76.3
Previous TransplantYes 7 42.9 71.4 71.4 71.4 363 29.5 65.3 67.5 68.3No 133 39.8 92.5 95.5 95.5 7,209 25.6 65.8 72.1 74.4
Primary DiseaseCongenital Disease 0 -- -- -- -- 0 -- -- -- --Retransplant/Graft Failure 0 -- -- -- -- 0 -- -- -- --Idiopathic PulmonaryArterial Hypertension 4 0.0 100.0 100.0 100.0 339 12.4 45.4 49.6 51.9
Cystic Fibrosis 13 38.5 92.3 92.3 92.3 941 22.3 62.3 70.1 72.2Idiopathic Pulmonary Fibrosis 78 50.0 93.6 93.6 93.6 4,280 31.2 71.3 75.6 76.6Alpha-1-Antitrypsin Deficiency 0 -- -- -- -- 0 -- -- -- --Emphysema/COPD 44 27.3 86.4 95.5 95.5 1,809 17.5 59.1 68.8 73.7Other 1 0.0 100.0 100.0 100.0 203 21.7 61.6 69.0 72.9Missing 0 -- -- -- -- 0 -- -- -- --

Indiana University HealthCenter Code: INIMTransplant Program (Organ): LungRelease Date: January 7, 2019Based on Data Available: October 31, 2018
SRTR Program-Specific ReportFeedback?: [email protected] (7787)http://www.srtr.org
The data reported here were prepared by the Scientific Registry of Transplant Recipients (SRTR)under contract with the Health Resources and Services Administration (HRSA). Page: 10
B. Waiting List Information
Table B9. Time to transplant for waiting list candidates*Candidates registered on the waiting list between 07/01/2012 and 12/31/2017
Months to Transplant**Percentile Center OPO/DSA Region U.S.
5th 0.1 0.1 0.2 0.210th 0.2 0.2 0.3 0.325th 0.4 0.4 0.9 0.850th (median time to transplant) 1.2 1.2 3.2 3.375th 3.1 3.1 18.1 18.1
* If cells contain "Not Observed" fewer than that percentile of patients had received a transplant. For example, the50th percentile of time to transplant is the time when 50% of candidates have received transplants. If waitingtimes are long, then the 50th percentile may not be observed during the follow-up period for this table. Also, ifmore than 50% of candidates are removed from the list due to death or other reasons before receivingtransplants, then the 50th percentile of time to transplant will not be observed.
** Censored on 06/30/2018. Calculated as the months after listing, during which the corresponding percent ofall patients initially listed had received a transplant.

Indiana University HealthCenter Code: INIMTransplant Program (Organ): LungRelease Date: January 7, 2019Based on Data Available: October 31, 2018
SRTR Program-Specific ReportFeedback?: [email protected] (7787)http://www.srtr.org
The data reported here were prepared by the Scientific Registry of Transplant Recipients (SRTR)under contract with the Health Resources and Services Administration (HRSA). Page: 11
B. Waiting List Information
Table B10. Offer Acceptance Practices: 07/01/2017 - 06/30/2018
Offers Acceptance Characteristics This Center OPO/DSA Region U.S.
OverallNumber of Offers 733 733 6,792 41,370Number of Acceptances 59 59 317 2,458Expected Acceptances 49.2 49.2 315.3 2,454.2Offer Acceptance Ratio* 1.19 1.19 1.01 1.00 95% Credible Interval** [0.91, 1.51] -- -- --
PHS increased infectious riskNumber of Offers 261 261 2,133 12,273Number of Acceptances 16 16 95 656Expected Acceptances 16.4 16.4 92.0 654.8Offer Acceptance Ratio* 0.98 0.98 1.03 1.00 95% Credible Interval** [0.58, 1.48] -- -- --
Donor was current smokerNumber of Offers 88 88 629 4,199Number of Acceptances 10 10 32 156Expected Acceptances 4.4 4.4 21.8 156.1Offer Acceptance Ratio* 1.88 1.88 1.43 1.00 95% Credible Interval** [0.97, 3.08] -- -- --
Donor age >= 55Number of Offers 103 103 971 6,676Number of Acceptances 9 9 37 283Expected Acceptances 5.2 5.2 34.5 290.9Offer Acceptance Ratio* 1.54 1.54 1.07 0.97 95% Credible Interval** [0.77, 2.57] -- -- --
Hard-to-Place Lungs (Over 50 Offers)Number of Offers 206 206 2,669 11,242Number of Acceptances 2 2 44 202Expected Acceptances 5.3 5.3 54.5 206.9Offer Acceptance Ratio* 0.55 0.55 0.81 0.98 95% Credible Interval** [0.15, 1.20] -- -- --
Donor more than 500 miles awayNumber of Offers 106 106 907 7,870Number of Acceptances 2 2 41 319Expected Acceptances 4.2 4.2 29.3 289.8Offer Acceptance Ratio* 0.64 0.64 1.38 1.10 95% Credible Interval** [0.18, 1.41] -- -- --
* The offer acceptance ratio estimates the relative offer acceptance practice of Indiana University Health (INIM) compared tothe national offer acceptance practice. A ratio above one indicates the program is more likely to accept an offer compared tonational offer acceptance practices (e.g., an offer acceptance ratio of 1.25 indicates a 25% more likely to accept an offer),while a ratio below one indicates the program is less likely to accept an offer compared to national offer acceptancepractices (e.g., an offer acceptance ratio of 0.75 indicates a 25% less likely to accept an offer).** As an example, the 95% Credible Interval for the overall offer acceptance ratio, [0.91, 1.51], indicates the location ofINIM's true offer acceptance ratio with 95% probability. The best estimate is 19% more likely to accept an offer compared tonational acceptance behavior, but INIM's performance could plausibly range from 9% reduced acceptance up to 51% higheracceptance.

Indiana University HealthCenter Code: INIMTransplant Program (Organ): LungRelease Date: January 7, 2019Based on Data Available: October 31, 2018
SRTR Program-Specific ReportFeedback?: [email protected] (7787)http://www.srtr.org
The data reported here were prepared by the Scientific Registry of Transplant Recipients (SRTR)under contract with the Health Resources and Services Administration (HRSA). Page: 12
B. Waiting List Information
Figure B7. Offer acceptance: Overall
INIM
0.1 0.4 2.5 10NationalAverage
Lower Higher
Figure B8. Offer acceptance: PHS increased infectious risk
INIM
0.1 0.4 2.5 10NationalAverage
Lower Higher
Figure B9. Offer acceptance: Donor was current smoker
INIM
0.1 0.4 2.5 10NationalAverage
Lower Higher
Figure B10. Offer acceptance: Donor age >= 55
INIM
0.1 0.4 2.5 10NationalAverage
Lower Higher
Figure B11. Offer acceptance: Offer number > 50
INIM
0.1 0.4 2.5 10NationalAverage
Lower Higher
Figure B12. Offer acceptance: Donor more than 500 miles away
INIM
0.1 0.4 2.5 10NationalAverage
Lower Higher

Indiana University HealthCenter Code: INIMTransplant Program (Organ): LungRelease Date: January 7, 2019Based on Data Available: October 31, 2018
SRTR Program-Specific ReportFeedback?: [email protected] (7787)http://www.srtr.org
The data reported here were prepared by the Scientific Registry of Transplant Recipients (SRTR)under contract with the Health Resources and Services Administration (HRSA). Page: 13
C. Transplant Information
Table C1D. Deceased donor transplant recipient demographic characteristicsPatients transplanted between 07/01/2017 and 06/30/2018
Percentage in each categoryCharacteristic Center Region U.S.
(N=60) (N=318) (N=2,474)
Ethnicity/Race (%)*White 90.0 87.4 79.2African-American 8.3 9.7 9.5Hispanic/Latino 1.7 1.3 8.4Asian 0.0 0.9 2.2Other 0.0 0.6 0.7Unknown 0.0 0.0 0.0
Age (%)<2 years 0.0 0.3 0.22-11 years 0.0 0.3 0.412-17 0.0 0.3 1.418-34 0.0 6.3 9.735-49 years 10.0 9.4 12.050-64 years 51.7 45.9 41.365+ years 38.3 37.4 35.0Unknown 0.0 0.0 0.0
Gender (%)Male 60.0 62.9 59.8Female 40.0 37.1 40.2
* Race and ethnicity are reported together as a single data element, reflecting their data collection (either race orethnicity is required, but not both). Patients formerly coded as white and Hispanic are coded as Hispanic. Raceand ethnicity sum to 100%.

Indiana University HealthCenter Code: INIMTransplant Program (Organ): LungRelease Date: January 7, 2019Based on Data Available: October 31, 2018
SRTR Program-Specific ReportFeedback?: [email protected] (7787)http://www.srtr.org
The data reported here were prepared by the Scientific Registry of Transplant Recipients (SRTR)under contract with the Health Resources and Services Administration (HRSA). Page: 14
C. Transplant Information
Table C2D. Deceased donor transplant recipient medical characteristicsPatients transplanted between 07/01/2017 and 06/30/2018
Percentage in each categoryCharacteristic Center Region U.S.
(N=60) (N=318) (N=2,474)
Blood Type (%)O 45.0 44.7 44.8A 36.7 41.2 40.4B 16.7 11.9 11.2AB 1.7 2.2 3.6
Previous Transplant (%)Yes 0.0 2.8 3.1No 100.0 97.2 96.9
Body Mass Index (%)0-20 16.7 17.3 20.121-25 43.3 33.6 33.226-30 36.7 37.7 35.931+ 3.3 11.3 10.5Unknown 0.0 0.0 0.2
Primary Disease (%)Idiopathic Pulmonary Arterial Hypertension 1.7 3.8 5.8Cystic Fibrosis 3.3 8.8 12.5Idiopathic Pulmonary Fibrosis 45.0 54.1 52.7Emphysema/COPD 43.3 30.8 26.8Other 6.7 2.5 2.2Missing 0.0 0.0 0.0
Recipient Medical Condition at Transplant (%)Not Hospitalized 81.7 73.6 75.8Hospitalized 3.3 7.5 10.7ICU 15.0 18.9 13.3Unknown 0.0 0.0 0.2

Indiana University HealthCenter Code: INIMTransplant Program (Organ): LungRelease Date: January 7, 2019Based on Data Available: October 31, 2018
SRTR Program-Specific ReportFeedback?: [email protected] (7787)http://www.srtr.org
The data reported here were prepared by the Scientific Registry of Transplant Recipients (SRTR)under contract with the Health Resources and Services Administration (HRSA). Page: 15
C. Transplant Information
Table C3D. Deceased donor characteristicsTransplants performed between 07/01/2017 and 06/30/2018
Percentage in each categoryDonor Characteristic Center Region U.S.
(N=60) (N=318) (N=2,474)
Cause of Death (%)Deceased: Stroke 23.3 24.8 27.5Deceased: MVA 13.3 12.6 14.7Deceased: Other 63.3 62.6 57.8
Ethnicity/Race (%)*White 65.0 70.4 61.6African-American 28.3 22.0 19.3Hispanic/Latino 5.0 5.3 14.6Asian 1.7 1.9 3.7Other 0.0 0.3 0.7Not Reported 0.0 0.0 0.0
Age (%)<2 years 0.0 0.3 0.22-11 years 0.0 0.6 0.712-17 3.3 6.3 8.118-34 43.3 46.5 46.735-49 years 35.0 28.6 26.450-64 years 18.3 16.7 16.365+ years 0.0 0.9 1.5Unknown 0.0 0.0 0.0
Gender (%)Male 61.7 57.9 62.2Female 38.3 42.1 37.8
Blood Type (%)O 48.3 46.2 49.6A 33.3 39.6 37.6B 16.7 12.9 10.8AB 1.7 1.3 1.9Unknown 0.0 0.0 0.0
* Race and ethnicity are reported together as a single data element, reflecting their data collection (either race orethnicity is required, but not both). Patients formerly coded as white and Hispanic are coded as Hispanic. Raceand ethnicity sum to 100%.

Indiana University HealthCenter Code: INIMTransplant Program (Organ): LungRelease Date: January 7, 2019Based on Data Available: October 31, 2018
SRTR Program-Specific ReportFeedback?: [email protected] (7787)http://www.srtr.org
The data reported here were prepared by the Scientific Registry of Transplant Recipients (SRTR)under contract with the Health Resources and Services Administration (HRSA). Page: 16
C. Transplant Information
Table C4D. Deceased donor transplant characteristicsTransplants performed between 07/01/2017 and 06/30/2018
Percentage in each categoryTransplant Characteristic Center Region U.S.
(N=60) (N=318) (N=2,474)
Total Ischemic Time (Minutes): Local (%)Deceased: 0-90 min 0.0 1.0 1.0Deceased: 91-180 min 10.5 10.4 11.9Deceased: 181-270 min 21.1 27.1 35.7Deceased: 271-360 min 10.5 22.9 31.9Deceased: 361+ min 57.9 37.5 19.4Not Reported 0.0 1.0 0.1
Total Ischemic Time (Minutes): Shared (%)Deceased: 0-90 min 0.0 0.0 0.4Deceased: 91-180 min 2.4 0.9 1.1Deceased: 181-270 min 22.0 16.7 16.6Deceased: 271-360 min 9.8 32.9 42.3Deceased: 361+ min 65.9 48.6 38.7Not Reported 0.0 0.9 0.8
Procedure Type (%)Lung alone 98.3 99.7 99.4Lung and another organ 1.7 0.3 0.6
Sharing (%)Local 31.7 30.2 40.2Shared 68.3 69.8 59.8
Median Time in Hospital After Transplant* 27.0 Days 21.0 Days 18.0 Days
* Multiple organ transplants are excluded from this statistic.

Indiana University HealthCenter Code: INIMTransplant Program (Organ): LungRelease Date: January 7, 2019Based on Data Available: October 31, 2018
SRTR Program-Specific ReportFeedback?: [email protected] (7787)http://www.srtr.org
The data reported here were prepared by the Scientific Registry of Transplant Recipients (SRTR)under contract with the Health Resources and Services Administration (HRSA). Page: 17
C. Transplant Information
Table C5D. Adult (18+) 1-month survival with a functioning deceased donor graftSingle organ transplants performed between 07/01/2015 and 12/31/2017Deaths and retransplants are considered graft failures
INIM U.S.
Number of transplants evaluated 145 5,700
Estimated probability of surviving with a functioning graft at 1 month(unadjusted for patient and donor characteristics) 98.62% 97.46%
Expected probability of surviving with a functioning graft at 1 month(adjusted for patient and donor characteristics) 97.56% --
Number of observed graft failures (including deaths)during the first month after transplant 2 145
Number of expected graft failures (including deaths)during the first month after transplant 3.56 --
Estimated hazard ratio* 0.72 --
95% credible interval for the hazard ratio** [0.20, 1.58] --
* The hazard ratio provides an estimate of how Indiana University Health (INIM)'s results compare with what was expected based onmodeling the transplant outcomes from all U.S. programs. A ratio above 1 indicates higher than expected graft failure rates (e.g., ahazard ratio of 1.5 would indicate 50% higher risk), and a ratio below 1 indicates lower than expected graft failure rates (e.g., ahazard ratio of 0.75 would indicate 25% lower risk). If INIM's graft failure rate were precisely the expected rate, the estimated hazardratio would be 1.0.** The 95% credible interval, [0.20, 1.58], indicates the location of INIM's true hazard ratio with 95% probability. The best estimate is28% lower risk of graft failure compared to an average program, but INIM's performance could plausibly range from 80% reducedrisk up to 58% increased risk.
Figure C1D. Adult (18+) 1-monthdeceased donor graft failure HRestimate
0.2
0.5
1.0
2.0
5.0
0.20
1.58
0.72
Est
imat
ed H
azar
d R
atio
(H
R)
Figure C2D. Adult (18+) 1-month deceased donor graft failureHR program comparison
1 3 10 30 100 300
0.2
0.5
1.0
2.0
5.0
Better
Worse
Program VolumeTransplants Performed 07/01/2015 - 12/31/2017
Est
imat
ed H
azar
d R
atio
(H
R)
INIM Other Programs

Indiana University HealthCenter Code: INIMTransplant Program (Organ): LungRelease Date: January 7, 2019Based on Data Available: October 31, 2018
SRTR Program-Specific ReportFeedback?: [email protected] (7787)http://www.srtr.org
The data reported here were prepared by the Scientific Registry of Transplant Recipients (SRTR)under contract with the Health Resources and Services Administration (HRSA). Page: 18
C. Transplant Information
Table C6D. Adult (18+) 1-year survival with a functioning deceased donor graftSingle organ transplants performed between 07/01/2015 and 12/31/2017Deaths and retransplants are considered graft failures
INIM U.S.
Number of transplants evaluated 145 5,700
Estimated probability of surviving with a functioning graft at 1 year(unadjusted for patient and donor characteristics) 92.75% 88.85%
Expected probability of surviving with a functioning graft at 1 year(adjusted for patient and donor characteristics) 89.26% --
Number of observed graft failures (including deaths)during the first year after transplant 10 577
Number of expected graft failures (including deaths)during the first year after transplant 14.07 --
Estimated hazard ratio* 0.75 --
95% credible interval for the hazard ratio** [0.39, 1.22] --
* The hazard ratio provides an estimate of how Indiana University Health (INIM)'s results compare with what was expected based onmodeling the transplant outcomes from all U.S. programs. A ratio above 1 indicates higher than expected graft failure rates (e.g., ahazard ratio of 1.5 would indicate 50% higher risk), and a ratio below 1 indicates lower than expected graft failure rates (e.g., ahazard ratio of 0.75 would indicate 25% lower risk). If INIM's graft failure rate were precisely the expected rate, the estimated hazardratio would be 1.0.** The 95% credible interval, [0.39, 1.22], indicates the location of INIM's true hazard ratio with 95% probability. The best estimate is25% lower risk of graft failure compared to an average program, but INIM's performance could plausibly range from 61% reducedrisk up to 22% increased risk.
Figure C3D. Adult (18+) 1-yeardeceased donor graft failure HRestimate
0.2
0.5
1.0
2.0
5.0
0.39
1.22
0.75
Est
imat
ed H
azar
d R
atio
(H
R)
Figure C4D. Adult (18+) 1-year deceased donor graft failureHR program comparison
1 3 10 30 100 300
0.2
0.5
1.0
2.0
5.0
Better
Worse
Program VolumeTransplants Performed 07/01/2015 - 12/31/2017
Est
imat
ed H
azar
d R
atio
(H
R)
INIM Other Programs

Indiana University HealthCenter Code: INIMTransplant Program (Organ): LungRelease Date: January 7, 2019Based on Data Available: October 31, 2018
SRTR Program-Specific ReportFeedback?: [email protected] (7787)http://www.srtr.org
The data reported here were prepared by the Scientific Registry of Transplant Recipients (SRTR)under contract with the Health Resources and Services Administration (HRSA). Page: 19
C. Transplant Information
Table C7D. Adult (18+) 3-year survival with a functioning deceased donor graftSingle organ transplants performed between 01/01/2013 and 06/30/2015Deaths and retransplants are considered graft failures
INIM U.S.
Number of transplants evaluated 141 4,679
Estimated probability of surviving with a functioning graft at 3 years(unadjusted for patient and donor characteristics) 77.18% 70.47%
Expected probability of surviving with a functioning graft at 3 years(adjusted for patient and donor characteristics) 72.54% --
Number of observed graft failures (including deaths)during the first 3 years after transplant 32 1,367
Number of expected graft failures (including deaths)during the first 3 years after transplant 39.29 --
Estimated hazard ratio* 0.82 --
95% credible interval for the hazard ratio** [0.57, 1.12] --
* The hazard ratio provides an estimate of how Indiana University Health (INIM)'s results compare with what was expected based onmodeling the transplant outcomes from all U.S. programs. A ratio above 1 indicates higher than expected graft failure rates (e.g., ahazard ratio of 1.5 would indicate 50% higher risk), and a ratio below 1 indicates lower than expected graft failure rates (e.g., ahazard ratio of 0.75 would indicate 25% lower risk). If INIM's graft failure rate were precisely the expected rate, the estimated hazardratio would be 1.0.** The 95% credible interval, [0.57, 1.12], indicates the location of INIM's true hazard ratio with 95% probability. The best estimate is18% lower risk of graft failure compared to an average program, but INIM's performance could plausibly range from 43% reducedrisk up to 12% increased risk.
Figure C5D. Adult (18+) 3-yeardeceased donor graft failure HRestimate
0.2
0.5
1.0
2.0
5.0
0.57
1.12
0.82
Est
imat
ed H
azar
d R
atio
(H
R)
Figure C6D. Adult (18+) 3-year deceased donor graft failureHR program comparison
1 3 10 30 100 300
0.2
0.5
1.0
2.0
5.0
Better
Worse
Program VolumeTransplants Performed 01/01/2013 - 06/30/2015
Est
imat
ed H
azar
d R
atio
(H
R)
INIM Other Programs

Indiana University HealthCenter Code: INIMTransplant Program (Organ): LungRelease Date: January 7, 2019Based on Data Available: October 31, 2018
SRTR Program-Specific ReportFeedback?: [email protected] (7787)http://www.srtr.org
The data reported here were prepared by the Scientific Registry of Transplant Recipients (SRTR)under contract with the Health Resources and Services Administration (HRSA). Page: 20
C. Transplant Information
Table C8D. Pediatric (<18) 1-month survival with a functioning deceased donor graftSingle organ transplants performed between 07/01/2015 and 12/31/2017Deaths and retransplants are considered graft failures
This center did not perform anytransplants relevant to
this table during07/01/2015-12/31/2017
Figure C7D. Pediatric (<18)1-month deceased donor graftfailure HR estimate
This center did not perform anytransplants relevant to
this figure during07/01/2015-12/31/2017
Figure C8D. Pediatric (<18) 1-month deceased donor graftfailure HR program comparison
This center did not perform anytransplants relevant to
this figure during07/01/2015-12/31/2017
Indiana University HealthCenter Code: INIMTransplant Program (Organ): LungRelease Date: January 7, 2019Based on Data Available: October 31, 2018
SRTR Program-Specific ReportFeedback?: [email protected] (7787)http://www.srtr.org
The data reported here were prepared by the Scientific Registry of Transplant Recipients (SRTR)under contract with the Health Resources and Services Administration (HRSA). Page: 21
C. Transplant Information
Table C9D. Pediatric (<18) 1-year survival with a functioning deceased donor graftSingle organ transplants performed between 07/01/2015 and 12/31/2017Deaths and retransplants are considered graft failures
This center did not perform anytransplants relevant to
this table during07/01/2015-12/31/2017
Figure C9D. Pediatric (<18)1-year deceased donor graftfailure HR estimate
This center did not perform anytransplants relevant to
this figure during07/01/2015-12/31/2017
Figure C10D. Pediatric (<18) 1-year deceased donor graftfailure HR program comparison
This center did not perform anytransplants relevant to
this figure during07/01/2015-12/31/2017

Indiana University HealthCenter Code: INIMTransplant Program (Organ): LungRelease Date: January 7, 2019Based on Data Available: October 31, 2018
SRTR Program-Specific ReportFeedback?: [email protected] (7787)http://www.srtr.org
The data reported here were prepared by the Scientific Registry of Transplant Recipients (SRTR)under contract with the Health Resources and Services Administration (HRSA). Page: 22
C. Transplant Information
Table C10D. Pediatric (<18) 3-year survival with a functioning deceased donor graftSingle organ transplants performed between 01/01/2013 and 06/30/2015Deaths and retransplants are considered graft failures
INIM U.S.
Number of transplants evaluated 2 129
Estimated probability of surviving with a functioning graft at 3 years(unadjusted for patient and donor characteristics) 50.00% 60.80%
Expected probability of surviving with a functioning graft at 3 years(adjusted for patient and donor characteristics) 60.98% --
Number of observed graft failures (including deaths)during the first 3 years after transplant 1 50
Number of expected graft failures (including deaths)during the first 3 years after transplant 0.98 --
Estimated hazard ratio* 1.01 --
95% credible interval for the hazard ratio** [0.21, 2.43] --
* The hazard ratio provides an estimate of how Indiana University Health (INIM)'s results compare with what was expected based onmodeling the transplant outcomes from all U.S. programs. A ratio above 1 indicates higher than expected graft failure rates (e.g., ahazard ratio of 1.5 would indicate 50% higher risk), and a ratio below 1 indicates lower than expected graft failure rates (e.g., ahazard ratio of 0.75 would indicate 25% lower risk). If INIM's graft failure rate were precisely the expected rate, the estimated hazardratio would be 1.0.** The 95% credible interval, [0.21, 2.43], indicates the location of INIM's true hazard ratio with 95% probability. The best estimate is1% higher risk of graft failure compared to an average program, but INIM's performance could plausibly range from 79% reducedrisk up to 143% increased risk.
Figure C11D. Pediatric (<18)3-year deceased donor graftfailure HR estimate
0.2
0.5
1.0
2.0
5.0
0.21
2.43
1.01
Est
imat
ed H
azar
d R
atio
(H
R)
Figure C12D. Pediatric (<18) 3-year deceased donor graftfailure HR program comparison
1 3 10 30
0.2
0.5
1.0
2.0
5.0
Better
Worse
Program VolumeTransplants Performed 01/01/2013 - 06/30/2015
Est
imat
ed H
azar
d R
atio
(H
R)
INIM Other Programs

Indiana University HealthCenter Code: INIMTransplant Program (Organ): LungRelease Date: January 7, 2019Based on Data Available: October 31, 2018
SRTR Program-Specific ReportFeedback?: [email protected] (7787)http://www.srtr.org
The data reported here were prepared by the Scientific Registry of Transplant Recipients (SRTR)under contract with the Health Resources and Services Administration (HRSA). Page: 23
C. Transplant Information
Table C11D. Adult (18+) 1-month patient survival (deceased donor graft recipients)Single organ transplants performed between 07/01/2015 and 12/31/2017Retransplants excluded
INIM U.S.
Number of transplants evaluated 144 5,524
Estimated probability of surviving at 1 month(unadjusted for patient and donor characteristics) 99.31% 97.86%
Expected probability of surviving at 1 month(adjusted for patient and donor characteristics) 97.89% --
Number of observed deaths during the first month after transplant 1 118
Number of expected deaths during the first month after transplant 3.08 --
Estimated hazard ratio* 0.59 --
95% credible interval for the hazard ratio** [0.12, 1.42] --
* The hazard ratio provides an estimate of how Indiana University Health (INIM)'s results compare with what was expected based onmodeling the transplant outcomes from all U.S. programs. A ratio above 1 indicates higher than expected patient death rates (e.g., ahazard ratio of 1.5 would indicate 50% higher risk), and a ratio below 1 indicates lower than expected patient death rates (e.g., ahazard ratio of 0.75 would indicate 25% lower risk). If INIM's patient death rate were precisely the expected rate, the estimatedhazard ratio would be 1.0.** The 95% credible interval, [0.12, 1.42], indicates the location of INIM's true hazard ratio with 95% probability. The best estimate is41% lower risk of patient death compared to an average program, but INIM's performance could plausibly range from 88% reducedrisk up to 42% increased risk.
Figure C13D. Adult (18+) 1-monthpatient death HR estimate(deceased donor grafts)
0.2
0.5
1.0
2.0
5.0
0.12
1.42
0.59
Est
imat
ed H
azar
d R
atio
(H
R)
Figure C14D. Adult (18+) 1-month patient death HR programcomparison (deceased donor grafts)
1 3 10 30 100 300
0.2
0.5
1.0
2.0
5.0
Better
Worse
Program VolumeTransplants Performed 07/01/2015 - 12/31/2017
Est
imat
ed H
azar
d R
atio
(H
R)
INIM Other Programs

Indiana University HealthCenter Code: INIMTransplant Program (Organ): LungRelease Date: January 7, 2019Based on Data Available: October 31, 2018
SRTR Program-Specific ReportFeedback?: [email protected] (7787)http://www.srtr.org
The data reported here were prepared by the Scientific Registry of Transplant Recipients (SRTR)under contract with the Health Resources and Services Administration (HRSA). Page: 24
C. Transplant Information
Table C12D. Adult (18+) 1-year patient survival (deceased donor graft recipients)Single organ transplants performed between 07/01/2015 and 12/31/2017Retransplants excluded
INIM U.S.
Number of transplants evaluated 144 5,524
Estimated probability of surviving at 1 year(unadjusted for patient and donor characteristics) 93.39% 89.38%
Expected probability of surviving at 1 year(adjusted for patient and donor characteristics) 89.45% --
Number of observed deaths during the first year after transplant 9 535
Number of expected deaths during the first year after transplant 13.94 --
Estimated hazard ratio* 0.69 --
95% credible interval for the hazard ratio** [0.34, 1.15] --
* The hazard ratio provides an estimate of how Indiana University Health (INIM)'s results compare with what was expected based onmodeling the transplant outcomes from all U.S. programs. A ratio above 1 indicates higher than expected patient death rates (e.g., ahazard ratio of 1.5 would indicate 50% higher risk), and a ratio below 1 indicates lower than expected patient death rates (e.g., ahazard ratio of 0.75 would indicate 25% lower risk). If INIM's patient death rate were precisely the expected rate, the estimatedhazard ratio would be 1.0.** The 95% credible interval, [0.34, 1.15], indicates the location of INIM's true hazard ratio with 95% probability. The best estimate is31% lower risk of patient death compared to an average program, but INIM's performance could plausibly range from 66% reducedrisk up to 15% increased risk.
Figure C15D. Adult (18+) 1-yearpatient death HR estimate(deceased donor grafts)
0.2
0.5
1.0
2.0
5.0
0.34
1.15
0.69
Est
imat
ed H
azar
d R
atio
(H
R)
Figure C16D. Adult (18+) 1-year patient death HR programcomparison (deceased donor grafts)
1 3 10 30 100 300
0.2
0.5
1.0
2.0
5.0
Better
Worse
Program VolumeTransplants Performed 07/01/2015 - 12/31/2017
Est
imat
ed H
azar
d R
atio
(H
R)
INIM Other Programs

Indiana University HealthCenter Code: INIMTransplant Program (Organ): LungRelease Date: January 7, 2019Based on Data Available: October 31, 2018
SRTR Program-Specific ReportFeedback?: [email protected] (7787)http://www.srtr.org
The data reported here were prepared by the Scientific Registry of Transplant Recipients (SRTR)under contract with the Health Resources and Services Administration (HRSA). Page: 25
C. Transplant Information
Table C13D. Adult (18+) 3-year patient survival (deceased donor graft recipients)Single organ transplants performed between 01/01/2013 and 06/30/2015Retransplants excluded
INIM U.S.
Number of transplants evaluated 137 4,487
Estimated probability of surviving at 3 years(unadjusted for patient and donor characteristics) 78.10% 72.52%
Expected probability of surviving at 3 years(adjusted for patient and donor characteristics) 74.88% --
Number of observed deaths during the first 3 years after transplant 30 1,233
Number of expected deaths during the first 3 years after transplant 34.94 --
Estimated hazard ratio* 0.87 --
95% credible interval for the hazard ratio** [0.59, 1.19] --
* The hazard ratio provides an estimate of how Indiana University Health (INIM)'s results compare with what was expected based onmodeling the transplant outcomes from all U.S. programs. A ratio above 1 indicates higher than expected patient death rates (e.g., ahazard ratio of 1.5 would indicate 50% higher risk), and a ratio below 1 indicates lower than expected patient death rates (e.g., ahazard ratio of 0.75 would indicate 25% lower risk). If INIM's patient death rate were precisely the expected rate, the estimatedhazard ratio would be 1.0.** The 95% credible interval, [0.59, 1.19], indicates the location of INIM's true hazard ratio with 95% probability. The best estimate is13% lower risk of patient death compared to an average program, but INIM's performance could plausibly range from 41% reducedrisk up to 19% increased risk.
Figure C17D. Adult (18+) 3-yearpatient death HR estimate(deceased donor grafts)
0.2
0.5
1.0
2.0
5.0
0.59
1.19
0.87
Est
imat
ed H
azar
d R
atio
(H
R)
Figure C18D. Adult (18+) 3-year patient death HR programcomparison (deceased donor grafts)
1 3 10 30 100 300
0.2
0.5
1.0
2.0
5.0
Better
Worse
Program VolumeTransplants Performed 01/01/2013 - 06/30/2015
Est
imat
ed H
azar
d R
atio
(H
R)
INIM Other Programs

Indiana University HealthCenter Code: INIMTransplant Program (Organ): LungRelease Date: January 7, 2019Based on Data Available: October 31, 2018
SRTR Program-Specific ReportFeedback?: [email protected] (7787)http://www.srtr.org
The data reported here were prepared by the Scientific Registry of Transplant Recipients (SRTR)under contract with the Health Resources and Services Administration (HRSA). Page: 26
C. Transplant Information
Table C14D. Pediatric (<18) 1-month patient survival (deceased donor graft recipients)Single organ transplants performed between 07/01/2015 and 12/31/2017Retransplants excluded
This center did not perform anytransplants relevant to
this table during07/01/2015-12/31/2017
Figure C19D. Pediatric (<18)1-month patient death HRestimate (deceased donor grafts)
This center did not perform anytransplants relevant to
this figure during07/01/2015-12/31/2017
Figure C20D. Pediatric (<18) 1-month patient death HRprogram comparison (deceased donor grafts)
This center did not perform anytransplants relevant to
this figure during07/01/2015-12/31/2017

Indiana University HealthCenter Code: INIMTransplant Program (Organ): LungRelease Date: January 7, 2019Based on Data Available: October 31, 2018
SRTR Program-Specific ReportFeedback?: [email protected] (7787)http://www.srtr.org
The data reported here were prepared by the Scientific Registry of Transplant Recipients (SRTR)under contract with the Health Resources and Services Administration (HRSA). Page: 27
C. Transplant Information
Table C15D. Pediatric (<18) 1-year patient survival (deceased donor graft recipients)Single organ transplants performed between 07/01/2015 and 12/31/2017Retransplants excluded
This center did not perform anytransplants relevant to
this table during07/01/2015-12/31/2017
Figure C21D. Pediatric (<18)1-year patient death HR estimate(deceased donor grafts)
This center did not perform anytransplants relevant to
this figure during07/01/2015-12/31/2017
Figure C22D. Pediatric (<18) 1-year patient death HR programcomparison (deceased donor grafts)
This center did not perform anytransplants relevant to
this figure during07/01/2015-12/31/2017

Indiana University HealthCenter Code: INIMTransplant Program (Organ): LungRelease Date: January 7, 2019Based on Data Available: October 31, 2018
SRTR Program-Specific ReportFeedback?: [email protected] (7787)http://www.srtr.org
The data reported here were prepared by the Scientific Registry of Transplant Recipients (SRTR)under contract with the Health Resources and Services Administration (HRSA). Page: 28
C. Transplant Information
Table C16D. Pediatric (<18) 3-year patient survival (deceased donor graft recipients)Single organ transplants performed between 01/01/2013 and 06/30/2015Retransplants excluded
INIM U.S.
Number of transplants evaluated 2 123
Estimated probability of surviving at 3 years(unadjusted for patient and donor characteristics) 50.00% 62.60%
Expected probability of surviving at 3 years(adjusted for patient and donor characteristics) 62.76% --
Number of observed deaths during the first 3 years after transplant 1 46
Number of expected deaths during the first 3 years after transplant 0.92 --
Estimated hazard ratio* 1.03 --
95% credible interval for the hazard ratio** [0.21, 2.48] --
* The hazard ratio provides an estimate of how Indiana University Health (INIM)'s results compare with what was expected based onmodeling the transplant outcomes from all U.S. programs. A ratio above 1 indicates higher than expected patient death rates (e.g., ahazard ratio of 1.5 would indicate 50% higher risk), and a ratio below 1 indicates lower than expected patient death rates (e.g., ahazard ratio of 0.75 would indicate 25% lower risk). If INIM's patient death rate were precisely the expected rate, the estimatedhazard ratio would be 1.0.** The 95% credible interval, [0.21, 2.48], indicates the location of INIM's true hazard ratio with 95% probability. The best estimate is3% higher risk of patient death compared to an average program, but INIM's performance could plausibly range from 79% reducedrisk up to 148% increased risk.
Figure C23D. Pediatric (<18)3-year patient death HR estimate(deceased donor grafts)
0.2
0.5
1.0
2.0
5.0
0.21
2.48
1.03
Est
imat
ed H
azar
d R
atio
(H
R)
Figure C24D. Pediatric (<18) 3-year patient death HR programcomparison (deceased donor grafts)
1 3 10 30
0.2
0.5
1.0
2.0
5.0
Better
Worse
Program VolumeTransplants Performed 01/01/2013 - 06/30/2015
Est
imat
ed H
azar
d R
atio
(H
R)
INIM Other Programs

Indiana University HealthCenter Code: INIMTransplant Program (Organ): LungRelease Date: January 7, 2019Based on Data Available: October 31, 2018
SRTR Program-Specific ReportFeedback?: [email protected] (7787)http://www.srtr.org
The data reported here were prepared by the Scientific Registry of Transplant Recipients (SRTR)under contract with the Health Resources and Services Administration (HRSA). Page: 29
C. Transplant Information
Table C17. Multi-organ transplant graft survival: 07/01/2015 - 12/31/2017
Adult (18+) Transplants
No adult (18+) multi-organ transplants were performed
Pediatric (<18) Transplants
No pediatric (<18) multi-organ transplants were performed
Table C18. Multi-organ transplant patient survival: 07/01/2015 - 12/31/2017
Adult (18+) Transplants
No adult (18+) multi-organ transplants were performed
Pediatric (<18) Transplants
No pediatric (<18) multi-organ transplants were performed