USEFULNESS OF FIBRO-Q INDEX FOR PREDICTING FIBROSIS IN ...
21
AAMJ, VOL10, NO4, OCT 2013 – SUPLL 1 ــــــــــــــــــــــــــــــــــــــــــــــــــــــــــــــــــــــــــــــــــــــــــــــــــــ ـــــــــــــــــــــــــ ـــــــــــــــــــــــــــــــ49 USEFULNESS OF FIBRO-Q INDEX FOR PREDICTING FIBROSIS IN PATIENTS WITH CHRONIC HEPATITIS C, COMPARED WITH LIVER BIOPSY Ehab Mahfouz¹, Ehsan H. Hassen², Faten Mahmoud 1 And Kamal El-Atrebi 3 . Departments of Clinical and chemical pathology ¹; Pathology ²; Internal Medicine and Hepatology 3 , National Hematology and Tropical Medicine Research Institute (NHTMRI), Cairo, Egypt. ـــــــــــــــــــــــــــــــــــــــــــــــــــــــــــــــــــــــــــــــــــــــــــــــــــــــــــــــــــــــــــــ ــــــــــــــــــــــــــــــــABSTRACT Background: Egypt has the highest HCV prevalence in the world. Today, HCV infection and its complications are among the leading public health challenges in Egypt. The natural course of chronic hepatitis C is characterized by progressive fibrosis in the inflamed liver leading to cirrhosis. Liver biopsy is the gold standard for assessment of liver fibrosis before all antiviral treatment. However, this procedure has its own limitations, risks, and costs. Hence, noninvasive indices have been proposed to assess the severity of hepatic fibrosis. Aim of the work : The aim of the current study was to assess the predictive value of noninvasive indices of Fibro-Q, Alanine Aminotransferase Ratio (AAR)& Aspartate aminotransferase to platelet ratio Index (APRI) in patients with chronic hepatitis C, compared with liver biopsy and to determine their cutoff values to differentiate significant fibrosis and cirrhosis in a community hospital in an area with hyperendemic HCV infection. Patients and Methods: A case study included 100 patients with chronic hepatitis C who had undergone percutaneous liver biopsy before treatment. Our patients were attending the outpatient clinic of NHTMRI in the period of April 2012 to
Transcript of USEFULNESS OF FIBRO-Q INDEX FOR PREDICTING FIBROSIS IN ...

AAMJ, VOL10, NO4, OCT 2013 – SUPLL 1
ــــــــــــــــــــــــــــــــــــــــــــــــــــــــــــــــــــــــــــــــــــــــــــــــــــــــــــــــــــــــــــــــــــــــــــــــــــــــــــ
49
USEFULNESS OF FIBRO-Q INDEX FOR PREDICTING
FIBROSIS IN PATIENTS WITH CHRONIC HEPATITIS C,
COMPARED WITH LIVER BIOPSY
Ehab Mahfouz¹, Ehsan H. Hassen², Faten Mahmoud1 And
Kamal El-Atrebi3.
Departments of Clinical and chemical pathology ¹; Pathology ²; Internal
Medicine and Hepatology3, National Hematology and Tropical Medicine
Research Institute (NHTMRI), Cairo, Egypt.
ـــــــــــــــــــــــــــــــــــــــــــــــــــــــــــــــــــــــــــــــــــــــــــــــــــــــــــــــــــــــــــــــــــــــــــــــــــــــــــــ
ABSTRACT
Background: Egypt has the highest HCV prevalence in the world. Today,
HCV infection and its complications are among the leading public health
challenges in Egypt. The natural course of chronic hepatitis C is characterized
by progressive fibrosis in the inflamed liver leading to cirrhosis. Liver biopsy is
the gold standard for assessment of liver fibrosis before all antiviral treatment.
However, this procedure has its own limitations, risks, and costs. Hence,
noninvasive indices have been proposed to assess the severity of hepatic
fibrosis. Aim of the work : The aim of the current study was to assess the
predictive value of noninvasive indices of Fibro-Q, Alanine Aminotransferase
Ratio (AAR)& Aspartate aminotransferase to platelet ratio Index (APRI) in
patients with chronic hepatitis C, compared with liver biopsy and to determine
their cutoff values to differentiate significant fibrosis and cirrhosis in a
community hospital in an area with hyperendemic HCV infection. Patients and
Methods: A case study included 100 patients with chronic hepatitis C who had
undergone percutaneous liver biopsy before treatment. Our patients were
attending the outpatient clinic of NHTMRI in the period of April 2012 to
Ehab Mahfouz et al
ــــــــــــــــــــــــــــــــــــــــــــــــــــــــــــــــــــــــــــــــــــــــــــــــــــــــــــــــــــــــــــــــــــــــــــــــــــــــــ
50
September 2013. Their ages ranged from 20 to 59 years old of both sexes.
Biochemical markers assessed were: AST, ALT, platelet count, prothrombin
time (PT), international normalized ratio (INR). Liver fibrosis was evaluated
according to the Metavir scoring system. Fibro-Q index, APRI, and AAR were
calculated. Receiver operating characteristic (ROC) curves were constructed to
compare the accuracies of these three noninvasive indices in predicting
significant fibrosis and cirrhosis in patients with chronic hepatitis C. Results:
Fibro-Q , APRI, and AAR results increased significantly as fibrosis advanced (p
< 0.05). Fibro-Q performed better than AAR, but was equal to APR, in the
prediction of significant fibrosis [ area under the ROC (AUC): 0.87 vs 0.71 (p=
0.003) and 0.87 vs 0.88 (p= 0.7), respectively]. As regard cirrhosis, Fibro-Q
performed better than AAR, but was inferior to APRI [ AUC: 0.88 vs 0.7
(p=0.2) and 0.88 vs 0.98 ( p=0.1), respectively]. Using a cutoff value of the
Fibro-Q index > 2.41, the presence of significant fibrosis could be correctly be
identified with high accuracy (100% PPV) in all of the 100 patients.
Conclusion: Fibro-Q is a simple and useful index for predicting significant
fibrosis in patients with chronic hepatitis C.
Keywords: Liver fibrosis; Noninvasive test; Fibro-Q; Aspartate
aminotransferase/ Alanine aminotransferase ratio (AAR); Aspartate
aminotransferase to platelet ratio Index (APRI)
INTRODUCTION
Hepatitis C virus (HCV) infection is a serious human liver health problem
and has infected 200 million people worldwide. ⁽25⁾ Persistent HCV infection
can lead to chronic hepatitis C, which is a significant risk of serious hepatic
diseases such as hepatic steatosis, hepatic fibrosis and hepatocellular carcinoma.
⁽²4⁾ Egypt has the highest prevalence of (HCV) in the world, estimated nationally

AAMJ, VOL10, NO4, OCT 2013 – SUPLL 1
ــــــــــــــــــــــــــــــــــــــــــــــــــــــــــــــــــــــــــــــــــــــــــــــــــــــــــــــــــــــــــــــــــــــــــــــــــــــــــــ
51
at 14.7%. Today, HCV infection and its complications are among the leading
public health challenges in Egypt. ⁽9⁾
The natural course of chronic hepatitis C is characterized by progressive
fibrosis in the inflamed liver with structural and hemodynamic changes leading
to cirrhosis, which is followed by end stage complications.⁽1⁾ Accordingly, the
assessment of liver fibrosis in chronic hepatitis C has become of paramount
importance; to guide management decisions, predict outcome (prognosis), and
monitor disease activity in individual patients.⁽2⁾
Because antiviral treatment is costly and may be associated with significant
side effects, the pathological staging of hepatic fibrosis through liver biopsy, is
fundamental for clinical management of chronic hepatitis C.(20) Patients showing
Metavir fibrosis score ≥ 2 are at significant risk of developing cirrhosis within
5-10 years and have priority for antiviral therapy in all International and
National guidelines .⁽23⁾ On the other hand, many experts believe that
therapy is not mandatory in patients with no or minimal fibrosis (F0-F1),
particularly when the chance of achieving a favorable response is not high, like
in patients with contraindications or with poor motivation towards therapy,
patients with high viral load or difficult-to-treat HCV genotypes.⁽³⁾ Thus, liver
biopsy is often necessary to assess prognosis and to decide management.
Liver biopsy is the gold standard for fibrosis staging in chronic hepatitis C.
⁽5⁾ However, liver biopsy has several limitations that prevent its routine use as a
clinical tool. For example, the invasive nature of the liver biopsy with its
morbidity and mortality. Moreover, sampling errors and inter-observer
variations may lead to understaging of fibrosis .⁽4⁾
Therefore, several noninvasive tests have been proposed to attempt to
predict the degree of liver fibrosis, with the objective of replacing liver

Ehab Mahfouz et al
ــــــــــــــــــــــــــــــــــــــــــــــــــــــــــــــــــــــــــــــــــــــــــــــــــــــــــــــــــــــــــــــــــــــــــــــــــــــــــ
52
biopsy.⁽¹4⁾ Some of the noninvasive models are expensive, need complicated
calculations, or involved tests that are generally not a part of the routine
monitoring and investigations of patients with chronic liver disease. For these
reasons, such tests are only available in some research centers and cannot be
widely used in clinical practice.⁽8⁾
AIM OF WORK
The aim of the current study was to assess the predictive value of
noninvasive indices of Fibro-Q, AAR & APRI in patients with chronic hepatitis
C, compared with liver biopsy and to determine their cutoff values to
differentiate significant fibrosis and cirrhosis in a community hospital in an area
with hyperendemic HCV infection.
PATIENTS AND METHODS
A case study was conducted on100 interferon –naïve patients with chronic
hepatitis C attending the outpatients clinic of NHTMRI in the period of April
2012 to September 2013. Their ages ranged from 20 to 59 years old of both
sexes. The diagnosis of HCV infection was confirmed by the presence of anti-
HCV antibodies and HCV RNA by PCR. All patients were subjected to detailed
history taking, thorough clinical examination, routine laboratory investigations
including AST, ALT, alkaline phosphatase (ALP), total and direct bilirubin,
albumin, gamma glutamyl transferase (GGT), prothrombin time (PT), and
complete blood picture (CBC), abdominal ultrasonography, and liver biopsy.
According to the histopathological assessment of liver biopsies, patients
were classified into 3 distinct groups. Group (ǀ) included 51 cases with minimal

AAMJ, VOL10, NO4, OCT 2013 – SUPLL 1
ــــــــــــــــــــــــــــــــــــــــــــــــــــــــــــــــــــــــــــــــــــــــــــــــــــــــــــــــــــــــــــــــــــــــــــــــــــــــــــ
53
or mild fibrosis (Metavir fibrosis score,F1, insignificant fibrosis). Group (ǁ)
included 43 cases with significant fibrosis ( F2 and F3). Group (ǀǁ) included 6
cases with liver cirrhosis (F4).
Patients with other conditions affecting liver enzymes were excluded such
as HBV infection, thyroid disease, muscle disease, primary hepatic or metastatic
lesions, passive congestion of liver, recent intramuscular injection or
medications. In addition, patients with metabolic liver disease, prior antiviral or
immunosuppressive therapy, recent anticoagulant therapy, and those whose
biopsy samples were shorter than 1 cm or containing less than 6 portal tracts
were excluded as well .⁽7⁾
Noninvasive indices Assay
Ten ml of venous blood were withdrawn under complete aspetic conditions
into vacutainer tubes from each patient at the day of liver biopsy. Samples were
divided into 2 parts: 5 ml were added to both citrate and EDTA tubes and the
remaining whole blood were incubated to clot in serum tubes at room
temperature for 20 minutes and then sera were separated by centrifugation at
2000 rpm for 15 minutes. Routine laboratory investigations were assayed.
Fibro-Q index was then calculated from a special formula: 10X (age X AST X
PTINR)/ (ALT X platelet count). In addition, APRI was calculated using the
following formula: ([ AST/ upper limit of normal, ULN] / platelet count [X
10⁹/L]) X 100. AAR was also calculated as a ratio between AST and ALT.
Histopathological study
All biopsies were obtained with 18G automatic guillotine type needle.
Liver tissues were fixed in 10% neutral formalin immediately after biopsy,
processed, and embedded in paraffin; 4- µm sections were cut with a microtome
( Microm HMSIS,Thermo Scientfic, Germeny). The slides were stained with

Ehab Mahfouz et al
ــــــــــــــــــــــــــــــــــــــــــــــــــــــــــــــــــــــــــــــــــــــــــــــــــــــــــــــــــــــــــــــــــــــــــــــــــــــــــ
54
hematoxylin-eosin for assessment of hepatic inflammatory activity and with
Masson´s trichrome stain for evaluation of the stage of fibrosis (13).Histological
staging (fibrosis score) were performed blindly according to the METAVIR
scoring system by one expert pathologist (E.H.).
According to the Metavir system, fibrosis was staged on a scale from F0 to
F4; F0- no fibrosis; F1- portal fibrosis without septa; F2-few septa; F3- many
septa without cirrhosisand F4- cirrhosis. The F0 and F1 were considered
insignificant (minimal or no) fibrosis ,whereas the scores F2-F4 were
considered significant fibrosis .⁽26⁾
STATISTICAL ANALYSIS
Statistical analysis was performed using SPSS software version 15.
Patients characteristics were represented as mean ± SD. One way ANOVA test
was used to assess the relationship between the clinical variables and degree of
fibrosis. r was considered weak if ˂ 0.25, mild if ≥ 0.25- ˂ 0.5, moderate if ≥
0.5- ˂ 0.75 , and strong if ≥ 0.75. P- value was considered significant if ˂ 0.05.
Receiver operating characteristic (ROC) curves were constructed for each
test.To evaluate the diagnostic accuracies of the noninvasive tests for liver
fibrosis, their sensitivities, specificities, positive predictive values (PPV),
negative predictive values (NPV), and the area under the ROC curves (AUC)
were compared according to the procedure proposed by Hanley and McNeil .⁽¹¹⁾
RESULTS
Our results were conducted at tables 1- 6 and figures 1- 2. Table (1) shows
laboratory investigations of all patients. Histopathological features of the
studied groups are summarized in Table (2). Group (ǀ) included 51 patients
whose liver biopsies showed Metavir stage F1 fibrosis (insignificant fibrosis).

AAMJ, VOL10, NO4, OCT 2013 – SUPLL 1
ــــــــــــــــــــــــــــــــــــــــــــــــــــــــــــــــــــــــــــــــــــــــــــــــــــــــــــــــــــــــــــــــــــــــــــــــــــــــــــ
55
Group (ǁ ) included 43 patients whose biopsies showed either F2 (22 patients)
or F3 (21 patients) stages (significant fibrosis). Group (ǀǁ) included 6 patients
whose biopsies showed F4 stage (liver cirrhosis).
Correlations between Metavir fibrosis score and laboratory investigations
in all cases was constructed in table (3). A mild positive correlation was found
between Metavir score and AAR (p= 0.0001 & r= 0.39), whereas moderate
positive correlations were found with AST, ALT, PTINR, and Fibro-Q (p=
0.0001 & r= 0.64, 0.53, 0.68 & 0.74 respectively). A strong positive correlation
was found between Metavir score and APRI (p=0.0001 & r=0.77). On the other
hand, a mild negative correlation was found with platelet count (p=0.0001 & r=
- 0.34).
Table (4) is conducted to determine the way in which the means of the 3
noninvasive indices were affected by different Metavir fibrosis score, or in other
words, to compare means of these indices in the 3 studied patient´s groups. It
was found that the p-value of 0.0001 indicated a highly significant difference
between Fibro-Q, APRI, and AAR means of group ǀ vs both group ǁ & group ǀǁ,
and group ǁ vs group ǀǁ. In other words, the results of Fibro-Q index, APRI, and
AAR increased significantly as the fibrosis advanced.
Predicting significant fibrosis
The ROC curves evaluating the diagnostic accuracies of Fibro-Q, APRI,
and AAR were constructed and superimposed to determine which test would
have the most clinical utility to predict significant fibrosis (group ǁ) ( Figure 1).
Table (5) shows a comparison of AUCs at 95% confidence interval (CI) for
noninvasive indices (Fibro-Q, APRI, AAR) . It was found a superior diagnostic
accuracy of Fibro-Q (AUC= 0.87) over AAR (AUC= 0.71; p=0.003,
Ehab Mahfouz et al
ــــــــــــــــــــــــــــــــــــــــــــــــــــــــــــــــــــــــــــــــــــــــــــــــــــــــــــــــــــــــــــــــــــــــــــــــــــــــــ
56
statistically significant), but equal to APRI (AUC = 0.88; p=0.7, not statistically
significant), in the prediction of significant fibrosis (group ǁ).
The ROC analysis was done to select the most balanced cutoff values for
Fibro-Q, APRI, AAR in order to predict significant fibrosis.These values were
2.41,1.04, and 1.0, respectively. Moreover, ROC analysis was used to calculate
the sensitivity, specificity, positive predictive value (PPV), and negative
predictive value (NPV) of the simple fibrosis prediction tests using our cutoff
values.
Table (6) shows the predictive values of noninvasive indices for significant
fibrosis. Using Fibro-Q, at a cutoff ≥ 2.41, the PPV to predict significant
fibrosis was 100 % with a specificity of 100 %. At a cutoff < 2.41, the NPV of
Fibro-Q to exclude significant fibrosis was 79.7 % with a sensitivity of 69.8 %.
At a cutoff ≥ 1.04, the PPV of APRI to predict significant fibrosis was 88.6 %
with a specificity of 92.3 %. At a cutoff < 1.04, the NPV of APRI to exclude
significant fibrosis was 81.4 % with a sensitivity 74.4 %. In AAR, the cutoff
value to predict the presence (AAR ≥ 1.0) or absence (AAR < 1.0) of significant
fibrosis had a PPV of 94.7% and a NPV of 66.7%.
Therefore, our study found that Fibro-Q had better accuracy than AAR but
equal to APRI. Using a cutoff value of Fibro-Q index ≥ 2.41, the presence of
significant fibrosis could be correctly be identified with a high accuracy with
100% PPV.
Predicting cirrhosis
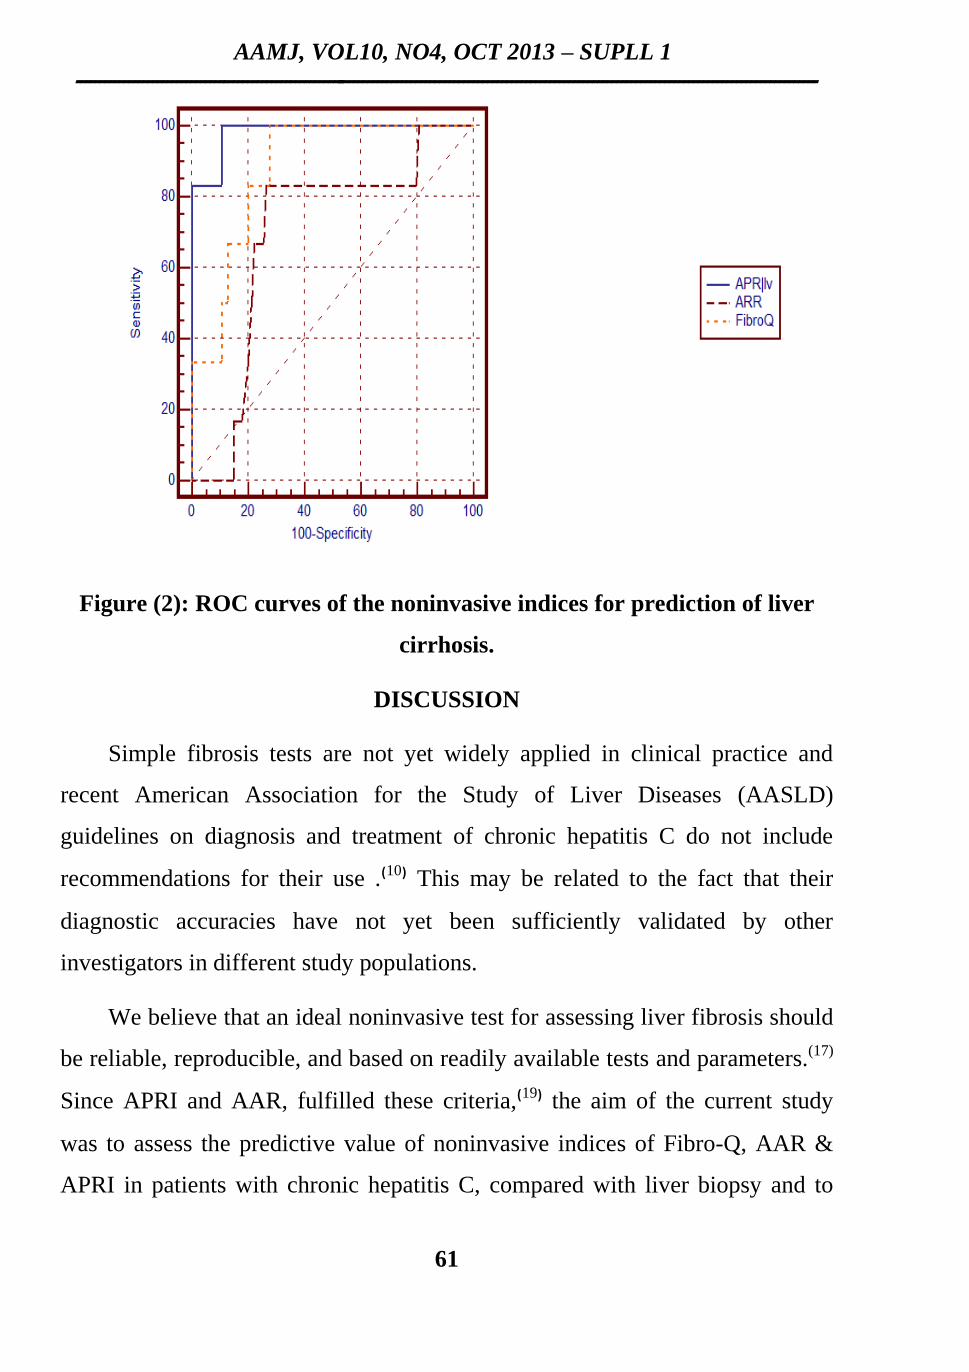
The ROC curves evaluating the diagnostic accuracies of Fibro-Q, APRI,
AAR were constructed and superimposed to predict cirrhosis(group ǀǁ) (Figure
2). Comparison of the AUCs ( 95% CI) for the 3 noninvasive indices, showed a
superior diagnostic accuracy of Fibro-Q (AUC= 0.88) over AAR (AUC=0.7;
AAMJ, VOL10, NO4, OCT 2013 – SUPLL 1
ــــــــــــــــــــــــــــــــــــــــــــــــــــــــــــــــــــــــــــــــــــــــــــــــــــــــــــــــــــــــــــــــــــــــــــــــــــــــــــ
57
p= 0.2, not statistically significant) but inferior to APRI (AUC=0.98; p= 0.1, not
statistically significant), in the prediction of liver cirrhosis. However, APRI had
a superior diagnostic accuracy over AAR ( p= 0.02, statistically significant) in
the prediction of cirrhosis (Table 5).
Similarly we used the ROC analysis to select the most balanced cutoff
values for Fibro-Q, APRI, AAR in order to predict liver cirrhosis. These values
were 2.6, 1.82, and 0.96, respectively. Moreover, ROC analysis was used to
calculate the sensitivity, specificity, PPV, and NPV of the simple fibrosis
prediction tests using our cutoff values.
Table (7) shows predictive values of noninvasive indices for liver cirrhosis.
Using Fibro-Q, at a cutoff ≥ 2.6, the PPV to predict liver cirrhosis was 18.8 %
with a specificity of 72.3 %. At a cutoff > 2.6, the NPV of Fibro-Q to exclude
cirrhosis was 100 % with a sensitivity of 100 %. At a cutoff ≥ 1.82, the PPV of
APRI to predict liver cirrhosis was 37.5 % with a specificity of 89.4 %. At a
cutoff < 1.82, the NPV of APRI to exclude cirrhosis was 98.8 % with sensitivity
100 %. In AAR, the cutoff value to predict the presence (AAR ≥ 0.96) or
absence (AAR < 0.96) of cirrhosis had a PPV of 16.7 % and a NPV of 98.6%.
Therefore, we concluded that the three noninvasive prediction tests had
relatively low PPVs for prediction of liver cirrhosis. Conversely, they had high
NPVs for exclusion of cirrhosis. Using a cutoff value of a Fibro-Q index > 2.6,
the presence of cirrhosis was totally excluded with 100% NPV.
Ehab Mahfouz et al
ــــــــــــــــــــــــــــــــــــــــــــــــــــــــــــــــــــــــــــــــــــــــــــــــــــــــــــــــــــــــــــــــــــــــــــــــــــــــــ
58
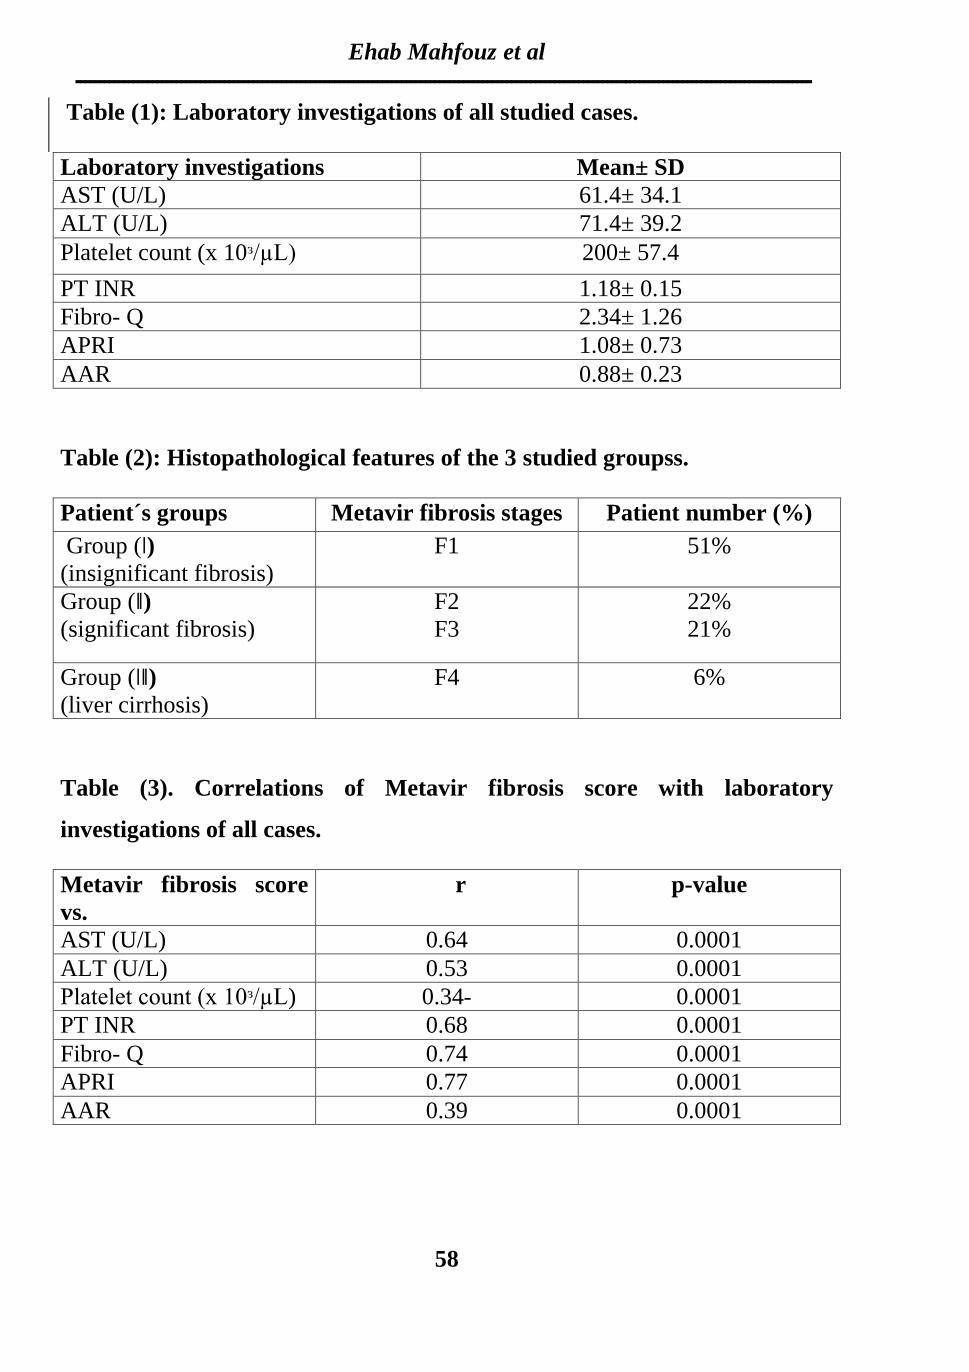
Table (1): Laboratory investigations of all studied cases.
Mean± SD Laboratory investigations
61.4± 34.1 AST (U/L)
71.4± 39.2 ALT (U/L)
200± 57.4 Platelet count (x 10ᶟ/µL)
1.18± 0.15 PT INR
2.34± 1.26 Fibro- Q
1.08± 0.73 APRI
0.88± 0.23 AAR
Table (2): Histopathological features of the 3 studied groupss.
Patient number (%) Metavir fibrosis stages Patient´s groups
51% F1
Group (ǀ)
(insignificant fibrosis)
22%
21%
F2
F3
Group (ǁ)
(significant fibrosis)
6% F4 Group (ǀǁ)
(liver cirrhosis)
Table (3). Correlations of Metavir fibrosis score with laboratory
investigations of all cases.
p-value r Metavir fibrosis score
vs.
0.0001 0.64 AST (U/L)
0.0001 0.53 ALT (U/L)
0.0001 0.34- Platelet count (x 10ᶟ/µL)
0.0001 0.68 PT INR
0.0001 0.74 Fibro- Q
0.0001 0.77 APRI
0.0001 0.39 AAR

AAMJ, VOL10, NO4, OCT 2013 – SUPLL 1
ــــــــــــــــــــــــــــــــــــــــــــــــــــــــــــــــــــــــــــــــــــــــــــــــــــــــــــــــــــــــــــــــــــــــــــــــــــــــــــ
59
Table (4). Correlations of Metavir fibrosis score with noninvasive indices in
the 3 studied groups.
Metavir fibrosis
score
vs.
Group ǀ Group ǁ Group ǁǀ
P- value
FibroQ
mean± SD mean± SD mean±
SD
0.0001
ǀ vs ǁ, ǁǀ
ǁ vs ǁǀ
1.53± 0.51 3.05± 1.2 4.21± 1.31
APRI
0.62± 0.32 1.4± 0.59 2.72± 0.53 0.0001
ǀ vs ǁ, ǁǀ
ǁ vs ǁǀ
AAR
0.79± 0.15 0.97± 0.26 0.98± 0.15 0.0001
ǀ vs ǁ, ǁǀ
ǁ vs ǁǀ
Table (5): Performance of simple fibrosis prediction tests for significant
fibrosis and cirrhosis.
Metavir fibrosis
score
vs.
AUC (group ǁ)
AUC (group ǀǁ)
Fibro-Q 0.87 (95 % CI: 0.8-0.9) 0.88 (95 % CI: 0.80-0.94)
APRI 0.88 (95% CI:0.8-0.9) 0.98 (95 % CI: 0.93-1.0)
AAR 0.71 (95% CI:0.6-0.8) 0.7( 95% CI: 0.6-0.8)

Ehab Mahfouz et al
ــــــــــــــــــــــــــــــــــــــــــــــــــــــــــــــــــــــــــــــــــــــــــــــــــــــــــــــــــــــــــــــــــــــــــــــــــــــــــ
60
Table(6). Predictive values of noninvasive indices for significant fibrosis.
. Fibro-Q AAR APRI Noninvasive test
2.41 1.0 1.04 Cut off value
69.8 41.9 74.4 Sensitivity
100 98.0 92.3 Specificity
100 94.7 88.6 PPV
79.7 66.7 81.4 NPV
86.2 72.3 84.0 Overall accuracy
Table (7): Predictive values of noninvasive indices for liver cirrhosis
.Fibro-Q AAR APRI Noninvasive test
2.6 0.96 1.82 Cut off value
100 83.3 100 Sensitivity
72.3 73.4 89.4 Specificity
18.8 16.7 37.5 PPV
100 98.6 98.8 NPV
74.0 73.0 90.0 Overall accuracy
Figure (1): ROC curves of the noninvasive indices for prediction of
significant fibrosis.
AAMJ, VOL10, NO4, OCT 2013 – SUPLL 1
ــــــــــــــــــــــــــــــــــــــــــــــــــــــــــــــــــــــــــــــــــــــــــــــــــــــــــــــــــــــــــــــــــــــــــــــــــــــــــــ
61
Figure (2): ROC curves of the noninvasive indices for prediction of liver
cirrhosis.
DISCUSSION
Simple fibrosis tests are not yet widely applied in clinical practice and
recent American Association for the Study of Liver Diseases (AASLD)
guidelines on diagnosis and treatment of chronic hepatitis C do not include
recommendations for their use .⁽10⁾ This may be related to the fact that their
diagnostic accuracies have not yet been sufficiently validated by other
investigators in different study populations.
We believe that an ideal noninvasive test for assessing liver fibrosis should
be reliable, reproducible, and based on readily available tests and parameters.(17)
Since APRI and AAR, fulfilled these criteria,⁽19⁾ the aim of the current study
was to assess the predictive value of noninvasive indices of Fibro-Q, AAR &
APRI in patients with chronic hepatitis C, compared with liver biopsy and to

Ehab Mahfouz et al
ــــــــــــــــــــــــــــــــــــــــــــــــــــــــــــــــــــــــــــــــــــــــــــــــــــــــــــــــــــــــــــــــــــــــــــــــــــــــــ
62
determine their cutoff values to differentiate significant fibrosis and cirrhosis in
a community hospital in an area with hyperendemic HCV infection.
Furthermore, we should notice that three different staging systems were
used in the original studies for liver fibrosis tests. AAR results were based on
the Scheuer system; APRI was based on the Ishak system; and Fibro-Q was
based on the Metavir system.⁽21⁾ The different staging systems using either a 5-
stage (F0-F4) or a 7- stage (F0-F6) scale prevented us from comparing fibrosis
scores more precisely.
The current study had some advantages over previous studies. First, the
patients were all from a treatment-naïve population with HCV infection as the
only problem. Second, we compared 3 fibrosis markers that combined routine
blood tests rather than markers only available in the research laboratory. Third,
all histological assessment was performed blindly by one pathologist, thus
preventing inter-observer bias in fibrosis staging. Finally, using a 5- stage
fibrosis scoring system in this study resulted in a lower tendency to induce
interpretation error than would be the case with a 7- stage scoring system⁽6⁾.
In the current study we divided the patients in two different ways to
obviate liver biopsy. The first grouping was group (ǀ) vs group (ǁ). The rationale
for this patient grouping was that there was no need for treatment in patients
with minimal fibrosis. Patients with cirrhosis need screening for hepatocellular
carcinoma, esophageal varices, and complications of portal hypertension,
therefore, we made a second patient grouping of group (ǀ) and group (ǁ) vs
group (ǀǁ). Applying the cutoff values, we were able to discriminate patients
according to two relevant thresholds of fibrosis based on the needs for clinical
treatment decision-making.

AAMJ, VOL10, NO4, OCT 2013 – SUPLL 1
ــــــــــــــــــــــــــــــــــــــــــــــــــــــــــــــــــــــــــــــــــــــــــــــــــــــــــــــــــــــــــــــــــــــــــــــــــــــــــــ
63
The clinical use of AAR in the diagnostic workup of patients with chronic
liver disease is supported by several studies.⁽22⁾ Nevertheless, the use of AAR as
a clinical decision-making aid in patients with chronic liver disease has been a
matter of debate.⁽18⁾
We also attempted to use AAR to detect either significant fibrosis or
cirrhosis and found it to have a low diagnostic accuracy in predicting significant
fibrosis ( AUC 0.71) and cirrhosis ( AUC 0.7). Consistent with our findings,
Wai et al., (2003) ⁽27⁾ also reported that the AUCs of the ROC curve in
differentiating significant fibrosis and cirrhosis were 0.6 and 0.76, respectively.
Also in accordance to our findings, Hsieh et al., (2009), found that AAR was
useful in differentiating significant fibrosis and cirrhosis , with AUCs,0.733 and
0.782, respectively. ⁽12⁾
In contrast to the results of Hsieh et al., (2009) which suggested that AAR
performed better than APRI (but, p ˃0.05, not statistically significant) in
predicting significant fibrosis and cirrhosis, the results of our present study
showed that APRI was superior to AAR ( p < 0.05, statistically significant) in
this regard. Consistent with our findings, Parise et al. (2006) reported that APRI
was superior to AAR in predicting significant fibrosis and cirrhosis. ⁽18⁾
In contrast to the other tests, APRI uses 2 different cutoff values for
exclusion or prediction of significant fibrosis ( < 0.5/ ≥ 1.5) and thus allowed
reliable diagnosis or exclusion of significant fibrosis in approximately 50% of
patients in the study by Wai et al., (2003).We could confirm a high PPV for
significant fibrosis of an APRI ≥ 1.5 in 34.8 % of our patients; however, the
NPV of an APRI < 0.5 for exclusion of significant fibrosis was found to be
slightly lower (78.5% vs. 86% in the Wai et al., 2003). In a systematic review,
Lin et al., (2011) ⁽15⁾ concluded that the AUCs of APRI for predicting significant
Ehab Mahfouz et al
ــــــــــــــــــــــــــــــــــــــــــــــــــــــــــــــــــــــــــــــــــــــــــــــــــــــــــــــــــــــــــــــــــــــــــــــــــــــــــ
64
fibrosis and cirrhosis were 0.76 and 0.82, respectively. At a 40% prevalence of
significant fibrosis, the cutoff values of < 0.5 had a NPV of 80%, but could
reduce the necessity of liver biopsy by only 35%. The results of our current
study showed the AUC of APRI for predicting significant fibrosis and cirrhosis
were 0.88 and 0.98, respectively, which were higher than those reported
previously. This discrepancy may be attributable to differences in the study
populations.
Liu et al., (2006) ⁽16⁾ demonstrated a low accuracy of APRI and AAR for
predicting significant fibrosis in viral hepatitis C carriers with persistently
normal ALT levels. The AUCs of the ROC curve in differentiating significant
fibrosis were only 0.673 for APRI and 0.504 for AAR in their study. In order to
optimize the usefulness of simple noninvasive tests, Hsieh et al., (2009)
formulated a novel index, named Fibro-Q. They found that the Fibro-Q
performed better than APRI (p< 0.05, statistically significant) , and had similar
results to AAR (p > 0.05, not statistically significant), in the prediction of
significant fibrosis (AUC,0.783) and cirrhosis (AUC, 0.791). Furthermore, they
reported that among patients with Fibro-Q scores of > 1.6, 92 of 99 (92.9%)
had significant fibrosis, and only seven patients without significant fibrosis were
classified incorrectly.
In contrast to Hsieh et al. (2009), the result of our current study showed a
superior diagnostic accuracy of Fibro-Q over AAR (p < 0.05, statistically
significant) but equal to APRI (p >0.05, not statistically significant), in the
prediction of significant fibrosis. Moreover, when we used the originally
described cutoff value for Fibro-Q (1.6), we found that among the 43 patients
who had significant fibrosis, only six patients had Fibro-Q scores of 1.6 or less
and among patients with Fibro-Q scores of > 1.6, 37 of 61 (60.7%) had
significant fibrosis, and 24 patients without significant fibrosis were classified

AAMJ, VOL10, NO4, OCT 2013 – SUPLL 1
ــــــــــــــــــــــــــــــــــــــــــــــــــــــــــــــــــــــــــــــــــــــــــــــــــــــــــــــــــــــــــــــــــــــــــــــــــــــــــــ
65
incorrectly. Therefore , in order to optimize the usefulness of Fibro-Q for our
patients, we then selected the most balanced cutoff value for Fibro-Q (2.41)
from the ROC analysis. As a result, the accuracy of Fibro-Q increased to 86.2%
at a cutoff value of 2.41.
As regard the prediction of liver cirrhosis, our study showed that the Fibro-
Q performed better than AAR (p > 0.05, not statistically significant) but inferior
to APRI (p > 0.05, not statistically significant), however, Fibro-Q, APRI and
AAR had relatively low PPVs for prediction of cirrhosis (18.8%, 37.5%, and
16.7% at cutoff levels 2.6, 1.82, and 0.96 respectively). Consistent with our
findings, Hsieh et al., (2009) also reported low diagnostic accuracy of Fibro-Q,
APRI and AAR in predicting cirrhosis. The PPVs were 11.3%, 6.9%, and 10.2%
at cutoff levels 2.6,1.5, and 0.75 respectively. Conversely, our study showed
that the three tests had high NPVs for exclusion of cirrhosis. In this regard, our
results were similar to that of the three tests as described by Hsieh et al.,(2009) (
NPVs 100%,98.5%, and 98.9% respectively) .
In conclusion: the results of our current study demonstrated that Fibro-Q
proved to be a better biomarker than AAR, and equal to APRI, for predicting
significant fibrosis in patients with chronic viral hepatitis C.
Further prospective studies involving larger scale of patients are
warranted to validate the usefulness of Fibro-Q in clinical practice.

Ehab Mahfouz et al
ــــــــــــــــــــــــــــــــــــــــــــــــــــــــــــــــــــــــــــــــــــــــــــــــــــــــــــــــــــــــــــــــــــــــــــــــــــــــــ
66
REFERENCES
1- Alberti A, Chemello L, Benvegnu L. Natural history of hepatitis C. J Hepatol
1999;31:17-24.
2- Afdhal NH, Nunes D: Evaluation of liver fibrosis: a concise review. Am J
Gastroenterol2004, 99:1160-1174.
3- Anonymous. Global surveillance and control of hepatitis C. Report of a
WHO Consultation organized in collaboration with the Viral Hepatitis
Prevention Board, Antwerp, Belgium.J Viral Hepat 1999;6:35-47.
4- Bedossa P, Dargere D, Paradis V. Sampling variability of liver fibrosis in
chronic Hepatitis C.J Hepatol 2003;38:1449-57.
5- Cadranel JF, Rufat P, Degos. Practices of liver biopsy in France: results of a
prospective nationwide survey. For the Group of Epidemiology of the French
Association for Study of the liver (AFEF). J Hepatol 2000;32:477-481.
6-Cheung RC, Currie S, Shen H, Bini EJ, Ho SB, Anand BS, Hu KQ, Wright
TL, Morgan TR. Can we predict the degree of fibrosis in chronic hepatitis C
patients using Routine blood tests in our daily practice ? J Clin
Gastroenterol 2008;42:827-834.
7- Desmet VJ. Milestones in liver disease: Scoring chronic hepatitis. J Hepatol
2003;38:382-386.
8- El-Kamary SS,Mohamed MM, El-Raziky M, Shardell MD, Shaker OG,
ElAkel WA, Esmat G. Liver Fibrosis Staging Through a Stepwise Analysis
of Non-invasive Markers (FibroSteps) in Patients With Chronic Hepatitis C
Infection . Liver International. 2013;33(7):982-990.

AAMJ, VOL10, NO4, OCT 2013 – SUPLL 1
ــــــــــــــــــــــــــــــــــــــــــــــــــــــــــــــــــــــــــــــــــــــــــــــــــــــــــــــــــــــــــــــــــــــــــــــــــــــــــــ
67
9- El-Zanaty F, Way A. Egypt Demographic and Health Survey 2008.
Egyption: Ministry of Health. Cairo: El-Zanaty and Associates, and Macro
International; 2009.
10- Ghang MG, Strader DB, Thomas DL, Seeff LB. Diagnosis, management,
and treatment of hepatitis C: an update.J Hepatol.2009;49:1335-1374.
11- Hanley JA, McNeil BJ. A method of comparing the areas under receiver
operating characteristic curves derived from the same cases. Radiology
1983;148:839-843.
12- Hsieh YY, Tung SY, Lee IL, Lee K, Shen CH, Wei KL, Chang TS, Chuang
CS, Wu CS, Lin YH. FibroQ: an easy and useful noninvasive test for
predicting liver fibrosis in patients with chronic viral hepatitis.J Chang
Gung Med 2009; 32:614-622.
13- Lefkowitch JH. Scheuer's Liver Biopsy Interpretation. 8th ed.
Saunders/Elsevier; 2010.
14- Leroy V, Hilleret MN, Stunn N, Trocme C, Renversez JC, Fature P, Morel
F, Zarski JP. Prospective comparison of six non-invasive scores for the
diagnosis of liver fibrosis in chronic hepatitis C. J Hepatol 2007;46:775-
782.
15- Lin ZH, Xin YN, Dong QJ, Wang Q, Jiang XJ, Zhan SH, et al. Performance
of the aspartate aminotransferase-to-platelet ratio index for the staging of
hepatitis C-related fibrosis: an updated meta-analysis. Hepatology.
2011;53:726–736.
16- Liu CH, Lin JW, Tsai FC, Yang PM, Lai M, Chen JH, Kao JH,Chen DS.
Noninvasive tests for the prediction of significant hepatic fibrosis in

Ehab Mahfouz et al
ــــــــــــــــــــــــــــــــــــــــــــــــــــــــــــــــــــــــــــــــــــــــــــــــــــــــــــــــــــــــــــــــــــــــــــــــــــــــــ
68
hepatitis C virus carriers with persistently normal alanine aminotransferases.
J Liver Int 2006; 26:1087-94.
17- Papastergiou V, Tsochatzis E, Burroughs AK. Non-invasive assessment of
liver fibrosis. Annals of Gastroenterol 2012;25:218-231.
18- Parise ER, Oliveira AC, Figueiredo-Mendes C, Lanzoni V, Martins J,
Nader H, Ferraz ML. Noninvasive serum markers in the diagnosis of
structural liver damage in chronic hepatitis C virus infection. Liver Int 2006;
26:1095-9.
19- Pork GJ, Lin BP,Ngu MC, Jones DB, Katelaris PH. Aspartate
aminotransferase: alanine aminotransferase ratio in chronic hepatitis C
infection: is it a useful predictor of cirrhosis ? J Gastroenterol Hepatol
2000;15:386-390.
20 - Poynard T, McHutchinson J, Manns M. Impact of pegylated interferon alfa-
2b and ribavirin on liver fibrosis in patients with chronic hepatitis C.J
Gastroenterol 2002;122:1303-1313.
21- Rozario R, Ramakrishna B. Histopathological study of chronic hepatitis B
and C: a comparison of two scoring systems. J Hepatol 2003;38:223-229.
22- Sebastiani G, Alberti A. How far is noninvasive assessment of liver fibrosis
from replacing liver biopsy in hepatitis C?. J Viral Hepat. 2012;19:18–32.
23- Strader DB, Wright T, Thomas DL, Seeff LB. AASLD practice guideline:
diagnosis, management, and treatment of hepatitis C. J Hepatol
2004;39:1147-1171.
24- Szabo E, Lotz G, Paska C, Kiss A, Schaff Z. Viral Hepatitis: New Data on
Hepatitis C Infection. Pathology Oncology Resarch. 2003; 9(4), 215-221.
AAMJ, VOL10, NO4, OCT 2013 – SUPLL 1
ــــــــــــــــــــــــــــــــــــــــــــــــــــــــــــــــــــــــــــــــــــــــــــــــــــــــــــــــــــــــــــــــــــــــــــــــــــــــــــ
69
25- Te HS, Jensen DM: Epidemiology of hepatitis B and C viruses: a global
overview. Clin Liver Dis. 2010; 14(1):1-21.
26- Theise ND, Bodenheimer HC, Ferrell LD, Burt AD, Portmann BC, Ferrell
LD (Eds): MacSween's pathology of the liver (6th edition).
Edinburgh:Churchill Livingstone, 2012, pp. 361–402.
27- Wai CT,G reenson JK, Fontana RJ, K albfleisch JD, Marrero JA,
Conjeevaram HS, Lok ASF. A simple noninvasive index can predict both
significant fibrosis and cirrhosis in patients with chronic hepatitis C.
Hepatol.2003;38:518-52