· more useful than ever for ACEA’s stakeholders and partners. ... Hyundai Motor Europe, Iveco...
78
WWW.ACEA.BE
Transcript of · more useful than ever for ACEA’s stakeholders and partners. ... Hyundai Motor Europe, Iveco...

WWW.ACEA.BE


THE AUTOMOBILE INDUSTRY
3 POCKE T GUIDE 2015 / 2016
ForewordIt is with great pleasure that I present to you the 2015-2016 Automobile Industry Pocket Guide. With a new look and refreshed data, we hope that this edition will be more useful than ever for ACEA’s stakeholders and partners. These new statistics show an industry that continues to provide employment and mobility for Europe’s citizens, generate tax and trade revenue for governments, and lead the world in terms of innovation.
This new Pocket Guide paints a picture of a changing industry, one that is beginning to slowly recover from the shocks of the economic crisis of the late 2000s. Revised employment data shows that 12.1 million people now work directly or indirectly in the automotive sector, producing 17.2 million cars, vans, trucks and buses a year. A fleet of 288 million motor vehicles serves the population’s mobility and transport needs across the EU. Sales of new motor vehicles were 14.4 million in 2014 in the EU, with European automobile trade experiencing a healthy trade surplus of €95.1 billion.
As the representative of one of Europe’s most vital strategic industries, ACEA continues to contribute constructively to discussions with policy makers and other stakeholders in order to consolidate the sector’s global competitiveness. ACEA believes that, with a recovery in progress, it is now more important than ever for
policy makers to follow through on their wider plans to drive innovation, foster growth through international trade, and build a more supportive regulatory framework.
Erik Jonnaert ACEA Secretary General
WWW.ACEA.BE


5
ABOUT ACEA
WWW.ACEA.BE
ACEA represents Europe’scar, van, truck and bus makersMembers and partnersThe European Automobile Manufacturers’ Association (ACEA) is the advocate for the automobile industry in Europe, representing manufacturers of passenger cars, vans, trucks and buses with production sites in the EU.
ACEA’s members are: BMW Group, Daimler, DAF Trucks, Fiat Chrysler Automobiles, Ford of Europe, Hyundai Motor Europe, Iveco, Jaguar Land Rover, Opel Group, PSA Peugeot Citroën, Renault Group, Toyota Motor Europe, Volkswagen Group, Volvo Cars, Volvo Group.
ACEA has permanent cooperation with the European Council for Automotive R&D (EUCAR), which is the industry body for collaborative research and development.
ACEA works closely with the 29 national automobile manufacturers’ associations in Europe, and maintains a dialogue on international issues with automobile associations around the world.
ACEA members are:

THE AUTOMOBILE INDUSTRY POCKE T GUIDE 2015 / 2016
6
WWW.ACEA.BE
ACEA’s mission and priority areasACEA’s mission is to:
– Define and advocate the common interests, policies and positions of the European automobile industry;
– Engage in dialogue with the European institutions and other stakeholders in order to advance understanding of industry issues, and to contribute to effective policy and legislation at both European and global levels;
– Act as a portal for expert knowledge on vehicle-related regulation;– Communicate the role and importance of the industry, using reliable data and
information;– Monitor activities that affect the automobile industry, cooperating with the other
stakeholders involved; and– Undertake strategic reflection on the increasingly global challenges of mobility,
sustainability and competitiveness.
Through its member companies, ACEA taps into a wealth of technical, regulatory and practical expertise in the following priority fields:
– Competitiveness, Market and Economy– Environment and Sustainability– International Trade– Research and Innovation– Safety– Transport Policy

7
ABOUT ACEA
WWW.ACEA.BE
How ACEA worksThe ACEA Board of Directors is composed of the CEOs of its member companies. Additionally, a Commercial Vehicle Board of Directors addresses the specific issues that face the commercial vehicle manufacturers that ACEA represents: DAF Trucks, Daimler Trucks, Iveco, MAN Truck & Bus, Scania, Volkswagen Commercial Vehicles and Volvo Group.
The day-to-day work of the ACEA secretariat is overseen by the Secretary General, who ensures that the Board of Directors’ priorities are addressed. Technical expertise and advisory input comes from working groups on topics as diverse as emissions, road and vehicle safety, general transport policy and regulatory compliance. These specialist working groups are made up of experts from the member companies, and are chaired by ACEA staff.

THE AUTOMOBILE INDUSTRY POCKE T GUIDE 2015 / 2016
8
WWW.ACEA.BE
The European Council for Automotive R&D (EUCAR) is the collaborative research organisation of the major automobile manufacturers in Europe, with the mission to strengthen the competitiveness of the manufacturers through strategic collaborative research and innovation.
Together with its members, EUCAR drives the strategy and assessment of collaborative automotive research and innovation, and establishes common work with the European Commission, member states and other key stakeholders. These activities facilitate the participation of EUCAR’s members in high-quality projects with industrially-relevant results. Projects are mainly financed through the European Union Framework Programmes for research and innovation, matched with industry funding.
EUCAR collaborative research and innovation activities cover both passenger and commercial vehicles, focused on the following “Strategic Pillars”:
Collaborative automotive R&I towards propulsion
systems which are clean and energy efficient over
the full life-cycle, with cost-effective technologies, while maintaining customer
priorities
Smart and safe vehicles for all purposes, integrated into a secure and intelligent
transport system, progressing towards seamless mobilityfor all, maximum efficiency and ever-fewer accidents
New sustainable approach to developing and producing affordable and competitive
vehicles in Europe
An integrated approach for reliable, clean, safe and efficient freight transport and passenger mobility, through dedicated vehicle concepts and effective logistics
COMMERCIALVEHICLES
SUSTAINABLEPROPULSION
SAFE & INTEGRATED MOBILITY
AFFORDABILITY & COMPETITIVENESS

9
ABOUT ACEA
WWW.ACEA.BE
EUCAR is governed by its Council, composed of the heads of the research and advanced development divisions of the member companies.
The EUCAR Chairman is nominated annually from the Council on a rotating basis.
EUCAR members are:
BMW Group, DAF Trucks, Daimler, Fiat Chrysler Automobiles, Ford of Europe, Hyundai Motor Europe, Jaguar Land Rover, Opel Group, PSA Peugeot Citroën, Renault Group, Toyota Motor Europe, Volkswagen Group, Volvo Cars and Volvo Group.

THE AUTOMOBILE INDUSTRY POCKE T GUIDE 2015 / 2016
10
WWW.ACEA.BE
EMPLOYMENT
Manufacture of motor vehicles (EU28) 2.3 million people = 7.6% of EU employment in manufacturing 2012Total (EU28 manufacturing, services and construction) 12.1 million people = 5.6% of total EU employment 2012
PRODUCTION
Motor vehicles (world) 90.6 million units 2014Motor vehicles (EU28) 17.2 million units = 19% of global motor vehicle production 2014Passenger cars (world) 72.3 million units 2014Passenger cars (EU28) 15.0 million units = 21% of global passenger car production 2014
REGISTRATIONS
Motor vehicles (world) 89.3 million units 2014Motor vehicles (EU27) 14.4 million units = 16% of global motor vehicle registrations/sales 2014Passenger cars (world) 70.9 million units 2014Passenger cars (EU27) 12.6 million units = 18% of global passenger car registrations/sales 2014Diesel (EU28) 53.0% 2014Alternative fuels (EU28) 2.7% 2014
VEHICLES IN USE
Motor vehicles (EU28) 287.1 million units 2013Passenger cars (EU28) 249.5 million units 2013Motorisation rate (EU28+EFTA) 564 units per 1,000 inhabitants 2013Average age (EU28) 9.7 years 2014
TRADE
Exports (extra-EU28) €124.2 billion 2014Imports (extra-EU28) €29.1 billion 2014Trade balance €95.1 billion 2014
ENVIRONMENT
Average CO2 emissions (EU28) 123.4 g CO2/km 2014
INNOVATION
Automobiles & parts sector €41.5 billion 2013
TAXATION
Fiscal income from motor vehicles (EU14) €396 billion 2014
Key figures

Employment
THE AUTOMOBILE INDUSTRYPOCKE T GUIDE 2015 / 2016
WWW.ACEA.BE
1

WWW.ACEA.BE

13 EMPLOYMENT
WWW.ACEA.BE
Automotive sector: direct and indirect employment in the EU IN THOUSANDS / 2012
DIRECT MANUFACTURING 2,296
Motor vehicles 1,042
Bodies (coachwork), trailers and semi-trailers 155
Parts and accessories 1,100
INDIRECT MANUFACTURING 830
Rubber tyres and tubes, retreading and rebuilding of rubber tyres 115
Computers and peripheral equipment 71
Electric motors, generators and transformers 232
Bearings, gears, gearing and driving elements 196
Cooling and ventilation equipment 214
AUTOMOBILE USE 4,300
Sale of motor vehicles 1,485
Maintenance and repair of motor vehicles 1,493
Sale of motor vehicle parts and accessories 704
Retail sale of automotive fuel in specialised stores 458
Renting and leasing of motor vehicles 159
TRANSPORT 4,067
Other passenger land transport 1,638
Freight transport by road 2,429
CONSTRUCTION 625
Roads and motorways 565
Bridges and tunnels 61 SOURCE: EUROSTAT
The automotive industry generates 12.1 million direct and indirect jobs in the EU

THE AUTOMOBILE INDUSTRY POCKE T GUIDE 2015 / 2016
14
WWW.ACEA.BE
EU automotive employment 2008 2009 2010 2011 2012% change
12/11
Manufacturing direct 2,118,834 1,807,450 1,910,240 2,230,937 2,296,416 2.9
Manufacturing indirect 829,564 750,301 806,518 844,287 829,588 -1.7
Automobile use 3,933,286 3,935,723 4,187,812 4,373,465 4,299,743 -1.7
Transport 3,135,972 3,191,869 3,925,908 3,945,370 4,067,166 3.1
Construction 610,848 587,592 653,989 653,752 625,386 -4.3
TOTAL 10,628,504 10,272,935 11,484,467 12,047,811 12,118,299 0.6
SOURCE: EUROSTAT
Trends in EU automotive employment
2
4
6
8
10
12
Manufacturing direct Manufacturing indirect Automobile use Transport Construction
2009 2010 2011 20122008
0
EU automotive employment IN MILLION UNITS, BY YEAR / 2008 – 2012
+ 11.8%+ 4.9% +0.6%
-3.3%

15 EMPLOYMENT
WWW.ACEA.BE
EU manufacturing employment % SHARE / 2012
Direct automotive employment (manufacturing)2.3 m people= 7.6% of EU employment in manufacturing
Direct & indirect automotive manufacturing employment
3.1 m people= 10.4% of EU employment in manufacturing
Total automotive employment (manufacturing, services and construction)
12.1 m people= 5.6% of total EU employment
EU economically-active population (labour force) 241.1 m people
EU total employment 217.5 m people
EU employment in the manufacturing sector30.0 m people= 13.8% of total EU employment
SOURCE: EUROSTAT
Direct automotive manufacturingemployment
Indirect automotive manufacturing employment
Non-automotivemanufacturing
employment
10.4% of EU manufacturingemployment is in the automotive sector
7.6 %2.3 m
7.6 %2.3 m
Automotivemanufacturing employment 7.6 %
2.3 m
2.8 %0.8 m
10.4 %3.1 m
89.6 %26.9 m

THE AUTOMOBILE INDUSTRY POCKE T GUIDE 2015 / 2016
16
WWW.ACEA.BE
Direct automotive manufacturing employment BY COUNTRY / 2012
Austria 31,555 France 243,779 Netherlands 19,527Belgium 38,432 Germany 812,514 Poland 156,865Bulgaria 12,790 Greece 2,843 Portugal 30,021Croatia 1,529 Hungary 69,245 Romania 131,084Cyprus 157 Ireland 2,370 Slovakia 61,571Czech Republic 143,227 Italy 162,865 Slovenia 12,970Denmark 1,684 Latvia 1,490 Spain 134,605Estonia 2,894 Lithuania 1,657 Sweden 66,836Finland 7,548 Luxembourg 358 United Kingdom 146,000
European Union 2,296,416SOURCE: EUROSTAT, SMMT
The EU automotive sector provides2.3 million direct manufacturing jobs
0.5 1.0 1.5 2.0 2.5
CZECH REPUBLIC
SLOVAKIA
GERMANY
HUNGARY
ROMANIA
SWEDEN
SLOVENIA
POLAND
FRANCE
BELGIUM
AUSTRIA
ITALY
SPAIN
PORTUGAL
EUROPEAN UNION
UNITED KINGDOM
ESTONIA
BULGARIA
FINLAND
NETHERLANDS
LATVIA
LUXEMBOURG
LITHUANIA
IRELAND
CROATIA
GREECE
DENMARK
CYPRUS
Direct automotive manufacturing employment / Active population ratio % SHARE BY COUNTRY / 2012
2.7%
2.3%
2.0%
1.6%
1.4%
1.3%
1.3%
1.0%
0.9%
0.9%
0.8%
0.7%
0.6%
0.6%
0.6%
0.5%
0.4%
0.4%
0.3%
0.2%
0.1%
0.1%
0.1%
0.1%
0.1%
0.1%
0.1%
0.0%

Production
THE AUTOMOBILE INDUSTRYPOCKE T GUIDE 2015 / 2016
WWW.ACEA.BE
2

WWW.ACEA.BE

19
PRODUCTION
WWW.ACEA.BE
90.6 million motor vehicleswere produced globally in 2014WWW.ACEA.BE
World motor vehicle production in 1,000 units
2014 2013% change
2014/2013 % share 2014
Europe 1 20,643 20,025 3.1 22.8Greater China 2 24,152 22,483 7.4 26.7Japan/Korea 14,092 13,897 1.4 15.6Middle East/Africa 1,925 1,561 23.3 2.1North America 17,515 16,588 5.6 19.3South America 4,014 4,787 -16.1 4.4South Asia 8,211 8,618 -4.7 9.1
WORLD 90,552 87,958 2.9 100.0
SOURCE: IHS 1. Includes Turkey and CIS countries 2. Includes Hong Kong and Taiwan
2000 2005 2010 2014
World motor vehicle production IN MILLION UNITS, % SHARE / 2000 – 2014
5
10
15
20
25
0
4%
9%
24%
27%
34%31%
25%
23%
30%
25%
16%
19%
22%
21%18%
16%
4%
7%
9%
9%
4%4%
6% 4%
1%2%
3% 2%
Greater China Europe North America Japan/Korea South Asia South America Middle East/Africa
SOURCE: IHS

THE AUTOMOBILE INDUSTRY POCKE T GUIDE 2015 / 2016
20
WWW.ACEA.BE
72.3 million passenger carswere produced globally in 2014
Middle East / Africa
South America
South Asia
Japan / Korea
2 %
4 %
8 %
17 %
Greater China
Europe
North America
25 %
25 %
19 %
10
20
30
40
50
60
70
80
2003 2004 2005 2006 2007 2008 2009 2010 2011 2012 2013 2014
0
World passenger car production IN MILLION UNITS, % CHANGE / 2003 – 2014
SOURCE: IHS
Greater China Europe North America Japan/Korea South Asia South America Middle East/Africa
+ 4.3%+ 4.0%
+ 4.8%
+ 5.7%+ 24.0%
+ 4.1%
+ 6.5%+ 4.4%
+ 4.0%
-3.5%
-12.7%
% SHARE / 2014

21
PRODUCTION
WWW.ACEA.BE
North America 20 %
Greater China 35 %Middle East / Africa
South America
Japan / Korea
South Asia
Europe
3 %
5 %
9 %
12 %
16 %
18.3 million commercial vehicleswere manufactured worldwide in 2014
2
4
6
8
10
12
14
16
18
20
2003 2004 2005 2006 2007 2008 2009 2010 2011 2012 2013 2014
0
World commercial vehicle production IN MILLION UNITS, % CHANGE / 2003 – 2014
SOURCE: IHS
% SHARE / 2014
+ 11.0%+ 4.9%
+ 2.6%
+ 5.7%
+ 31.8% + 1.0% + 1.5%+ 2.8%
-6.5%
-11.7%
-0.9%
Greater China Europe North America Japan/Korea South Asia South America Middle East/Africa

THE AUTOMOBILE INDUSTRY POCKE T GUIDE 2015 / 2016
22
WWW.ACEA.BE
Heavy commercial vehicles
Medium commercial vehicles
Light commercial vehicles
Passenger cars
2 %
1 %
10 %
87 %
17.2 million motor vehicles were manufactured in the EU in 2014
Motor vehicle production in the EU BY COUNTRY / 2014
PC 1 LCV 2 MCV 3 HCV 4 TOTAL
Austria 134,393 – 12,175 6,623 153,191 Belgium 481,642 0 1,823 29,760 513,225 Bulgaria 1,057 1,213 – – 2,270 Czech Republic 1,157,371 3,826 0 820 1,162,017 Finland 45,842 – – 279 46,121 France 1,455,160 356,174 8,024 35,873 1,855,231 Germany 5,446,423 366,161 39,179 103,075 5,954,838 Hungary 430,683 – – 0 430,683 Italy 410,322 245,565 31,005 7,858 694,750 Netherlands 29,119 – – 53,106 82,225 Poland 394,645 175,521 0 9,043 579,209 Portugal 102,250 56,362 2,400 – 161,012 Romania 391,425 0 0 17 391,442 Slovakia 842,860 – – – 842,860 Slovenia 118,215 – – – 118,215 Spain 1,851,828 535,800 12,082 18,752 2,418,462 Sweden 154,913 – – 32,886 187,799 United Kingdom 1,539,456 44,033 6,786 7,617 1,597,892
European Union 14,987,604 1,784,655 113,474 305,709 17,191,442
SOURCE: IHS
1. Passenger cars2. Light commercial vehicles up to 3.5t3. Medium commercial vehicles from 3.5t to 15t4. Heavy commercial vehicles over 15t
EU motor vehicle production by type % SHARE / 2014

23
PRODUCTION
WWW.ACEA.BE 15 million cars were made in the EU in 2014
2
4
6
8
10
12
14
16
18
2003 2004 2005 2006 2007 2008 2009 2010 2011 2012 2013 2014
0
Passenger car production in the EU IN MILLION UNITS, % CHANGE / 2003 – 2014
SOURCE: IHS
+ 1.0% + 0.6%
+ 4.7%
+ 9.4%+ 2.3%
+ 0.7%
+ 4.7%-7.8%
-12.2%
-1.3%
-5.5%

THE AUTOMOBILE INDUSTRY POCKE T GUIDE 2015 / 2016
24
WWW.ACEA.BE
2.2 million commercial vehicleswere produced in the EU in 2014
0.5
1
1.5
2
2.5
3
2003 2004 2005 2006 2007 2008 2009 2010 2011 2012 2013 2014
0
Commercial vehicle production in the EU IN MILLION UNITS, % CHANGE / 2003 – 2014
SOURCE: IHS
LCV 1 MCV 2 HCV 3
+6.7%
+6.7%
-2.9%
-46.3%
-11.4%
+3.6%
+8.5%
+10.5%
+0.3%
+15.4%
1. Light commercial vehicles up to 3.5t2. Medium commercial vehicles from 3.5t to 15t
3. Heavy commercial vehicles over 15t
+35.1%

25
PRODUCTION
WWW.ACEA.BE
The EU auto industry producesan average of 7 vehicles per worker
2 4 6 8 10 12 14
Motor vehicle productionper direct automotive manufacturing worker IN UNITS, BY COUNTRY / 2012 *
BULGARIA
FINLAND
ROMANIA
SWEDEN
HUNGARY
NETHERLANDS
POLAND
ITALY
AUSTRIA
PORTUGAL
GERMANY
EUROPEAN UNION
CZECH REPUBLIC
FRANCE
SLOVENIA
UNITED KINGDOM
SLOVAKIA
BELGIUM
SPAIN
SOURCE: IHS, EUROSTAT
0.1
0.2
2.6
3.1
3.3
3.9
4.0
4.1
4.5
5.4
7.0
7.6
8.2
10.1
10.8
12.7
13.9
14.6
7.1
* Based on direct automotive manufacturing employment most recent data available.

THE AUTOMOBILE INDUSTRY POCKE T GUIDE 2015 / 2016
26
WWW.ACEA.BE
33
8
10
9
2
23
FRANCE
BELGIUM
NETHERLANDS
SWEDEN
FINLAND
ITALY
ACEA members operate 184 plants across Europe
292 184221
EUROPE
26EUROPE
21EU
19EU
16
ALL MANUFACTURERS ACEA MEMBERS
160
33 UNITED KINGDOM
14
6
SPAIN
PORTUGAL
41
8
GERMANY
CZECH REPUBLIC
3SERBIA
1
5
7
SLOVENIA
AUSTRIA
KAZAKHSTAN
32
3
7
RUSSIA
BELARUS
UKRAINE
17 TURKEY
2UZBEKISTAN
1 BULGARIA
32 ROMANIACROATIA
3
4
15
SLOVAKIA
HUNGARY
POLAND
EU Non -EU
SOURCE: ACEA

Registrations
THE AUTOMOBILE INDUSTRYPOCKE T GUIDE 2015 / 2016
WWW.ACEA.BE
3

WWW.ACEA.BE

29
REGISTRATIONS
WWW.ACEA.BE
Europe
America
21.0 %
28.7 %
Asia
Middle EastAfrica
44.6 %
5.8 %
89.3 million vehicles were sold worldwide in 2014
World new motor vehicle registrations MARKET SHARES / 2014
Motor vehicles In 1,000 Units 2014 2013 % change 14/13 % share 2014
EUROPE 18,733 18,455 1.5 21.0
EU 1 14,400 13,598 5.9 16.1EFTA 526 529 -0.5 0.6Russia 2,577 2,896 -11.0 2.9Turkey 801 886 -9.6 0.9Ukraine 99 221 -55.4 0.1Others-Europe 2 330 325 1.5 0.4
AMERICA 25,604 25,107 2.0 28.7
North America 19,986 18,858 6.0 22.4of which the US 16,927 15,956 6.1 19.0
South America 5,618 6,249 -10.1 6.3of which Brazil 3,494 3,764 -7.2 3.9
ASIA 39,826 38,153 4.4 44.6
China 24,261 22,603 7.3 27.2Japan 5,538 5,341 3.7 6.2India 3,209 3,251 -1.3 3.6South Korea 1,673 1,550 8.0 1.9Others-Asia 3 5,144 5,408 -4.9 5.8
MIDDLE EAST/AFRICA 5,135 4,707 9.1 5.8
WORLD 89,297 86,422 3.3 100.0
SOURCE: ACEA, IHS 1. Data for Malta n.a. 2. Includes Belarus, Bosnia-Herzegovina, Kazakhstan, Macedonia, Serbia, Uzbekistan 3. Includes Hong Kong, Taiwan and all the other South Asian countries excluding India

THE AUTOMOBILE INDUSTRY POCKE T GUIDE 2015 / 2016
30
WWW.ACEA.BE70.9 million cars were registered worldwide in 2014
World new passenger car registrations MARKET SHARES / 2014
Passenger cars In 1,000 Units 2014 2013 % change 14/13 % share 2014
EUROPE 16,290 16,070 1.4 23.0
EU 1 12,551 11,880 5.6 17.7EFTA 456 457 -0.4 0.6Russia 2,327 2,598 -10.4 3.3Turkey 587 665 -11.6 0.8Ukraine 91 202 -54.8 0.1Others-Europe 278 269 3.4 0.4
AMERICA 20,646 20,340 1.5 29.1
North America 16,293 15,438 5.5 23.0of which the US 2 13,842 13,115 5.5 19.5
South America 4,353 4,902 -11.2 6.1of which Brazil 2,801 3,051 -8.2 4.0
ASIA 29,831 27,720 7.6 42.1
China 18,072 16,185 11.7 25.5Japan 4,679 4,525 3.4 6.6India 2,393 2,277 5.1 3.4South Korea 1,420 1,287 10.4 2.0Others-Asia 3,267 3,446 -5.2 4.6
MIDDLE EAST/AFRICA 4,105 3,726 10.2 5.8
WORLD 70,871 67,856 4.4 100.0
SOURCE: ACEA, IHS 1. Data for Malta n.a. 2. Based on production type
Europe
America
23 %
29.1 %
Asia
Middle EastAfrica
42.1 %
5.8 %
31
REGISTRATIONS
WWW.ACEA.BE
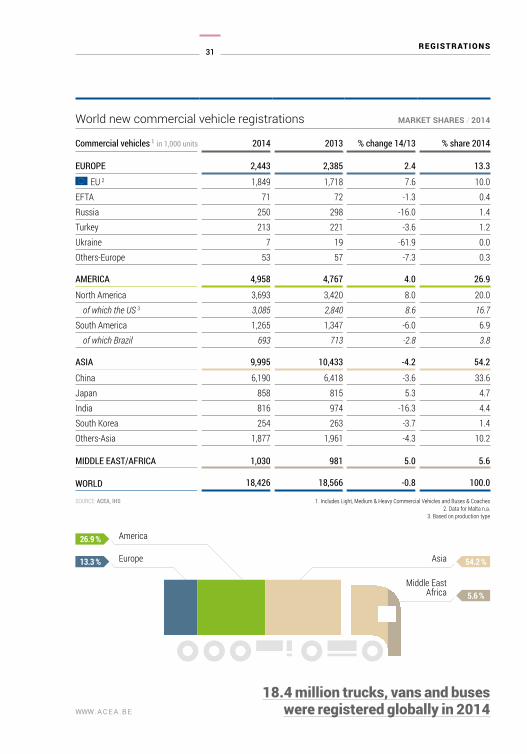
18.4 million trucks, vans and buseswere registered globally in 2014
World new commercial vehicle registrations MARKET SHARES / 2014
Commercial vehicles 1 in 1,000 units 2014 2013 % change 14/13 % share 2014
EUROPE 2,443 2,385 2.4 13.3
EU 2 1,849 1,718 7.6 10.0EFTA 71 72 -1.3 0.4Russia 250 298 -16.0 1.4Turkey 213 221 -3.6 1.2Ukraine 7 19 -61.9 0.0Others-Europe 53 57 -7.3 0.3
AMERICA 4,958 4,767 4.0 26.9
North America 3,693 3,420 8.0 20.0of which the US 3 3,085 2,840 8.6 16.7
South America 1,265 1,347 -6.0 6.9of which Brazil 693 713 -2.8 3.8
ASIA 9,995 10,433 -4.2 54.2
China 6,190 6,418 -3.6 33.6Japan 858 815 5.3 4.7India 816 974 -16.3 4.4South Korea 254 263 -3.7 1.4Others-Asia 1,877 1,961 -4.3 10.2
MIDDLE EAST/AFRICA 1,030 981 5.0 5.6
WORLD 18,426 18,566 -0.8 100.0
SOURCE: ACEA, IHS 1. Includes Light, Medium & Heavy Commercial Vehicles and Buses & Coaches 2. Data for Malta n.a. 3. Based on production type
Europe
America
13.3 %
26.9 %
Asia
Middle EastAfrica
54.2 %
5.6 %

THE AUTOMOBILE INDUSTRY POCKE T GUIDE 2015 / 2016
32
WWW.ACEA.BEThe EU represents a market of 14.4 million vehicles
Motor vehicle registrations in the EU BY COUNTRY / 2014
PC 1 LCV 2 CV 3 TOTAL
Austria 303,318 31,168 7,729 342,215 Belgium 482,939 53,373 8,943 545,255 Bulgaria 20,359 3,972 n.a. 24,331 Croatia 33,997 5,215 1,058 40,270 Cyprus 8,283 1,151 26 9,460 Czech Republic 192,314 13,165 10,115 215,594 Denmark 189,051 28,498 4,159 221,708 Estonia 20,861 2,906 892 24,659 Finland 106,236 10,624 3,251 120,111 France 1,795,885 370,362 44,680 2,210,927 Germany 3,036,773 228,323 91,622 3,356,718 Greece 71,218 4,856 558 76,632 Hungary 67,476 15,937 5,306 88,719 Ireland 96,344 16,646 2,000 114,990 Italy 1,359,616 117,709 14,640 1,491,965 Latvia 12,452 2,539 1,270 16,261 Lithuania 14,503 1,997 2,539 19,039 Luxemburg 49,793 3,357 1,172 54,322 Netherlands 387,835 51,792 11,031 450,658 Poland 327,219 45,376 19,183 391,778 Portugal 142,827 26,166 3,365 172,358 Romania 70,172 9,903 5,055 85,130 Slovakia 72,249 5,630 4,093 81,972 Slovenia 53,296 6,978 1,660 61,934 Spain 855,308 113,863 18,110 987,281 Sweden 303,948 41,933 6,586 352,467 United Kingdom 2,476,435 321,686 44,909 2,843,030
European Union 4 12,550,707 1,535,125 313,952 14,399,784
Iceland 9,536 855 190 10,581 Norway 144,202 29,611 6,460 180,273 Switzerland 301,942 28,822 4,796 335,560
EFTA 455,680 59,288 11,446 526,414
EU + EFTA 13,006,387 1,594,413 325,398 14,926,198
SOURCE: ACEA, NATIONAL AUTOMOTIVE ASSOCIATIONS 1. Passenger cars 2. New light commercial vehicles up to 3.5t 3. New commercial vehicles (trucks) over 3.5t 4. Data for Malta n.a.

33
REGISTRATIONS
WWW.ACEA.BE Vehicle sales mirror economic growth
1.7
1.9
2.1
2.3
2.5
2.7
11
12
13
14
15
16
EU new CV registrations (million units of CVs) EU GDP growth (annual % change in GDP)
EU new PC registrations (million units of PCs) EU GDP growth (annual % change in GDP)
2003
2003
2004
2004
2005
2005
2006
2006
2007
2007
2008
2008
2009
2009
2010
2010
2011
2011
2012
2012
2013
2013
2014
2014
2015
2015
2016
2016
1.5
10
- 4 %
- 4 %
- 3 %
- 3 %
- 2 %
- 2 %
- 1 %
- 1 %
0 %
0 %
1 %
1 %
2 %
2 %
3 %
3 %
4 %
4 %
New passenger car registrationsand annual GDP growth in the EU 2003 – 2016
New commercial vehicle registrations and annual GDP growth in the EU IN MILLION UNITS / 2003 – 2016
SOURCE: ACEA, IHS, DG ECFIN
SOURCE: ACEA, IHS, DG ECFIN

THE AUTOMOBILE INDUSTRY POCKE T GUIDE 2015 / 2016
34
WWW.ACEA.BE12.5 million cars were registered in the EU in 2014
2
4
6
8
10
12
14
16
18
2003 2004 2005 2006 2007 2008 2009 2010 2011 2012 2013 2014
0
New passenger car registrations in the EU IN MILLION UNITS, % CHANGE / 2003 – 2014
+1.5% -0.5%-7.9% -1.2%
-5.6%-1.6%
-8.2% -1.4%
+3.5% +0.9%
+5.6%
SOURCE: ACEA

35
REGISTRATIONS
WWW.ACEA.BE
1.8 million commercial vehicleswere registered in the EU in 2014
0.5
1
1.5
2
2.5
3
2003 2004 2005 2006 2007 2008 2009 2010 2011 2012 2013 2014
0
New commercial vehicle registrations in the EU IN MILLION UNITS, % CHANGE / 2003 – 2014
+3.5%+2.6%
-7.3%
-33.0%-12.4%
+7.6%
+7.5%
+9.8%
+7.3%+7.6%
+1.3%
SOURCE: ACEA
New LCV 1 New MCV & HCV 2
1. New light commercial vehicles up to 3.5t2. New medium and heavy commercial vehicles (trucks) over 3.5t

THE AUTOMOBILE INDUSTRY POCKE T GUIDE 2015 / 2016
36
WWW.ACEA.BE
25 new cars were registeredper 1,000 inhabitants in the EU in 2014
10 20 30 40 50 60 70 80 90
New passenger car registrations per 1,000 inhabitants BY COUNTRY, IN UNITS / 2014
BULGARIA
ROMANIA
LITHUANIA
LATVIA
GREECE
HUNGARY
CROATIA
POLAND
CYPRUS
SLOVAKIA
PORTUGAL
ESTONIA
CZECH REPUBLIC
SPAIN
FINLAND
IRELAND
ITALY
NETHERLANDS
EUROPEAN UNION
SLOVENIA
FRANCE
SWEDEN
DENMARK
AUSTRIA
GERMANY
UNITED KINGDOM
BELGIUM
LUXEMBOURG 91
43
39
38
36
34
32
27
26
25
23
22
21
19
18
18
16
14
13
10
9
8
7
6
6
5
4
3
SOURCE: ACEA, EUROSTAT

37
REGISTRATIONS
WWW.ACEA.BE
The small and medium segmentsmake up over half of the total EU car market
2
4
6
8
10
12
14
16
18
2003 2004 2005 2006 2007 2008 2009 2010 2011 2012 2013 2014
0
New passenger cars sold in the EU BY SEGMENT, IN MILLION UNITS, % SHARE / 2003 – 2014
SOURCE: IHS
Small (A+B) Lower Medium (C ) Upper Medium (D) Luxury (E+F) MPV SUV
21%
13%
3%
9%
22%
32%

THE AUTOMOBILE INDUSTRY POCKE T GUIDE 2015 / 2016
38
WWW.ACEA.BE
Alternative fuel vehicles representa small but growing share of the car market
New passenger cars in the EU by fuel type % SHARE / 2011 – 2014
2011 2012
2013 2014 2
SOURCE: EEA
Petrol Diesel Alternative fuels 1
1.4% 2.2%
2.4% 2.7 %
55.2% 54.9%
52.5% 53.0 %
43.4% 43.0%
45.1% 44.3 %
1. Includes pure electric, liquefied petroleum gas vehicles (LPGs), natural gas vehicles (NG), ethanol (E85), biodiesel and plug-in hybrid vehicles2. Provisional data

Vehicles in use
THE AUTOMOBILE INDUSTRYPOCKE T GUIDE 2015 / 2016
WWW.ACEA.BE
4

WWW.ACEA.BE

41
VEHICLES IN USE
WWW.ACEA.BE
Between 2005 and 2013, the world motorisation rate rose by a fifth
Motorisation rate per 1,000 inhabitants IN UNITS, % CHANGE / 2013 – 2005
SOURCE: OICA
649
564
253
CENTRAL & SOUTH AMERICA
ASIA / OCEANIAMIDDLE EAST
JAPAN & SOUTH KOREA
AFRICA
635
790
+3%
+6%
+42%NAFTA
EU + EFTA
RUSSIA / TURKEYOTHER EUROPE
16773
544
43
+53%+107%
+4%
+27%
198
301
285
308
182
204
123 61
180
20
91
280
722
208
77

THE AUTOMOBILE INDUSTRY POCKE T GUIDE 2015 / 2016
42
WWW.ACEA.BE
Passenger cars in use INTERNATIONAL COMPARISON, IN MILLION UNITS / 2005 – 2013
Commercial vehicles in use INTERNATIONAL COMPARISON, IN MILLION UNITS / 2005 – 2013
50
20
40
60
80
100
120
140
100
150
200
250
0
0
2005 2013
2005 2013
SOURCE: OICA
SOURCE: OICA
EU
US
US
EU
CHINA
CHINA
JAPAN
JAPAN
RUSSIA
MEXICO
BRAZIL
BRAZIL
MEXICO
INDONESIA
CANADA
THAILAND
INDIA
RUSSIA
SOUTH KOREA
INDIA
229
133
21
57
2618 14 18
8 11
250
120
101
60
37 3125 21 19 15
105
34
1019
7 5 4 6 63
133
38
25
1710 8 8 7 7 6
The global vehicle fleet is on the rise

43
VEHICLES IN USE
WWW.ACEA.BE
100 200 300 400 500 600 700
LUXEMBOURG
ICELAND
MALTA
ITALY
FINLAND
LITHUANIA
NORWAY
POLAND
AUSTRIA
FRANCE
SWITZERLAND
SPAIN
UNITED KINGDOM
GERMANY
EU+EFTA
ESTONIA
BELGIUM
SLOVENIA
GREECE
PORTUGAL
NETHERLANDS
SWEDEN
CZECH REPUBLIC
CYPRUS
DENMARK
IRELAND
BULGARIA
SLOVAKIA
CROATIA
HUNGARY
LATVIA
ROMANIA
Motorisation rate in EU+EFTA PER 1,000 INHABITANTS / 2013
Europe has 564 vehicles per 1,000 inhabitants
SOURCE: OICA
759737
690686
671651
608599597594
588579578
568564564562560558
542534530
516515
495484
460404
371354351
253

THE AUTOMOBILE INDUSTRY POCKE T GUIDE 2015 / 2016
44
WWW.ACEA.BEThe EU vehicle fleet continues to grow
50
100
150
200
250
300
350
2005 2006 2007 2008 2009 2010 2011 2012 2013
0
EU vehicle fleet IN MILLION UNITS / 2005 – 2013
SOURCE: OICA
229 233
3534
232
36
237
37
239
37
242
37
245
37
247
37
250
38
Passenger cars Commercial vehicles

45
VEHICLES IN USE
WWW.ACEA.BE
10 % 20 % 30 % 40 % 50 % 60 % 70 % 80 % 90 %
AUSTRIA
BELGIUM 1
CROATIA
CYPRUS
CZECH REPUBLIC
DENMARK 2
ESTONIA
FINLAND
FRANCE
GERMANY
HUNGARY
IRELAND
ITALY
LATVIA
LITHUANIA 1
LUXEMBOURG 3
MALTA
NETHERLANDS 1
POLAND
PORTUGAL
ROMANIA
SLOVENIA
SPAIN
SWEDEN 1
UNITED KINGDOM 1
Passenger car fleet by country and age % SHARE / 2012
SOURCE: EUROSTAT
Less than 2 years From 2 to 5 years From 5 to 10 years 10 years or over
1. 2011 data / 2. 2008 data / 3. 2009 data
* Years 2013 and 2014 are estimates
Cars in the EU are on average 9.7 years old
Average age of the EU car fleet IN YEARS / 2006 – 2014
7.6
8
8.4
8.8
9.2
9.6
10
SOURCE: IHS 2006 2007 2008 2009 2010 2011 2012 2013 * 2014 *
8.4 8.48.5 8.6
8.99.1
9.39.5
9.7
Note: Only countries for which sourced data is available are listed

THE AUTOMOBILE INDUSTRY POCKE T GUIDE 2015 / 2016
46
WWW.ACEA.BE
Petrol
Alternative fuels 1
Diesel
54 %
5 %
41 %
10 % 20 % 30 % 40 % 50 % 60 % 70 % 80 % 90 %
AUSTRIABELGIUM
BULGARIACROATIACYPRUS
CZECH REPUBLICDENMARK
ESTONIAFINLANDFRANCE
GERMANYGREECE
HUNGARYIRELAND
ITALYLATVIA
LITHUANIALUXEMBOURG
MALTANETHERLANDS
POLANDPORTUGAL
ROMANIASLOVAKIASLOVENIA
SPAINSWEDEN
UNITED KINGDOM
Passenger car fleet by fuel type % SHARE / 2014
SOURCE: EMISIA SA
Petrol Diesel Alternative fuels 1
1. Includes E85, CNG, LPG and hybrid gasoline
EU passenger car fleet by fuel type % SHARE / 2014
Most cars on EU roads havean internal combustion engine

Trade
THE AUTOMOBILE INDUSTRYPOCKE T GUIDE 2015 / 2016
WWW.ACEA.BE
5

WWW.ACEA.BE

49
TRADE
WWW.ACEA.BE
EU exports of motor vehicles VALUE MARKET SHARE / 2014
The EU exported 6 million vehicles in 2014
SOURCE: EUROSTAT
NORTHAMERICA
SOUTH AMERICACARIBBEAN
AFRICA
MIDDLEEAST
EFTAEASTERNEUROPE
ASIAOCEANIA

THE AUTOMOBILE INDUSTRY POCKE T GUIDE 2015 / 2016
50
WWW.ACEA.BE
EU motor vehicle trade BY TYPE, IN MILLION € / 2014
Trade in value (€m) PC 1 LCV 2 CV & BC 3 TOTAL
2013
Imports 23,657 3,501 999 28,157Exports 111,289 4,495 6,954 122,738Trade balance 87,631 994 5,955 94,581
2014
Imports 24,093 3,891 1,133 29,117Exports 114,077 3,927 6,236 124,240Trade balance 89,984 36 5,103 95,123
% CHG 14 / 13
Imports 1.8% 11.1% 13.4% 3.4%Exports 2.5% -12.6% -10.3% 1.2%Trade balance 2.7% -96.4% -14.3% 0.6%SOURCE: EUROSTAT
EU motor vehicle trade BY TYPE, IN UNITS / 2014
Trade in volume (in units) PC 1 LCV 2 CV & BC 3 TOTAL
2013
Imports 2,031,780 288,077 89,387 2,409,244Exports 5,850,713 487,310 238,243 6,576,266
2014
Imports 2,043,919 310,426 90,029 2,444,374Exports 5,461,083 366,656 178,452 6,006,191
% CHG 14 / 13
Imports 0.6% 7.8% 0.7% 1.5%Exports -6.7% -24.8% -25.1% -8.7%SOURCE: EUROSTAT
The automobile industry generates a €95.1 billion trade surplus
1. Passenger cars2. Commercial vehicles up to 5t
3. Commercial vehicles over 5t + buses and coaches

51
TRADE
WWW.ACEA.BE
Origin of most EU motor vehicle imports IN UNITS / 2014
2009 2010 2011 2012 2013 2014% change
14 / 13% share
2014
WORLD 2,531,911 2,481,054 2,585,897 2,430,784 2,409,244 2,444,374 1.46% 100%
Turkey 499,903 571,291 574,610 583,629 584,633 700,152 19.8% 28.6%
South Korea 356,052 299,739 388,211 408,251 406,281 348,263 -14.3% 14.2%
Japan 695,001 613,035 517,420 397,523 380,990 293,243 -23.0% 12.0%
United States 156,350 186,788 243,497 242,986 220,531 241,022 9.3% 9.9%
China 210,196 165,136 161,540 183,283 169,569 174,100 2.7% 7.1%
Morocco 4,916 4,904 20,302 64,624 99,503 168,989 69.8% 6.9%
India 267,618 226,269 234,160 162,626 174,994 107,587 -38.5% 4.4%
Serbia 285 304 4,366 21,747 84,715 91,870 8.4% 3.8%
South Africa 38,886 74,227 85,666 67,690 59,515 86,641 45.6% 3.5%
Mexico 116,478 137,761 183,965 179,620 107,334 73,448 -31.6% 3.0%
SOURCE: EUROSTAT
100 200 300 400 500 600 700
TURKEY
SOUTH KOREA
JAPAN
UNITED STATES
CHINA
MOROCCO
INDIA
SERBIA
SOUTH AFRICA
MEXICO
Origin of most EU motor vehicle imports IN THOUSAND UNITS / 2014
SOURCE: EUROSTAT
About 2.5 million vehicles are imported to the EU annually

THE AUTOMOBILE INDUSTRY POCKE T GUIDE 2015 / 2016
52
WWW.ACEA.BE
Main destinations for EU motor vehicle exports IN UNITS / 2014
2009 2010 2011 2012 2013 2014% change
14 / 13% share
2014
WORLD 3,699,021 4,731,016 6,326,671 6,411,638 6,576,266 6,006,191 -8.7% 100.0%
United States 550,879 714,955 751,830 884,545 960,413 994,487 3.5% 16.6%
China 174,245 349,738 487,108 534,745 559,033 612,563 9.6% 10.2%
Turkey 188,652 383,896 434,380 395,419 532,522 415,857 -21.9% 6.9%
Russia 191,938 324,866 516,794 623,221 491,766 327,845 -33.3% 5.5%
Switzerland 225,443 281,868 322,000 332,169 300,601 298,588 -0.7% 5.0%
Japan 114,730 148,212 177,975 207,314 245,443 235,557 -4.0% 3.9%
Benin 78,626 90,701 145,972 232,570 252,025 223,651 -11.3% 3.7%
Algeria 88,396 92,942 118,417 244,982 220,602 193,276 -12.4% 3.2%
Australia 96,378 141,256 156,800 190,302 187,664 182,887 -2.5% 3.0%
South Korea 33,537 66,173 76,961 96,318 118,396 175,723 48.4% 2.9%
SOURCE: EUROSTAT
0.2 0.4 0.6 0.8 1.0
UNITED STATES
CHINA
TURKEY
RUSSIA
SWITZERLAND
JAPAN
BENIN
ALGERIA
AUSTRALIA
SOUTH KOREA
Main destinations for EU motor vehicle exports IN MILLION UNITS / 2014
SOURCE: EUROSTAT
Most EU motor vehicle exports go to the US

53
TRADE
WWW.ACEA.BE
South Korea
South Africa
Morocco
Serbia
Mexico
India
Thailand
Rest of the world
17 %
5 %
5 %
5 %
4 %
3 %
1 %
3 %
Turkey
Japan
United States
18 %
19 %
20 %
Origin of most EU passenger car imports BY VALUE, IN MILLION € / 2014
2009 2010 2011 2012 2013 2014% change
14 / 13% share
2014
WORLD 22,129 22,339 24,824 24,422 23,657 24,093 1.8% 100.0%
United States 2,967 3,491 4,670 5,516 4,312 4,901 13.7% 20.3%
Japan 8,276 7,532 7,243 6,002 5,804 4,630 -20.2% 19.2%
Turkey 3,210 3,416 3,353 3,141 3,521 4,318 22.6% 17.9%
South Korea 2,631 2,477 3,424 3,915 4,086 3,998 -2.2% 16.6%
South Africa 470 846 896 548 586 1,234 110.8% 5.1%
Morocco 27 10 163 608 763 1,225 60.6% 5.1%
Serbia 2 2 2 277 1,081 1,149 6.3% 4.8%
Mexico 1,501 1,758 2,463 2,500 1,604 1,036 -35.4% 4.3%
India 1,539 1,300 1,570 1,058 1,075 720 -33.0% 3.0%
Thailand 112 142 96 38 145 218 50.1% 0.9%
SOURCE: EUROSTAT
The US and Japan accountfor the highest import value for cars
SOURCE: EUROSTAT
Origin of EU passenger car imports VALUE MARKET SHARE / 2014

THE AUTOMOBILE INDUSTRY POCKE T GUIDE 2015 / 2016
54
WWW.ACEA.BE
Origin of most EU passenger car imports IN UNITS / 2014
2009 2010 2011 2012 2013 2014% change
14 / 13% share
2014
WORLD 2,221,792 2,132,374 2,233,866 2,006,257 2,031,780 2,043,919 0.6% 100.0%
Turkey 316,196 332,643 337,340 320,636 362,946 469,537 29.4% 23.0%
South Korea 353,726 297,744 386,592 406,684 405,084 347,294 -14.3% 17.0%
Japan 679,785 598,772 507,004 395,635 375,534 292,204 -22.2% 14.3%
United States 150,768 180,241 236,822 235,420 213,047 232,830 9.3% 11.4%
Morocco 3,044 2,959 19,846 62,385 83,956 152,583 81.7% 7.5%
India 266,204 224,809 233,008 162,051 174,564 107,118 -38.6% 5.2%
China 155,738 155,681 149,455 110,642 97,989 100,808 2.9% 4.9%
Serbia 134 178 4,235 21,676 84,639 91,753 8.4% 4.5%
Mexico 116,468 137,746 183,949 179,596 107,059 72,845 -32.0% 3.6%
South Africa 31,418 65,351 71,591 43,934 42,483 69,177 62.8% 3.4%
SOURCE: EUROSTAT
50 100 150 200 250 300 350 400 450
TURKEY
SOUTH KOREA
JAPAN
UNITED STATES
MOROCCO
INDIA
CHINA
SERBIA
MEXICO
SOUTH AFRICA
Origin of most EU passenger car imports IN THOUSAND UNITS / 2014
SOURCE: EUROSTAT
The EU imported over 2 million cars in 2014

55
TRADE
WWW.ACEA.BE
Main destinations for EU passenger car exports BY VALUE, IN MILLION € / 2014
2009 2010 2011 2012 2013 2014% change
14 / 13% share
2014
WORLD 47,715 75,767 93,171 107,751 111,289 114,077 2.5% 100.0%
United States 12,768 19,128 19,482 24,939 27,822 29,426 5.8% 25.8%
China 5,475 12,182 17,335 19,296 19,670 23,488 19.4% 20.6%
Switzerland 3,935 5,219 6,646 6,832 6,170 6,336 2.7% 5.6%
Japan 2,713 3,843 5,089 6,304 6,388 5,938 -7.0% 5.2%
Russia 2,563 4,063 7,016 8,744 7,048 5,207 -26.1% 4.6%
Turkey 2,067 4,255 5,229 4,884 5,998 5,127 -14.5% 4.5%
South Korea 805 1,682 1,955 2,497 3,127 4,684 49.8% 4.1%
Australia 1,613 2,758 3,177 3,497 3,631 3,478 -4.2% 3.0%
Canada 1,789 2,414 2,480 2,996 2,845 2,999 5.4% 2.6%
Norway 1,854 2,699 3,016 3,174 3,027 2,781 -8.1% 2.4%
SOURCE: EUROSTAT
SOURCE: EUROSTAT
The US is the EU’smost valuable car export market
Destinations for EU passenger car exports VALUE MARKET SHARE / 2014
China
United States
20.6 %
25.8 %
Japan
Russia
Turkey
South Korea
Australia
Canada
Norway
Rest of the world
Switzerland
5.2 %
4.6 %
4.5 %
4.1 %
3.0 %
2.6 %
2.4 %
21.6 %
5.6 %

THE AUTOMOBILE INDUSTRY POCKE T GUIDE 2015 / 2016
56
WWW.ACEA.BE
Main destinations for EU passenger car exports IN UNITS / 2014
2009 2010 2011 2012 2013 2014% change
14 / 13% share
2014
WORLD 3,339,264 4,197,129 5,111,768 5,764,020 5,850,713 5,461,083 -6.7% 100.0%
United States 547,349 708,586 731,144 874,588 949,766 982,790 3.5% 18.0%
China 172,221 345,582 478,877 526,878 554,383 607,843 9.6% 11.1%
Turkey 170,457 339,562 388,001 357,131 486,703 372,268 -23.5% 6.8%
Russia 176,596 291,164 470,880 565,987 439,632 301,062 -31.5% 5.5%
Switzerland 203,939 255,875 291,900 303,503 272,586 267,923 -1.7% 4.9%
Japan 114,650 148,083 175,242 206,714 245,335 234,713 -4.3% 4.3%
Benin 73,672 86,884 138,786 224,191 249,312 219,023 -12.1% 4.0%
South Korea 32,659 64,142 75,144 94,667 116,423 172,734 48.4% 3.2%
Algeria 75,484 74,694 102,859 215,936 194,154 164,121 -15.5% 3.0%
Australia 84,157 123,250 141,396 150,429 165,694 162,556 -1.9% 3.0%
SOURCE: EUROSTAT
18% of EU car exports go to the US
0.2 0.4 0.6 0.8 1.0
UNITED STATES
CHINA
TURKEY
RUSSIA
SWITZERLAND
JAPAN
BENIN
SOUTH KOREA
ALGERIA
AUSTRALIA
Main destinations for EU passenger car exports IN MILLION UNITS / 2014
SOURCE: EUROSTAT

THE AUTOMOBILE INDUSTRYPOCKE T GUIDE 2015 / 2016
WWW.ACEA.BE
6
Environment

WWW.ACEA.BE

59
ENVIRONMENT
WWW.ACEA.BE
2014 average emissions
(g CO2/km)% change
14 / 13
Austria 128.6 -2.3Belgium 121.3 -2.2Bulgaria 136.0 -4.0Croatia 115.8Cyprus 130.1 -6.6Czech Republic 131.8 -2.1Denmark 110.2 -2.2Estonia 140.9 -4.1Finland 127.4 -3.3France 114.2 -2.7Germany 132.5 -2.7Greece 108.2 -3.3Hungary 133.0 -1.0Ireland 117.1 -3.0Italy 118.2 -2.4Latvia 140.4 -4.6Lithuania 135.8 -2.8Luxembourg 129.9 -2.6Malta 115.1 -3.0Netherlands 107.3 -1.6Poland 132.7 -3.9Portugal 108.8 -3.0Romania 128.3 -2.9Slovakia 131.8 -2.5Slovenia 121.3 -3.4Spain 118.6 -3.1Sweden 131.0 -1.7United Kingdom 124.6 -2.9
EU average 123.4 -2.6SOURCE: EEA
CO2 emissions of new cars are continuing on the downward trend
2014 average emissions [g CO2/km] (Sum)
107.35 140.93
Average emissions of new passenger cars by country IN G CO2/KM / 2014

THE AUTOMOBILE INDUSTRY POCKE T GUIDE 2015 / 2016
60
WWW.ACEA.BE
2
4
6
8
10
12
14
2007 2008 2009 2010 2011 2012 2013 2014 10
New passenger cars in the EU by emissions classes IN MILLION UNITS, % SHARE / 2007 – 2014
SOURCE: AAA (2007-2009), EEA (2010-2014). THE GEOGRAPHICAL SCOPE OF THE DATA CHANGESOVER TIME FROM EU-15 (2007-2009) TO EU-27 (2010-2013) AND EU-28 (2014).
> 130 g CO2/km 96–130 g CO2/km ≤ 95 g CO2/km
1. Provisional data
81%
75%
67%
57%
52%
45%
36%31%
19%
25%
33%
42%46%
51%
57%
61%
0% 0% 0% 1% 2% 3%6%
9%
The market demand for more fuel-efficient cars is growing

61
ENVIRONMENT
WWW.ACEA.BE
25
30
35
40
45
50
55
60
65
70
VOC Emissions total (t) VOC Emissions per unit produced (kg/car)
2005 2006 2007 2008 2009 2010 2011 2012 2013 2014
20
2.3
2.1
2.5
2.7
2.9
3.1
3.3
3.5
3.7
3.9
4.1
SOURCE: ACEA MEMBERS
VOC emissions from production THOUSAND TONNES / 2005 – 2014
-38.7%
-42.2%
Volatile organic compounds (VOC) are organic solvents mainly emitted from paint shops. The graph showsVOC emissions per car produced and the absolute emissions of all car manufacturers combined. With new technologies, such as the replacement of solvent-based paints with solvent-free, water-based equivalents, manufactures have been able to reduce unit emissions by 38.7% over the last ten years.
European manufactures have significantlyreduced the environmental impact
of vehicle production over the last decade

THE AUTOMOBILE INDUSTRY POCKE T GUIDE 2015 / 2016
62
WWW.ACEA.BE
3,0
32
34
60
70
80
90
100
36
38
40
42
44 Energy total (million MWh/year) Energy per unit produced (MWh/car)
Water total (million m³/year) Water per unit produced (m³/car)
2005
2005
2006
2006
2007
2007
2008
2008
2009
2009
2010
2010
2011
2011
2012
2012
2013
2013
2014
2014
30
50
2.4
2.3
2.5
4,0
5,0
6,0
7,0
2.6
2.7
2.8
2.9
3.0
8,0
SOURCE: ACEA MEMBERS
SOURCE: ACEA MEMBERS
Energy consumption during production IN MWh / 2005 – 2014
Water used in production IN MILLION M3 / 2005 – 2014
-14.8 %
-40.9 %
-12.4%
-39.2%
As cars have become equipped with ever more features to make them safer, cleaner and smarter, the complexityof vehicle production has increased. This increase in complexity affects energy demand. Nevertheless, manufacturers have been working continuously to improve the energy efficiency of production. As a result, energy consumption per car produced has been decreased by 12.4% over the last decade. Fluctuations in energy consumption can be explained by lower production volumes, especially during the economic crisis, as well as variable weather conditions in some years.
Long-term strategies for reducing water consumption have made it possible to reduce water use per carproduced by 39.2% between 2005 and 2014. This includes the increased application of recirculation technologies for the reuse of water.
Less energy and water are produced when making cars

63
ENVIRONMENT
WWW.ACEA.BE
10.0
11.00
12.00
14.00
16.00
CO2 emissions total (million t/year) CO2 Emissions per unit produced (t/car)
2005 2006 2007 2008 2009 2010 2011 2012 2013 2014
9.0
0.60
0.50
0.70
0.80
0.90
1.00
SOURCE: ACEA MEMBERS
CO2 emissions from production IN MILLION TONNES / 2005 – 2014
-27.4%
-25.4%
CO2 emissions from car productionare down by over a quarter since 2005
The CO2 emissions per car produced dropped by 25.4% between 2005 and 2014, while the overall figure wentdown by 27.4%, reflecting the industry’s efforts to reduce CO2 emissions.
1.1
1.2
1.3
1.4
1.5
1.6
1.7 Waste total (t/year) excluding scrap metal Waste per unit produced (kg/car) excluding scrap metal
2005 2006 2007 2008 2009 2010 2011 2012 2013 2014
1.0
60.00
50.00
70.00
80.00
90.00
100.00
110.00
120.00
SOURCE: ACEA MEMBERS
Waste (excluding scrap metal) from production IN MILLION TONNES / 2005 – 2014
The total amount of waste generated by the manufacturing of passenger cars went down by 5.4% over ten years.Waste fluctuations, both in absolute and per unit terms can be explained by the occurrence of singular events, such as a fall in total production during the economic crisis.
-2.7%
-5.4%


THE AUTOMOBILE INDUSTRYPOCKE T GUIDE 2015 / 2016
WWW.ACEA.BE
7
Innovation

WWW.ACEA.BE

67
INNOVATION
WWW.ACEA.BE
5 10 15 20 25 30 35 40 45
R&D expenditure of industrial sectors in the main world regions IN BILLION € / 2013
EU Japan US
SOURCE: THE 2014 EU INDUSTRIAL R&D INVESTMENT SCOREBOARD EUROPEAN COMMISSION, JRC/DG RTD
AUTOMOBILES & PARTS
AEROSPACE & DEFENCE
CHEMICALS
ELECTRONIC & ELECTRICAL EQUIPMENT
GENERAL INDUSTRIALS
INDUSTRIALENGINEERING
LEISURE GOODS
PHARMACEUTICALS& BIOTECHNOLOGY
SOFTWARE & COMPUTER SERVICES
TECHNOLOGY HARDWARE & EQUIPMENT
OTHER
The EU is the world’s largest investorin automotive industry R&D

THE AUTOMOBILE INDUSTRY POCKE T GUIDE 2015 / 2016
68
WWW.ACEA.BE
-2.0%
0%
2.0%
4.0%
6.0%
8.0%
10.0%
12.0%
14.0%
16.0%
-4.0%
R&D growth in the automobiles & parts sector for EU, US and Japan based companies % CHANGE / 2011 – 2012 VS 2012 – 2013
SOURCE: THE 2014 EU INDUSTRIAL R&D INVESTMENT SCOREBOARD EUROPEAN COMMISSION, JRC/DG RTD.
% change 2012/2011 % change 2013/2012
14.4%
EU companies in the automobile and parts sector continue to increase their R&D investments
6.2%5.6%
-2.6%
6.4%
11.0%

69
INNOVATION
WWW.ACEA.BE
Other
Fixed line telecommunications
Chemicals
Software &computer services
Banks
Industrial engineering
Aerospace & defence
Technology hardware& equipment
17 %
3 %
3 %
4 %
4 %
5 %
6 %
6 %
9 %
Automobiles & parts
Pharmaceuticals & biotechnology
26 %
17 %
Electronic & electrical equipment
R&D shares of sectors in the EU 2013
SOURCE: THE 2014 EU INDUSTRIAL R&D INVESTMENT SCOREBOARD EUROPEAN COMMISSION, JRC/DG RTD
The automotive sector is the EU’s number oneinvestor in R&D, with €41.5 billion invested per year
EU R&D investment in the top 10 industrial sectors IN € MILLION / 2013
R&D 2013
Automobiles & parts 41,538 Pharmaceuticals & biotechnology 27,879 Technology hardware & equipment 14,976 Aerospace & defence 9,650 Industrial engineering 9,498 Electronic & electrical equipment 8,787 Banks 6,751 Software & computer services 6,206 Chemicals 5,116 Fixed line telecommunications 4,131 Other 27,606
SOURCE: THE 2014 EU INDUSTRIAL R&D INVESTMENT SCOREBOARD EUROPEAN COMMISSION, JRC/DG RTD.

THE AUTOMOBILE INDUSTRY POCKE T GUIDE 2015 / 2016
70
WWW.ACEA.BE
Japan
Other EPO 2 member states
United Kingdom
Italy
Sweden
France
24 %
8 %
2 %
4 %
4 %
9 %
United States
China 3
South Korea
Canada
Others
Germany
12 %
1 %
1 %
1 %
1 %
33 %
Patents granted in the automotive sector 1 2014
SOURCE: EPO
In 2014, about 6,000 patentswere granted to the automotive sector by EPO
1. Includes categories B60, B62, F02 and F16 B60: Vehicles in general B62: Land vehicles for travelling otherwise than on rail F02: Combustion engines; hot-gas or combustion-product engine plants F16: Engineering elements or units; general measures for producing and maintaining effective functioning of machines or installations; thermal insulation in general 2. Includes Albania, Liechtenstein, Monaco, Macedonia, Serbia, San Marino, Turkey, EU28 and EFTA countries.3. Includes Taipei
Patents by country 2014
Germany 1,987 France 526 Italy 238 Sweden 237 United Kingdom 138 other EPO member states 2 501 Japan 1,481 United States 735 Republic Of Korea 47 China 3 79 Canada 31 Others 56
Total patent applications 6,056
SOURCE: EPO

THE AUTOMOBILE INDUSTRYPOCKE T GUIDE 2015 / 2016
WWW.ACEA.BE
8
Taxation

WWW.ACEA.BE

73
TAXATION
WWW.ACEA.BE 20 EU member states apply CO2 taxation
CO2 based motor vehicle taxes in the EU in 2015 COUNTRY CO2 / FUEL CONSUMPION TAXES
Austria Fuel consumption tax (CO2 based) levied on the first car registration of a car.
Belgium CO2-based registration tax (Wallonia). Registration tax based on CO2 emissions, Euro standards, fuel consumption and age (Flanders). CO2-based company car tax.
Cyprus Registration tax and annual circulation tax based on CO2 emissions.
Germany CO2-based annual circulation tax.
Denmark Annual circulation tax based on fuel consumption. Registration tax (based on price) linked to fuel consumption.
Spain CO2-based registration tax.
Finland Registration tax and annual circulation tax based on CO2 emissions.
France Registration tax, annual circulation tax and company car tax based on CO2 emissions.
Greece CO2-based annual circulation tax.
Croatia Registration tax based on price, CO2 emissions and fuel consumption.
Ireland Registration tax and annual circulation tax based on CO2 emissions.
Luxembourg CO2-based annual circulation tax.
Latvia CO2-based registration tax.
Malta Registration tax based on price, CO2 emissions and vehicle length. Annual circulation tax based on CO2 emissions and age.
Netherlands CO2-based registration tax.
Portugal Registration tax based on cubic capacity and CO2 emissions. Annual circulation tax based on cubic capacity, CO2 emissions and age.
Romania Registration tax based on CO2 emissions, cubic capacity, exhaust emissions and age.
Sweden Annual circulation tax based on CO2 emissions and exhaust emissions.
Slovenia CO2-based registration tax.
United Kingdom Annual circulation tax and company car tax based on CO2 emissions.
SOURCE: ACEA TAX GUIDE

THE AUTOMOBILE INDUSTRY POCKE T GUIDE 2015 / 2016
74
WWW.ACEA.BE
Incentives for electric vehiclesare available in 18 counries
Overview of purchase and tax incentives for electric vehicles in the EU in 2015 COUNTRY INCENTIVES
Austria EVs exempt from fuel consumption tax and monthly vehicle tax.
Belgium EVs and PHEVs exempt from registration tax (Flanders).EVs pay the lowest rate of tax under the annual circulation tax.Reduction of company car taxation (CO2-based).
Czech Republic Electric, hybrid and other alternative fuel vehicles exempt from road tax.
Germany EVs ten year exemption from paying annual circulation tax.
Denmark EVs (< 2,000 kg) exempt from registration tax.
Finland EVs pay the minimum rate of the CO2-based registration tax.
France EVs and HEVs benefit from a premium (CO2-based).EVs exempt from company car tax (hybrid vehicles exempt for the first two years).
Greece EVs and HEVs exempt from registration tax, luxury tax and luxury living tax. Electric and hybrid passenger cars exempt from annual circulation tax (based on cubic capacity).
Hungary EVs exempt from registration tax and annual circulation tax.
Ireland EVs, plug-in hybrid EVs, hybrids and other alternative fuel vehicles benefit from registration tax relief.
Italy EVs exempt from annual circulation tax for five years.
Latvia EVs exempt from registration tax.
Netherlands EVs exempt from registration tax.Vehicles exemption from annual circulation tax (CO2-based).
Portugal EVs exempt from registration tax and annual circulation tax.Hybrid vehicles benefit from a reduction of the registration tax.
Romania Electric and hybrid vehicles exempt from registration tax.
Sweden Five year exemption from paying annual circulation tax (CO2-based). Reduction of company car taxation for EVs and plug-in hybrid EVs.Super green car premium new cars (CO2-based).
Slovakia EVs exempt from registration tax and annual circulation tax.Hybrid vehicles benefit from a reduction of the annual circulation tax.
United Kingdom Purchase grant for EVs and plug-in hybrid EVs (CO2-based).EVs exempt from annual circulation tax.
SOURCE: ACEA TAX GUIDE

75
TAXATION
WWW.ACEA.BE
Fiscal income from motor vehicles in the EU1
AUSTRIA BELGIUM DENMARK FINLAND FRANCE GERMANY GREECE
€ bn2014
€ bn2012
DKK bn2011
€ bn2013
€ bn2013
€ bn2012
€ bn2013
Purchase or transfer
1. VAT on vehicle sales servicing/repair, parts, tyres 2.678 6.06 N.A. 1.461 13.306 26.319 0.156
2. Fuels & lubricants 5.338 7.534 16.97 4.256 35.899 39.304 3.774
3. Sales & registration taxes 0.52 0.408 13.8 0.933 2.039 – 0.052
Annual ownership taxes 2.1 1.512 9.872 0.866 1.047 8.991 1.304
Driving license fees – 0.007 – – – 0.01 –
Insurance taxes 0.324 0.934 1.757 0.343 4.47 3.786 –
Tolls 1.688 – 0.37 – 11.052 – –
Customs duties – – – – – 0.535 –
Other taxes 0.312 0.759 – – 1.666 1.01 0.055
TOTAL 12.959 17.214 42.769 7.859 69.471 79.995 5.341
EURO 13 17.2 5.7 7.9 69.5 80 5.3
IRELAND ITALYNETHER-
LANDS PORTUGAL SPAIN SWEDENUNITED
KINGDOM
€ bn2014
€ bn2013
€ bn2013
€ bn2014
€ bn2011
SEK bn2013
£ bn2012
Purchase or transfer
1. VAT on vehicle sales servicing/repair, parts, tyres 0.478 14.25 1.418 1.503 3.6 21 12.5
2. Fuels & lubricants 3.038 37.46 7.631 2.301 17.868 47.5 26.7
3. Sales & registration taxes 0.583 1.36 1.495 0.536 0.31 – –
Annual ownership taxes 1.159 5.93 3.55 0.52 2.886 12.3 5.88
Driving license fees – – 0.308 – 0.062 – –
Insurance taxes – 4.5 0.903 – 0.6 2.8 –
Tolls – 1.75 – – – 1.5 –
Customs duties – – – 0.034 – – –
Other taxes – 5.25 2.553 0.143 0.39 4.2 1.5
TOTAL 5.258 70.5 17.858 5.037 24.354 89.3 46.58
EURO 5.3 70.5 17.9 5 24.4 9.6 64.8
Motor vehicles account for €396 billionin tax contributions in the EU15
SOURCE: ACEA TAX GUIDE 1. Latest available data; no data are available for other EU Member States

THE AUTOMOBILE INDUSTRY POCKE T GUIDE 2015 / 2016
76
WWW.ACEA.BE
Excise duties on fuelsin €/1,000 litres
UNLEADED PETROL DIESEL
Austria 515 425Belgium 615 443Bulgaria 363 330Cyprus 479 450Czech Republic 467 398Germany 670 486Denmark 608 414Estonia 423 393Spain 425 331Finland 681 506France 624 468Greece 670 330Croatia 479 374Hungary 397 384Ireland 587 479Italy 728 617Lithuania 434 330Luxembourg 465 338Latvia 411 333Malta 519 422Netherlands 766 482Poland 399 349Portugal 617 402Romania 461 430Sweden 646 602Slovenia 596 495Slovakia 551 386United Kingdom 674 674EU minimum rates 359 330SOURCE: ACEA TAX GUIDE
Share of VAT in net price of cars
27%
25%
24%
23%
22%
21%
20%
19%
17%
Hungary
DenmarkCroatia
Sweden
FinlandRomania
GreeceIrelandPoland
Portugal
Italy
BelgiumCzech Republic
SpainLithuania
LatviaNetherlands
AustriaBulgariaEstoniaFrance
SloveniaSlovakia
United Kingdom
CyprusGermany
LuxembourgMalta
SOURCE: ACEA TAX GUIDE
Automobiles provide a vital source of government revenue

p u b l i s h e d b yACEA Communications department Please order your personal copy via [email protected]
This paper is made in an environmentally-friendly way and according to FSC certification© ACEA_JUNE 2015