Use of Wetlands for Stormwater and Wastewater...
81
Copyright [insert date set by system] by [CH2M HILL Entity] • Company Confidential Use of Wetlands for Stormwater and Wastewater Treatment Speakers Jim Bays/ CH2M HILL Larry Schwartz/ SFWMD Chris Keller/Wetland Solutions Inc. Florida Chamber’s 2015 Environmental Permitting Short Course Orlando, Florida July 9-10 2015
Transcript of Use of Wetlands for Stormwater and Wastewater...

Copyright [insert date set by system] by [CH2M HILL Entity] • Company Confidential
Use of Wetlands forStormwater and Wastewater Treatment
SpeakersJim Bays/ CH2M HILLLarry Schwartz/ SFWMDChris Keller/Wetland Solutions Inc.Florida Chamber’s
2015 Environmental Permitting Short CourseOrlando, FloridaJuly 9-10 2015

Topic Briefings
�Treatment Wetlands
�Jim Bays/CH2MHILL
�Wetland Application Rule and Everglades Science Plan Overview
�Larry Schwartz/SFWMD
�Stormwater Wetlands
�Chris Keller/Wetland Solutions Inc.
�Q&ACopies of presentations on Conference Web Site

Treatment Wetlands
� Design Overview
– Ecological Basis
– Sizing
– Hydrology and Hydraulics
– Planting Design
– Public Use
– Operation and Maintenance
� Selected Case Histories and New Applications

0
5,000,000
10,000,000
15,000,000
20,000,000
25,000,000
1900 1910 1920 1930 1940 1950 1960 1970 1980 1990 2000 2004 2011
Florida 46% Historic Wetland Loss in Response to Population Growth
http://www.epa.gov/owow/wetlands/vital/epa_media/usa.gifhttp://www.epa.gov/owow/wetlands/vital/epa_media/usa.gif
Wetland Acres� 1780s 20,325,013� 1980s 11,038,200
� 70s-80s - 260,000
Wetland Acres� 1780s 20,325,013� 1980s 11,038,200
� 70s-80s - 260,000
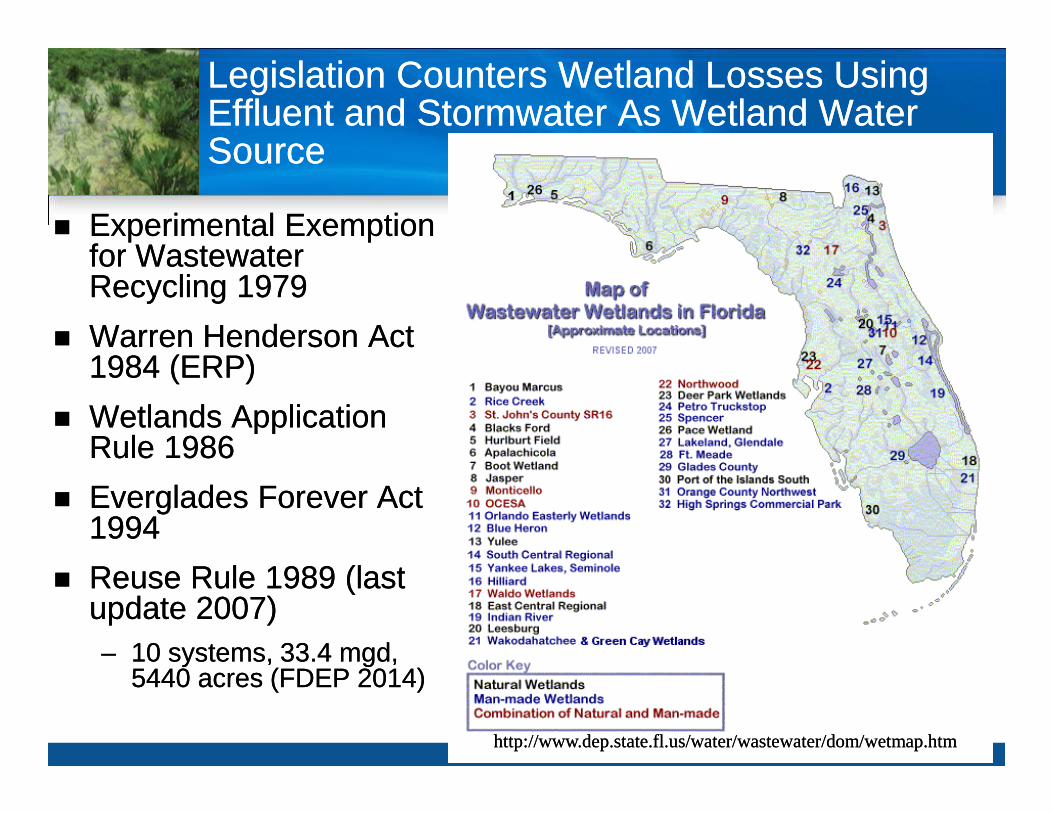
� Experimental Exemption for Wastewater Recycling 1979
� Warren Henderson Act 1984 (ERP)
� Wetlands Application Rule 1986
� Everglades Forever Act 1994
� Reuse Rule 1989 (last update 2007)– 10 systems, 33.4 mgd,
5440 acres (FDEP 2014)
� Experimental Exemption for Wastewater Recycling 1979
� Warren Henderson Act 1984 (ERP)
� Wetlands Application Rule 1986
� Everglades Forever Act 1994
� Reuse Rule 1989 (last update 2007)– 10 systems, 33.4 mgd,
5440 acres (FDEP 2014)
http://www.dep.state.fl.us/water/wastewater/dom/wetmap.htmhttp://www.dep.state.fl.us/water/wastewater/dom/wetmap.htm
Legislation Counters Wetland Losses Using Effluent and Stormwater As Wetland Water Source
Legislation Counters Wetland Losses Using Effluent and Stormwater As Wetland Water Source

Wetlands for Water Treatment: Florida Origins and History
� 1970s– Center for Wetlands (Odum)– Houghton L MI (Kadlec)
� 1980s– Arcata Marsh CA– 1984 – Henderson Act– 1986 – Wetlands Application
Rule– 1987 – Lakeland, Orlando
� 1990s – EPA: TW Data Base– SFWMD: EFA, ENRP– SJRWMD: L Apopka Flow-
way– SWFWMD: Rushton research
� 2000s –Implementation
� 1970s– Center for Wetlands (Odum)– Houghton L MI (Kadlec)
� 1980s– Arcata Marsh CA– 1984 – Henderson Act– 1986 – Wetlands Application
Rule– 1987 – Lakeland, Orlando
� 1990s – EPA: TW Data Base– SFWMD: EFA, ENRP– SJRWMD: L Apopka Flow-
way– SWFWMD: Rushton research
� 2000s –Implementation
Source: Center for Wetlands (2010)Source: Center for Wetlands (2010)
0
1000
2000
3000
4000
Feb-82 Aug-87 Jan-93 Jul-98 Jan-04 Jul-09 Dec-14 Jun-20
Cita
tions

Definitions

Natural Wetlands for Treatment
DistributionPipe
DistributionPipe
OutflowOutflow
Poinciana1984
Poinciana1984
Carolina Bays SC
1987
Carolina Bays SC
1987
Blacksford Swamp1999
Blacksford Swamp1999
West Palm Beach2004
West Palm Beach2004

Surface Flow Constructed Wetlands
OutletWeir
OutletWeir
DistributionPipe
DistributionPipe
Low Permeability SoilLow Permeability Soil
Wakodahatchee1996
Wakodahatchee1996

Other Natural Treatment Systems

Green Infrastructure = Wetlands Plus

Wetlands Affect Water Quality Naturally
Surface Water
Plant Uptake & Storage
Adsorption
Nitrification /Denitrification
Decomposition
Burial & Soil Storage
Sedimentation
Volatilization
PrecipitationSediments
Detritus
N, BOD, VolatileOrganics,Selenium
P, Metals
NO3, NH3
ON, NH3, P, Metals, OrganicsDiffusion
Metals, N, P
TSS, P, N, Adsorbed Contaminants
Annual Growth Cycle

Steady Progress in Treatment Wetlands Design
1993 1996 2006 20091989 2000
1990 2000 2010
1999 2015
Annual South Florida Environmental Report

A Preliminary Water Balance Is Needed to Ensure Adequate Water to Maintain Wetlands
Pumped or GravityInflow
Pumped or GravityInflow
Pumped orGravity Outflow
Pumped orGravity Outflow
EvaporationEvaporationRainfallRainfall
Infiltration
Use vegetative indicators to establish target SHWL, NP elevations
Use vegetative indicators to establish target SHWL, NP elevations
Use vegetative indicators to establish target SHWL, NP elevations
Infiltration can be a planning objectiveInfiltration can be a planning objective

Compartments in Treatment Wetlands Aid System Hydraulics and Performance
Inlet Distribution
Zones
Inlet Distribution
Zones
Shallow Emergent
Marsh
Shallow Emergent
Marsh
Deep ZonesDeep Zones
Habitat IslandsHabitat Islands
Outlet Control Structures
Outlet Control Structures
ParallelParallelFlow Paths
Cells inCells inSeries
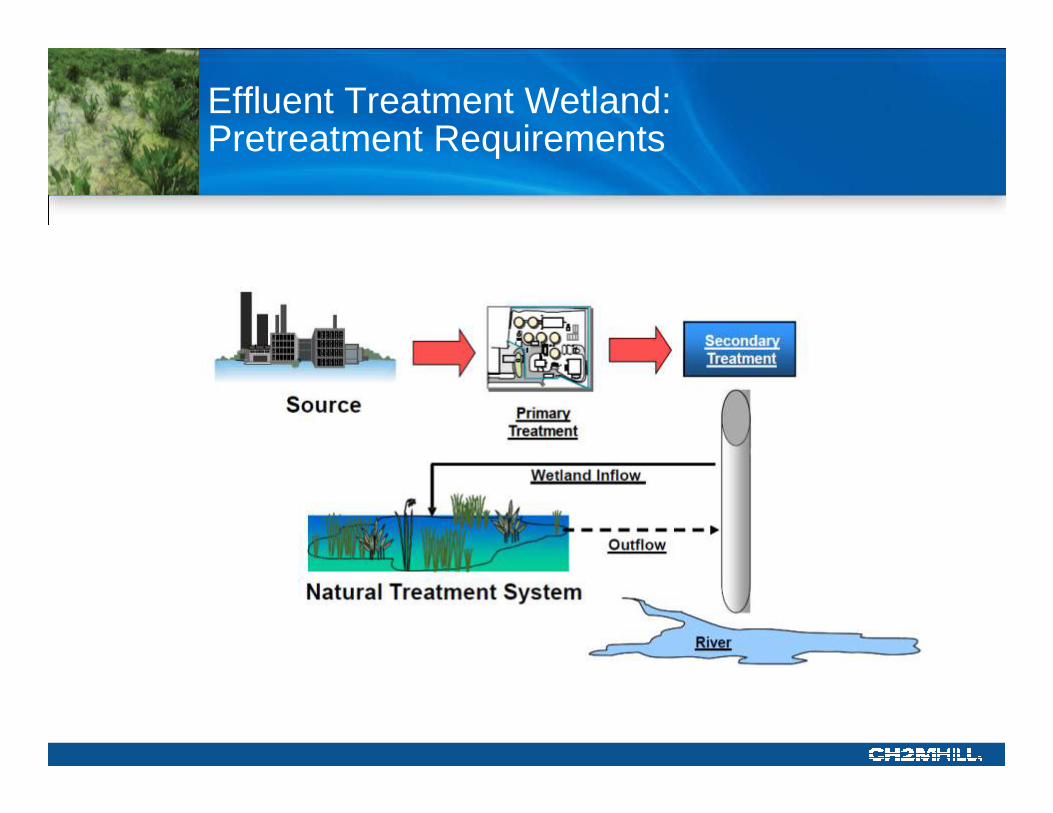
Effluent Treatment Wetland: Pretreatment Requirements

Surface Water/Stormwater Wetland:Pretreatment Requirements
Runoff and Load
Generation
Runoff and Load
Generation
Final Treatment
and Attenuation
Final Treatment
and Attenuation
Additional Treatment
and Attenuation
Additional Treatment
and Attenuation
Conveyance and
Pretreatment
Conveyance and
Pretreatment
�Source Controls�Public Education�Erosion Control�Roof Runoff�Florida Yards�LID
�Source Controls�Public Education�Erosion Control�Roof Runoff�Florida Yards�LID
�Swales�Catch Basins�Filter Inlets�Oil/water Separators
�Swales�Catch Basins�Filter Inlets�Oil/water Separators
�Storage Tank�Sediment Sump�Alum
�Storage Tank�Sediment Sump�Alum
�Retention�Detention�Wetlands�Alum
�Retention�Detention�Wetlands�Alum
!!!!
http://www.co.broward.fl.us/Stormwater/http://www.co.broward.fl.us/Stormwater/ http://www.co.broward.fl.us/Stormwater/http://www.co.broward.fl.us/Stormwater/
Lake DotLake Dot

General Performance Results Set General Expectations
RemovalParameter Efficiency Limit
BOD 50 – 90% 2 – 10 mg/L
TSS 50 – 90% 2 – 10 mg/L
TN 40 – 90% 1 – 3 mg/L
TP 10 – 90% <1 mg/L
Fecal Coliforms 80 – 99% <100 – 1,000 col/100 mL
Metals 50 – 90% Below Detection
a Removal efficiencies and effluent concentrations are very dependent upon influent concentration and hydraulic loading rate.
0.004 mg/L

Loading Coordinate Graph Establishes, Confirms Performance

00 AA
Cout/CinCout/Cin
00
11
Wetland AreaWetland Area0 A
Cout/Cin
0
1
Wetland Area
Wetland Treatment Performance Described by First-order Model
C*C*C*
Q dC/dA = -k(C-C*)
Calibrate k by pollutant
Q dC/dA = -k(C-C*)
Calibrate k by pollutantKadlec and Knight (1996)
first-order treatment model
Kadlec and Knight (1996)
first-order treatment model
Example Wetland PerformanceExample Wetland PerformanceExample Wetland Performance

Orlando Wetlands Park FL: AWT Wetland Milestone
1,220 ac
12 cells
3 flow paths
20 mgd
>30 d HRT
1,220 ac
12 cells
3 flow paths
20 mgd
>30 d HRT
In (mg/L)
Out (mg/L)
TN 2.4 0.8
TP 0.28 0.06
BOD 1.5 1.8
TSS <1.0 <1.0

Orlando Wetlands Meet Proposed Numeric Nutrient Criteria
0.00
0.05
0.10
0.15
0.20
0.25
0.30
0.0 0.2 0.4 0.6 0.8 1.0
TP
(m
g/L
)
North
South
Peninsula NNC
0.0
0.5
1.0
1.5
2.0
2.5
3.0
0.0 0.5 1.0
TN
(m
g/L
)
NorthSouthPeninsula NNC
Source: Sees, 2005Source: Sees, 2005

Install and Manage Vegetation for Biomass, Diversity, Aesthetics, Flow
Thalia, Pontederia, Eleocharis, Sagittaria, Cladium
Emergent marsh
Thalia, Pontederia, Eleocharis, Sagittaria, Cladium
Emergent marsh
Deep zoneNymphaea, SAV
Deep zoneNymphaea, SAV

Treatment Wetlands Operations: Track Performance and Monitor Flow
� Water Quality– Monitoring– Constituent Loading
� Hydraulic Operation– Water Level and Flow Control– Flow Path Rotation
� Vegetation Management– Aesthetics and Exotics– Replacement for Hydraulics,
Performance, Herbivory – Harvesting? No
� Control of Nuisance Conditions

Sediment Removal FAQ
An Uncommon Practice
� Decades of Storage� Slow Accretion Rate
� 0.1 – 0.5 in/yr� Near inlet� Build in storage in deep zones� Water level adjustment
� Stormwater Considerations� 5 – 10 year cycle: clean out
forebay/inlet deep zone
Orlando Wetlands (2002-03)
� Disposed on-site� 160,000 bulrush installed� Areal efficiency increased from 0.34
to 0.74.
•Initial cells (59 ha)•Vegetation, sediments, organic debris •130,000 m3
•Initial cells (59 ha)•Vegetation, sediments, organic debris •130,000 m3
Source: Sees (2005)Source: Sees (2005)
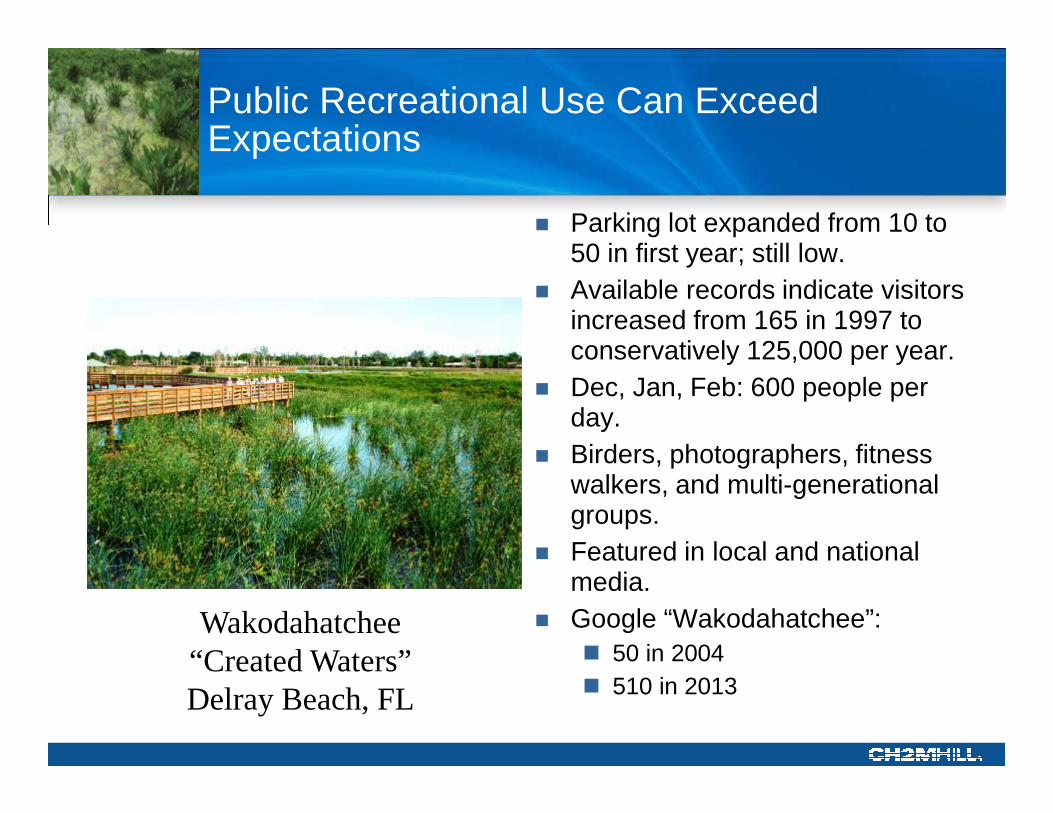
Public Recreational Use Can Exceed Expectations
� Parking lot expanded from 10 to 50 in first year; still low.
� Available records indicate visitors increased from 165 in 1997 to conservatively 125,000 per year.
� Dec, Jan, Feb: 600 people per day.
� Birders, photographers, fitness walkers, and multi-generational groups.
� Featured in local and national media.
� Google “Wakodahatchee”: � 50 in 2004� 510 in 2013
Wakodahatchee“Created Waters”Delray Beach, FL

Capital Cost Considerations
Source: Kadlec & Wallace (2009)Source: Kadlec & Wallace (2009)
~$100,000/ac
$40,000/ac

Everglades Construction Project:World’s Largest Treatment Wetlands
WY 2014• 1,300,000 ac-ft treated• 81% TP Reduction• FWM TP outflow 21 ppb• 147 MT
Sources: SFER 2015
WY 2014• 1,300,000 ac-ft treated• 81% TP Reduction• FWM TP outflow 21 ppb• 147 MT
Sources: SFER 2015
•57,000 ac STA area•1,874 MT TP retained since 1994•75% TP Reduction•FWM 34 ppb TP outflow•1994 ECP = $913 MM
•$714 MM state•$199 MM Federal
•57,000 ac STA area•1,874 MT TP retained since 1994•75% TP Reduction•FWM 34 ppb TP outflow•1994 ECP = $913 MM
•$714 MM state•$199 MM Federal

Freedom Park, Naples:Stormwater Treatment, Restoration, RecreationTreatment Wetlands Sustain Native Diversity
� 50-ac: since 2009� 200 Million Gallons of SW
Flow into Naples Bay Treated per Year
� Nitrogen Reduced By 39%to 0.8 mg/L (background)
� Phosphorus Reduced By 82% to 30 ppb (nr. backgr.)
� Metal Concentrations Reduced to Background Levels
� Critical Component of County’s Stormwater Improvement Plan

Floating Wetland Islands: A Strategy for Nitrogen Reduction in Reclaimed Water
FWIs: After 1.5 years Presence of Islands Improved TN Reduction
0
2
4
6
8
10
12
4/1/
12
7/10
/12
10/1
8/12
1/26
/13
5/6/
13
8/14
/13
11/2
2/13
3/2/
14
To
tal N
itro
gen
(m
g/L
)
Inflow Outflow
GROW-IN PERFORMANCE CONTROL
↓62% ↓30%↓45%

Enhanced Wetlands (“Intensification”) and System Integration Can Help Meet TMDLs
Forced Bed Aeration Integrated Media Filtration
Wanielista & Flint 2012
Alligator Creek Treatment Train:1. Flow diversion (pump)2. Forebay settling3. Wetland treatment (2 cells)4. Downflow gravel filtration5. Upflow media adsorption6. Re-aeration7. Recirculation
Alligator Creek Treatment Train:1. Flow diversion (pump)2. Forebay settling3. Wetland treatment (2 cells)4. Downflow gravel filtration5. Upflow media adsorption6. Re-aeration7. Recirculation
12
3
54
647
Bioreactors (Wood chip)

Wetlands for Water Treatment: Perspective
� Versatile– Mass removal, concentration– New applications
� Passive, low energy, low O&M, stores nutrients
� Well-understood, good record
� Conserves land, creates habitat
Freedom Park, Naples FL
↓62%


Chapter 62-611 FACWetlands Application
Larry N. Schwartz Ph.D., P.W.S.
� Presentation Format� History of the Rule
� Content of the Rule
� Recommended Rule Changes

Chapter 62-611 FACWetlands Application
� History� Exemption for the Experimental Use of Wetlands
� Warren S. Henderson Wetlands Protection Act of 1984:
Rules for the use of wetlands to receive wastewater with protection of their type, nature and function
� 1st rule adoption 1986: 17-6.055 FAC
� 2nd rule adoption 1988: 62-611 FAC

Chapter 62-611 FACWetlands Application
� 62-611.100 Scope/Intent/Purpose� Landward extent of waters of the state
� As additional data becomes available the department will reevaluate the rule
Reevaluation language eliminated from the rule but research and performance data indicate changes are warranted

Chapter 62-611 FACWetlands Application
� 611-110 Applicability� Rule only applies to domestic wastewaters
� Prohibitions– Class I & II waters
– Herbaceous wetlands except if dominated by cattail
Need to allow use of herbaceous wetlands with high quality reclaimed water

Chapter 62-611 FACWetlands Application
� 62-611.200 Definitions� Herbaceous and woody wetlands

Chapter 62-611 FACWetlands Application
� 62-611.200 Definitions� Treatment Wetland - wastewater treated to
secondary levels with nitrification
� Receiving Wetland - wastewater treated to advanced wastewater treatment (AWT) levels
– AWT
CBOD5 5 mg/l TSS 5 mg/lTN 3 mg/l TP 1 mg/l

Chapter 62-611 FACWetlands Application
� 62-611.200 Definitions� Man-made Wetlands
– constructed in uplands
– not constructed for mitigation
Referred to as constructed in the literatureRule should be changed to promote use for waste treatment especially in conjunction with receiving wetlands

Chapter 62-611 FACWetlands Application
� 62-611.200 Definitions� Hydrologically Altered Woody Wetlands
– drainage resulting in substantial and continuing encroachment in upland species
� Hydrologically Altered Herbaceous Wetlands– drainage resulting in substantial and continuing reduction in
water levels
- Definitions limiting and difficult to demonstrate- Many wetlands could be rehydrated and this use should be promoted -The use of wetlands with invasive non-native species could be promoted

Chapter 62-611 FACWetlands Application
� 62-611.300 General Qualitative Design Criteria� Minimize channelized flow
� Maximize sheet flow
� Minimize erosion
� No adverse effect on T&E

Chapter 62-611 FACWetlands Application
� 62-611.350 General Quantitative Design Criteria� Minimize alteration of natural hydroperiod
� Annual average hydraulic loading rate shall not exceed 2 inches/week
� Except in hydrologically altered wetlands where it shall not exceed 6 inches/week
Higher average hydraulic loading rates are appropriate in many wetland, lower average hydraulic loading rates are appropriate in certain wetlandsTherefore: consider establishing average hydraulic loading rates by wetland type

Chapter 62-611 FACWetlands Application
� 62-611.450 Discharge Limits from Treatment and Receiving Wetlands� Annual Average TN = 3 mg/l
� Annual Average un-ionized ammonia = 0.02 mg/l
� Annual Average TP = 0.2 mg/l
� Superseded by Numeric Nutrient Criteria

Chapter 62-611 FACWetlands Application
� 62-611.500 Standards within Treatment and Receiving Wetlands� Exemption from certain general water quality
standards; DO, nutrients, injury to plants, turbidity
� Exemption from certain Class III water quality standards; DO, total coliform, biological integrity, transparency
– Revised DO standard: Levels of dissolved oxygen including daily and seasonal fluctuations shall be maintained to prevent violations of the biological quality standards

Chapter 62-611 FACWetlands Application� 62-611.500 Standards within Treatment and
Receiving Wetlands� Wetland Biological Quality
Research has demonstrated that the application of treated wastewater to wetlands does not reduce biological quality, therefore available indices to assess wetland functions should be used instead of these standards

Chapter 62-611 FACWetlands Application
� 62-611.650 Man-made Wetlands� Most of the provisions of the rule do not apply
to man-made wetlands
� Minimum (free-from) surface water quality standards do apply
� General and Class III standards do not apply, except for metals
� A wetland created for mitigation can not be used as a treatment wetland, but can be used as a receiving wetland

Chapter 62-611 FACWetlands Application
� 62-611.700 Monitoring Requirements� Unaltered treatment wetlands
� Hydrologically altered or man-made treatment wetlands
� Receiving wetlands
� Length of baseline monitoring, specified parameters, frequency, number of stations
� In general the numbers of parameters should be reduced as well as the monitoring frequency


Stormwater Treatment Wetlands
Chris Keller, P.E.Wetland Solutions, Inc.
Environmental Permitting Summer School
July 2015

Why Wetlands?• Wetlands are the natural stormwater
management systems in the landscape• Wetlands remove or transform a wide
range of pollutants found in urban runoff (BOD, TSS, N, P, pathogens, metals, hydrocarbons, etc.)

Stormwater Wetland Rules
• Constructed wetlands can be used for new development or retrofit projects– Provide reasonable assurance that volume and water
quality criteria can be met– There is no design guidance provided in WMD or
FDEP SWERP manuals– There was no design guidance provided in the draft
statewide stormwater rule manual

Stormwater Wetland Rules• Isolated (Natural) Wetlands
– Wholly owned or controlled by the applicant may be used for flood attenuation
– Can be used as wet detention when not in conflict with environmental or public use considerations
• If the required treatment volume cannot be detained with in the limits of the wetland boundaries and natural water levels, expansion of the wetland will be allowed when it can be shown that the excavation will not adversely impact the wetland
• The treatment volume cannot adversely impact the wetland so that it fluctuates beyond the range of natural water levels. The available volume is determined based on site specific conditions and an analysis of the isolated wetland to be used.
• Provisions must be made to remove sediment, oils and greases from runoff entering the wetland. This can be accomplished through incorporation of sediment sumps, baffles and dry grassed swales or a combination thereof. Normally, a dry grassed swale system designed for detention of the first ¼” of runoff with an overall depth no more than 4” will satisfy this requirement.

Stormwater Wetland Plant Communities
• Similar planting palette as wastewater wetlands
• Potentially wider range of hydrologic tolerance required
• Salt tolerance necessary in brackish/coastal systems
Floating
Periphyton
Submerged
Emergent

Typical Stormwater Wetland Layout
Forebay
Outlet
Deep Zone
Marsh
Inlet
Variable Storage
Permanent
Pool

Conceptual Design for Multiple Benefits
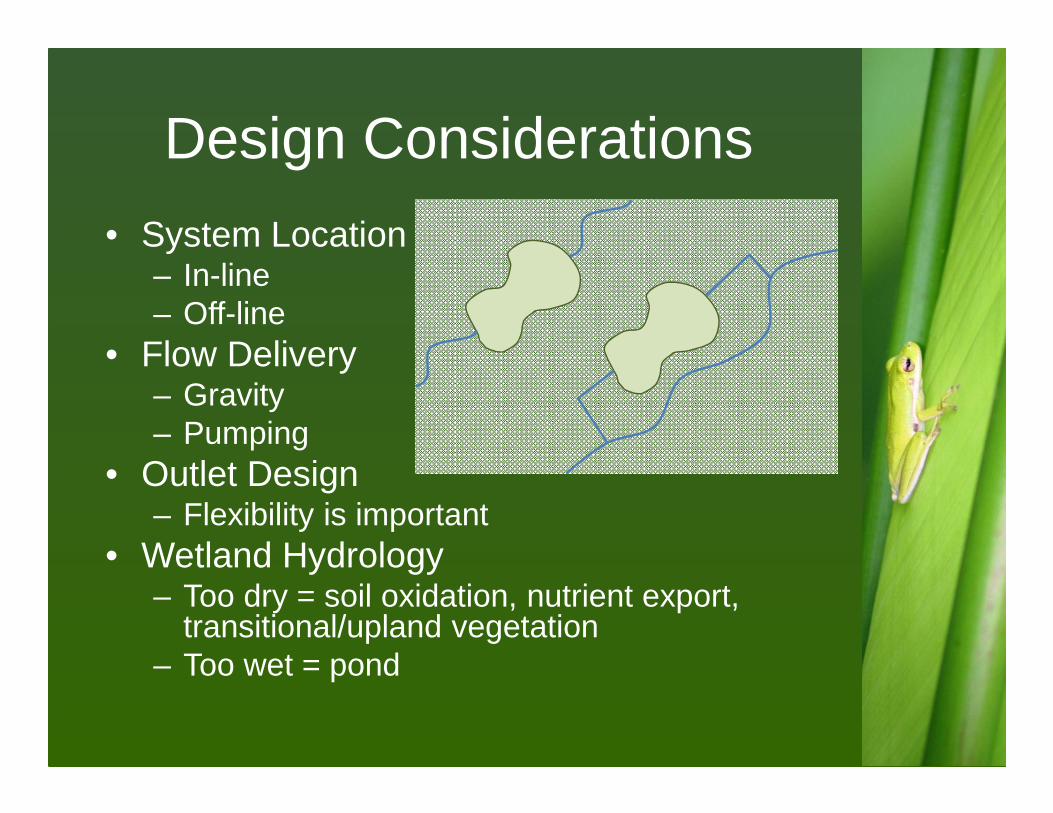
Design Considerations
• System Location– In-line– Off-line
• Flow Delivery– Gravity– Pumping
• Outlet Design– Flexibility is important
• Wetland Hydrology– Too dry = soil oxidation, nutrient export,
transitional/upland vegetation– Too wet = pond

Stormwater Design Basis
• Flow Characteristics– Rainfall– Infiltration– Runoff
• Pollutant Loads– Watershed characteristics– Estimated concentrations– Direct measurement
• Design Methods– Wetland:watershed area– Design storm detention– Annual averaging– Dynamic modeling

Method 1: Wetland/Watershed Area
• Measure area of drainage basin• Apply selected Wetland to
Watershed Area Ratio (WWAR), typically 2 to 5%
• Allocate wetland surface area to 20% pool and 80% marsh

Method 2: Design Storm Detention
• Determine design storm requirement
• Calculate design runoff volume• Allocate wetland volume 40% pool
and 60% marsh• Allocate wetland surface area to
20% pool and 80% marsh (marsh depth = 0.3 x pool depth)

Method 3: Annual Averaging
• Estimate event mean concentrations of pollutants
• Compute HLR to meet water quality target using first-order equation
• Estimate runoff coefficient• Calculate design annual runoff
volume• Allocate wetland surface area to 20%
pool and 80% marsh and select appropriate water depths
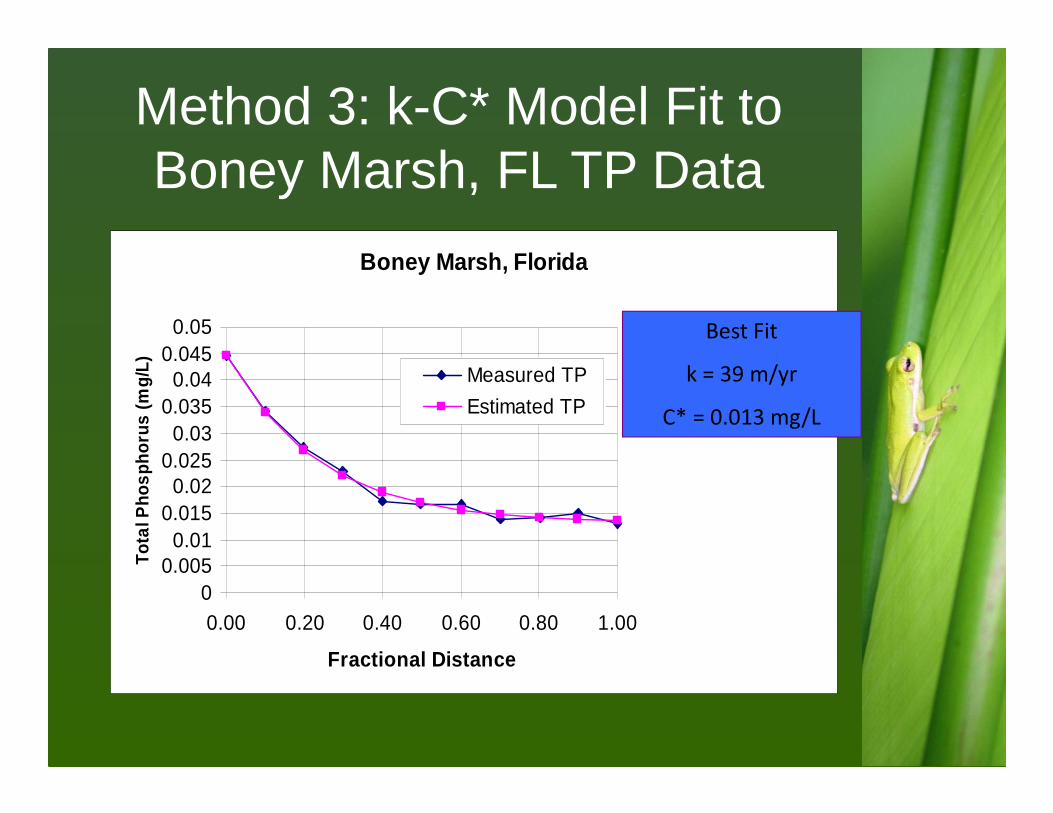
Method 3: k-C* Model Fit to Boney Marsh, FL TP Data
Boney Marsh, Florida
00.005
0.010.015
0.020.025
0.030.035
0.040.045
0.05
0.00 0.20 0.40 0.60 0.80 1.00
Fractional Distance
Tota
l Pho
spho
rus
(mg/
L) Measured TP
Estimated TP
Best Fit
k = 39 m/yr
C* = 0.013 mg/L

Method 4: Dynamic Modeling
• Only available for TP• Construct daily time series for flow, inflow
concentration, rainfall, and ET• Adjust wetland area in DSMTA Version 2
(www.wwwalker.net) to meet desired load or concentration reduction
• Future release of DMSTA for nitrogen species
• Phosphorus removal is often the area-controlling parameter in wetlands, so goals for BOD, TSS, TN may be met by default

Method 4: DMSTA Version 2 Phosphorus Balance

Keys to Maximize Water Quality Benefits
• Hydraulic design depends on project goals– Load Reduction– Concentration Reduction
• Maximize internal hydraulic efficiency• Minimize water depths in marsh
– 6-12” for permanent pool– 18-24” during design storm event
• Limit open water to 10-20% of total surface area
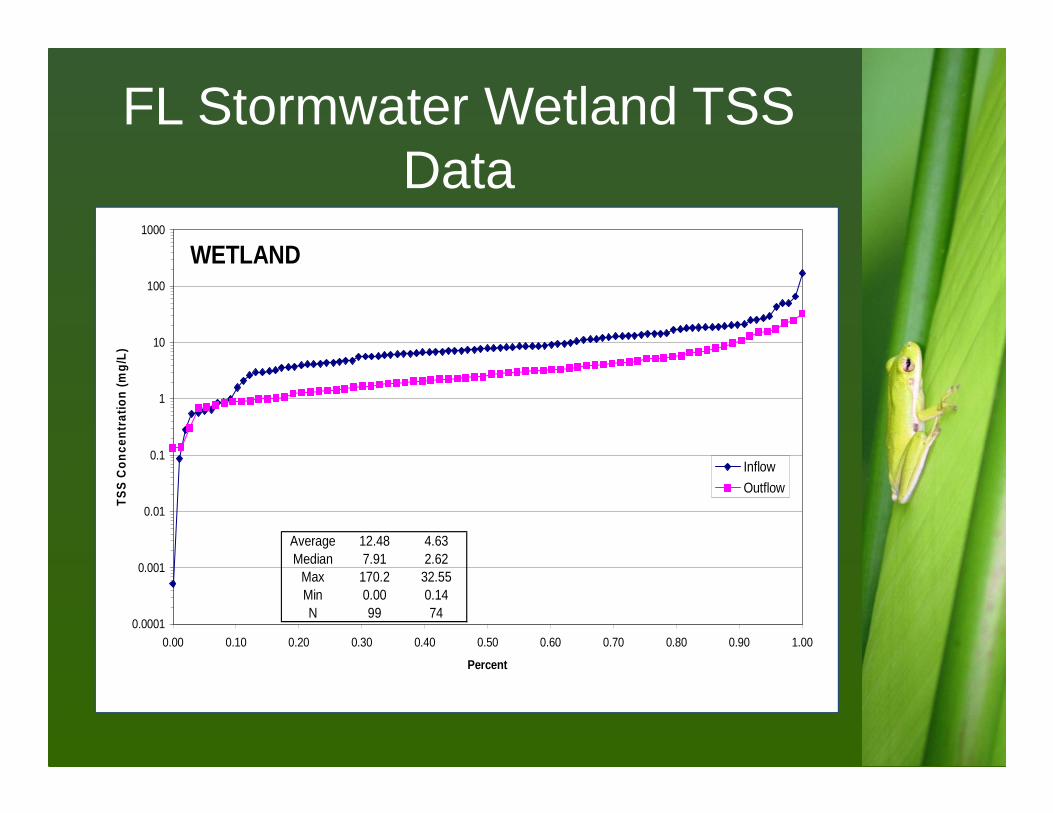
FL Stormwater Wetland TSS Data
Average 12.48 4.63Median 7.91 2.62
Max 170.2 32.55Min 0.00 0.14N 99 74
0.0001
0.001
0.01
0.1
1
10
100
1000
0.00 0.10 0.20 0.30 0.40 0.50 0.60 0.70 0.80 0.90 1.00
Percent
TS
S C
on
cen
trat
ion
(m
g/L
)
Inflow
Outflow
WETLAND

FL Stormwater Wetland TN Data

FL Stormwater Wetland NOX Data
0.0001
0.001
0.01
0.1
1
10
0.00 0.10 0.20 0.30 0.40 0.50 0.60 0.70 0.80 0.90 1.00
Percent
NO
3 C
once
ntra
tion
(mg/
L)
Inflow
Outflow
WETLAND
Average 0.10 0.24Median 0.08 0.03
Max 0.5 6.34Min 0.00 0.00N 109 58

FL Stormwater Wetland TP Data
Average 0.129 0.086Median 0.110 0.060
Max 0.774 0.480Min 0.003 0.007N 91 57
0.001
0.01
0.1
1
0.00 0.10 0.20 0.30 0.40 0.50 0.60 0.70 0.80 0.90 1.00
Percent
TP
Co
nce
ntr
atio
n (
mg
/L)
Inflow
Outflow
WETLAND
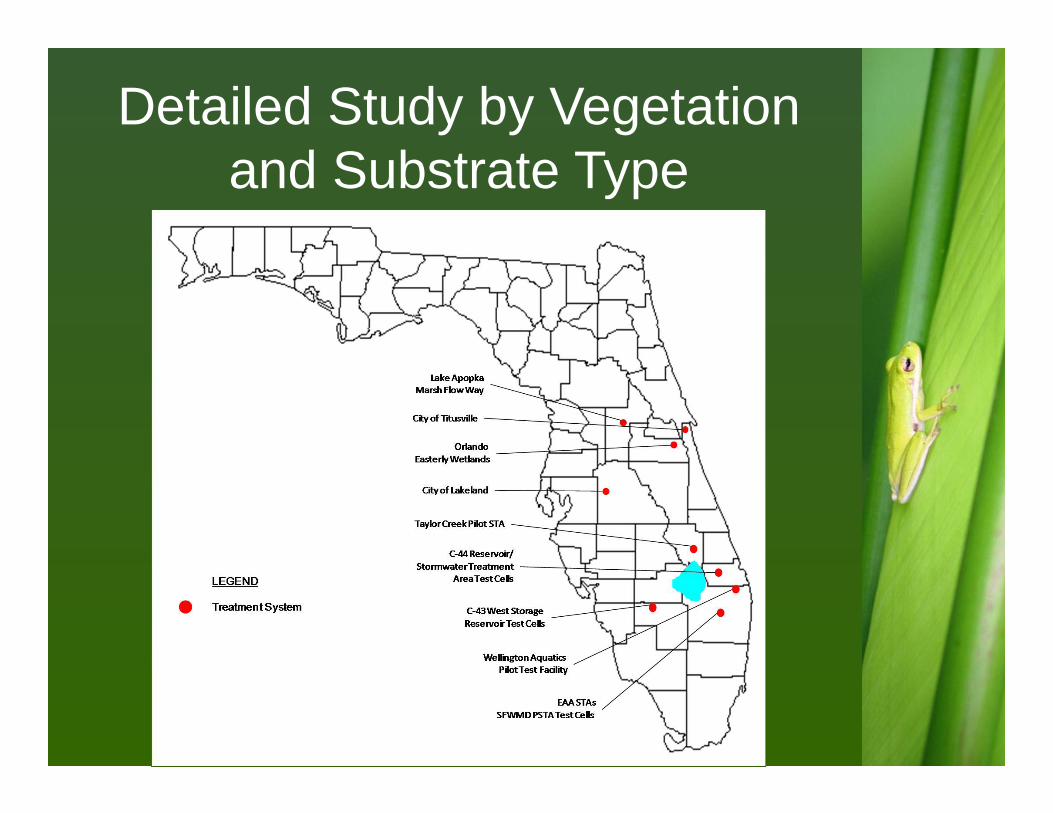
Detailed Study by Vegetation and Substrate Type

Outlet TP vs. Vegetation Type
0.001
0.01
0.1
1
10
0% 10% 20% 30% 40% 50% 60% 70% 80% 90% 100%
TP
Ou
t (m
g/L
)
Percentile
EMV
FAV
PSTA
SAV

Outlet TN vs. Vegetation Type
0.01
0.1
1
10
100
0% 10% 20% 30% 40% 50% 60% 70% 80% 90% 100%
TN
Ou
t (m
g/L
)
Percentile
EMV
FAV
PSTA
SAV

Outlet TP vs. Substrate Type
0.001
0.01
0.1
1
10
0% 10% 20% 30% 40% 50% 60% 70% 80% 90% 100%
TP
Ou
t (m
g/L
)
Percentile
PEAT
SAND
LIME ROCK
SUBSTRATE 0% 10% 25% 50% 75% 90% 100%PEAT 0.006 0.014 0.019 0.034 0.074 0.139 1.07SAND 0.005 0.020 0.030 0.051 0.087 0.150 1.25LIME ROCK 0.007 0.011 0.013 0.016 0.021 0.027 0.109
PERCENTILE

Outlet TN vs. Substrate Type
0.01
0.1
1
10
100
0% 10% 20% 30% 40% 50% 60% 70% 80% 90% 100%
TN
Ou
t (m
g/L
)
Percentile
CLAY
PEAT
SAND
LIME ROCK
SUBSTRATE 0% 10% 25% 50% 75% 90% 100%CLAY 0.29 0.85 1.07 1.50 2.10 2.88 12.50PEAT 0.37 1.33 1.66 2.13 2.56 3.29 7.56SAND 0.40 0.70 0.79 0.97 1.28 1.97 3.89LIME ROCK 0.06 0.69 1.03 1.60 2.17 2.47 3.23
PERCENTILE

Expansions of SW Wetland Technology
• Floating wetlands as add-ons in wet detention ponds
• LID modular systems
• Hybrid chemical treatment/wetland systems
• Soil amendments
www.beemats.com
www.modularwetlands.com

Emerging SW Issues
• Effects of reclaimed water irrigation on stormwater systems (Harper 2012)– 2/3 of WWTP’s produce secondary quality
reclaimed water (TN: 2-15 times stronger than runoff; TP: 8-60 times stronger)
– 1/3 of WWTP’s produce tertiary quality reclaimed water (similar to high density residential runoff)
– Tendency by homeowners to over-irrigate• Dry retention favored in many areas but
presumption of 100% load reduction is questionable

Dry Retention – Wetland Conversion for Nitrate Removal
De
pth
Be
low
S
urfa
ce
Unsaturated Surficial AquiferSaturated Surficial Aquifer
Floridan Aquifer
NO3
Spring
Storm Event Volume
Dry Weather Reclaimed Application

Infiltrating Wetland Surface Water Nitrogen Concentrations

Infiltrating Wetland Shallow Groundwater Concentrations

Infiltration Rates

Questions