Use of Vehicle Telematics Data to Update Mileage Accrual Rates
20
Allison DenBleyker , Meredith Weatherby, Sandeep Kishan Brenda Nguyen, Kyle Liu, Amir Sayeh, Mike Branch U.S. EPA 2019 Emissions Inventory Conference Dallas, Texas Use of Vehicle Telematics Data to Update Mileage Accrual Rates
Transcript of Use of Vehicle Telematics Data to Update Mileage Accrual Rates
Allison DenBleyker, Meredith Weatherby, Sandeep Kishan
Brenda Nguyen, Kyle Liu, Amir Sayeh, Mike Branch
U.S. EPA 2019 Emissions Inventory ConferenceDallas, Texas
Use of Vehicle Telematics Data to Update Mileage Accrual Rates

Acknowledgements
CARB project leads:Sherrie Sala-MooreSara ForestieriSam PournazeriCARB funded this study.
Caltrans provided 2018 California Vehicle Inventory and Use Survey (CA-VIUS).
Overview
• Mileage accrual rates • Research objective• Telematics data• Results & comparison with survey data• Summary
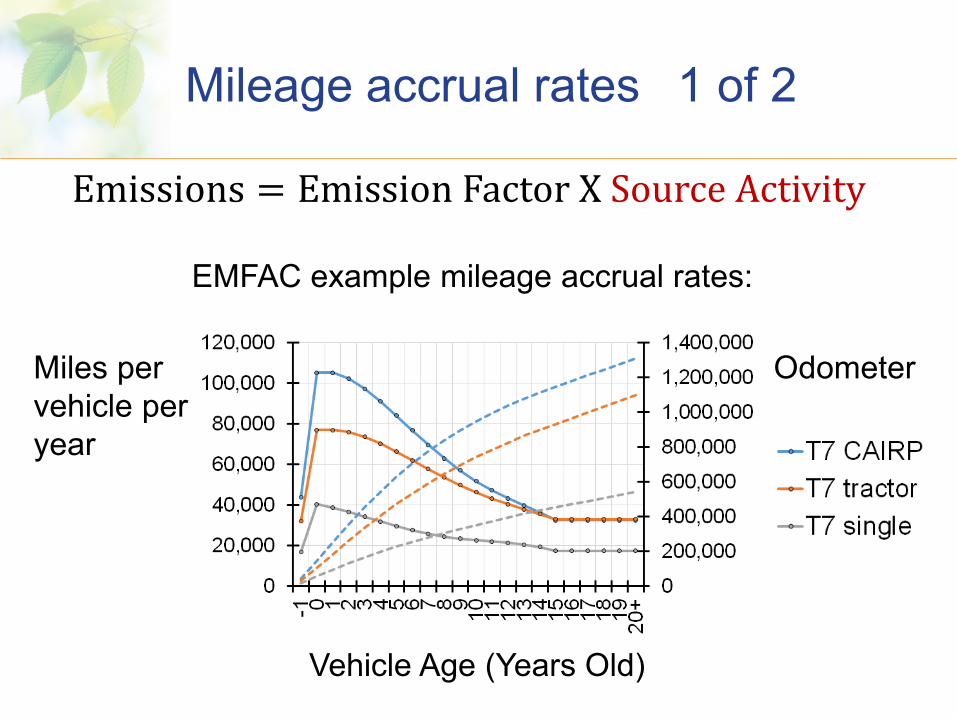
Mileage accrual rates 1 of 2
Emissions = Emission Factor X Source Activity
Miles per vehicle per year
Odometer
Vehicle Age (Years Old)
EMFAC example mileage accrual rates:

Mileage accrual rates 2 of 2
Emission Factor= Base Emission Rate X Correction Factors
Base Emission Rate =Zero Mile Rate + Deterioration Rate X Odometer
Emissions = Emission Factor X Source Activity
Research objective
Update heavy-duty vehicle (HDV) annual mileage accrual rates in EMFAC model
New data requirements:• Recent within 5 years• California-specific• Differences by weight, body, vocation

Telematics data
• Method of harvesting data from vehicles– Connected vehicles– Navigation devices– Mobile phone apps– Location-based services– Data loggers
• Geotab, Inc. fleet management– Customers include HDV truck fleets – Geotab loggers collect GPS & engine data

Geotab
Point cloud image of 1-day data density from Geotab’s database
Global leader in telematics, providing open platform fleet management solutions
Richest telematics dataset in the worldGPS, traffic, accelerometer, engine data,weather, driver behaviour
310,000 heavy duty trucks
Patented method of moving data efficiently from vehicle to server
>40 Bdata records processed daily
connected vehicles, globally
>1.7 M
Telematics data Methods 1 of 6
Scope of Geotab data pull• Gross vehicle weight ≥ 14,000 lbs.• January to December, 2018• ≥ 30 days of reporting• Any travel inside California
Telematics data Methods 2 of 6
Geotab groups data to protect privacy• N=116,693 trucks 890 unique data records• Between 3 and 3,400 trucks on a record• The 890 resulted from project requirements:
»Vehicle model year»Weight»Body style »Vocation

Telematics data Methods 3 of 6
Each record provided:• Vehicle count • Vehicle-days logged • Calendar days elapsed • Several VMT metrics
– Key was “VMT per day” (per vehicle, equal-weighted average)
– Percentiles and standard deviation of “VMT per day”
Telematics data Methods 4 of 6
Transformations to the Geotab data• Scale “VMT per day” to annual• Align Geotab categories to EMFAC ones• Plot profiles of annual mileage accrual by age• Fit trendlines to the data• Comparison with other sources
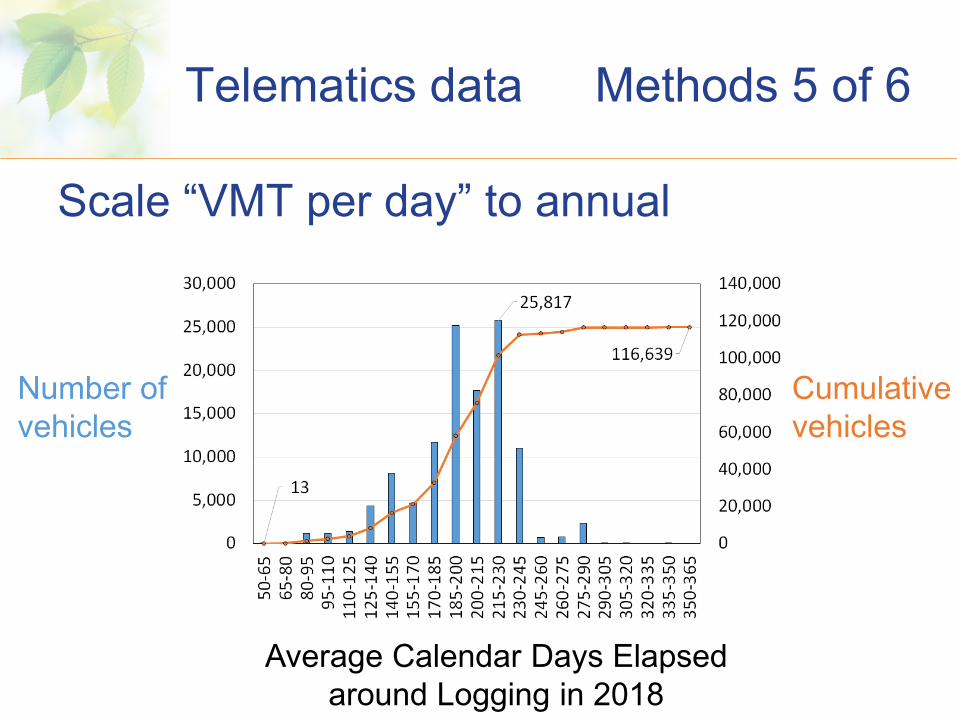
Telematics data Methods 5 of 6
Scale “VMT per day” to annual
Number of vehicles
Cumulative vehicles
Average Calendar Days Elapsed around Logging in 2018

Telematics data Methods 6 of 6
Scale “VMT per day” to annual
• Derived scalars different for each record• Most common scalar 185-200 days
Annual miles accrued = VMT per day X (Scalar)
Scalar =Vehicle Days Logged
Calendar Days ElapsedX 365 days

Results 1 of 5
Class 7-8 Interstate Tractor Trucks
Age (Years Old)
Annu
al M
iles
N v
ehic
les
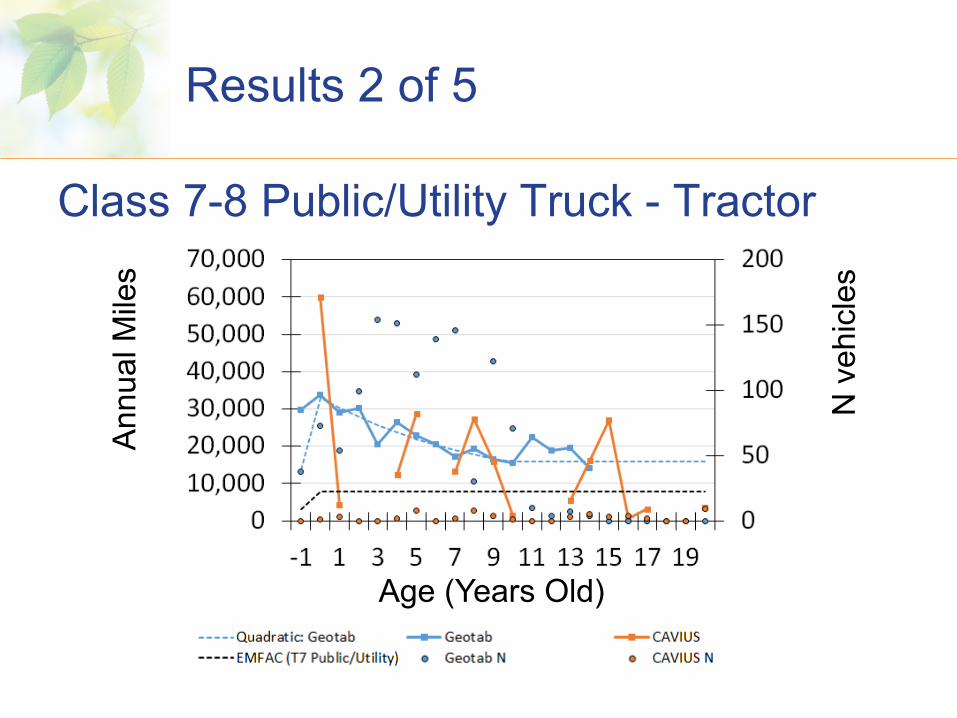
Results 2 of 5
Class 7-8 Public/Utility Truck - Tractor
Age (Years Old)
Annu
al M
iles
N v
ehic
les
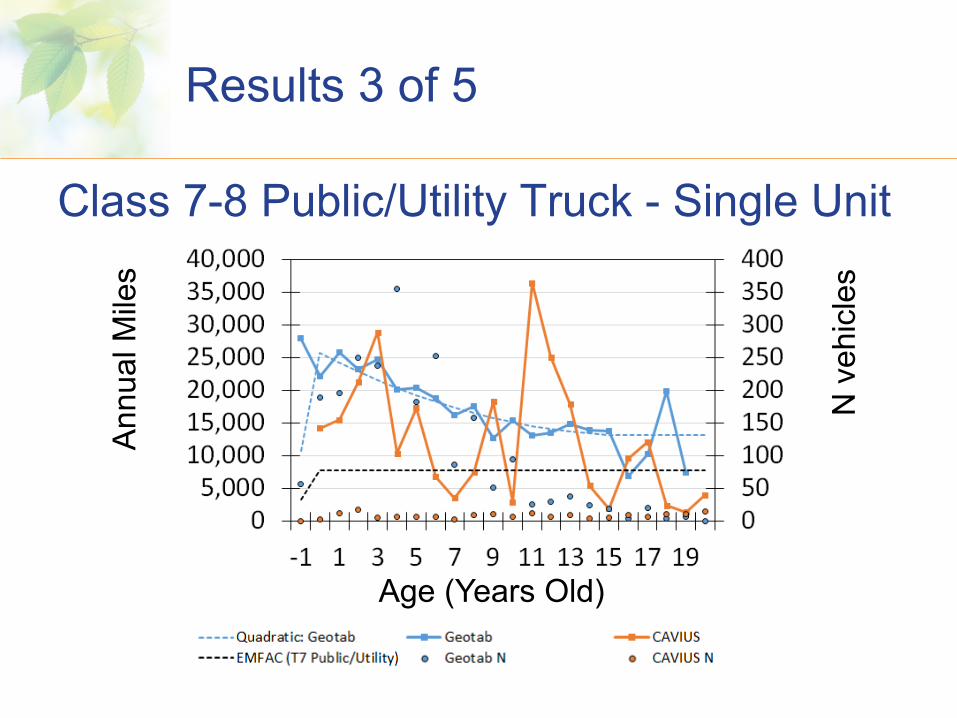
Results 3 of 5
Class 7-8 Public/Utility Truck - Single Unit
Age (Years Old)
Annu
al M
iles
N v
ehic
les

Results 4 of 5
Class 8 Single-Unit (“other” vocations)
Age (Years Old)
Annu
al M
iles
N v
ehic
les
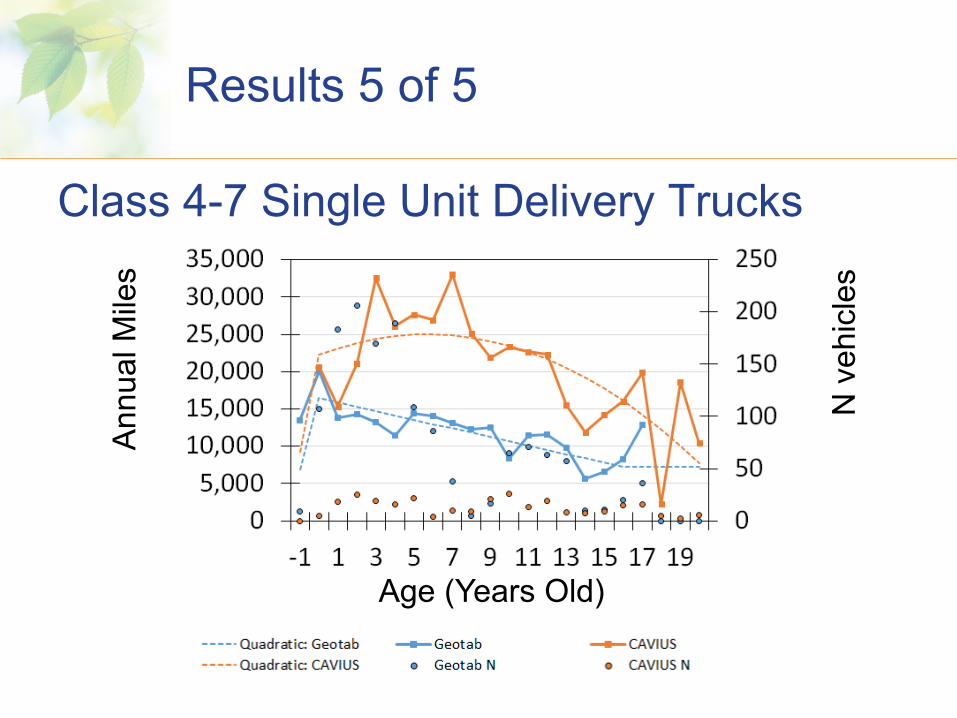
Results 5 of 5
Class 4-7 Single Unit Delivery Trucks
Age (Years Old)
Annu
al M
iles
N v
ehic
les

Summary
• EMFAC accrual profiles from 2002 VIUS outdated
• Geotab provided aggregated VMT summaries
• ERG produced 18 new accrual profiles for CARB to consider use in next EMFAC202x
• Recommended future refinement of “delivery truck” category