USE OF THE AMPT TO EVALUATE PAVEMENT PERFORMANCE€¦ · Test all HMA lifts in the AMPT series DM,...
46
USE OF THE AMPT TO EVALUATE PAVEMENT PERFORMANCE ASPHALT MIXTURE ETG MAY 9 TH , 2018 Derek Nener-Plante, M.S., P.E. Asphalt Pavement Engineer 1 Integrity – Competence - Service
Transcript of USE OF THE AMPT TO EVALUATE PAVEMENT PERFORMANCE€¦ · Test all HMA lifts in the AMPT series DM,...
USE OF THE AMPT TO EVALUATE PAVEMENT PERFORMANCEASPHALT MIXTURE ETG MAY 9TH, 2018
Derek Nener-Plante, M.S., P.E.Asphalt Pavement Engineer
1
Integrity – Competence - Service

Disclaimer / Acknowledgements2
MaineDOT has not yet gained expertise in the AMPT and the analysis methods… yet.
Thanks to the following for their assistance:
Dr. Kim & NC State Students / Staff FHWA MaineDOT lab staff
Talking Points3
Purpose: To give the motivation, methodology, early results, and lessons learned from Maine’s work with the AMPT
How?
Maine’s overall plan for AMPT Proficiency Test Results Performance-Related Specification Shadow Project PEMD
Background - MaineDOT4
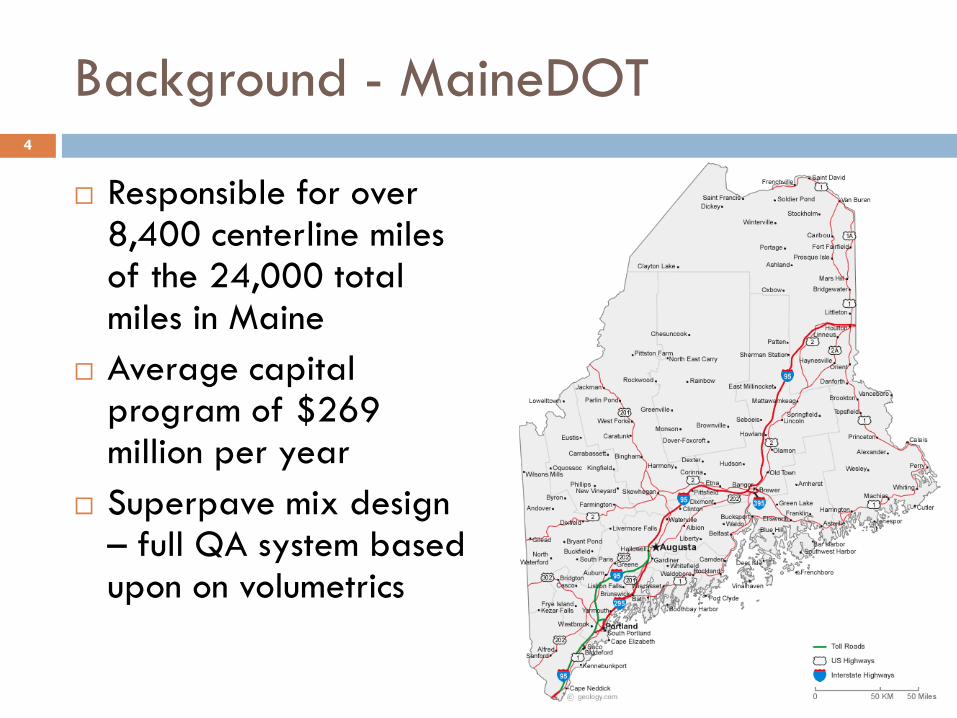
Responsible for over 8,400 centerline miles of the 24,000 total miles in Maine
Average capital program of $269 million per year
Superpave mix design – full QA system based upon on volumetrics

Motivation for Change5
Background – HMA Process6
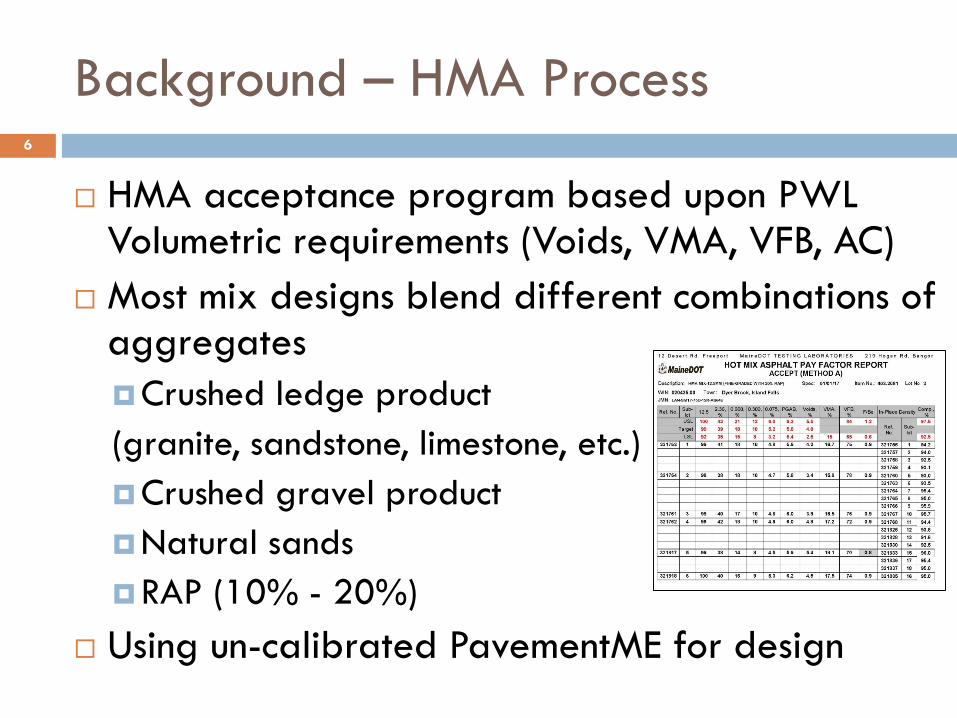
HMA acceptance program based upon PWL Volumetric requirements (Voids, VMA, VFB, AC)
Most mix designs blend different combinations of aggregatesCrushed ledge product (granite, sandstone, limestone, etc.)Crushed gravel productNatural sandsRAP (10% - 20%)
Using un-calibrated PavementME for design
Maine’s AMPT Objectives7
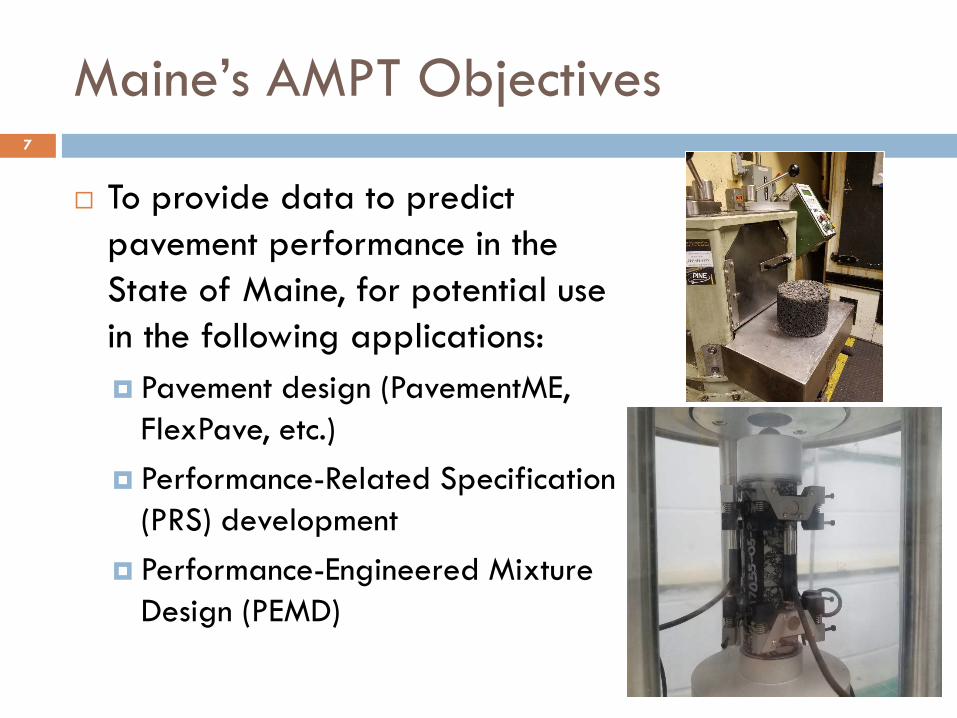
To provide data to predict pavement performance in the State of Maine, for potential use in the following applications: Pavement design (PavementME,
FlexPave, etc.) Performance-Related Specification
(PRS) development Performance-Engineered Mixture
Design (PEMD)
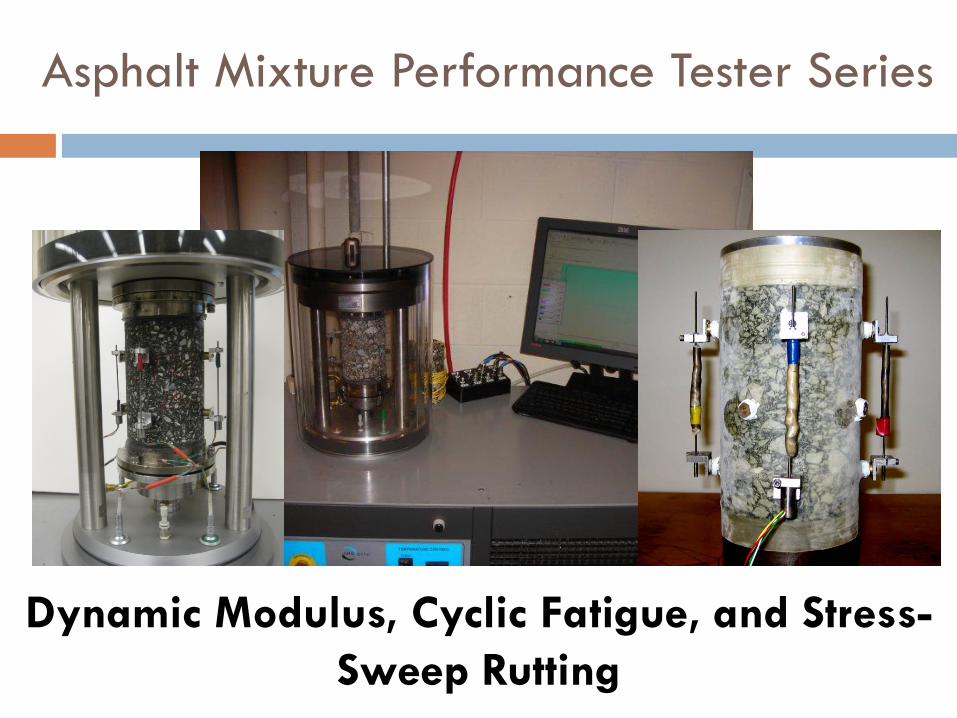
Asphalt Mixture Performance Tester Series
Dynamic Modulus, Cyclic Fatigue, and Stress-Sweep Rutting
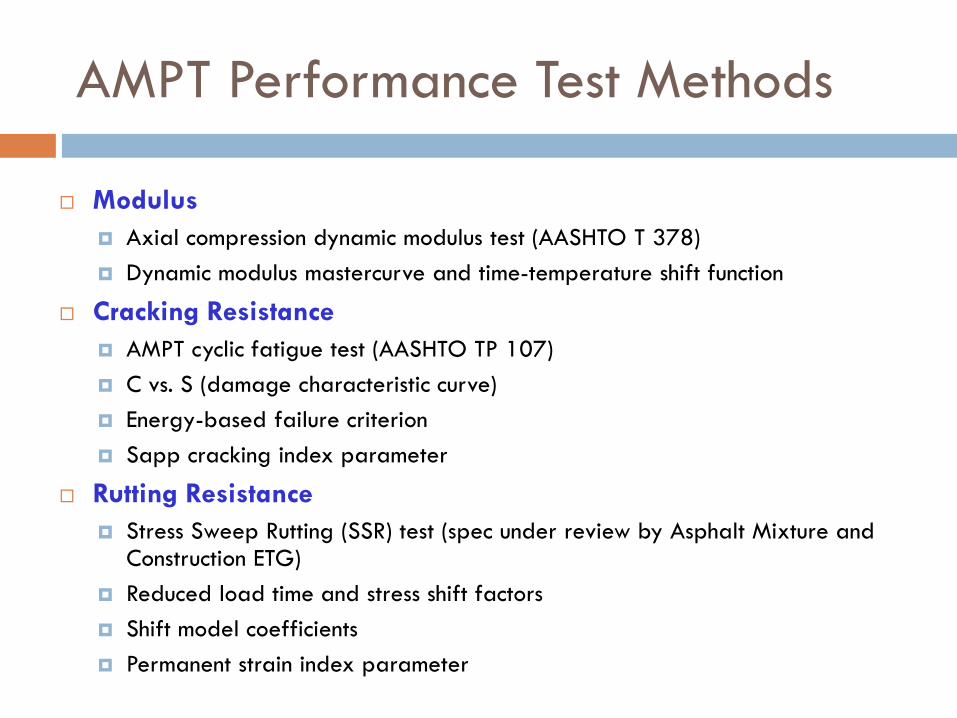
AMPT Performance Test Methods
Modulus Axial compression dynamic modulus test (AASHTO T 378) Dynamic modulus mastercurve and time-temperature shift function
Cracking Resistance AMPT cyclic fatigue test (AASHTO TP 107) C vs. S (damage characteristic curve) Energy-based failure criterion Sapp cracking index parameter
Rutting Resistance Stress Sweep Rutting (SSR) test (spec under review by Asphalt Mixture and
Construction ETG) Reduced load time and stress shift factors Shift model coefficients Permanent strain index parameter
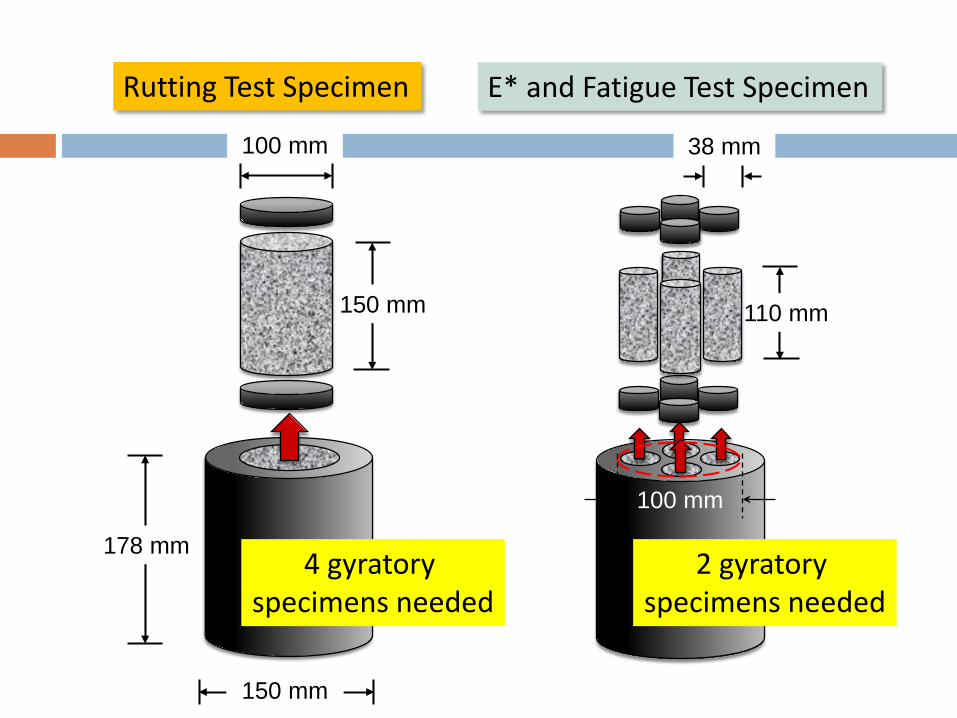
110 mm
38 mm
100 mm
E* and Fatigue Test Specimen
178 mm
150 mm
100 mm
150 mm
Rutting Test Specimen
4 gyratory specimens needed
2 gyratory specimens needed
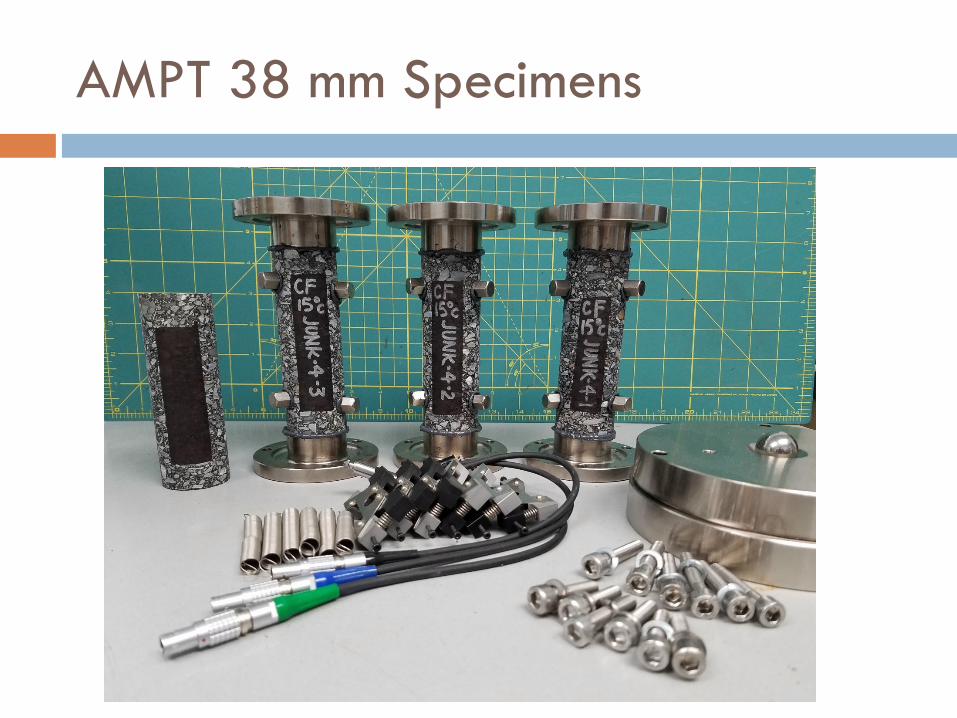
AMPT 38 mm Specimens
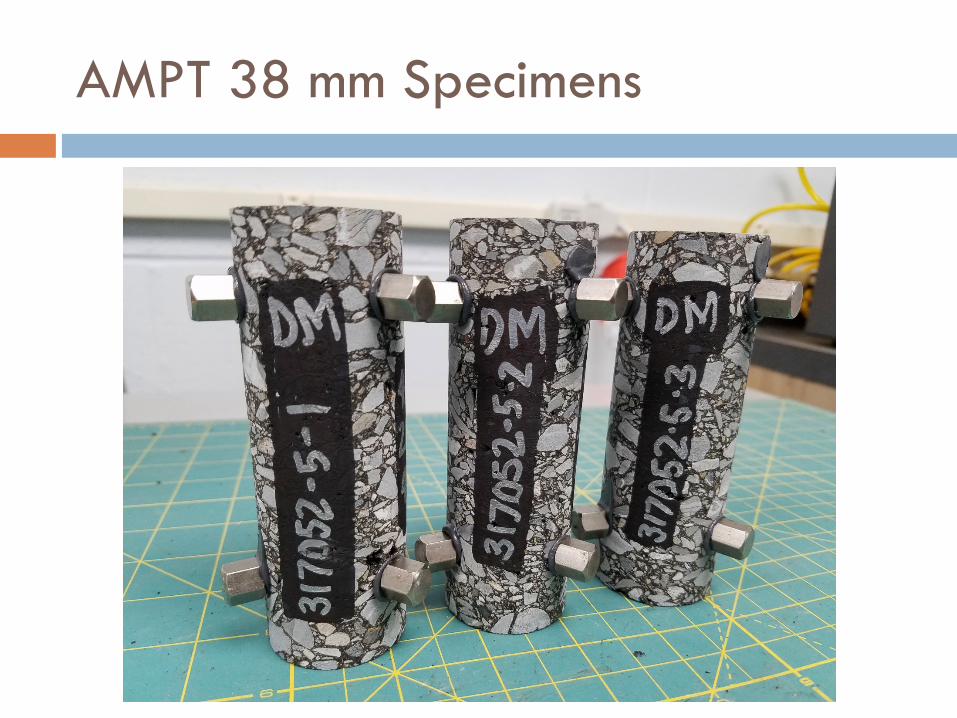
AMPT 38 mm Specimens
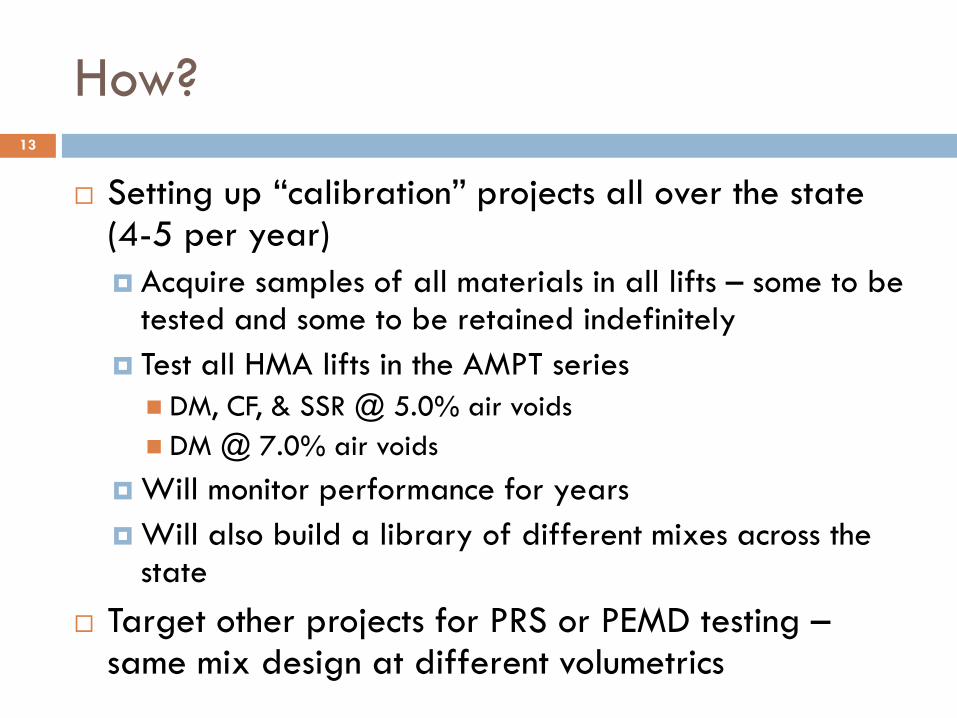
How?13
Setting up “calibration” projects all over the state (4-5 per year) Acquire samples of all materials in all lifts – some to be
tested and some to be retained indefinitely Test all HMA lifts in the AMPT series DM, CF, & SSR @ 5.0% air voids DM @ 7.0% air voids
Will monitor performance for years Will also build a library of different mixes across the
state Target other projects for PRS or PEMD testing –
same mix design at different volumetrics
Proficiency Tests
First step = ensure that MaineDOT labs can perform the testing
One large sample of plant produced mix was obtained from one truckMaineDOT fabricated specimens and shipped to
NCSU The same mixture were tested at MaineDOT and at
NCSU The test results were compared
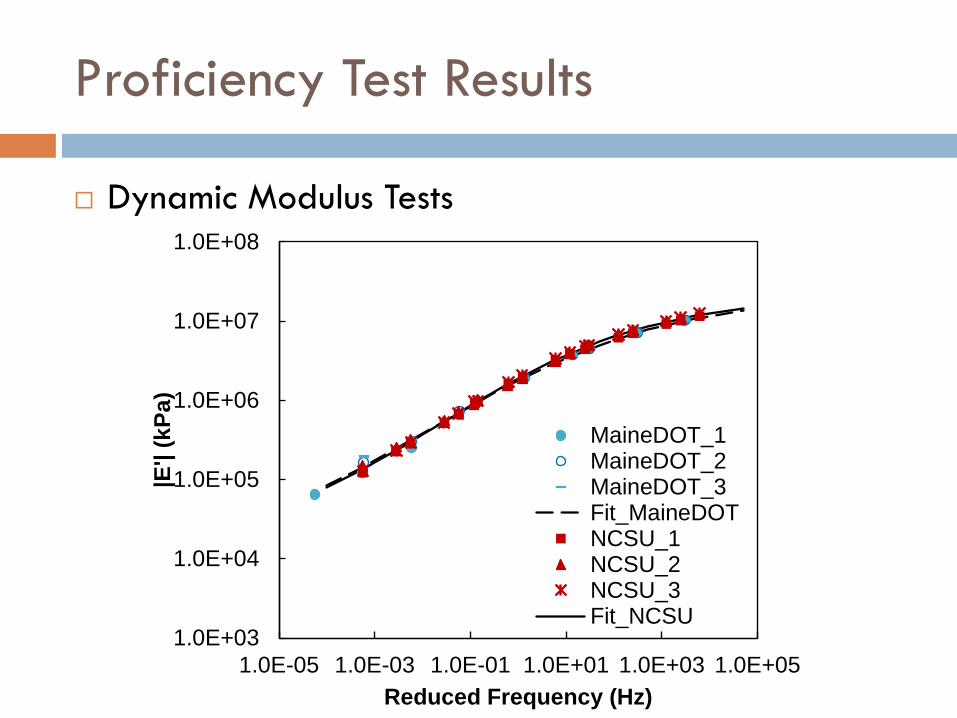
Proficiency Test Results
Dynamic Modulus Tests
1.0E+03
1.0E+04
1.0E+05
1.0E+06
1.0E+07
1.0E+08
1.0E-05 1.0E-03 1.0E-01 1.0E+01 1.0E+03 1.0E+05
|E'|
(kPa
)
Reduced Frequency (Hz)
MaineDOT_1MaineDOT_2MaineDOT_3Fit_MaineDOTNCSU_1NCSU_2NCSU_3Fit_NCSU
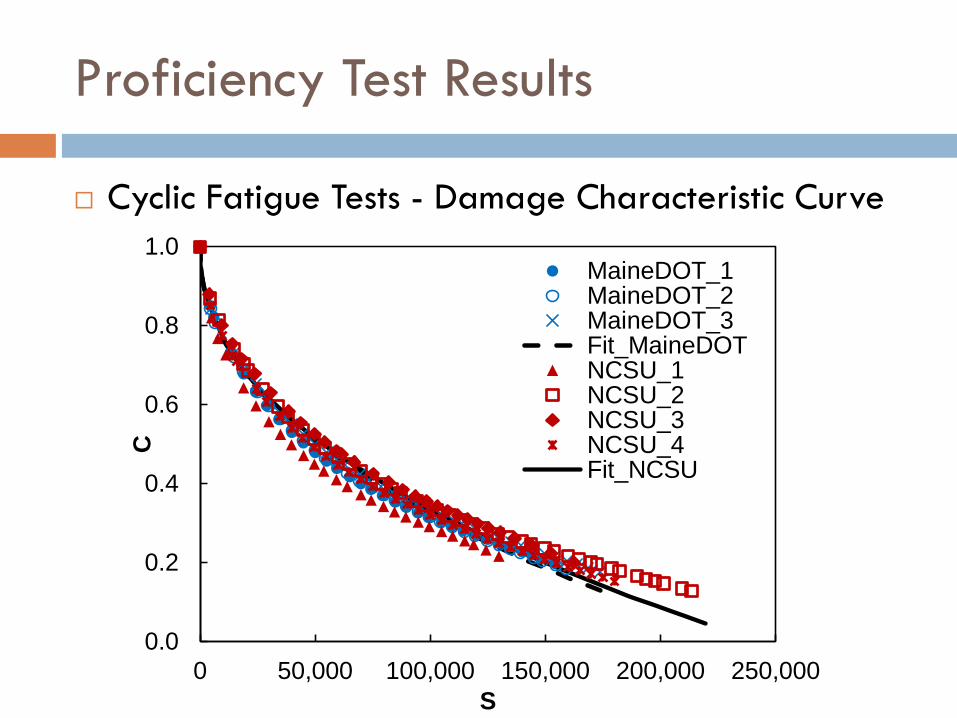
Proficiency Test Results
Cyclic Fatigue Tests - Damage Characteristic Curve
0.0
0.2
0.4
0.6
0.8
1.0
0 50,000 100,000 150,000 200,000 250,000
C
S
MaineDOT_1MaineDOT_2MaineDOT_3Fit_MaineDOTNCSU_1NCSU_2NCSU_3NCSU_4Fit_NCSU
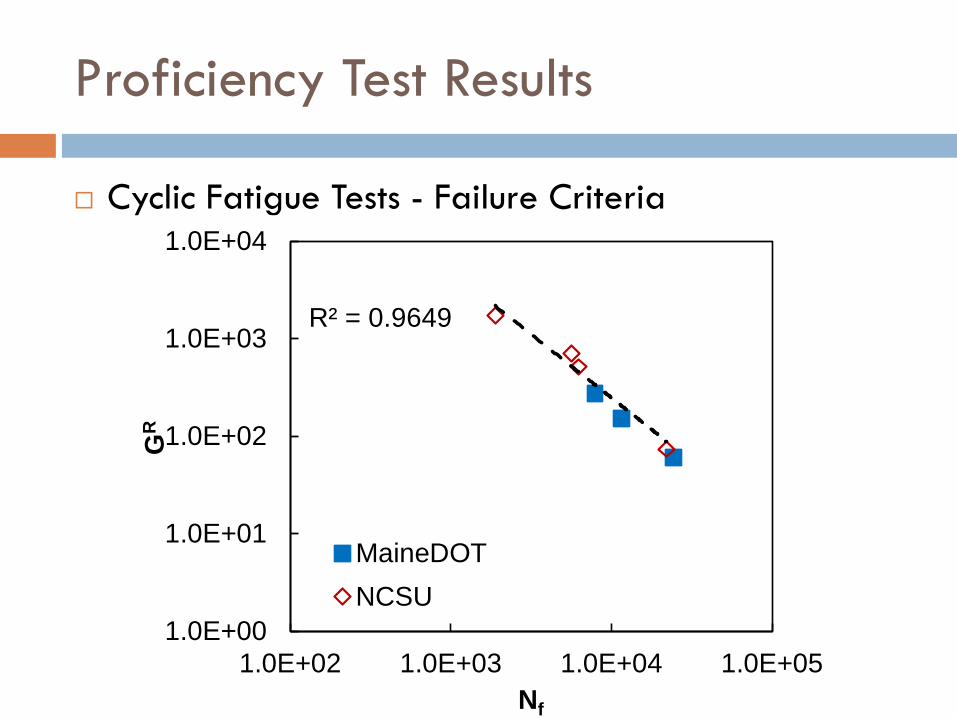
Proficiency Test Results
Cyclic Fatigue Tests - Failure Criteria
R² = 0.9649
1.0E+00
1.0E+01
1.0E+02
1.0E+03
1.0E+04
1.0E+02 1.0E+03 1.0E+04 1.0E+05
GR
Nf
MaineDOTNCSU
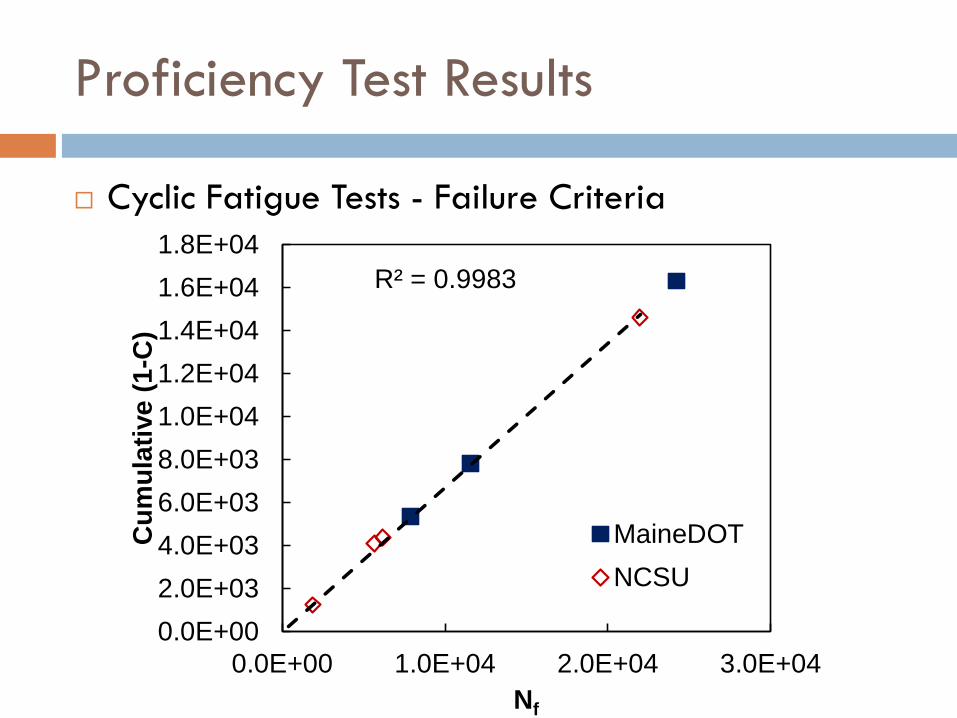
Proficiency Test Results
Cyclic Fatigue Tests - Failure Criteria
R² = 0.9983
0.0E+002.0E+034.0E+036.0E+038.0E+031.0E+041.2E+041.4E+041.6E+041.8E+04
0.0E+00 1.0E+04 2.0E+04 3.0E+04
Cum
ulat
ive
(1-C
)
Nf
MaineDOTNCSU
PRS Shadow Project
Objective: Use AMPT predictive models to show the impact of volumetric changes
10 samples were acquired in the field from the same mix design on the same project
Volumetric acceptance tests were performed on each
Performance tests were conducted on 4 of the 10 samples at MaineDOT
3 samples were shipped to NCSU.
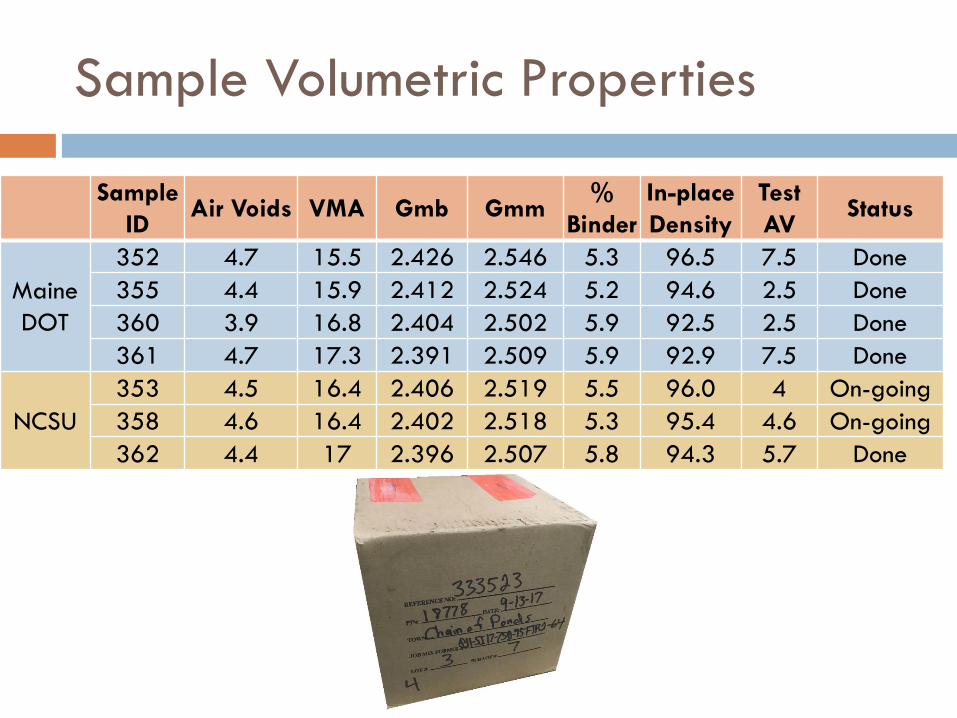
Sample Volumetric Properties
Sample ID
Air Voids VMA Gmb Gmm%
BinderIn-place Density
Test AV
Status
Maine DOT
352 4.7 15.5 2.426 2.546 5.3 96.5 7.5 Done355 4.4 15.9 2.412 2.524 5.2 94.6 2.5 Done360 3.9 16.8 2.404 2.502 5.9 92.5 2.5 Done361 4.7 17.3 2.391 2.509 5.9 92.9 7.5 Done
NCSU353 4.5 16.4 2.406 2.519 5.5 96.0 4 On-going358 4.6 16.4 2.402 2.518 5.3 95.4 4.6 On-going362 4.4 17 2.396 2.507 5.8 94.3 5.7 Done
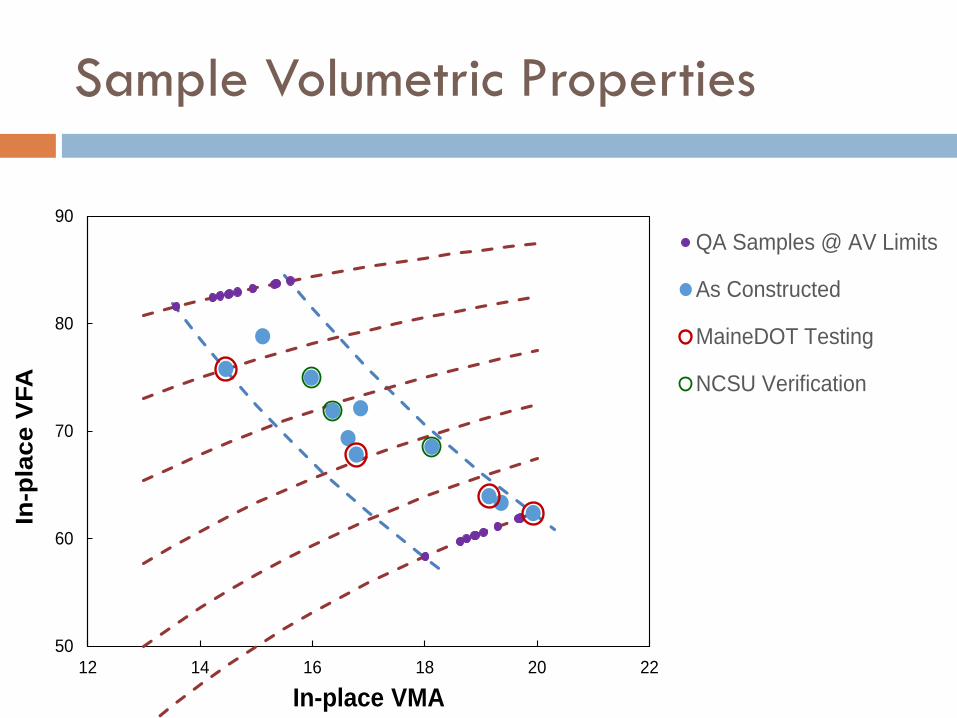
Sample Volumetric Properties
50
60
70
80
90
12 14 16 18 20 22
In-p
lace
VFA
In-place VMA
QA Samples @ AV Limits
As Constructed
MaineDOT Testing
NCSU Verification
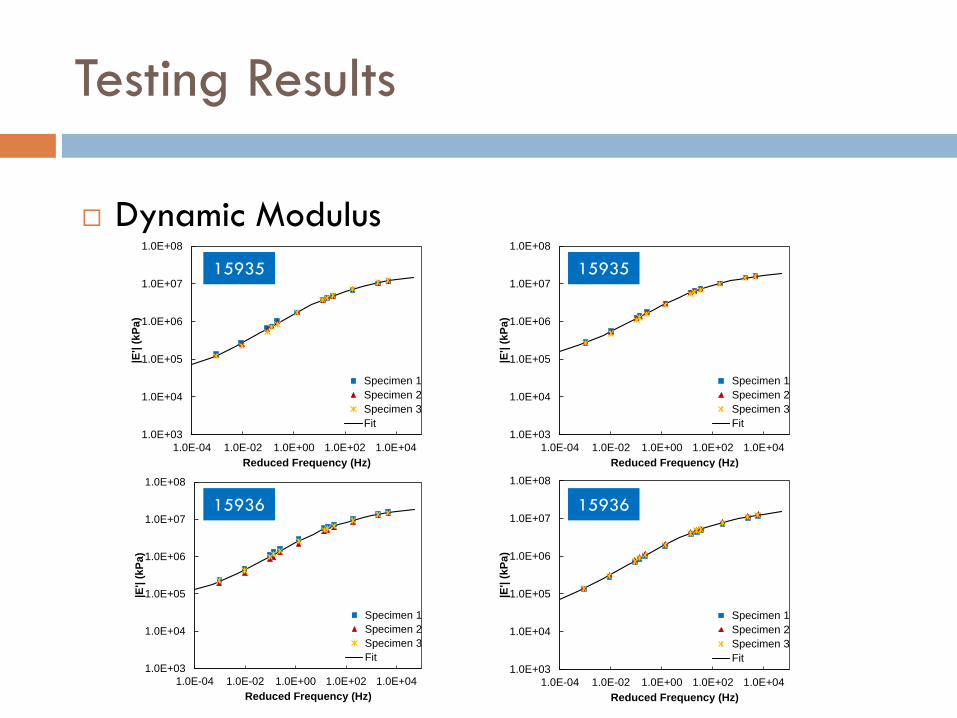
Testing Results
Dynamic Modulus
1.0E+03
1.0E+04
1.0E+05
1.0E+06
1.0E+07
1.0E+08
1.0E-04 1.0E-02 1.0E+00 1.0E+02 1.0E+04
|E'|
(kPa
)
Reduced Frequency (Hz)
Specimen 1Specimen 2Specimen 3Fit
1.0E+03
1.0E+04
1.0E+05
1.0E+06
1.0E+07
1.0E+08
1.0E-04 1.0E-02 1.0E+00 1.0E+02 1.0E+04
|E'|
(kPa
)
Reduced Frequency (Hz)
Specimen 1Specimen 2Specimen 3Fit
1.0E+03
1.0E+04
1.0E+05
1.0E+06
1.0E+07
1.0E+08
1.0E-04 1.0E-02 1.0E+00 1.0E+02 1.0E+04
|E'|
(kPa
)
Reduced Frequency (Hz)
Specimen 1Specimen 2Specimen 3Fit
1.0E+03
1.0E+04
1.0E+05
1.0E+06
1.0E+07
1.0E+08
1.0E-04 1.0E-02 1.0E+00 1.0E+02 1.0E+04
|E'|
(kPa
)
Reduced Frequency (Hz)
Specimen 1Specimen 2Specimen 3Fit
159352
159355
159360
159361
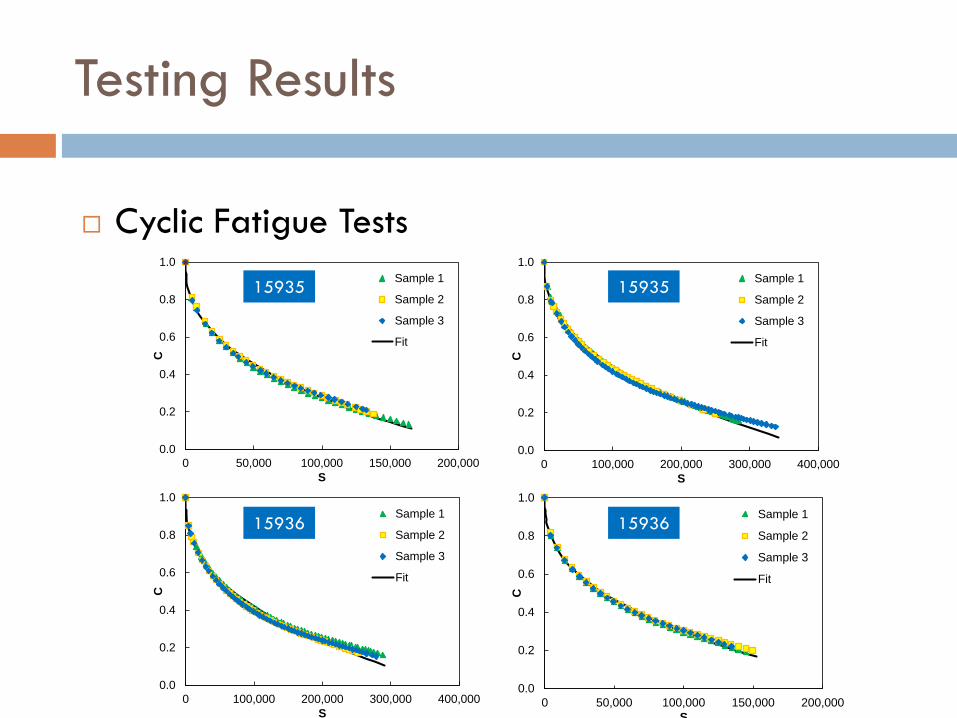
Testing Results
Cyclic Fatigue Tests
0.0
0.2
0.4
0.6
0.8
1.0
0 50,000 100,000 150,000 200,000
C
S
Sample 1
Sample 2
Sample 3
Fit
0.0
0.2
0.4
0.6
0.8
1.0
0 100,000 200,000 300,000 400,000
C
S
Sample 1
Sample 2
Sample 3
Fit
0.0
0.2
0.4
0.6
0.8
1.0
0 100,000 200,000 300,000 400,000
C
S
Sample 1
Sample 2
Sample 3
Fit
0.0
0.2
0.4
0.6
0.8
1.0
0 50,000 100,000 150,000 200,000
C
S
Sample 1
Sample 2
Sample 3
Fit
159352
159355
159360
159361
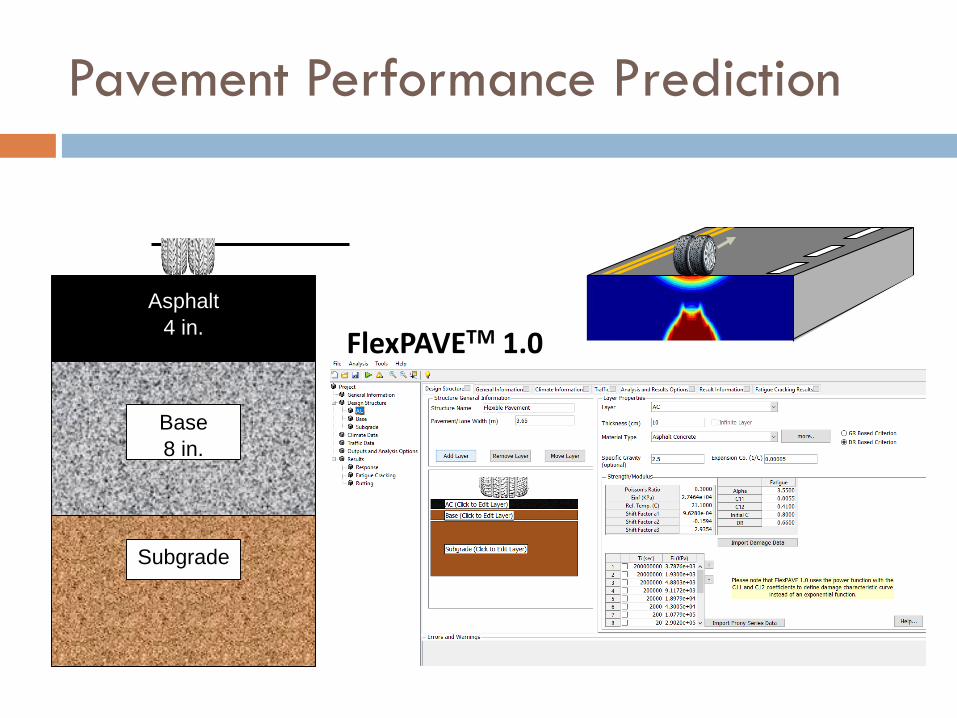
Pavement Performance Prediction
Base8 in.
Asphalt4 in.
Subgrade
FlexPAVETM 1.0
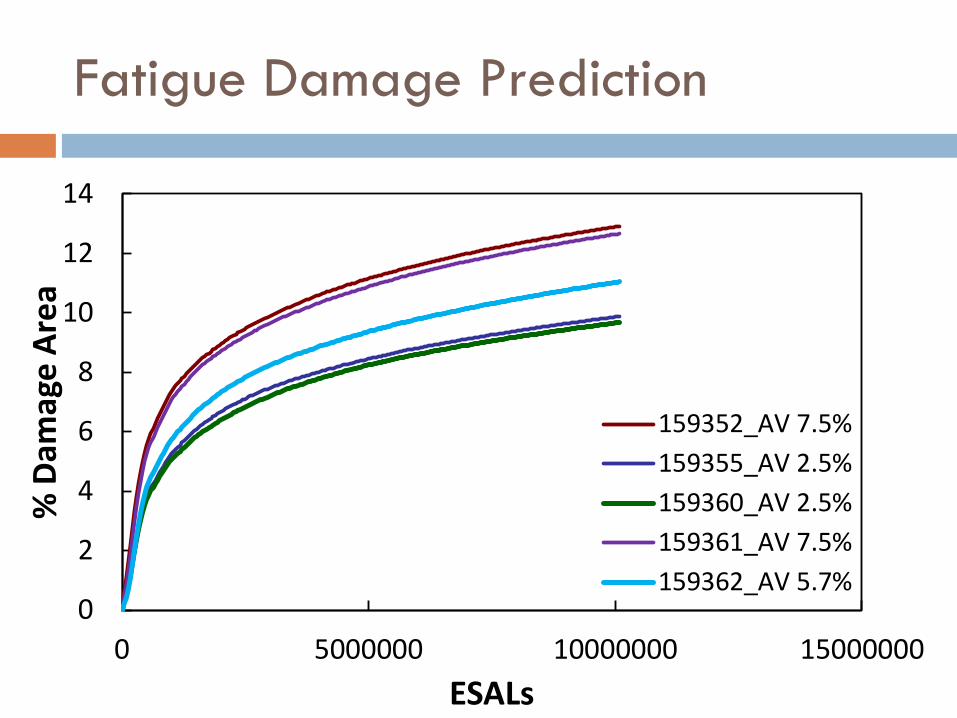
Fatigue Damage Prediction
0
2
4
6
8
10
12
14
0 5000000 10000000 15000000
% D
amag
e Ar
ea
ESALs
159352_AV 7.5%159355_AV 2.5%159360_AV 2.5%159361_AV 7.5%159362_AV 5.7%
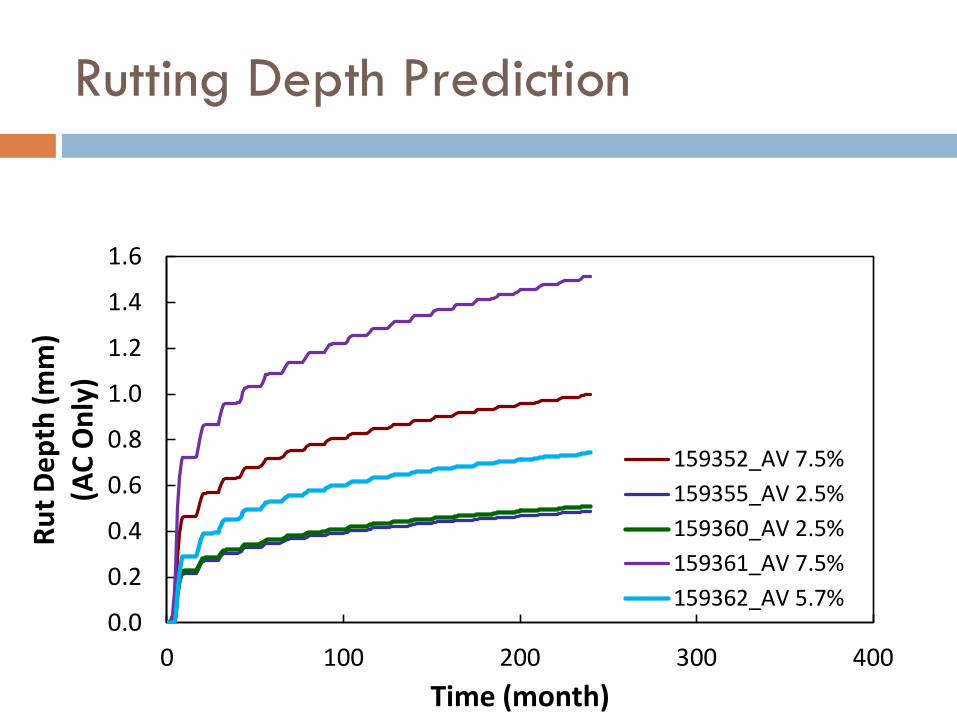
Rutting Depth Prediction
0.0
0.2
0.4
0.6
0.8
1.0
1.2
1.4
1.6
0 100 200 300 400
Rut D
epth
(mm
)(A
C O
nly)
Time (month)
159352_AV 7.5%159355_AV 2.5%159360_AV 2.5%159361_AV 7.5%159362_AV 5.7%
Performance-Volumetric Relationship (PVR)
The PVR was calibrated using the performance test results generated by MaineDOT.
PVR was used to predict performance for mixes with different volumetric properties that were tested at NCSU for verification.
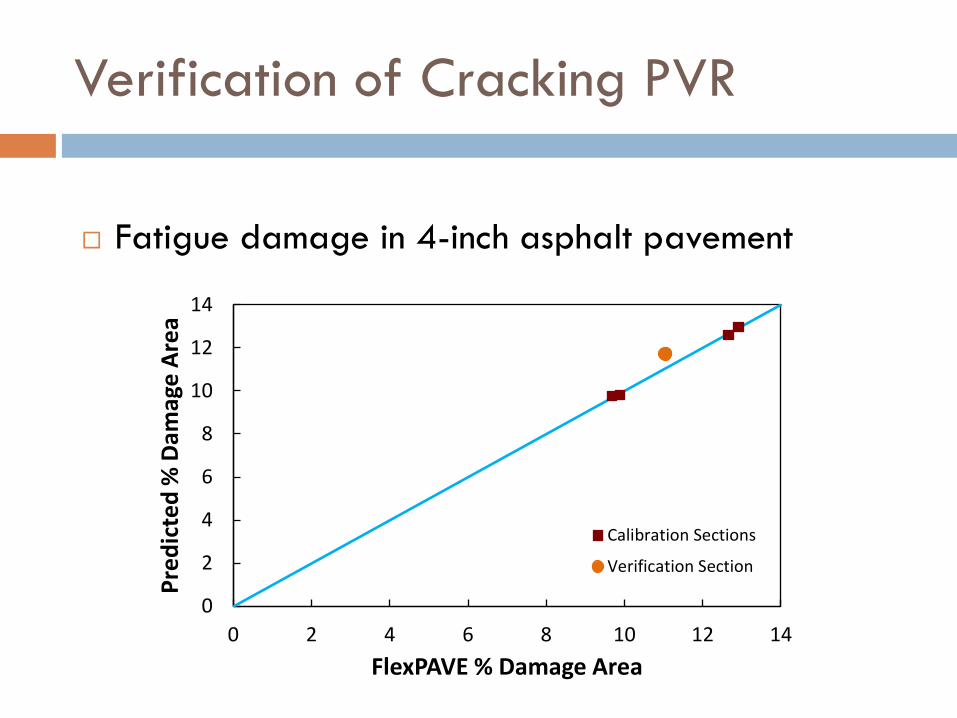
Verification of Cracking PVR
Fatigue damage in 4-inch asphalt pavement
0
2
4
6
8
10
12
14
0 2 4 6 8 10 12 14
Pred
icte
d %
Dam
age
Area
FlexPAVE % Damage Area
Calibration Sections
Verification Section
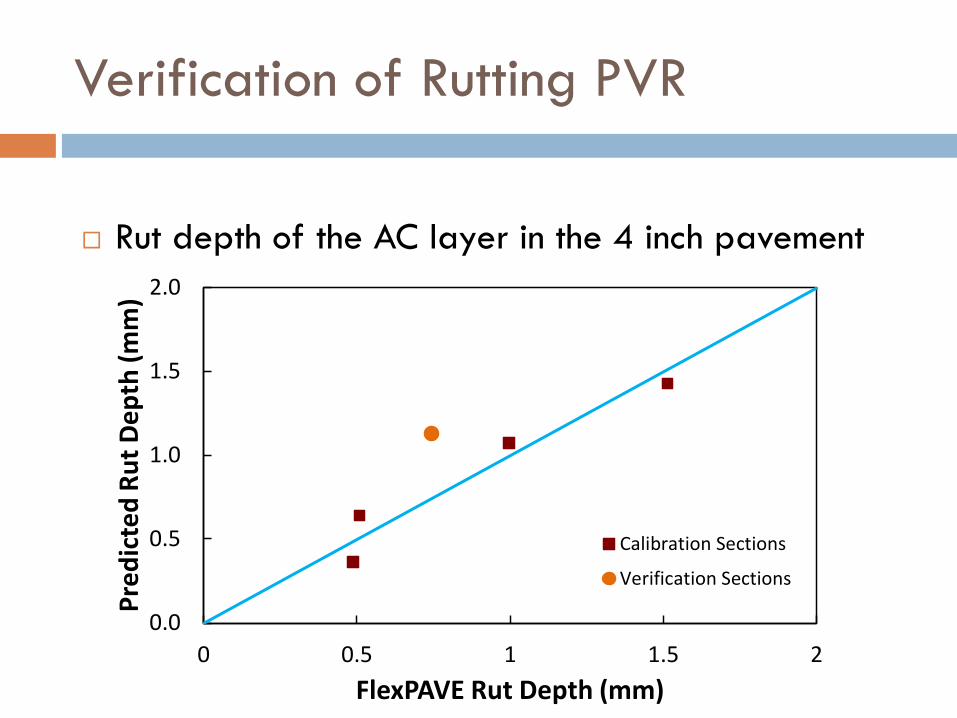
Verification of Rutting PVR
Rut depth of the AC layer in the 4 inch pavement
0.0
0.5
1.0
1.5
2.0
0 0.5 1 1.5 2
Pred
icte
d Ru
t Dep
th (m
m)
FlexPAVE Rut Depth (mm)
Calibration Sections
Verification Sections
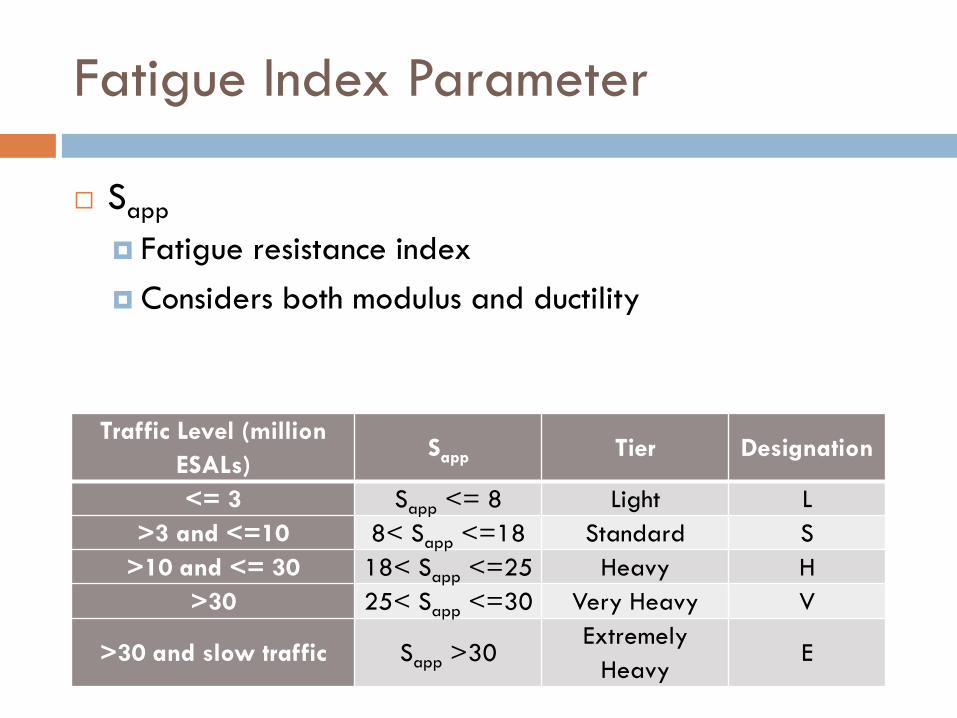
Fatigue Index Parameter
Sapp
Fatigue resistance index Considers both modulus and ductility
Traffic Level (million ESALs)
Sapp Tier Designation
<= 3 Sapp <= 8 Light L>3 and <=10 8< Sapp <=18 Standard S
>10 and <= 30 18< Sapp <=25 Heavy H>30 25< Sapp <=30 Very Heavy V
>30 and slow traffic Sapp >30Extremely
HeavyE
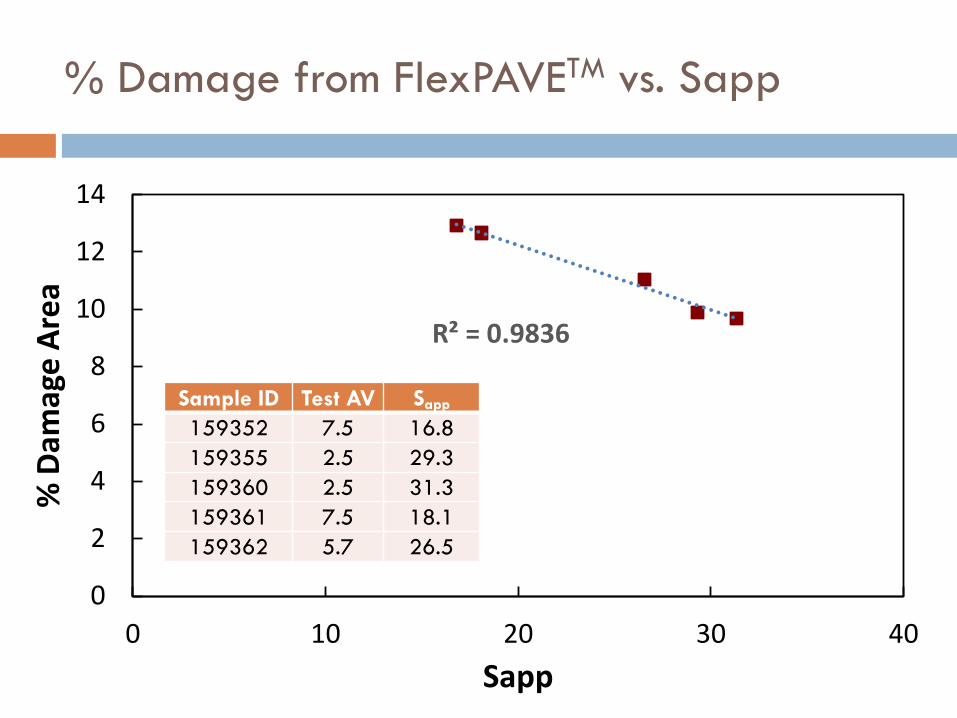
% Damage from FlexPAVETM vs. Sapp
R² = 0.9836
0
2
4
6
8
10
12
14
0 10 20 30 40
% D
amag
e Ar
ea
Sapp
Sample ID Test AV Sapp
159352 7.5 16.8159355 2.5 29.3159360 2.5 31.3159361 7.5 18.1159362 5.7 26.5
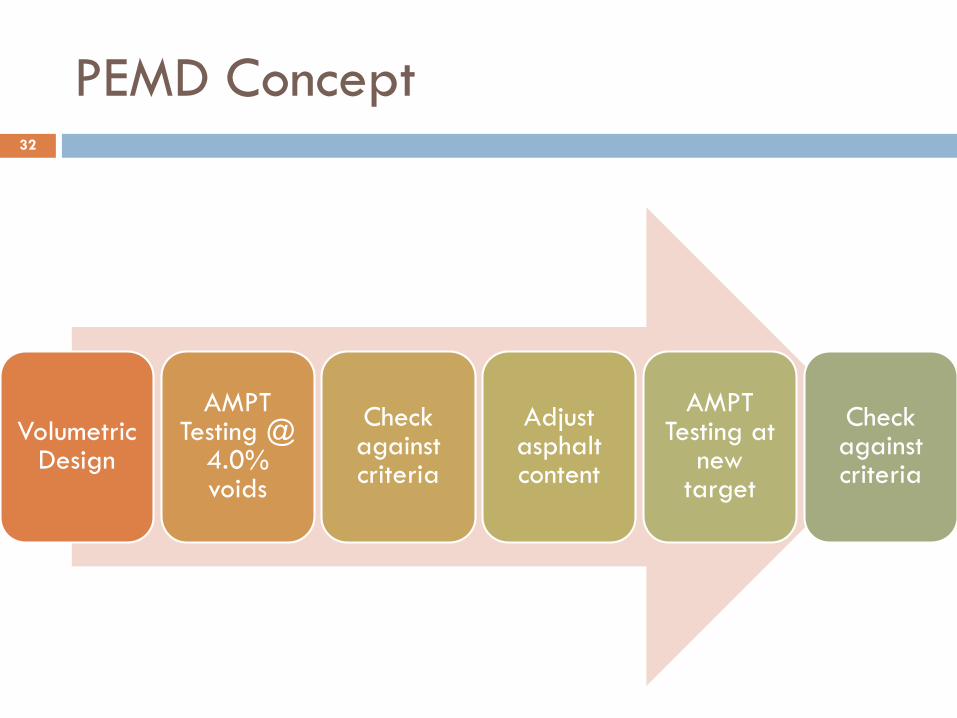
PEMD Concept32
Volumetric Design
AMPT Testing @
4.0% voids
Check against criteria
Adjust asphalt content
AMPT Testing at
new target
Check against criteria
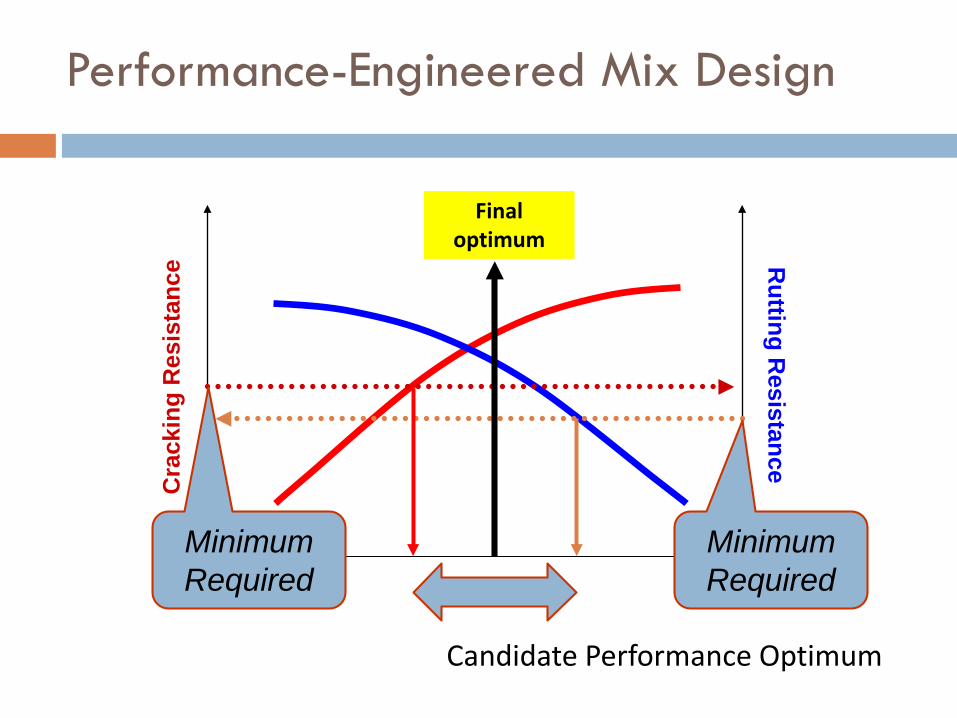
Performance-Engineered Mix Design
% AC
Cra
ckin
g R
esis
tanc
e Rutting R
esistanceVolumetric optimum
Candidate Performance Optimum
Final optimum
Minimum Required
Minimum Required
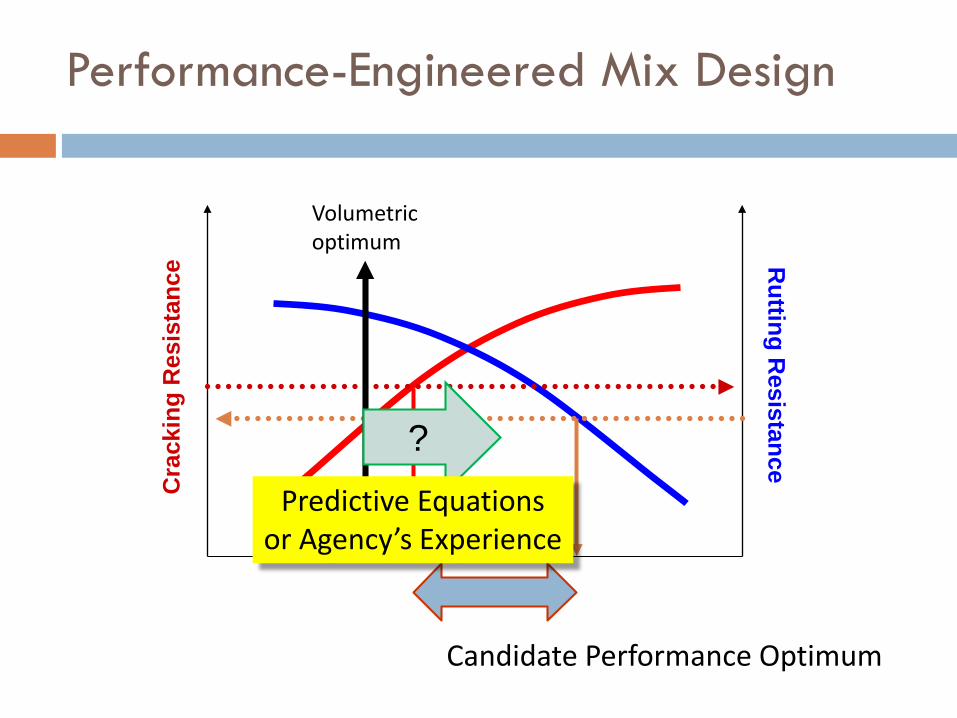
Performance-Engineered Mix Design
% AC
Cra
ckin
g R
esis
tanc
e Rutting R
esistanceVolumetric optimum
Candidate Performance Optimum
?Predictive Equations
or Agency’s Experience
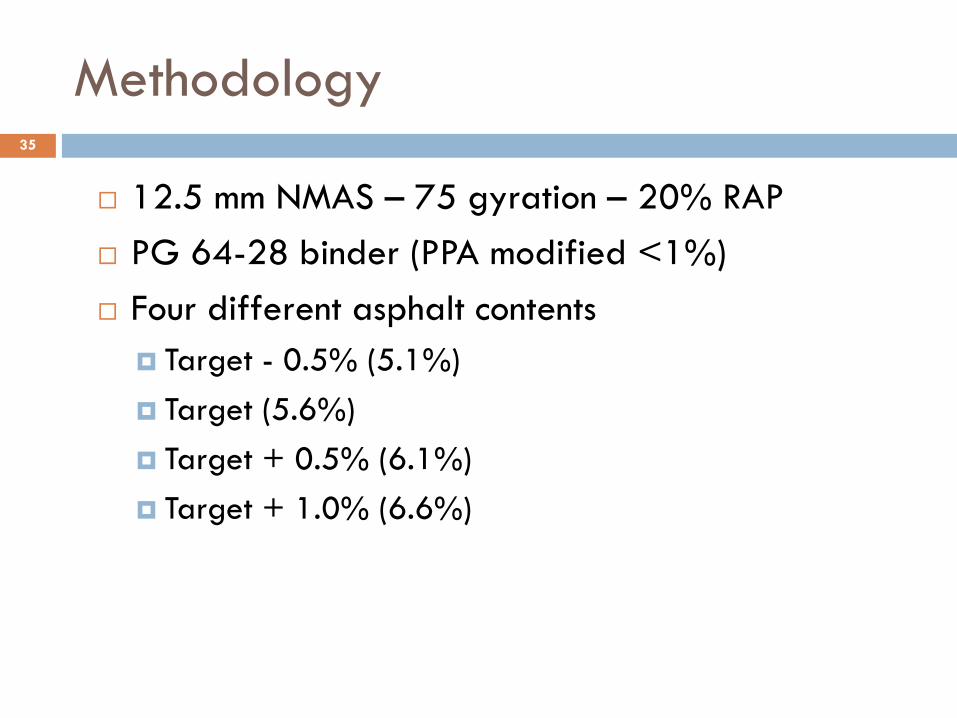
Methodology35
12.5 mm NMAS – 75 gyration – 20% RAP PG 64-28 binder (PPA modified <1%) Four different asphalt contents
Target - 0.5% (5.1%) Target (5.6%) Target + 0.5% (6.1%) Target + 1.0% (6.6%)
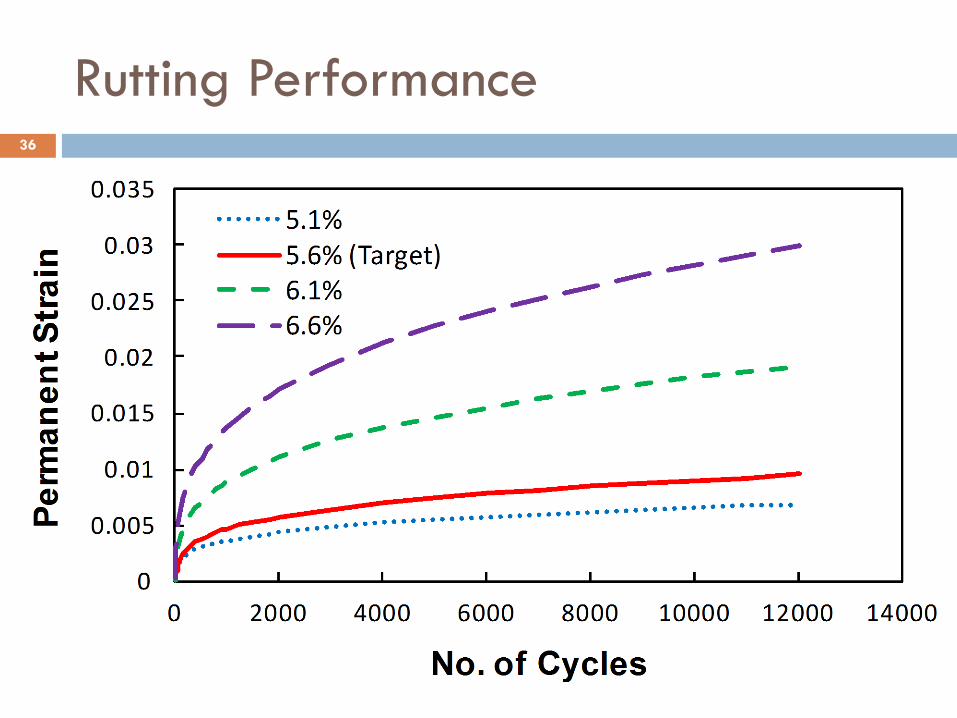
Rutting Performance36
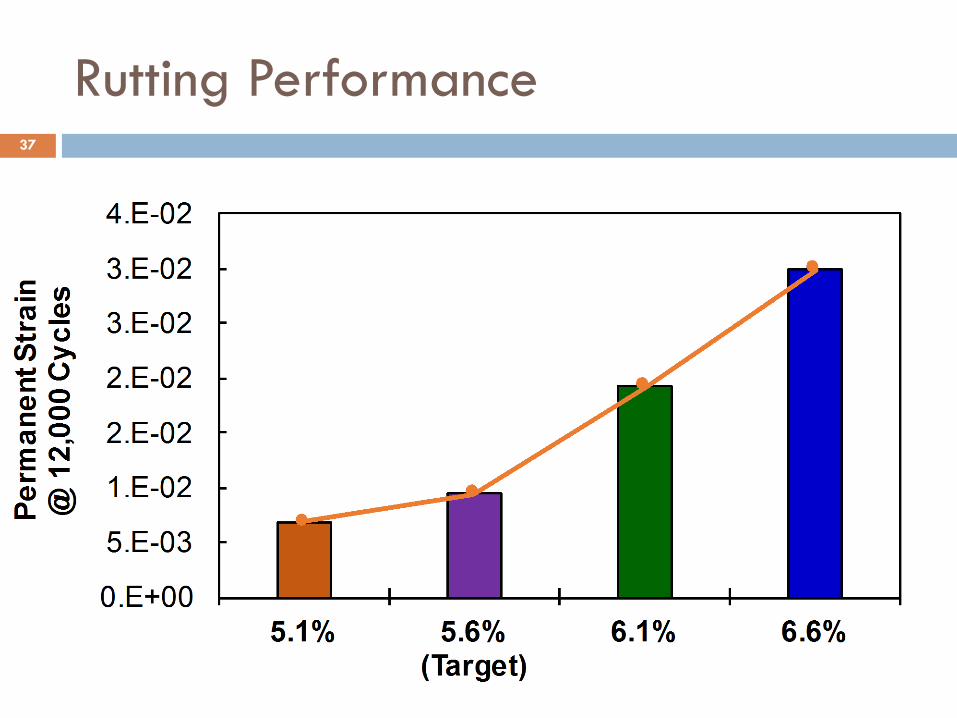
Rutting Performance37
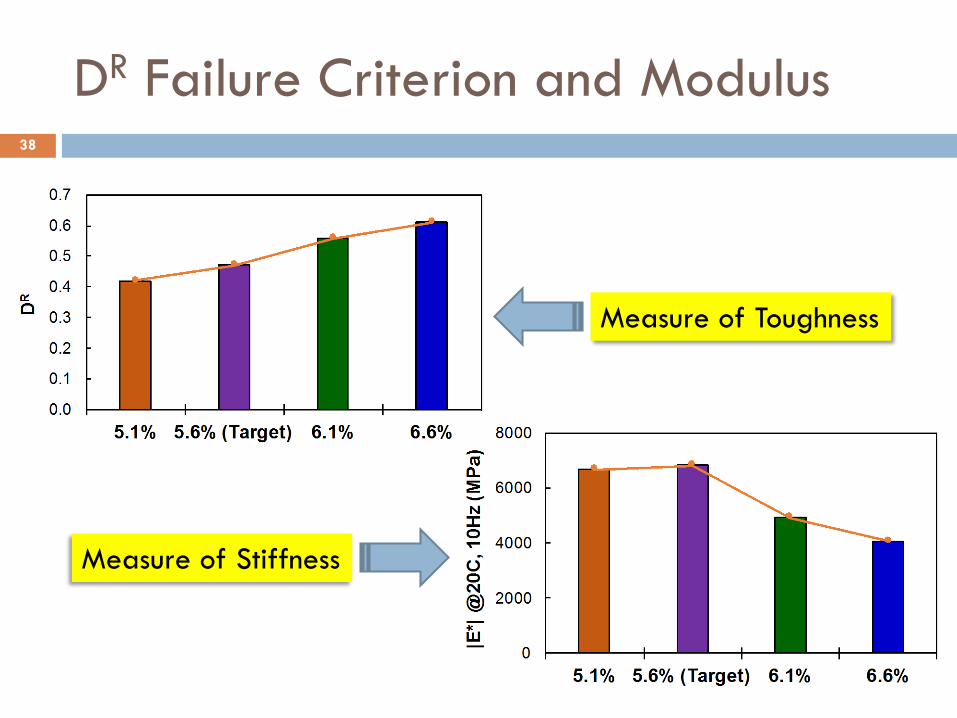
DR Failure Criterion and Modulus38
Measure of Toughness
Measure of Stiffness
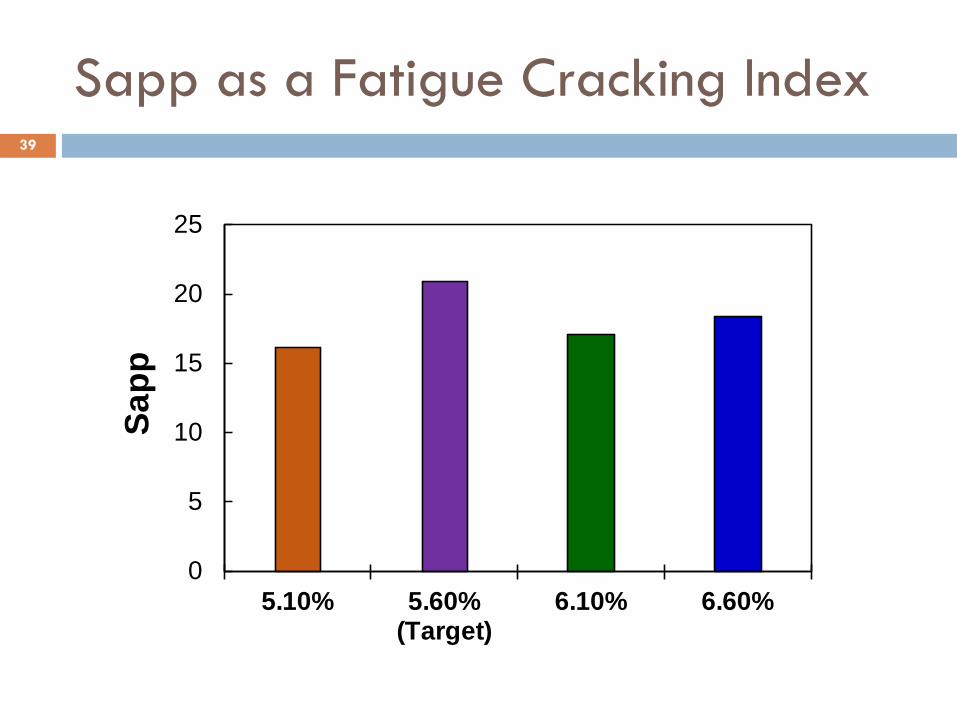
Sapp as a Fatigue Cracking Index39
0
5
10
15
20
25
5.10% 5.60%(Target)
6.10% 6.60%
Sapp
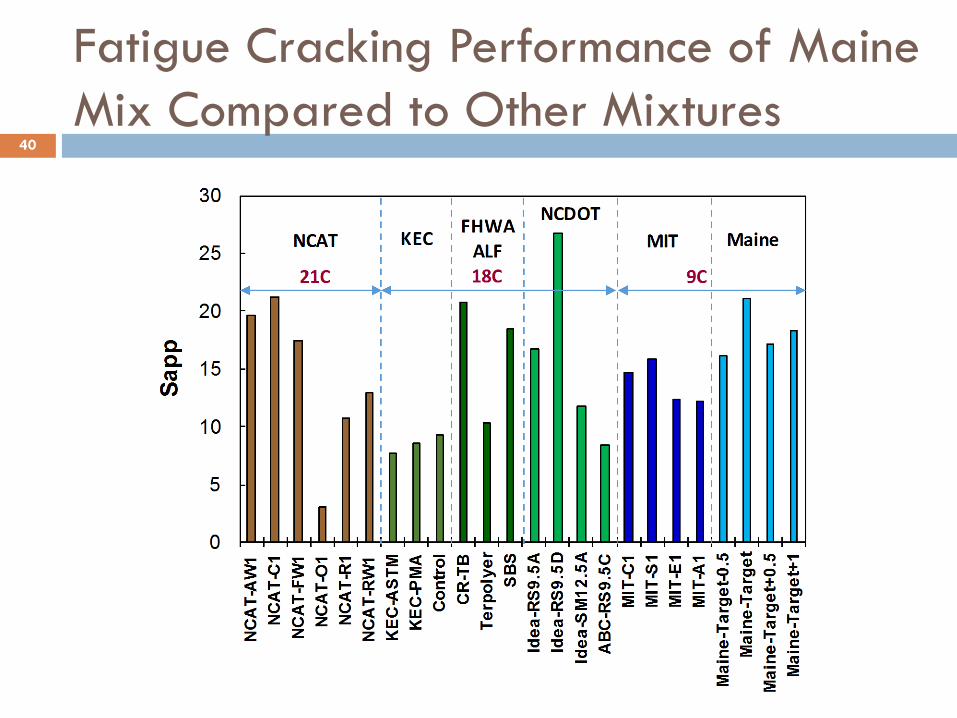
Fatigue Cracking Performance of Maine Mix Compared to Other Mixtures
40
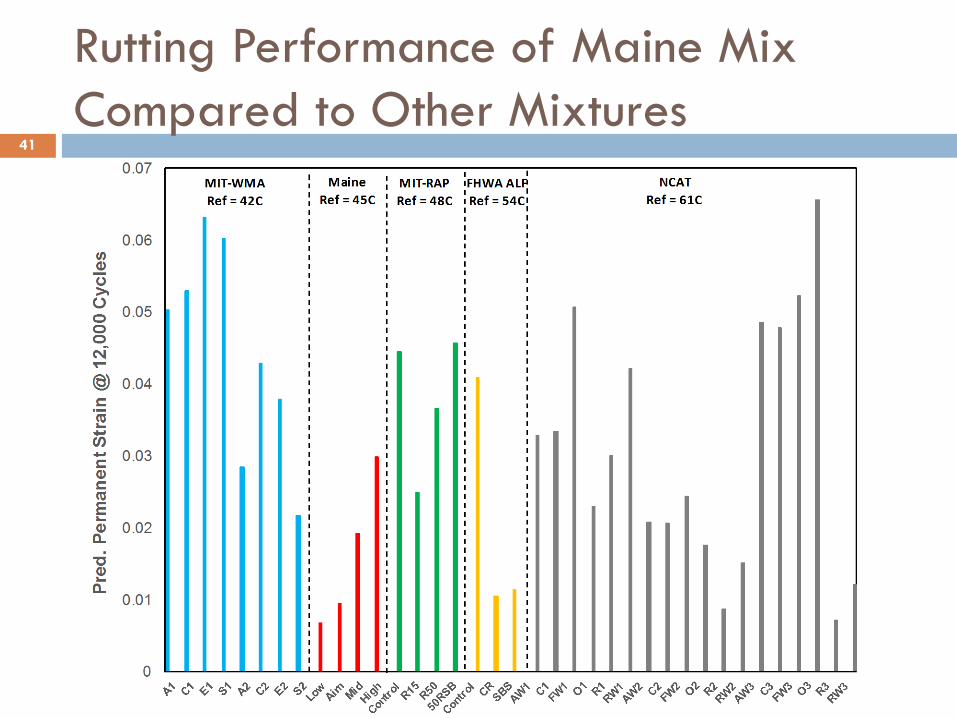
Rutting Performance of Maine Mix Compared to Other Mixtures
41
PEMD Lessons Learned - Overall42
Current mix design aim (5.6% AC) appears to optimize performance (fatigue cracking / rutting)
Data acquired follows logical mix design trends
Testing time for the PEMD approach is rather long, although it can be reduced
Steep learning curve with AMPT testing –although it does enhance fundamental understanding of mixes
AMPT Lessons Learned - Testing43
Cyclic fatigue – Use bearing with top spacer plate for higher success rate. I suspect some of our failed test are due to stresses during bolt-up due to slightly non-parallel ends.
Cyclic fatigue – Allow 1.5hrs once bolted in AMPT to fully climatize prior to running the dynamic modulus fingerprint test (helps prevent unacceptable errors in the Dynamic Modulus Ratio between the dynamic modulus and cyclic fatigue data).
Cyclic fatigue – Be conservative when selecting the on-specimen strain rate, we had to decrease the on-specimen strain levels in order to stop end failures (failures outside the gauge points).
Dynamic Modulus – It isn’t surprising if some of the quality indicators fall slightly outside of the acceptable range, especially at high temp.
Tuning – Take the time at the beginning to work with tuning to get appropriate PID values, defaults were significantly off.
Coring – If your small specimens are coming out slightly ribbed, try decreasing the water pressure feeding the drill.
Equipment – Suggestion to have 6 pairs of cyclic fatigue end plates and 72 Gauge Points (LVDT studs to be able to prepare specimens while climatizing and testing others to maximize efficiency).

AMPT Lessons Learned44
Its all in the details…Sealing of samples after receiptProper storage of samplesSelection of air void contentUse of CoreLok for air void determinationConditioning of samples
Observations to Date
The proficiency test results showed MaineDOT was able to perform the AMPT tests and generate high-quality data.
The test results from the shadow mixes showed the test methods are able to predict the different pavement performance due to changes of AQC parameters.
The performance-volumetric relationship was used to predict the pavement performance based on AQC data.
The preliminary mix design and test confirmed the capacity of the mechanistic models and verified the original volumetric design of the mix.

Any Questions?
Derek Nener-Plante, M.S., PEAsphalt Pavement Engineer
Thank you for the opportunity.46