Use of PI Benchmarking David Webster West Dunbartonshire Council.
12
Use of PI Use of PI Benchmarking Benchmarking David Webster David Webster West Dunbartonshire West Dunbartonshire Council Council
-
Upload
fay-palmer -
Category
Documents
-
view
215 -
download
2
Transcript of Use of PI Benchmarking David Webster West Dunbartonshire Council.

Use of PI Use of PI BenchmarkingBenchmarking
David WebsterDavid WebsterWest Dunbartonshire West Dunbartonshire
CouncilCouncil
Benchmarking PI ChartsBenchmarking PI Charts
Statutory Performance Indicators – Statutory Performance Indicators – example of benchmarking Council example of benchmarking Council tax collection ratestax collection rates
APSE Performance Networks – APSE Performance Networks – examples of benchmarking Grounds examples of benchmarking Grounds MaintenanceMaintenance

Set-up Scorecard for SPIsSet-up Scorecard for SPIs
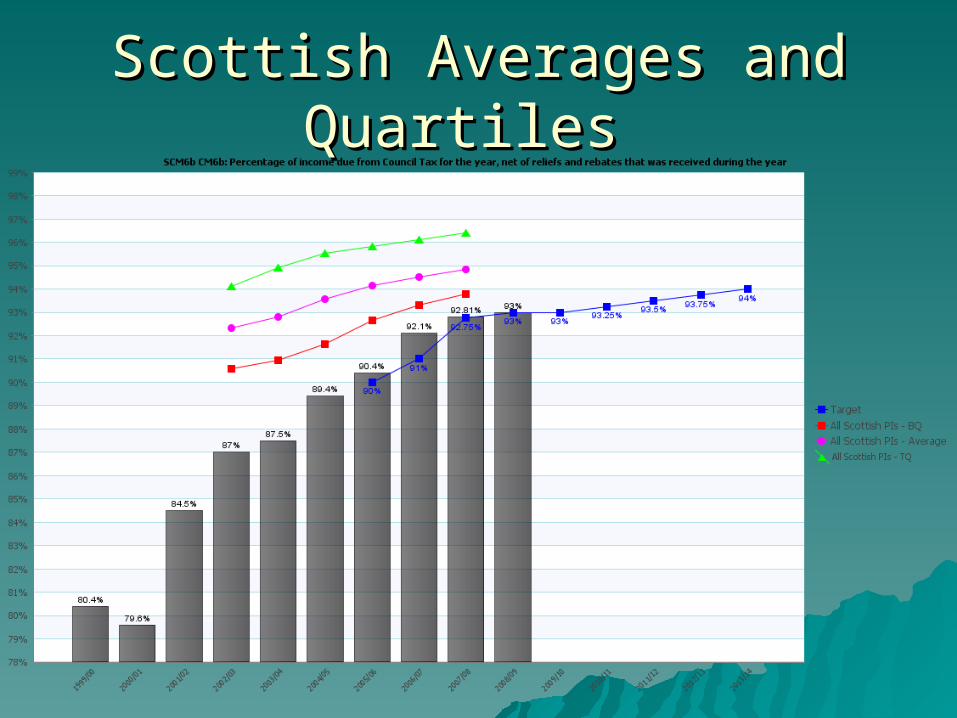
Scottish Averages and Quartiles Scottish Averages and Quartiles
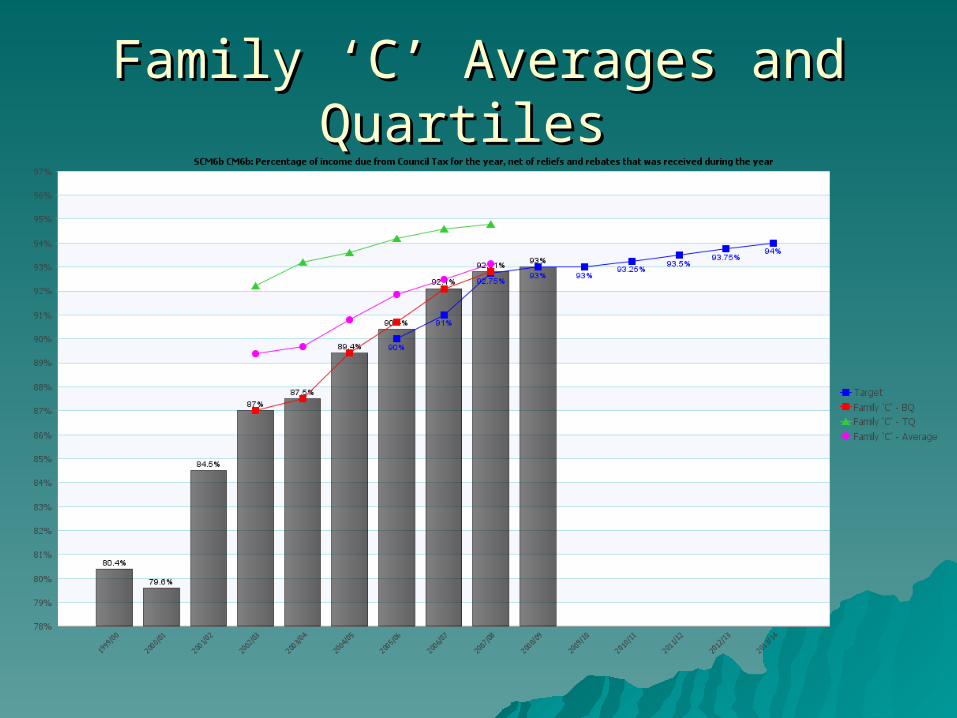
Family ‘C’ Averages and Quartiles Family ‘C’ Averages and Quartiles
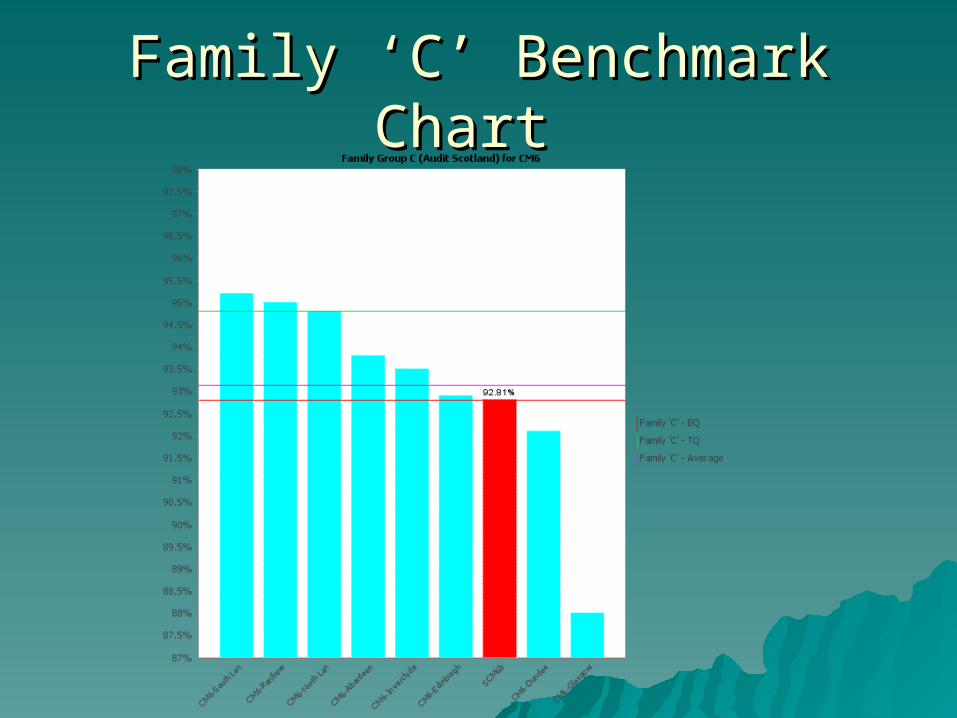
Family ‘C’ Benchmark Chart Family ‘C’ Benchmark Chart

11 years of benchmarking- now in year 1211 years of benchmarking- now in year 12– Performance networks is a mature benchmarking Performance networks is a mature benchmarking
service which allows for effective performance service which allows for effective performance measurement across a range of vitally important front-measurement across a range of vitally important front-line public services with 11 years of performance data line public services with 11 years of performance data available. available.
The largest voluntary local government The largest voluntary local government benchmarking service in the UKbenchmarking service in the UK– Over 200 local authorities from across the U.K. in Over 200 local authorities from across the U.K. in
membership and participation growing across all membership and participation growing across all services, performance networks is the largest voluntary services, performance networks is the largest voluntary performance measurement service for local government performance measurement service for local government providing benchmarking across 15 front-line services. providing benchmarking across 15 front-line services.

Set-up Scorecard for APSE Performance Networks
Divide into themes eg Grounds Maintenance
32 PIs for WDC
Loaded by Covalent from APSE excel sheets

Create benchmark Council PIs
Total of 492 other Council benchmark PIs just for Grounds Maintenance!

WDC data and APSE average WDC data and APSE average
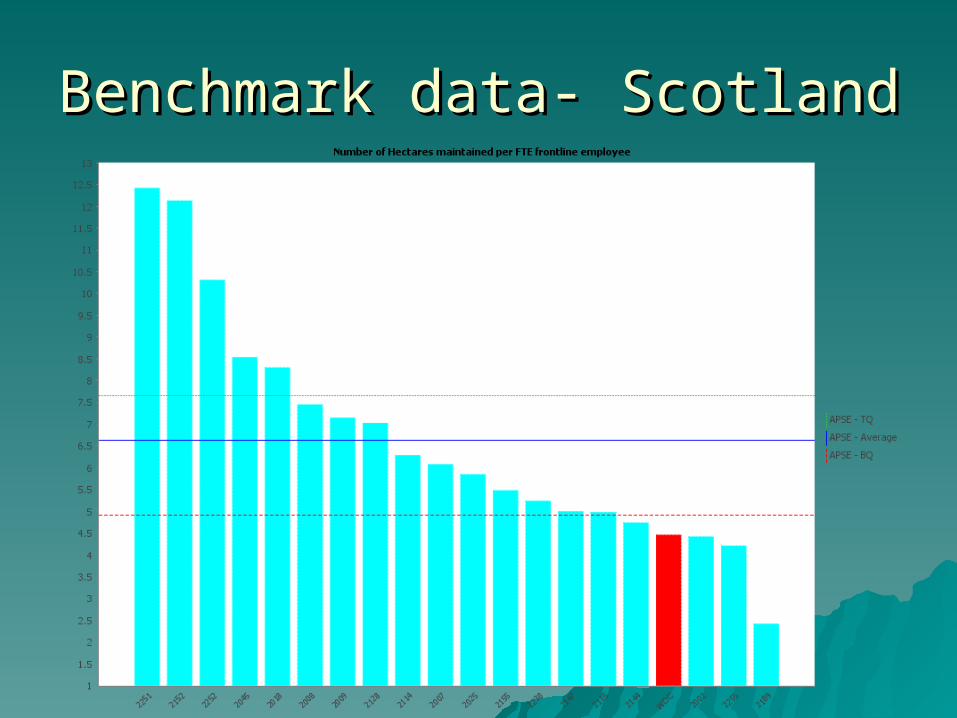
Benchmark data- Scotland Benchmark data- Scotland

Next steps & ImprovementsNext steps & Improvements Rest of APSE data to be loaded – creates a lot of Rest of APSE data to be loaded – creates a lot of
PIs!PIs! Annual data to be loaded – 08/09 soon available. Annual data to be loaded – 08/09 soon available.
Also need to load historical averagesAlso need to load historical averages Improvements to benchmark graphs requiredImprovements to benchmark graphs required
– Need to display more than one benchmark graph per PI , Need to display more than one benchmark graph per PI , e.g. All UK, Scotland and Family Group. Currently can e.g. All UK, Scotland and Family Group. Currently can only do one.only do one.
– Useful to be able to show good performance to right on Useful to be able to show good performance to right on all b/m charts – makes it consistent & simpler to all b/m charts – makes it consistent & simpler to understand for managers!. understand for managers!.
Build indicators into ‘balanced’ service scorecards Build indicators into ‘balanced’ service scorecards with improvement actions as part of drive to with improvement actions as part of drive to demonstrate competitiveness demonstrate competitiveness