Use of PCM Enhanced Insulation in the Building Envelope · Basic Concepts A thin layer of Phase...
36
Use of PCM Enhanced Insulation in the Building Envelope David W. Yarbrough, PhD, PE Jan Kosny, PhD William A. Miller, PhD, PE Building Technology Center Oak Ridge National Laboratory Oak Ridge, Tennessee, USA
Transcript of Use of PCM Enhanced Insulation in the Building Envelope · Basic Concepts A thin layer of Phase...
Use of PCM Enhanced Insulation in the Building Envelope
David W. Yarbrough, PhD, PE Jan Kosny, PhD
William A. Miller, PhD, PE
Building Technology CenterOak Ridge National LaboratoryOak Ridge, Tennessee, USA

Limitations
• Standard method to reduce heat flow is to add R-value.
• Limits have been reached.
• Adding more R-Value is not practical when space is limited.

Basic Concepts
A thin layer of Phase Change Material (PCM) that maintains a constant temperature is used to control the ∆T across a layer of insulation.
The PCM stores and releases heat as the surrounding temperatures change.

PCM CAN BE CONFIGURED TWO WAYS
PCMs can be localized or distributed in an insulation or some other building material.
Exterior temperatures must cycle across the phase change temperature for the PCM to be useful.
Materials for use in a building envelope are selected with a phase change material near the occupied space temperature.
PCMs include organic materials that melt in the temperature range 60 to 90 °F.
Inorganic salt solutions exhibiting large heats of solution or dilution can also be used.
+++++
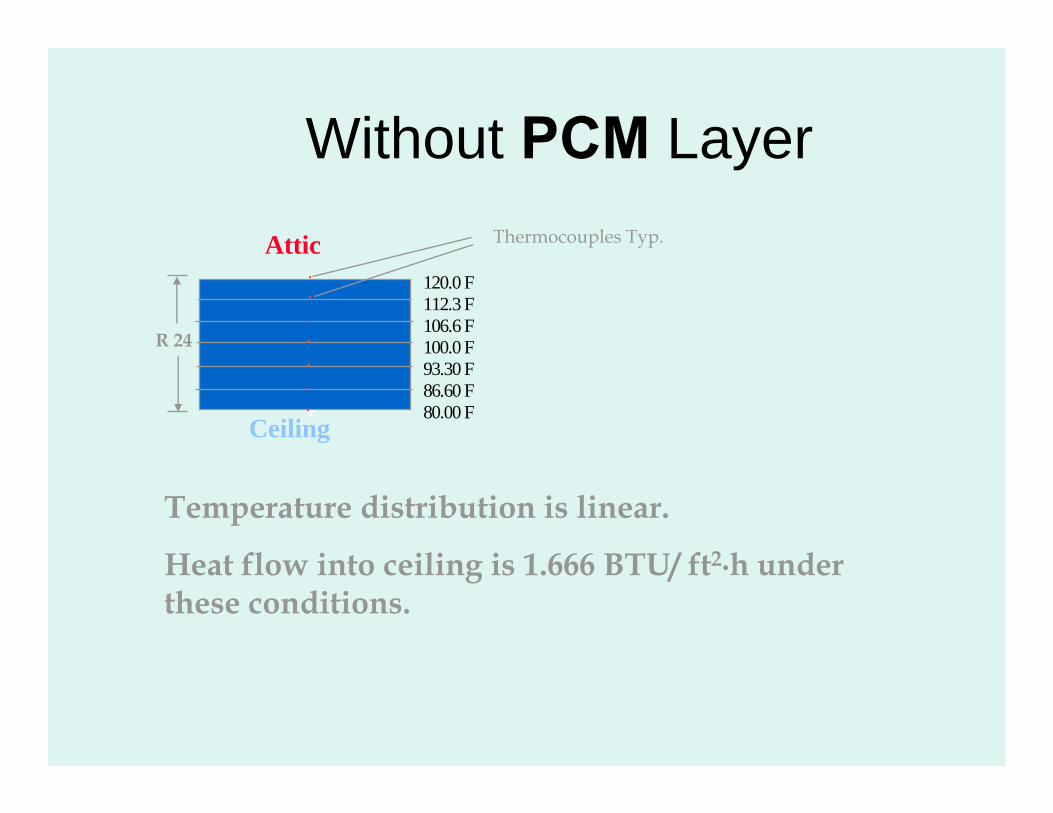
Without PCM Layer
+
Thermocouples Typ.
R 24
120.0 F 112.3 F 106.6 F 100.0 F 93.30 F 86.60 F 80.00 F
Temperature distribution is linear.
Heat flow into ceiling is 1.666 BTU/ ft2·h under these conditions.
Ceiling
Attic
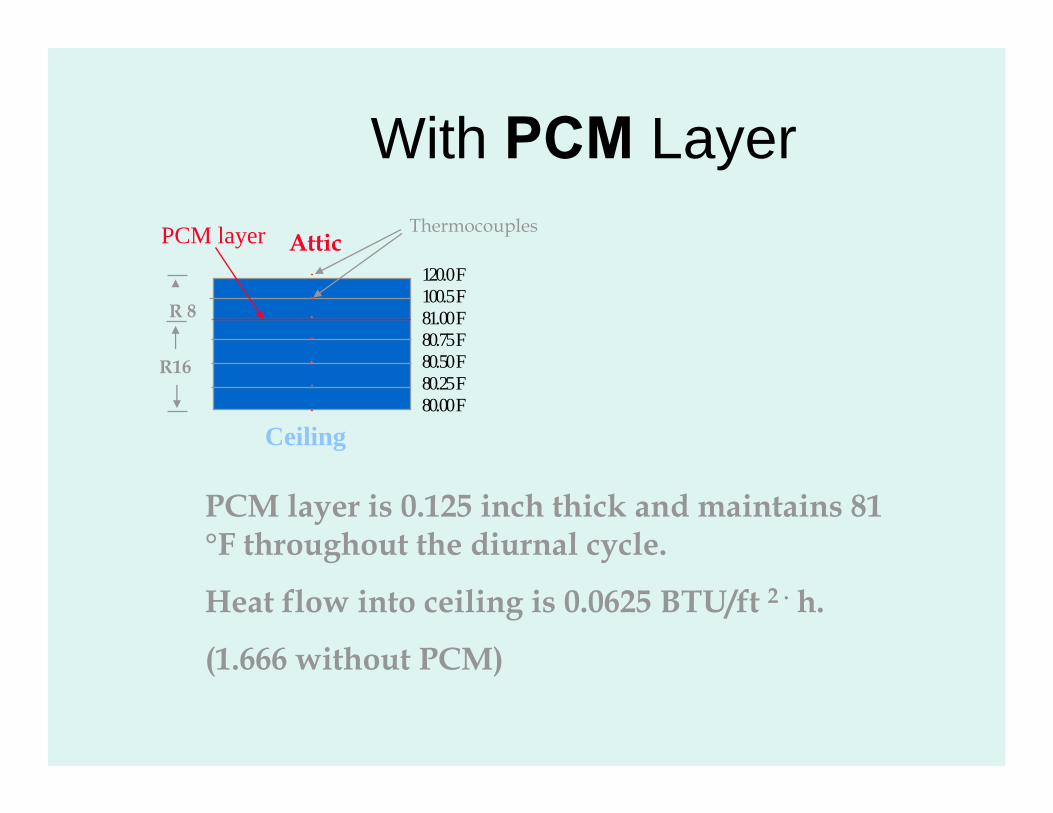
With PCM Layer PCM layer Attic
Thermocouples
120.0 F 100.5 F
R 8 81.00 F 80.75 F 80.50 FR16 80.25 F 80.00 F
Ceiling
PCM layer is 0.125 inch thick and maintains 81 °F throughout the diurnal cycle.
Heat flow into ceiling is 0.0625 BTU/ft 2 · h.
(1.666 without PCM)
Low Space Requirements
• A 0.125 in. thick layer of PCM (0.5 lb) with thermal resistance on both sides will last a complete diurnal cycle.

Test Box
Diurnal
Cycle
Room Temp
1/8 inch PCM Layer
R=6 foam board
R=16 foam board
T3
T1T2
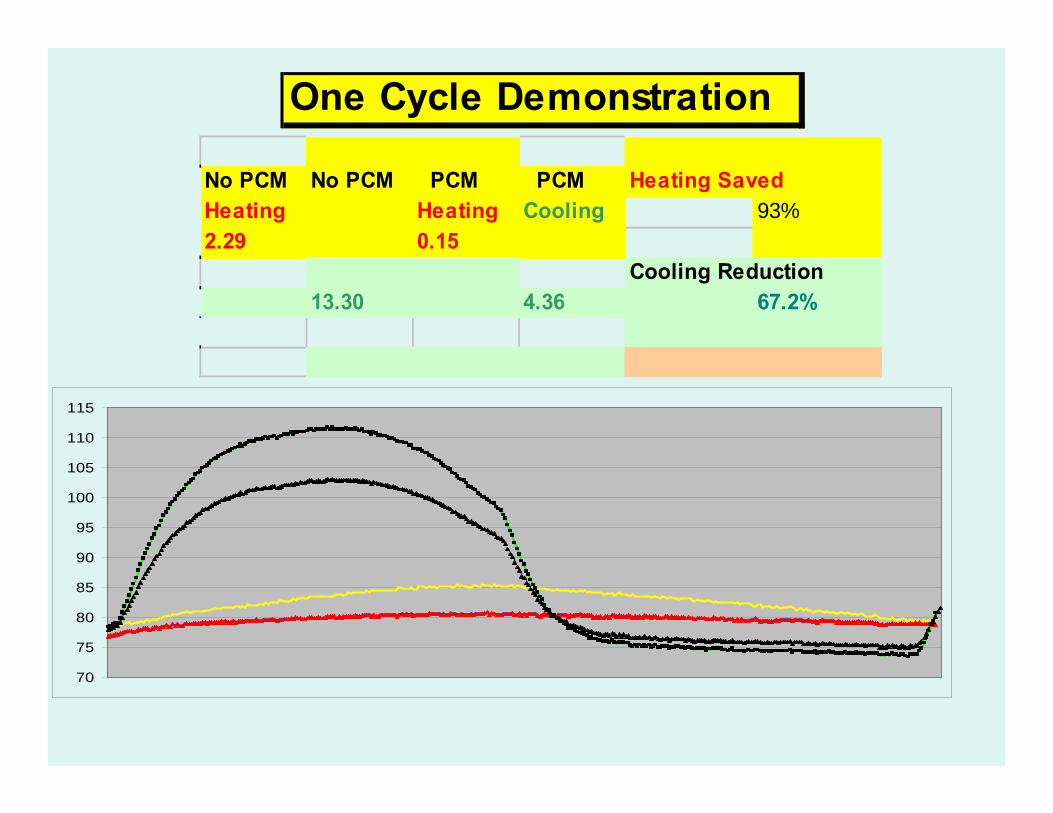
One Cycle Demonstration
No PCM No PCM PCM PCM Heating Saved Heating Heating Cooling 93% 2.29 0.15
Cooling Reduction 13.30 4.36 67.2%
115
110
105
100
95
90
85
80
75
70

0.25 lb of Octadecane per sq. ft.Heating 2.63 63.64%Cooling 5.37 65.04%
Tem
pera
ture
(F)
110
90
70
50 1 49 97 145 193 241 289 337
One 24 Hour Cycle
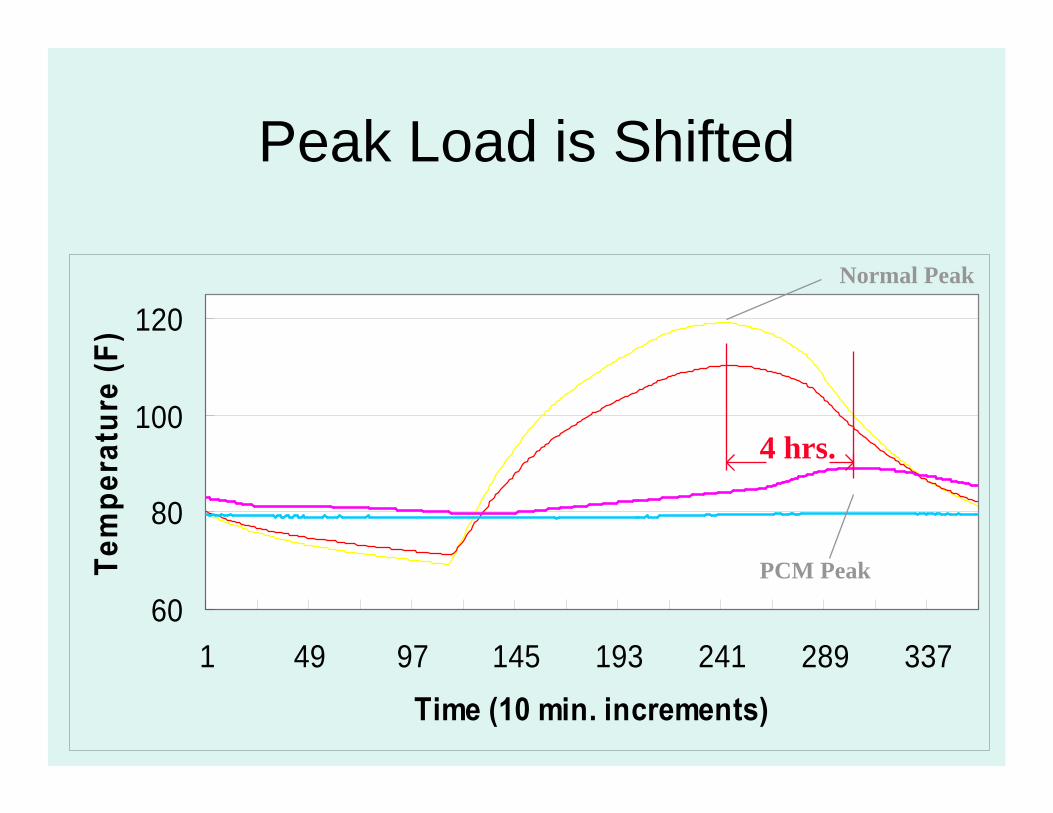
Peak Load is Shifted
60
80
100
120
1 49 97 145 193 241 289 337 Time (10 min. increments)
Tem
pera
ture
(F)
Normal Peak
PCM Peak
4 hrs.

Lower Heat Flow into Building.
• Reduction in heat flow into the conditioned space is demonstrated.
• These examples demonstrate the potential for heating and cooling load reductions.

Observations
1. A thin layer of phase change material can control the T difference across an inner layer of insulation for several hours.
2. The amount of Phase Change Material needed can be minimized by thermally protecting it with a second layer of insulation
3. Optimum amount and position is provided by simulation for a given site and location in the building envelope.
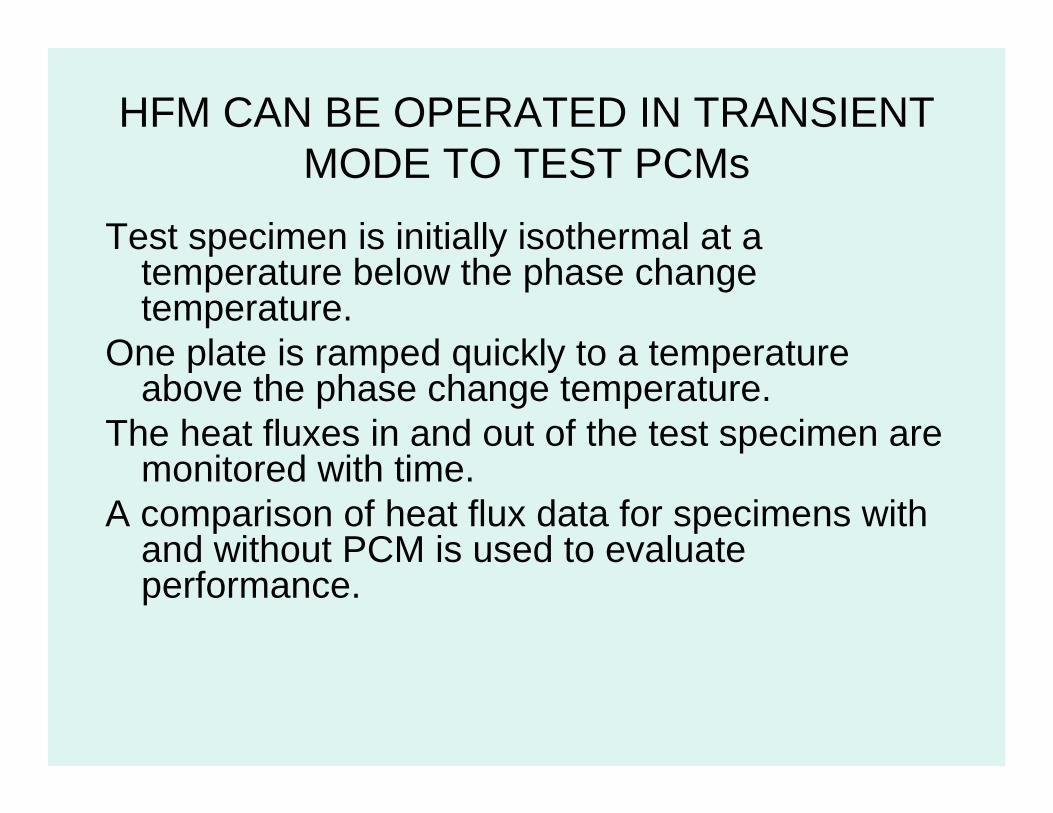
HFM CAN BE OPERATED IN TRANSIENT MODE TO TEST PCMs
Test specimen is initially isothermal at atemperature below the phase changetemperature.
One plate is ramped quickly to a temperatureabove the phase change temperature.
The heat fluxes in and out of the test specimen aremonitored with time.
A comparison of heat flux data for specimens withand without PCM is used to evaluate performance.


Test Configuration
• Top Plate – cold • Top layer of insulation R = 9 ft2·h·°F/Btu
• Layer of PCM • Bottom layer of insulation R=5 ft2·h·°F/Btu
• Bottom Plate – cold ramps to hot • hot ramps to cold
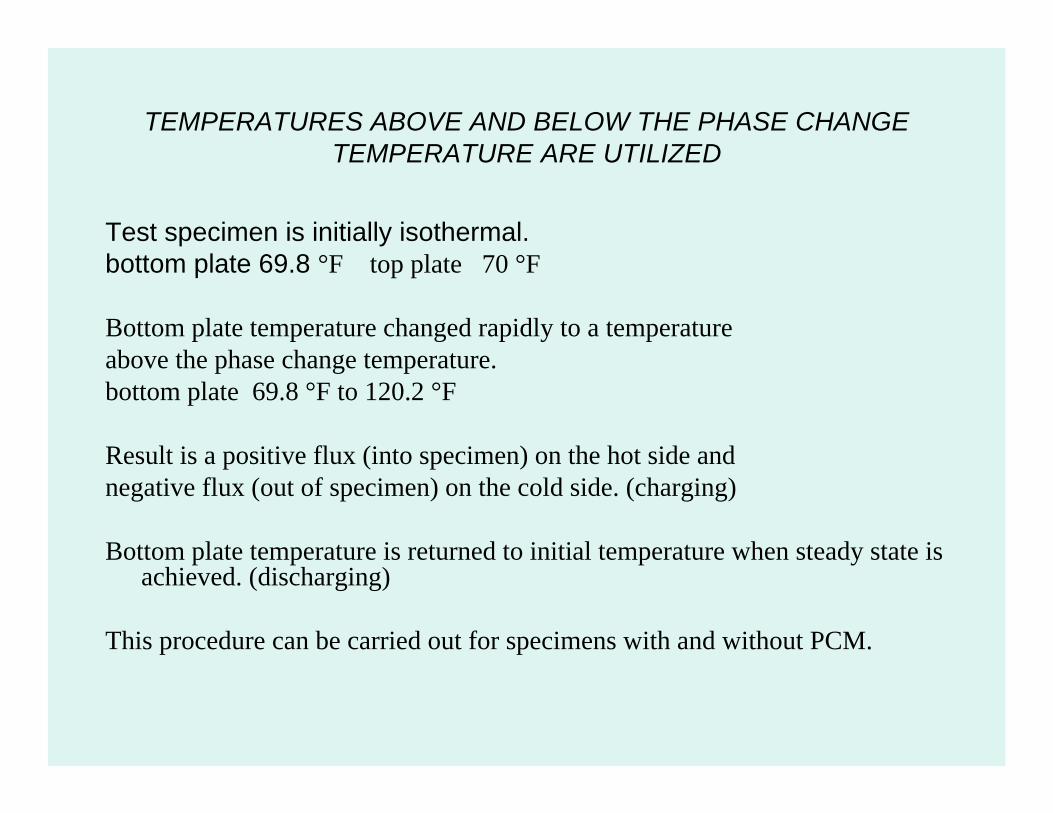
TEMPERATURES ABOVE AND BELOW THE PHASE CHANGE TEMPERATURE ARE UTILIZED
Test specimen is initially isothermal. bottom plate 69.8 °F top plate 70 °F
Bottom plate temperature changed rapidly to a temperature above the phase change temperature. bottom plate 69.8 °F to 120.2 °F
Result is a positive flux (into specimen) on the hot side and negative flux (out of specimen) on the cold side. (charging)
Bottom plate temperature is returned to initial temperature when steady state is achieved. (discharging)
This procedure can be carried out for specimens with and without PCM.
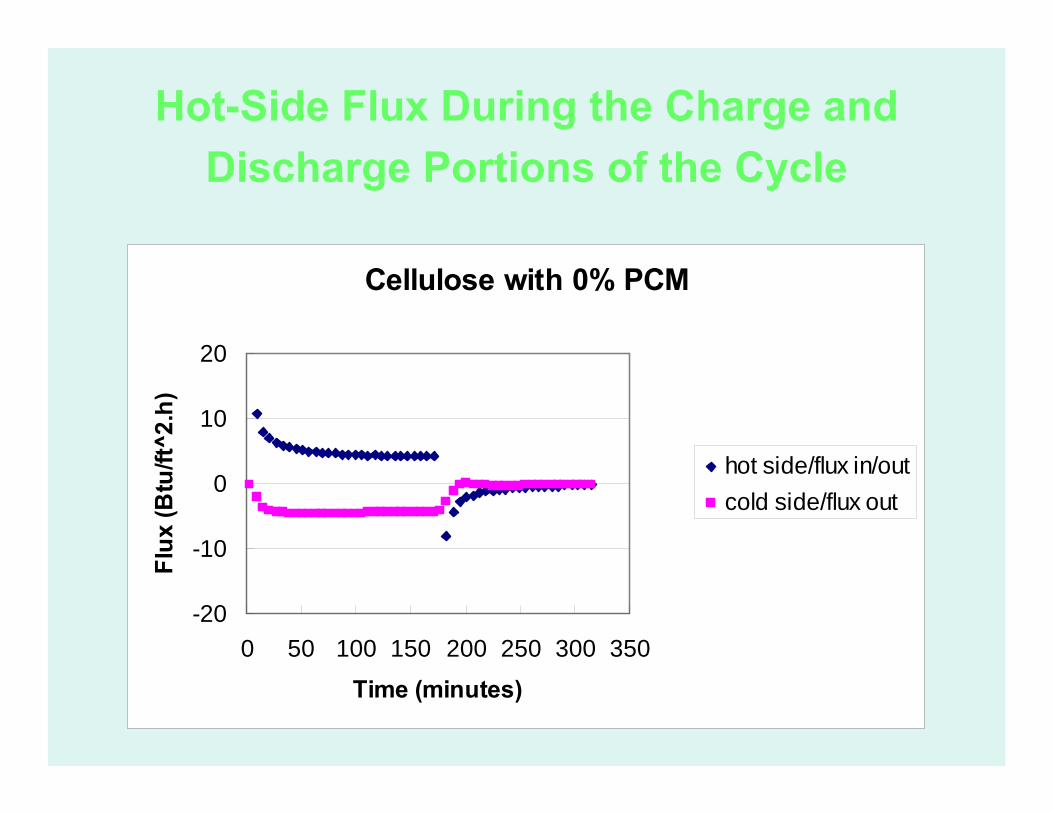
Hot-Side Flux During the Charge and Discharge Portions of the Cycle
Cellulose with 0% PCM
-20
-10
0
10
20
0 50 100 150 200 250 300 350
Time (minutes)
Flux
(Btu
/ft^2
.h)
hot side/flux in/out cold side/flux out

Hot-Side Flux During the Charge and Discharge Portions of the Cycle for Cellulose with 30 wt% PCM

Comparison of the “Charging” of Cellulose Insulation Materials with and
without PCM
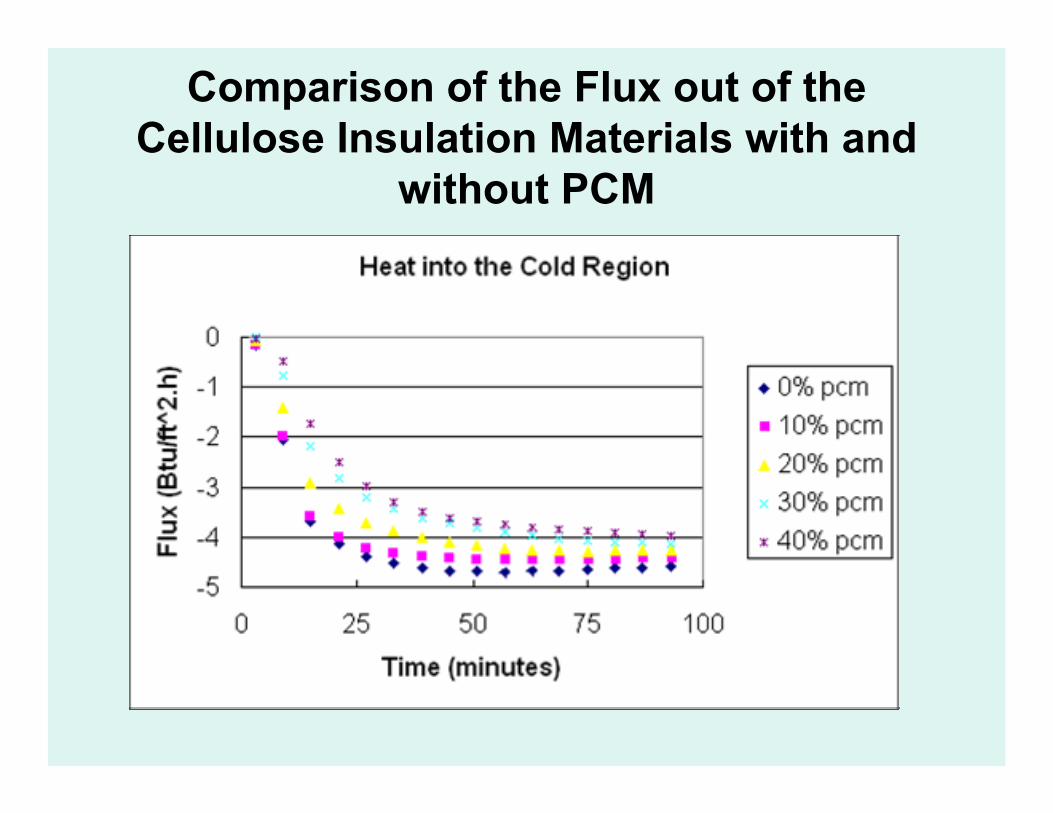
Comparison of the Flux out of the Cellulose Insulation Materials with and
without PCM
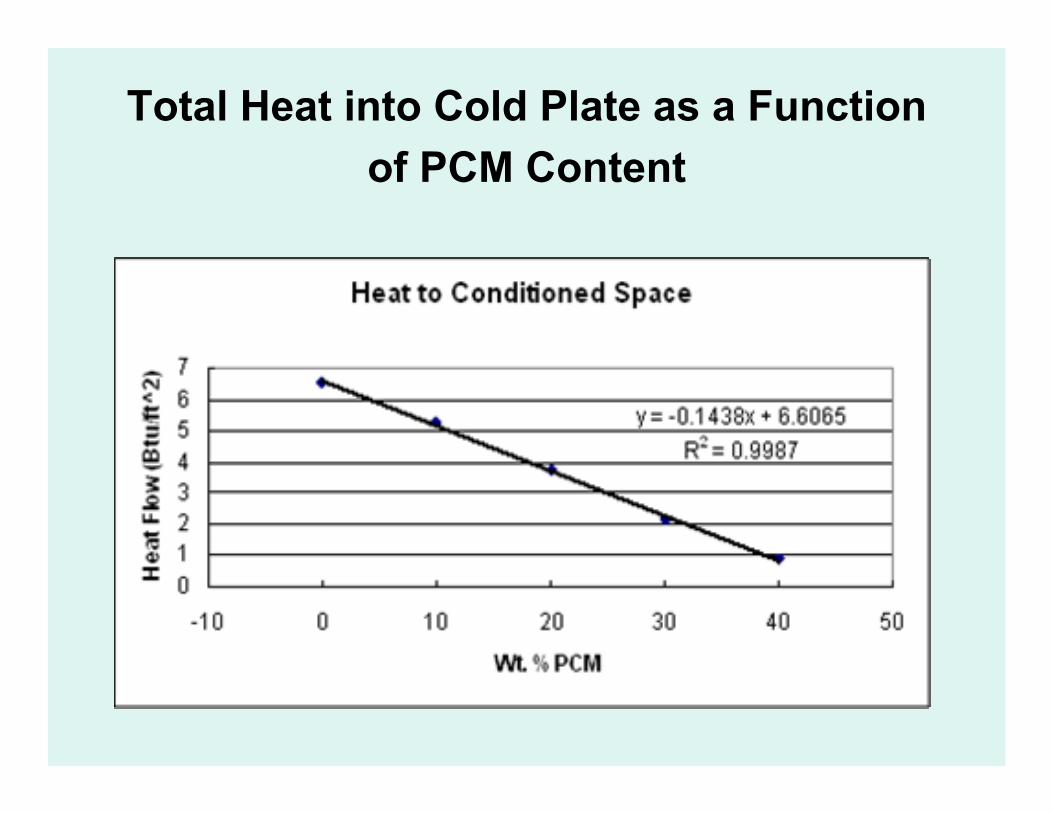
Total Heat into Cold Plate as a Function of PCM Content
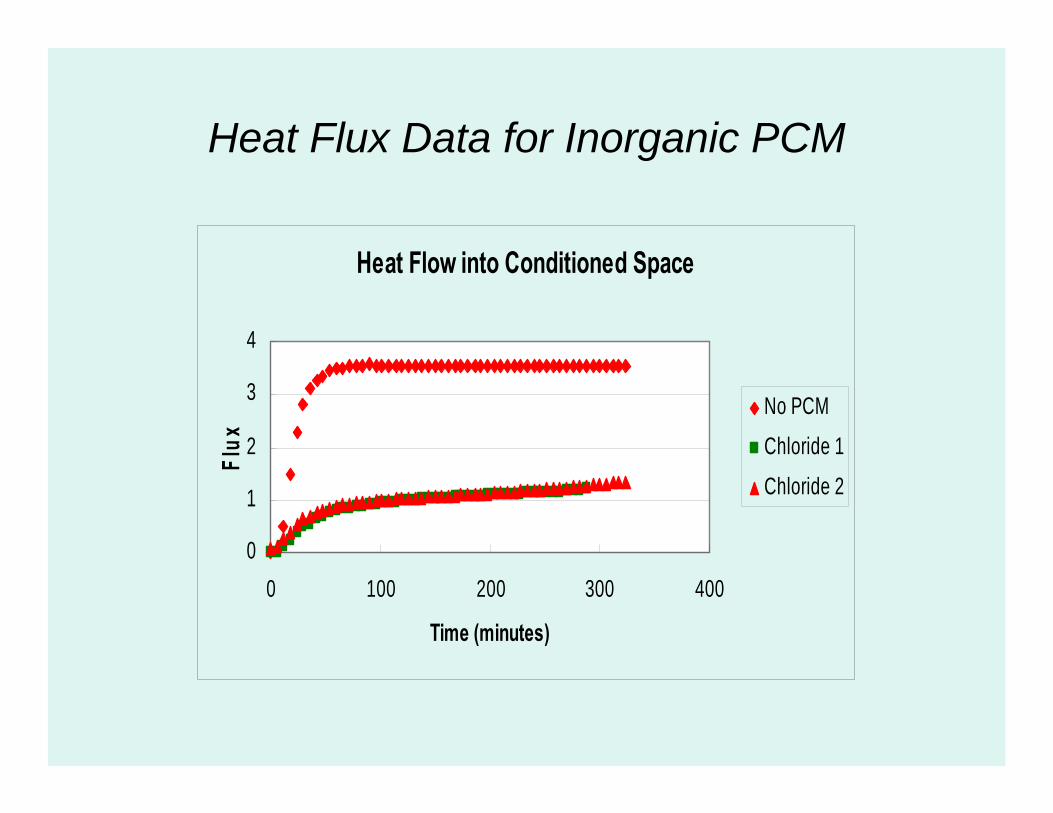
Heat Flux Data for Inorganic PCM
Heat Flow into Conditioned Space
0
1
2
3
4
0 100 200 300 400
Time (minutes)
Flux
No PCM
Chloride 1
Chloride 2
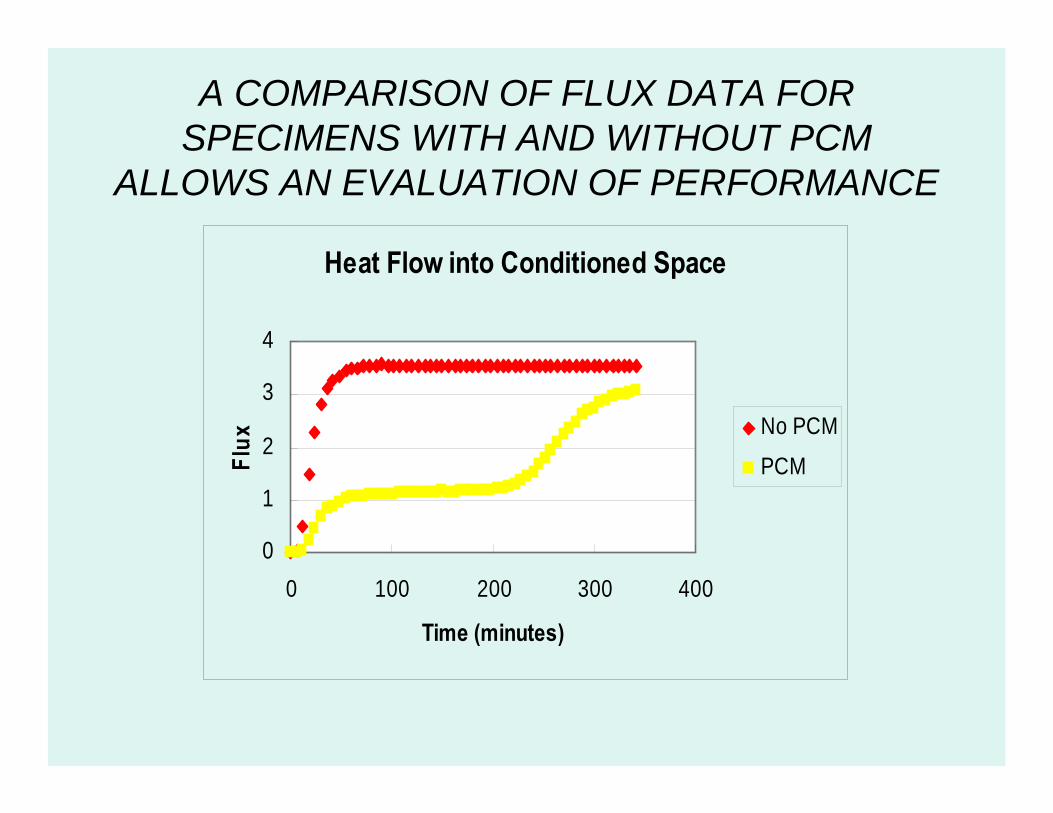
A COMPARISON OF FLUX DATA FOR SPECIMENS WITH AND WITHOUT PCM
ALLOWS AN EVALUATION OF PERFORMANCE
Heat Flow into Conditioned Space
0
1
2
3
4
0 100 200 300 400
Time (minutes)
Flux No PCM
PCM

HFM CAN BE USED TO MONITOR HEAT FLUX FOR INSULATION WITHOUT PCM
Transient Heat Flow Meter Test flux into specimen is positive
-10
-5
0
5
10
0 36 72 108 144 180 216
Time (minutes)
Hea
t Flu
x
Hot Side Cold Side

Total Heat Discharged to Hot Plate as a Function of PCM Content

Wall Containing Cellulose-PCM Blend have been Tested in a Hot-Box (C 1363)
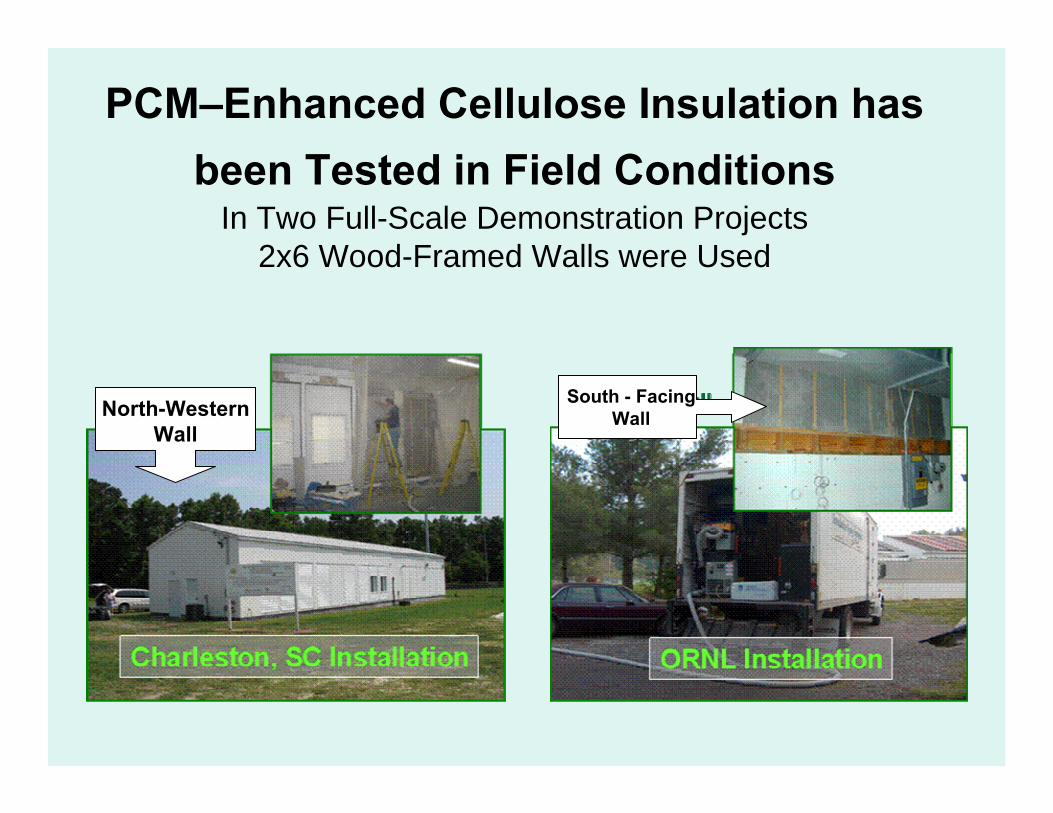
PCM–Enhanced Cellulose Insulation has been Tested in Field Conditions
In Two Full-Scale Demonstration Projects 2x6 Wood-Framed Walls were Used
North-Western Wall
South - Facing Wall
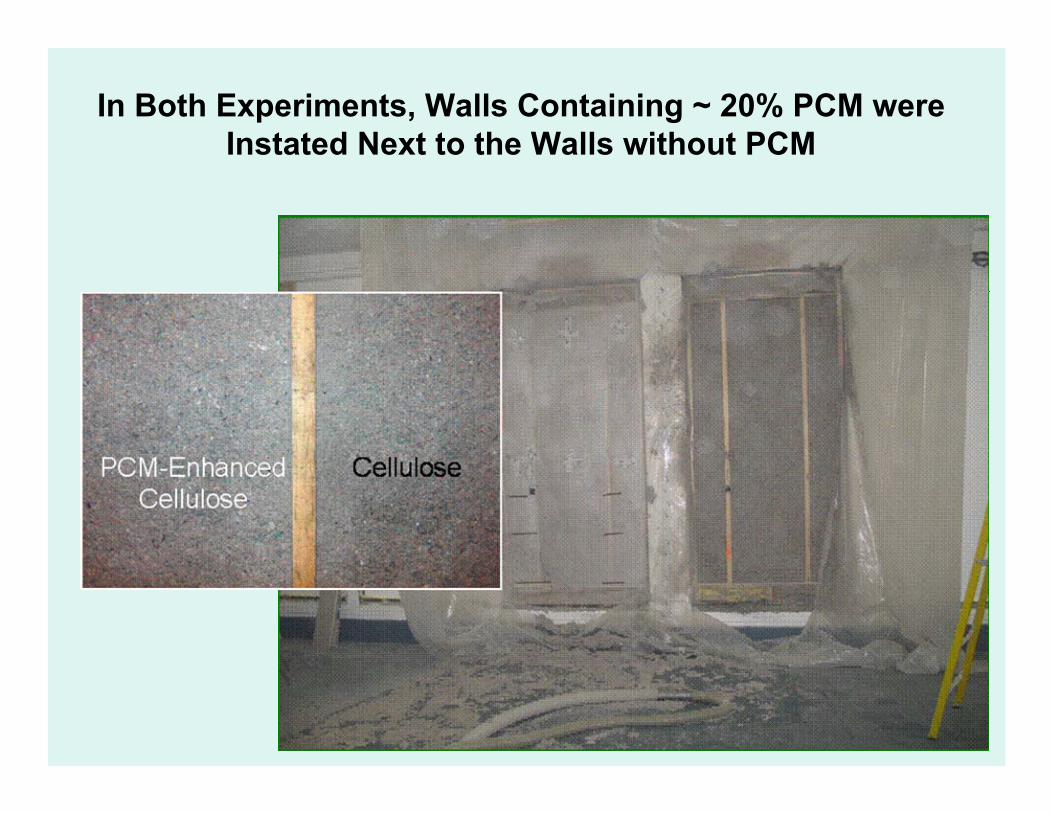
In Both Experiments, Walls Containing ~ 20% PCM were Instated Next to the Walls without PCM
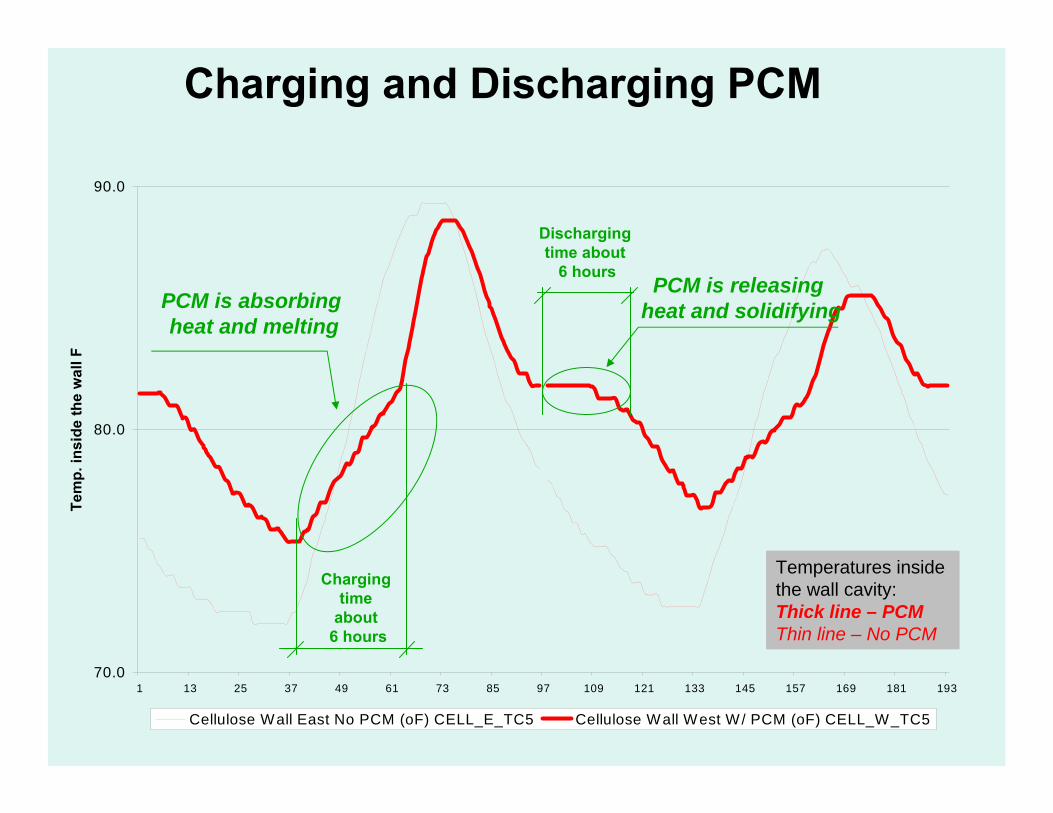
Charging and Discharging PCM
70.0
80.0
90.0
1 13 25 37 49 61 73 85 97 109 121 133 145 157 169 181 193
Tem
p. in
side
the
wal
l F
Cellulose W all East No PCM (oF) CELL_E_TC5 Cellulose W all West W / PCM (oF) CELL_W_TC5
Charging time
about 6 hours
Discharging time about
6 hours
Temperatures inside the wall cavity: Thick line – PCM Thin line – No PCM
PCM is absorbing heat and melting
PCM is releasing heat and solidifying

Btu
/hft2
Significant Difference in Energy Performance was Observed
Example of Heat Flux Measurements
2 Heating Load • PCM wall is 1.5 significantly
more thermally1 stable than the
other wall 0.5
• Peak-hour heat 0 flux reduction by1 49 97 145 193 241 289 337 385 433 481 529 577 625 673
at least 1/3 in-0.5
PCM wall PCM wall -1 • Significantly
lower heat flux-1.5
amplitude in -2 PCM wall
No PCM wall • ~2 hours -2.5
shifting of the -3 Cooling Load One week of data peak-hour load
time [h/4] Sunny days by PCM wallCool nights

Potential 40% Cooling Load Savings for 40 oF Temperature Excitation
2006 ORNL Dynamic Hot-box testing of 2x6 Wall with PCM-Enhanced Cellulose Insulation (22% PCM)
42.00%
27.00%
19.00%
0
0.1
0.2
0.3
0.4
0.5
Sur
face
Loa
dR
educ
tion
[%
]
First 5 hours First 10 hours All 15 hours
Cellulose fiber
Cluster of PCM pellets
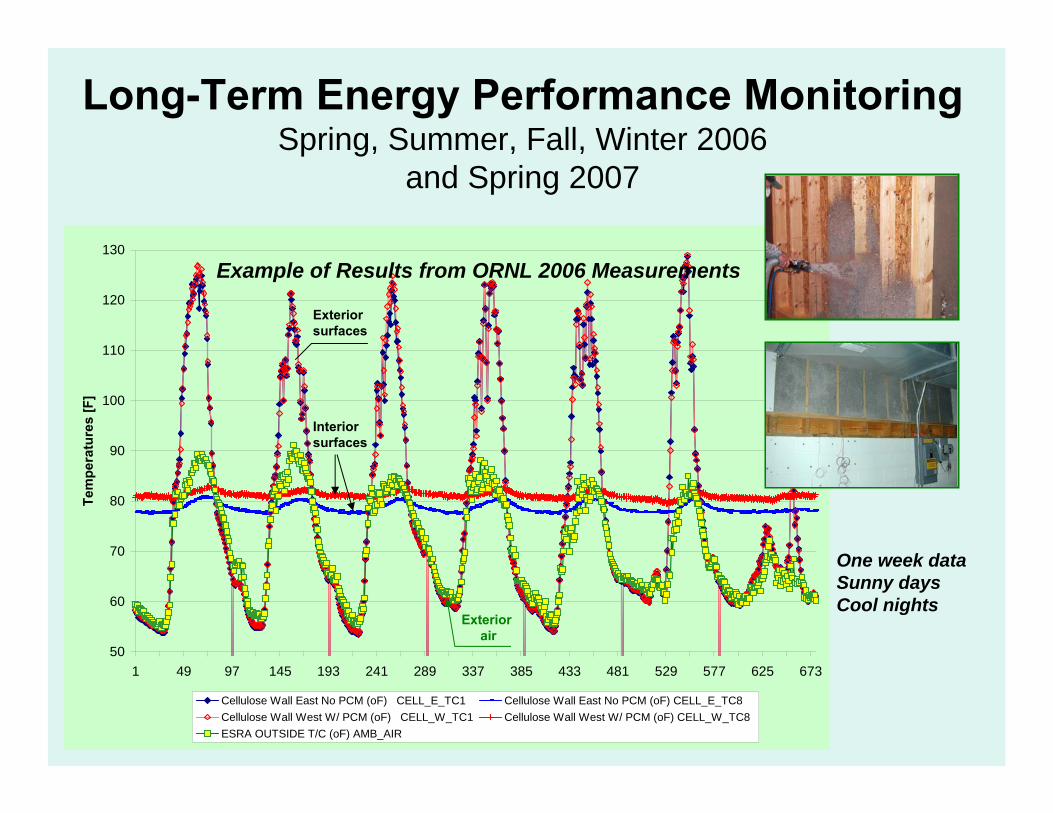
Long-Term Energy Performance MonitoringTe
mpe
ratu
res
[F]
Spring, Summer, Fall, Winter 2006 and Spring 2007
130
Example of Results from ORNL 2006 Measurements 120
Exterior surfaces
110
100
Interiorsurfaces90
80
70 One week data Sunny days
60 Cool nightsExterior
air 50
1 49 97 145 193 241 289 337 385 433 481 529 577 625 673
Cellulose Wall East No PCM (oF) CELL_E_TC1 Cellulose Wall East No PCM (oF) CELL_E_TC8 Cellulose Wall West W/ PCM (oF) CELL_W_TC1 Cellulose Wall West W/ PCM (oF) CELL_W_TC8 ESRA OUTSIDE T/C (oF) AMB_AIR

Tem
p. in
side
the
wal
l F
PCM-Enhanced Cellulose in Test Walls100.0
• PCM stabilizes the core of the wall by its heat storage capacity
90.0 • Warming and cooling 85 oF PC action down of the core in the
PCM wall is significantly slower
80.0 78 oF • Peak-hour temperature excitation is shifted in PCM wall
• Significantly lower Temperatures inside temperature
70.0 the wall cavities: amplitudes can be Thick lines – PCM observed in PCM wall Thin lines – No PCM cavities
60.0 1 13 25 37 49 61 73 85 97 109 121 133 145 157 169 181 193
Cellulose Wall East No PCM (oF) CELL_E_TC3 Cellulose Wall East No PCM (oF) CELL_E_TC4 Cellulose Wall East No PCM (oF) CELL_E_TC5 Cellulose Wall West W/ PCM (oF) CELL_W_TC3 Cellulose Wall West W/ PCM (oF) CELL_W_TC4 Cellulose Wall West W/ PCM (oF) CELL_W_TC5

% Cooling Load Reductions
0
10
20
30
40
50
60
70
80
90
100
0 5 10 15 20 25 30 35 40
Weeks
April Jan.Dec.Nov.Oct.Sept.AugustJuly June May
Cooling-dominated loads
Average ~42%

Summary
• Several applications of microencapsulated organic PCMs were tested.
• Applications with localized PCM have been tested. • Laboratory and field work demonstrated good
performance of PCM-enhanced insulation– Thermal conductivity of the PCM-enhanced cellulose was not
increased by the addition of PCM microcapsules – Cellulose wall with dispersed PCM demonstrated potential for
over 40% reduction of the peak thermal load during 5 hourthermal ramp
• Field tests confirmed hot-box test data on cooling load reduction potential of PCM-enhanced cellulose
• Field tests demonstrated potential for application of PCMs in mixed and heating-dominated climates forreduction of heating loads