
Build a Responsive WordPress Theme With ZURBs Foundation 5 Framework


Use of Paradata in a Responsive Design Framework
to Manage a Field Data Collection
James Lepkowski, William Axinn, Nicole Kirgis, Brady T. West, Shonda Kruger Ndiaye
University of Michigan, USA
William Mosher US National Center for Health Statistics
Robert M. Groves University of Michigan
NSFG Survey Methodology Working Papers, No. 10- 012
June 2010
Use of Paradata in a Responsive Design Framework to Manage a Field Data Collection 2
ABSTRACT Every household survey confronts uncertainty in the performance of its recruitment protocol. Diverse modern populations present the data collecting organization with a myriad of practical problems of contacting household units, identifying the proper respondents, gaining their cooperation, and finding appropriate times to interview them. Responsive survey designs (Groves and Heeringa, 2006) use paradata to monitor costs and response rate features of a survey during data collection and actively intervene into the recruitment protocol to effect changes in the production process of interviews. When the paradata are informative about costs and potential error properties of the key estimates to be computed from the survey, responsive designs have the potential to improve the quality-per-unit-cost properties of a survey. This paper uses a simple production model articulating inputs to the data collection, the quality of the sample cases available, and the costs and data records produced. This model motivates a set of paradata that might be useful in managing a survey. The paper presents three examples of management interventions based on paradata collected throughout the Continuous National Survey of Family Growth (NSFG), and evaluates the effectiveness of these interventions.
Use of Paradata in a Responsive Design Framework to Manage a Field Data Collection 3
1. INTRODUCTION Survey data collection is fraught with uncertainty. Some sample frames used have unknown eligibility (e.g., address frames contain some unknown number of unoccupied housing units). Interviewers are not generally knowledgeable about the times of the days and days of the week that households are at home. The likelihood of obtaining consent to be interviewed cannot be predicted well. Unfortunately, each of these uncertainties implies lack of control over the cost and timeliness of data collection. If there were no time or cost constraints of survey data collection, these uncertainties would pose no large problems. However, survey researchers always work under those two constraints. These constraints and uncertainties like those mentioned above combine to challenge wise expenditures of time and costs. One implication is that complete specification of the survey design prior to the data collection is unlikely to be optimal (it, perforce, is completed prior to exposure to the uncertainties). If one assumes a beneficial realization of the various uncertainties, overruns of time or costs are the key risk. If one assumes a perverse realization of the various uncertainties, smaller samples of respondent cases are the risk. Most survey design texts assume that design features are fixed prior to the initiation of data collection. These include sample design, sample size, length of data collection period, number of interviewer hours, travel costs, and, sometimes, number of calls to cases prior to the first contact, number of contacts, type and level of calling following a sample person expressing some reluctance to participate. In the presence of the uncertainties reviewed above, some of these might be candidates for mid-data collection alteration. The argument above is the basis of the use of “responsive designs,” which alter the data collection protocol based on paradata collected during the data collection period (Groves and Heeringa, 2006). By way of definition, responsive survey designs:
a. pre-identify a set of design features potentially affecting costs and errors of survey statistics;
b. identify a set of indicators of the cost and error properties of those features; c. monitor those indicators in initial phases of data collection; d. alter the active features of the survey in subsequent phases based on cost/error
tradeoff decision rules; and e. combine data from the separate design phases into a single estimator.

Use of Paradata in a Responsive Design Framework to Manage a Field Data Collection 4
In some sense, “responsive design” notions have been part of good survey data collection practice for decades. However, little of this is documented in the literature, and there was no existing conceptual framework for this prior to that provided by Groves and Herringa. A potentially valuable tool for responsive design is paradata -- process and administrative data that are produced auxiliary to the survey data collection (Couper, 1998). With computer-assisted data collections, the software that captures the data can also capture interviewer observations, attributes of call attempts on sample cases, the nature of the interaction with the household members, and behaviors during the interview measurement itself (e.g., timing of question administration, digital audio recording of voices of interviewers and respondents). This paper reviews a set of paradata that have been monitored to assess the performance of a face-to-face survey data collection. It describes a conceptual framework, illustrates monitoring tools, and evaluates three interventions which were designed to alter data collection in a fashion judged desirable by survey managers.
2. A CONCEPTUAL FRAMEWORK FOR PARADATA MONITORING We use a total survey error and cost paradigm to motivate the paradata design. In this paradigm, given the current pressures on US survey research, the focus is on response rates, nonresponse error on key statistics, and costs of interviews. This focus is applied in the context of an ongoing cross-sectional, multistage area probability sample of households, the Continuous National Survey of Family Growth (NSFG). In each sample household, interviewers complete a screening interview by collecting a roster of household members. One person aged 15-44 is selected at random from those who are age-eligible within the household. The interviewer then seeks a 60-80 minute interview from that person. The CAPI questionnaire contains questions on sexual and fertility experiences of the respondent. More sensitive items (e.g., involving risk behaviors for HIV) are administered using ACASI. Each year of the NSFG consists of four replicate samples, introduced at the beginning of each quarter. The full data collection period lasts 48 weeks, with four weeks stoppage for end-of-year holidays and training of new interviewers. The new interviewers are introduced as part of a rotation of the sample primary sampling units (PSUs) across non-self-representing areas each year. At any one point the sample consists of 25 nonself-representing areas and 8 self-representing areas, with about 38 interviewers working. The American Community Survey (ACS) uses a similar continuous measurement design to produce timely, frequent, and high-
Use of Paradata in a Responsive Design Framework to Manage a Field Data Collection 5
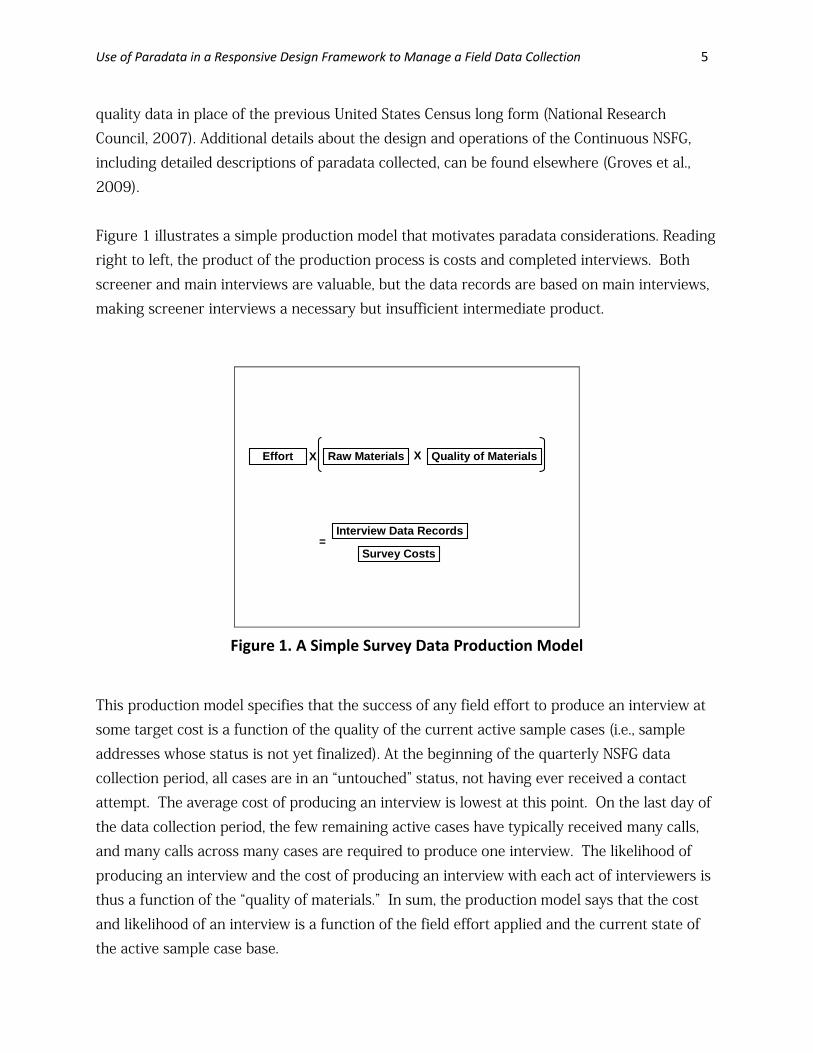
quality data in place of the previous United States Census long form (National Research Council, 2007). Additional details about the design and operations of the Continuous NSFG, including detailed descriptions of paradata collected, can be found elsewhere (Groves et al., 2009). Figure 1 illustrates a simple production model that motivates paradata considerations. Reading right to left, the product of the production process is costs and completed interviews. Both screener and main interviews are valuable, but the data records are based on main interviews, making screener interviews a necessary but insufficient intermediate product.
Effort X Raw Materials Quality of MaterialsX
=Interview Data Records
Survey Costs
Figure 1. A Simple Survey Data Production Model
This production model specifies that the success of any field effort to produce an interview at some target cost is a function of the quality of the current active sample cases (i.e., sample addresses whose status is not yet finalized). At the beginning of the quarterly NSFG data collection period, all cases are in an “untouched” status, not having ever received a contact attempt. The average cost of producing an interview is lowest at this point. On the last day of the data collection period, the few remaining active cases have typically received many calls, and many calls across many cases are required to produce one interview. The likelihood of producing an interview and the cost of producing an interview with each act of interviewers is thus a function of the “quality of materials.” In sum, the production model says that the cost and likelihood of an interview is a function of the field effort applied and the current state of the active sample case base.
Use of Paradata in a Responsive Design Framework to Manage a Field Data Collection 6
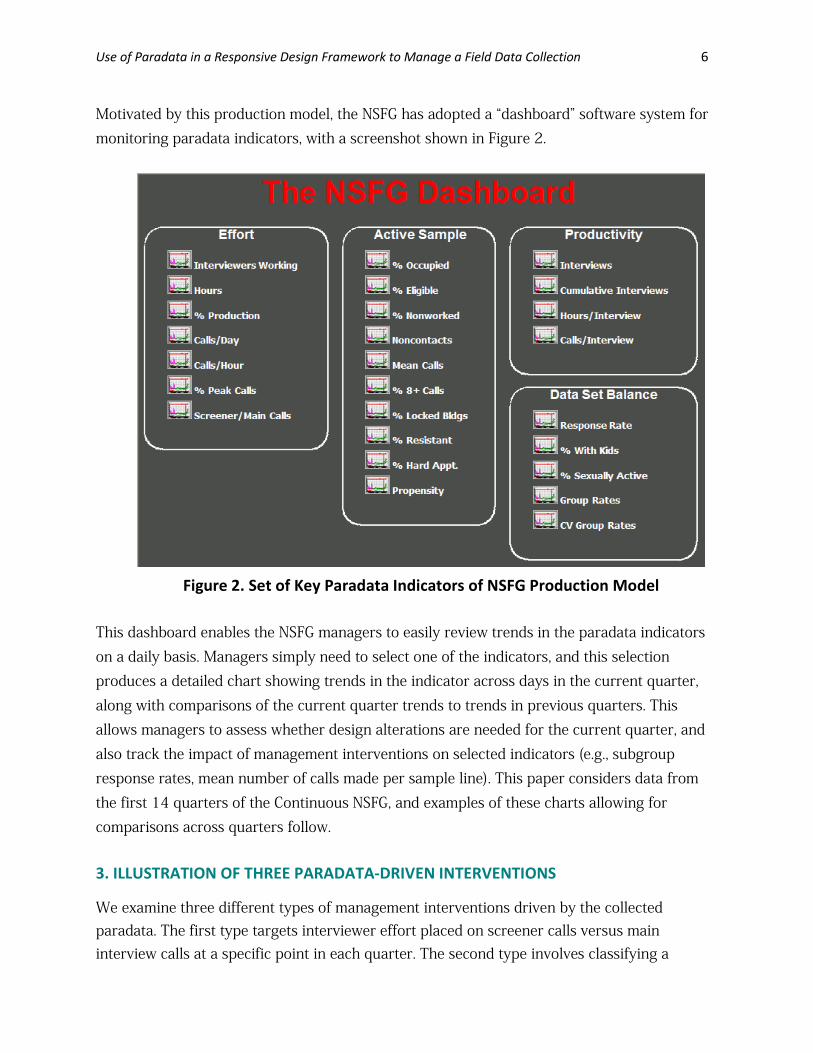
Motivated by this production model, the NSFG has adopted a “dashboard” software system for monitoring paradata indicators, with a screenshot shown in Figure 2.
Figure 2. Set of Key Paradata Indicators of NSFG Production Model
This dashboard enables the NSFG managers to easily review trends in the paradata indicators on a daily basis. Managers simply need to select one of the indicators, and this selection produces a detailed chart showing trends in the indicator across days in the current quarter, along with comparisons of the current quarter trends to trends in previous quarters. This allows managers to assess whether design alterations are needed for the current quarter, and also track the impact of management interventions on selected indicators (e.g., subgroup response rates, mean number of calls made per sample line). This paper considers data from the first 14 quarters of the Continuous NSFG, and examples of these charts allowing for comparisons across quarters follow. 3. ILLUSTRATION OF THREE PARADATA-DRIVEN INTERVENTIONS We examine three different types of management interventions driven by the collected paradata. The first type targets interviewer effort placed on screener calls versus main interview calls at a specific point in each quarter. The second type involves classifying a
Use of Paradata in a Responsive Design Framework to Manage a Field Data Collection 7
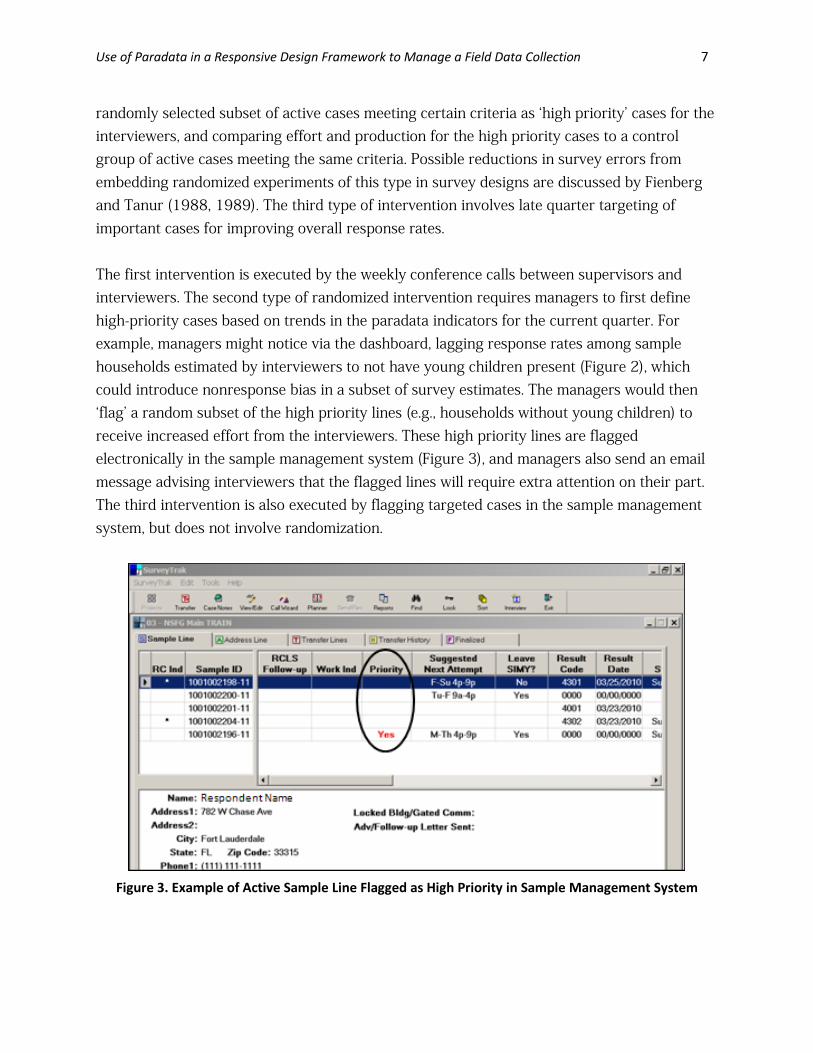
randomly selected subset of active cases meeting certain criteria as ‘high priority’ cases for the interviewers, and comparing effort and production for the high priority cases to a control group of active cases meeting the same criteria. Possible reductions in survey errors from embedding randomized experiments of this type in survey designs are discussed by Fienberg and Tanur (1988, 1989). The third type of intervention involves late quarter targeting of important cases for improving overall response rates. The first intervention is executed by the weekly conference calls between supervisors and interviewers. The second type of randomized intervention requires managers to first define high-priority cases based on trends in the paradata indicators for the current quarter. For example, managers might notice via the dashboard, lagging response rates among sample households estimated by interviewers to not have young children present (Figure 2), which could introduce nonresponse bias in a subset of survey estimates. The managers would then ‘flag’ a random subset of the high priority lines (e.g., households without young children) to receive increased effort from the interviewers. These high priority lines are flagged electronically in the sample management system (Figure 3), and managers also send an email message advising interviewers that the flagged lines will require extra attention on their part. The third intervention is also executed by flagging targeted cases in the sample management system, but does not involve randomization.
Figure 3. Example of Active Sample Line Flagged as High Priority in Sample Management System
Use of Paradata in a Responsive Design Framework to Manage a Field Data Collection 8
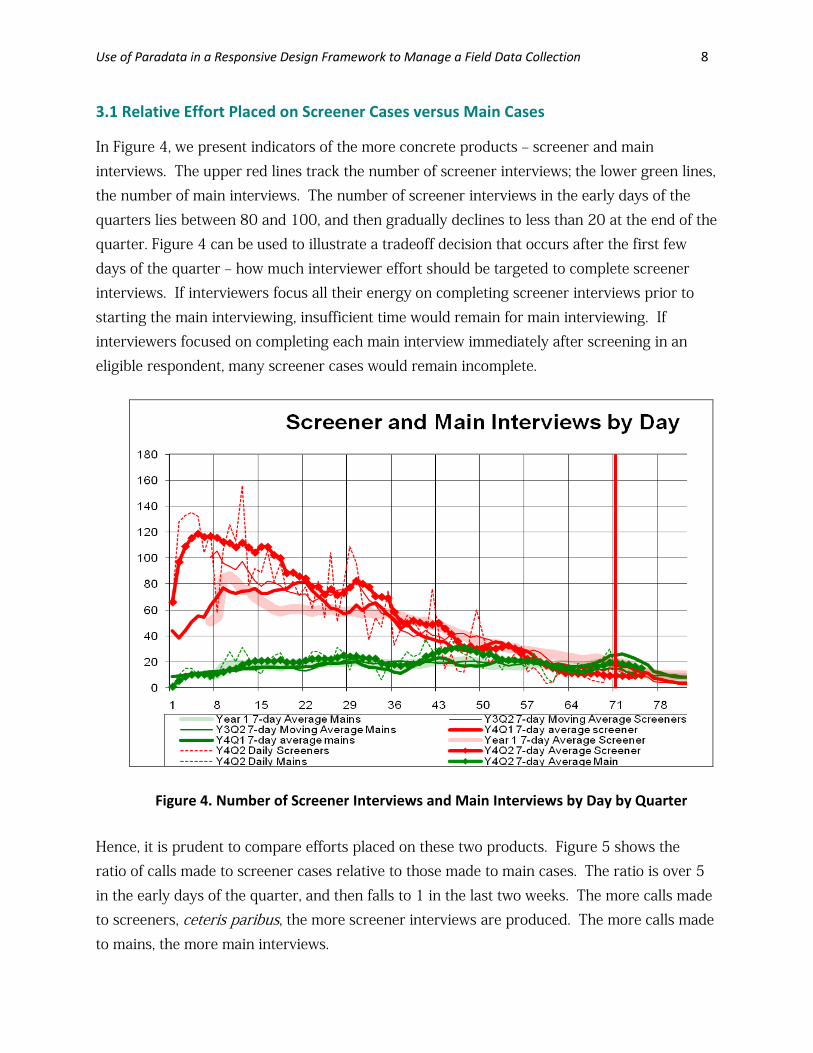
3.1 Relative Effort Placed on Screener Cases versus Main Cases In Figure 4, we present indicators of the more concrete products – screener and main interviews. The upper red lines track the number of screener interviews; the lower green lines, the number of main interviews. The number of screener interviews in the early days of the quarters lies between 80 and 100, and then gradually declines to less than 20 at the end of the quarter. Figure 4 can be used to illustrate a tradeoff decision that occurs after the first few days of the quarter – how much interviewer effort should be targeted to complete screener interviews. If interviewers focus all their energy on completing screener interviews prior to starting the main interviewing, insufficient time would remain for main interviewing. If interviewers focused on completing each main interview immediately after screening in an eligible respondent, many screener cases would remain incomplete.
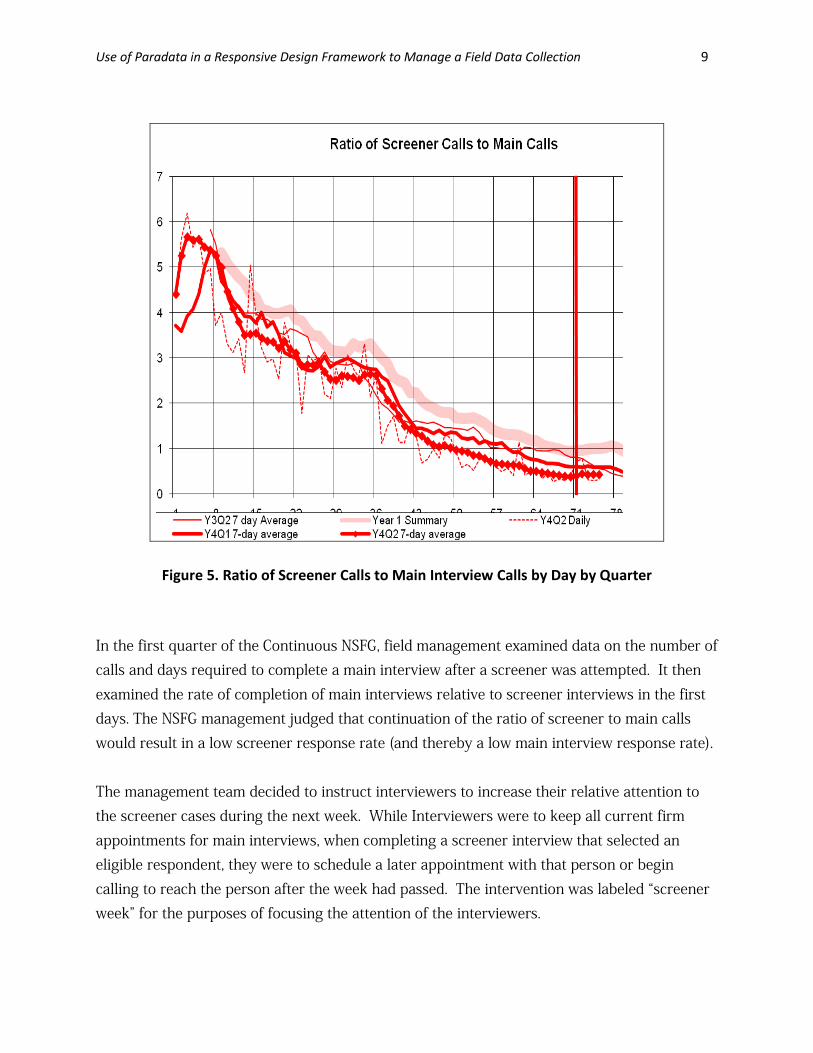
Figure 4. Number of Screener Interviews and Main Interviews by Day by Quarter Hence, it is prudent to compare efforts placed on these two products. Figure 5 shows the ratio of calls made to screener cases relative to those made to main cases. The ratio is over 5 in the early days of the quarter, and then falls to 1 in the last two weeks. The more calls made to screeners, ceteris paribus, the more screener interviews are produced. The more calls made to mains, the more main interviews.
Use of Paradata in a Responsive Design Framework to Manage a Field Data Collection 9
Figure 5. Ratio of Screener Calls to Main Interview Calls by Day by Quarter In the first quarter of the Continuous NSFG, field management examined data on the number of calls and days required to complete a main interview after a screener was attempted. It then examined the rate of completion of main interviews relative to screener interviews in the first days. The NSFG management judged that continuation of the ratio of screener to main calls would result in a low screener response rate (and thereby a low main interview response rate). The management team decided to instruct interviewers to increase their relative attention to the screener cases during the next week. While Interviewers were to keep all current firm appointments for main interviews, when completing a screener interview that selected an eligible respondent, they were to schedule a later appointment with that person or begin calling to reach the person after the week had passed. The intervention was labeled “screener week” for the purposes of focusing the attention of the interviewers.

Use of Paradata in a Responsive Design Framework to Manage a Field Data Collection 10
The goal of the intervention was to divert interviewer effort towards screening in order to further progress on the screening sample—reach screener lines that had not yet been contacted, attempt any remaining “untouched” sample lines, resolve access impediment issues, and produce more screener interviews (both in households with age-eligible persons and without age-eligible persons). We found that rates of calling and interviewing had a tendency to increase significantly during the intervention period. We asked interviewers to make proportionally more calls on those cases without a completed screener. If the greater calls yielded greater numbers of contacts and the greater number of contacts created more screener interviews, the intervention would be judged successful. In order to test the impact of the intervention statistically, we compare two outcomes measured daily (number of calls made to screener lines and number of completed screener interviews) from the week that was designated as “screener week” to the same outcomes from the two weeks before and the two weeks after. This represents an attempt to choose contrasting time periods that share similar levels of maturity of the active screener sample. Further, we reflect the trend of lower screener interviews over time in a predictor that reflects the day of the data collection period (we expect a negative effect of that variable on our two outcomes). Tables 1 and 2 present Type III F-tests for selected factors in linear regression models for these two outcomes. These models were estimated on the 35 days of the five week period (two weeks before the screener week, screener week, and two weeks after screener week) for each of 15 NSFG quarters to date. In total, there were 524 days for analysis across the 15 quarters, as one quarter only included 34 days during this period (the screener week intervention only lasted six days in Quarter 6). We predict dependent variables measuring the number of screener calls per day in the first model (Table 1) and the number of screener interviews per day in the second model (Table 2). Each model includes as predictors the day of the field period (with 0 representing day 1 of the first week, and 34 representing the last day of the fifth week), a binary indicator for whether a day corresponds to screener week, quarter (as a categorical factor with 15 levels), and all two- and three-way interactions between the three predictors. The interactions enable testing of variance in effects of day of field period during screener week and across quarters, as well as testing variance in screener week effects across quarters.
Use of Paradata in a Responsive Design Framework to Manage a Field Data Collection 11
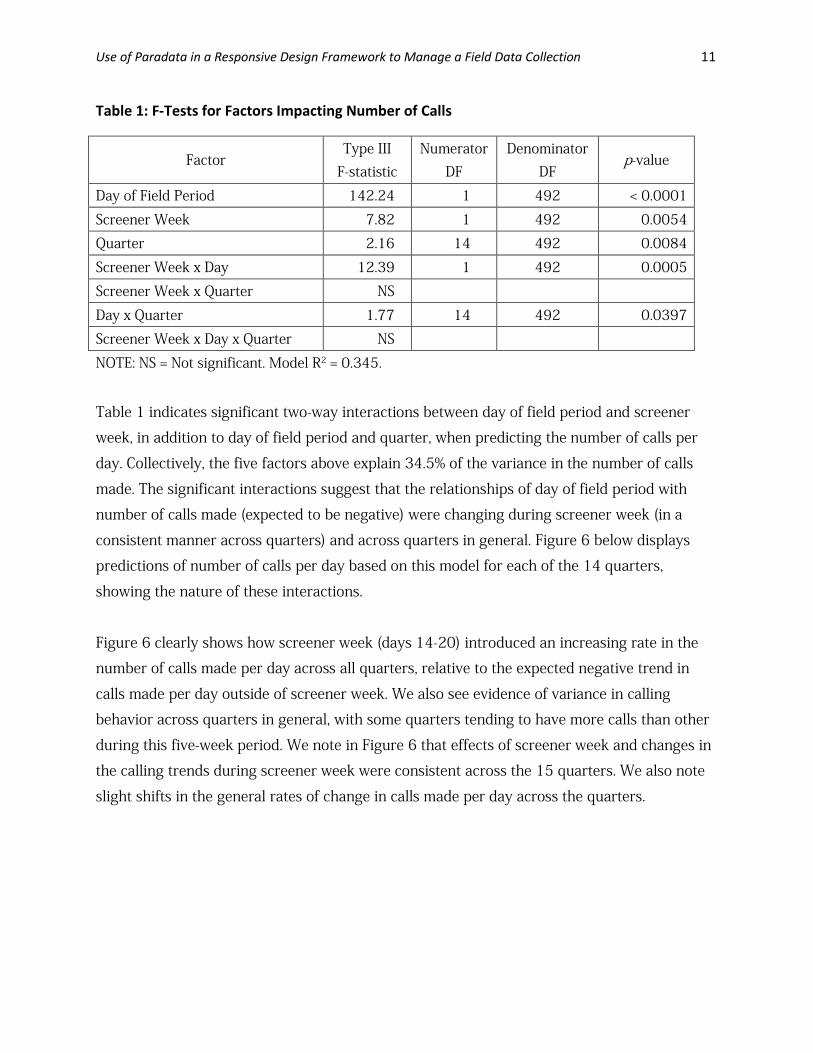
Table 1: F-Tests for Factors Impacting Number of Calls
Factor Type III
F-statistic Numerator
DF Denominator
DF p-value
Day of Field Period 142.24 1 492 < 0.0001
Screener Week 7.82 1 492 0.0054
Quarter 2.16 14 492 0.0084
Screener Week x Day 12.39 1 492 0.0005
Screener Week x Quarter NS
Day x Quarter 1.77 14 492 0.0397
Screener Week x Day x Quarter NS
NOTE: NS = Not significant. Model R2 = 0.345.
Table 1 indicates significant two-way interactions between day of field period and screener
week, in addition to day of field period and quarter, when predicting the number of calls per
day. Collectively, the five factors above explain 34.5% of the variance in the number of calls
made. The significant interactions suggest that the relationships of day of field period with
number of calls made (expected to be negative) were changing during screener week (in a
consistent manner across quarters) and across quarters in general. Figure 6 below displays
predictions of number of calls per day based on this model for each of the 14 quarters,
showing the nature of these interactions.
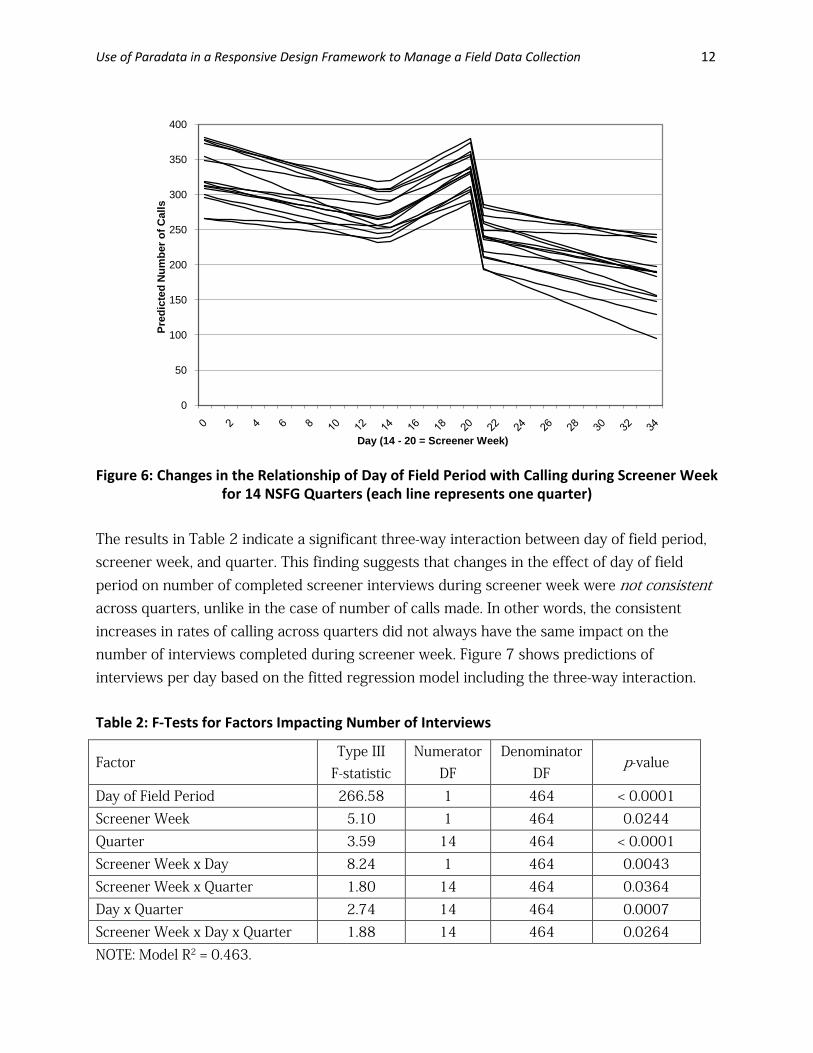
Figure 6 clearly shows how screener week (days 14-20) introduced an increasing rate in the
number of calls made per day across all quarters, relative to the expected negative trend in
calls made per day outside of screener week. We also see evidence of variance in calling
behavior across quarters in general, with some quarters tending to have more calls than other
during this five-week period. We note in Figure 6 that effects of screener week and changes in
the calling trends during screener week were consistent across the 15 quarters. We also note
slight shifts in the general rates of change in calls made per day across the quarters.
Use of Paradata in a Responsive Design Framework to Manage a Field Data Collection 12
0
50
100
150
200
250
300
350
400
Pred
icte
d N
umbe
r of C
alls
Day (14 - 20 = Screener Week)
Figure 6: Changes in the Relationship of Day of Field Period with Calling during Screener Week
for 14 NSFG Quarters (each line represents one quarter)
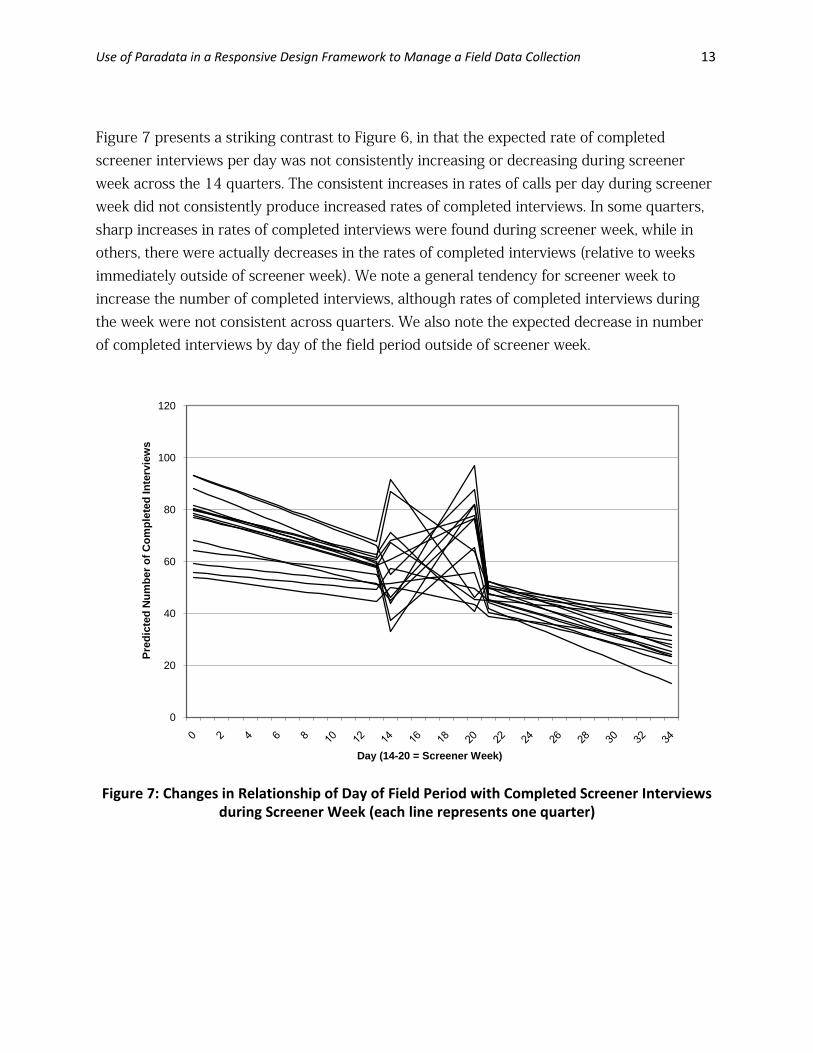
The results in Table 2 indicate a significant three-way interaction between day of field period, screener week, and quarter. This finding suggests that changes in the effect of day of field period on number of completed screener interviews during screener week were not consistent across quarters, unlike in the case of number of calls made. In other words, the consistent increases in rates of calling across quarters did not always have the same impact on the number of interviews completed during screener week. Figure 7 shows predictions of interviews per day based on the fitted regression model including the three-way interaction. Table 2: F-Tests for Factors Impacting Number of Interviews
Factor Type III
F-statistic Numerator
DF Denominator
DF p-value
Day of Field Period 266.58 1 464 < 0.0001 Screener Week 5.10 1 464 0.0244 Quarter 3.59 14 464 < 0.0001 Screener Week x Day 8.24 1 464 0.0043 Screener Week x Quarter 1.80 14 464 0.0364 Day x Quarter 2.74 14 464 0.0007 Screener Week x Day x Quarter 1.88 14 464 0.0264 NOTE: Model R2 = 0.463.
Use of Paradata in a Responsive Design Framework to Manage a Field Data Collection 13
Figure 7 presents a striking contrast to Figure 6, in that the expected rate of completed screener interviews per day was not consistently increasing or decreasing during screener week across the 14 quarters. The consistent increases in rates of calls per day during screener week did not consistently produce increased rates of completed interviews. In some quarters, sharp increases in rates of completed interviews were found during screener week, while in others, there were actually decreases in the rates of completed interviews (relative to weeks immediately outside of screener week). We note a general tendency for screener week to increase the number of completed interviews, although rates of completed interviews during the week were not consistent across quarters. We also note the expected decrease in number of completed interviews by day of the field period outside of screener week.
0
20
40
60
80
100
120
Pred
icte
d N
umbe
r of C
ompl
eted
Inte
rvie
ws
Day (14-20 = Screener Week)
Figure 7: Changes in Relationship of Day of Field Period with Completed Screener Interviews
during Screener Week (each line represents one quarter)

Use of Paradata in a Responsive Design Framework to Manage a Field Data Collection 14
3.2 Summary of Randomized Interventions Using Paradata At the time of this writing, we have completed 16 different randomized interventions in the
Continuous NSFG. Some interventions have been on cases with specific socio-demographic
characteristics (e.g., Hispanic males age 20-44), some based on cases with high selection
weights, some on active screener cases, and some on active main interview cases. In this
section we summarize the results of these 16 experiments.
For each experimental intervention, we ask two questions:
1. Do interviewers do what we ask of them?
2. Does the intervention act to increase the rate of participation among the target cases?
The intervention periods ranged from 8 days to 15 days in length. Some interventions
targeted lines with high or medium predicted probabilities of response based on propensity to
respond models. Other criteria for selection of lines in the interventions included lines with
high base weights in an effort to improve response rates.
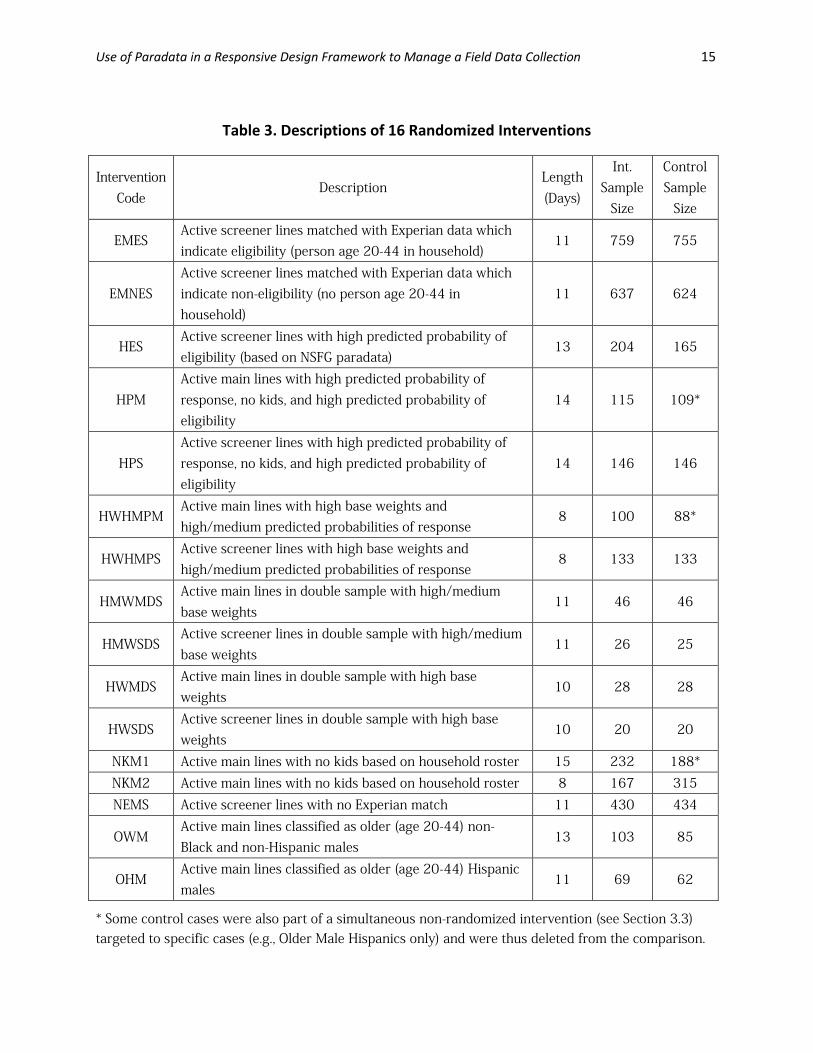
Table 3 provides a brief description of the specific lines that were considered for each of the
16 randomized interventions, including abbreviations for the interventions. We aim to increase
response rates for these specific cases, and evaluate the randomized interventions to see if we
are successful in this regard. In several cases, predicted eligibility probabilities or predicted
response propensities are computed for active lines based on logistic regression models
predicting response or eligibility as a function of the paradata collected daily on the active
lines. Interventions then target lines with high expected eligibility or response probabilities for
additional effort from the interviewers. The objective of evaluating these interventions is to see
if the specific subsets of these lines flagged for high priority actually receive more calls and
respond at higher rates than the control lines.
Use of Paradata in a Responsive Design Framework to Manage a Field Data Collection 15
Table 3. Descriptions of 16 Randomized Interventions
Intervention Code
Description Length (Days)
Int. Sample
Size
Control Sample
Size
EMES Active screener lines matched with Experian data which indicate eligibility (person age 20-44 in household)
11 759 755
EMNES Active screener lines matched with Experian data which indicate non-eligibility (no person age 20-44 in household)
11 637 624
HES Active screener lines with high predicted probability of eligibility (based on NSFG paradata)
13 204 165
HPM Active main lines with high predicted probability of response, no kids, and high predicted probability of eligibility
14 115 109*
HPS Active screener lines with high predicted probability of response, no kids, and high predicted probability of eligibility
14 146 146
HWHMPM Active main lines with high base weights and high/medium predicted probabilities of response
8 100 88*
HWHMPS Active screener lines with high base weights and high/medium predicted probabilities of response
8 133 133
HMWMDS Active main lines in double sample with high/medium base weights
11 46 46
HMWSDS Active screener lines in double sample with high/medium base weights
11 26 25
HWMDS Active main lines in double sample with high base weights
10 28 28
HWSDS Active screener lines in double sample with high base weights
10 20 20
NKM1 Active main lines with no kids based on household roster 15 232 188* NKM2 Active main lines with no kids based on household roster 8 167 315 NEMS Active screener lines with no Experian match 11 430 434
OWM Active main lines classified as older (age 20-44) non-Black and non-Hispanic males
13 103 85
OHM Active main lines classified as older (age 20-44) Hispanic males
11 69 62
* Some control cases were also part of a simultaneous non-randomized intervention (see Section 3.3) targeted to specific cases (e.g., Older Male Hispanics only) and were thus deleted from the comparison.
Use of Paradata in a Responsive Design Framework to Manage a Field Data Collection 16
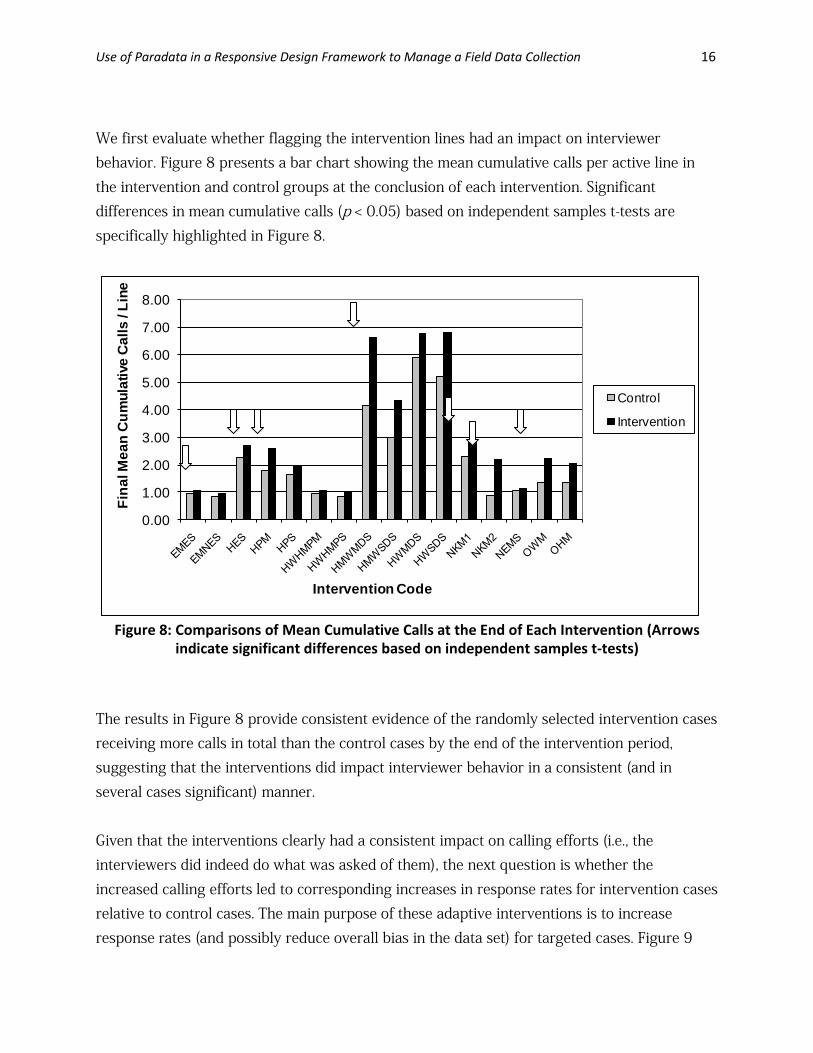
We first evaluate whether flagging the intervention lines had an impact on interviewer behavior. Figure 8 presents a bar chart showing the mean cumulative calls per active line in the intervention and control groups at the conclusion of each intervention. Significant differences in mean cumulative calls (p < 0.05) based on independent samples t-tests are specifically highlighted in Figure 8.
0.00
1.00
2.00
3.00
4.00
5.00
6.00
7.00
8.00
Fina
l Mea
n C
umul
ativ
e C
alls
/ Li
ne
Intervention Code
Control
Intervention
Figure 8: Comparisons of Mean Cumulative Calls at the End of Each Intervention (Arrows
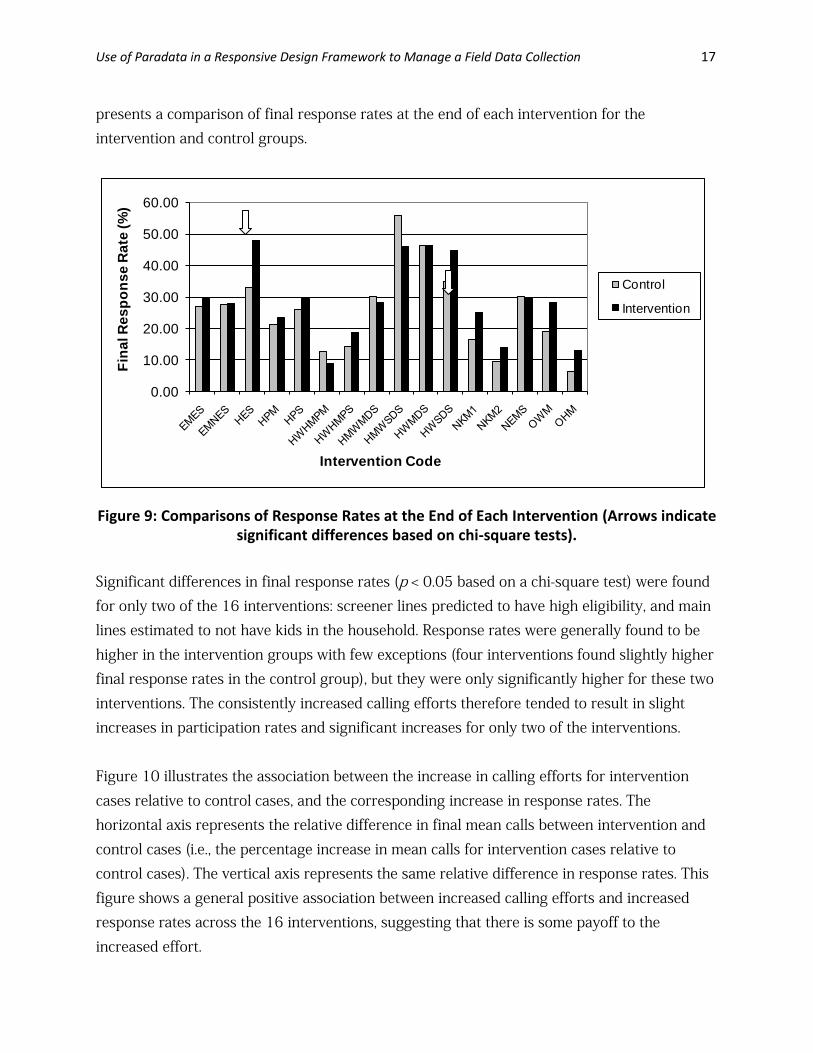
indicate significant differences based on independent samples t-tests) The results in Figure 8 provide consistent evidence of the randomly selected intervention cases receiving more calls in total than the control cases by the end of the intervention period, suggesting that the interventions did impact interviewer behavior in a consistent (and in several cases significant) manner. Given that the interventions clearly had a consistent impact on calling efforts (i.e., the interviewers did indeed do what was asked of them), the next question is whether the increased calling efforts led to corresponding increases in response rates for intervention cases relative to control cases. The main purpose of these adaptive interventions is to increase response rates (and possibly reduce overall bias in the data set) for targeted cases. Figure 9
Use of Paradata in a Responsive Design Framework to Manage a Field Data Collection 17
presents a comparison of final response rates at the end of each intervention for the intervention and control groups.
0.00
10.00
20.00
30.00
40.00
50.00
60.00
Fina
l Res
pons
e R
ate
(%)
Intervention Code
Control
Intervention
Figure 9: Comparisons of Response Rates at the End of Each Intervention (Arrows indicate
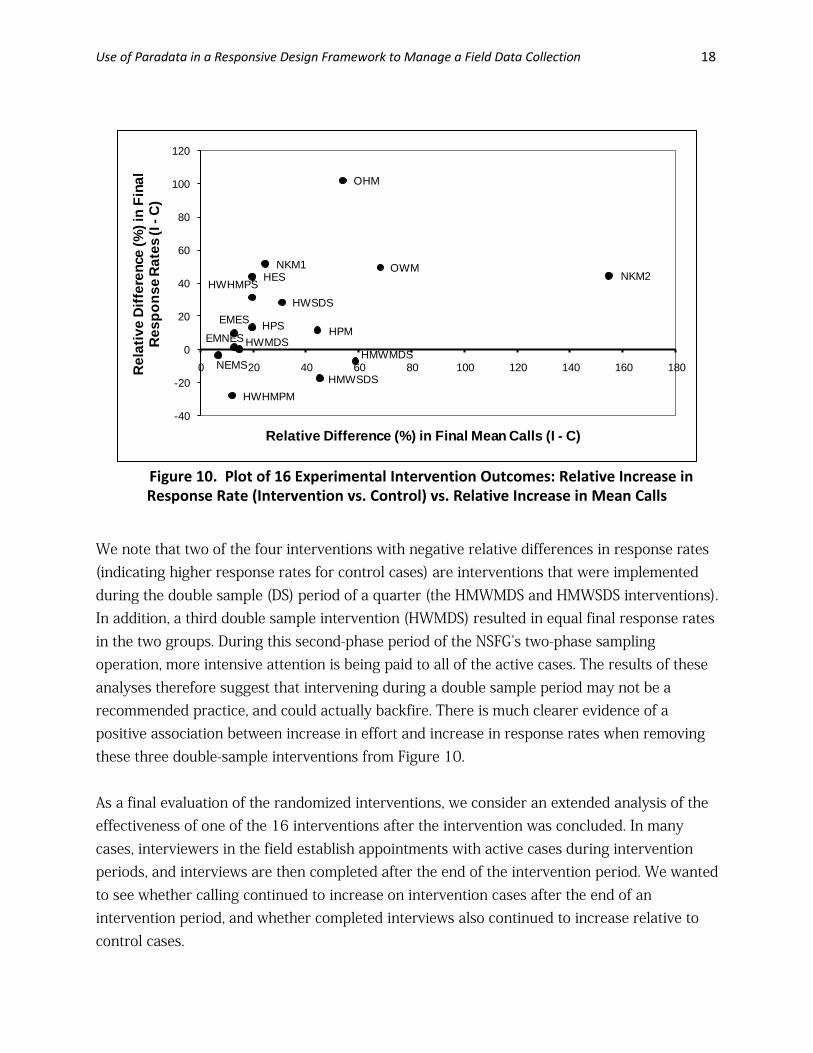
significant differences based on chi-square tests). Significant differences in final response rates (p < 0.05 based on a chi-square test) were found for only two of the 16 interventions: screener lines predicted to have high eligibility, and main lines estimated to not have kids in the household. Response rates were generally found to be higher in the intervention groups with few exceptions (four interventions found slightly higher final response rates in the control group), but they were only significantly higher for these two interventions. The consistently increased calling efforts therefore tended to result in slight increases in participation rates and significant increases for only two of the interventions. Figure 10 illustrates the association between the increase in calling efforts for intervention cases relative to control cases, and the corresponding increase in response rates. The horizontal axis represents the relative difference in final mean calls between intervention and control cases (i.e., the percentage increase in mean calls for intervention cases relative to control cases). The vertical axis represents the same relative difference in response rates. This figure shows a general positive association between increased calling efforts and increased response rates across the 16 interventions, suggesting that there is some payoff to the increased effort.
Use of Paradata in a Responsive Design Framework to Manage a Field Data Collection 18
EMES
EMNES
HES
HPM
HWHMPM
HWHMPS
HWMDS
HWSDS
NKM2
NEMS
OHM
HPS
OWMNKM1
HMWMDS
HMWSDS
-40
-20
0
20
40
60
80
100
120
0 20 40 60 80 100 120 140 160 180Rel
ativ
e D
iffer
ence
(%) i
n Fi
nal
Res
pons
e R
ates
(I -
C)
Relative Difference (%) in Final Mean Calls (I - C)
Figure 10. Plot of 16 Experimental Intervention Outcomes: Relative Increase in Response Rate (Intervention vs. Control) vs. Relative Increase in Mean Calls
We note that two of the four interventions with negative relative differences in response rates (indicating higher response rates for control cases) are interventions that were implemented during the double sample (DS) period of a quarter (the HMWMDS and HMWSDS interventions). In addition, a third double sample intervention (HWMDS) resulted in equal final response rates in the two groups. During this second-phase period of the NSFG’s two-phase sampling operation, more intensive attention is being paid to all of the active cases. The results of these analyses therefore suggest that intervening during a double sample period may not be a recommended practice, and could actually backfire. There is much clearer evidence of a positive association between increase in effort and increase in response rates when removing these three double-sample interventions from Figure 10. As a final evaluation of the randomized interventions, we consider an extended analysis of the effectiveness of one of the 16 interventions after the intervention was concluded. In many cases, interviewers in the field establish appointments with active cases during intervention periods, and interviews are then completed after the end of the intervention period. We wanted to see whether calling continued to increase on intervention cases after the end of an intervention period, and whether completed interviews also continued to increase relative to control cases.
Use of Paradata in a Responsive Design Framework to Manage a Field Data Collection 19
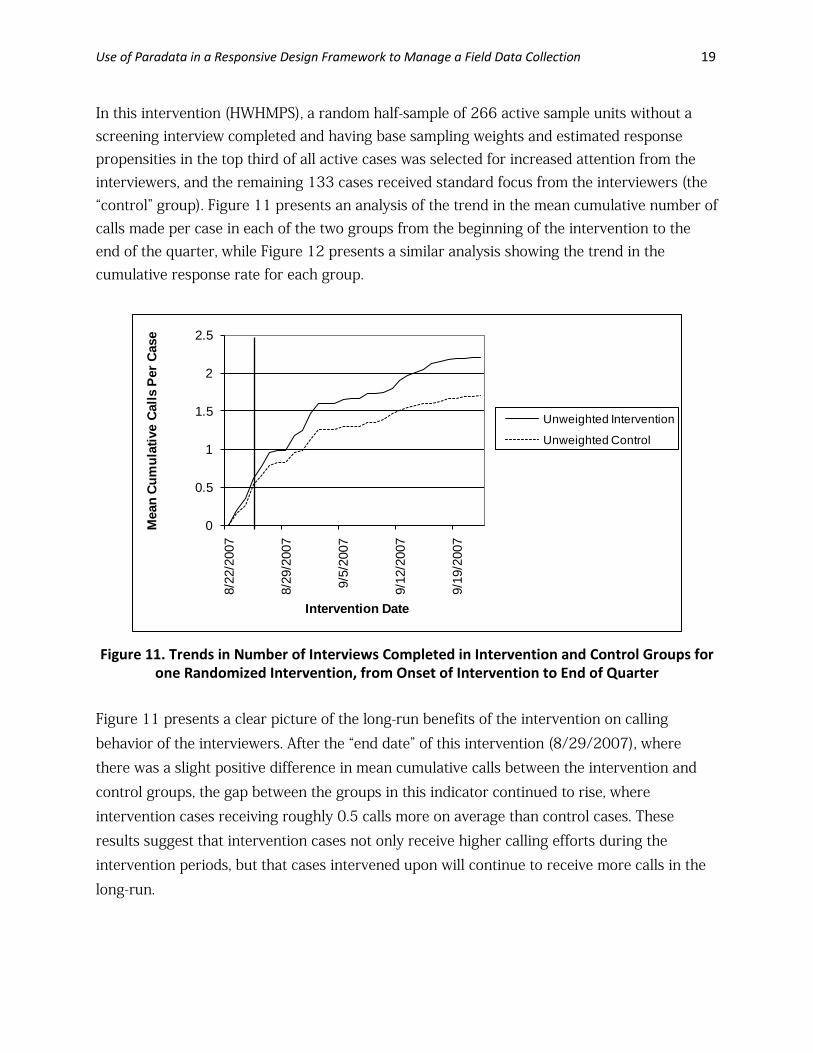
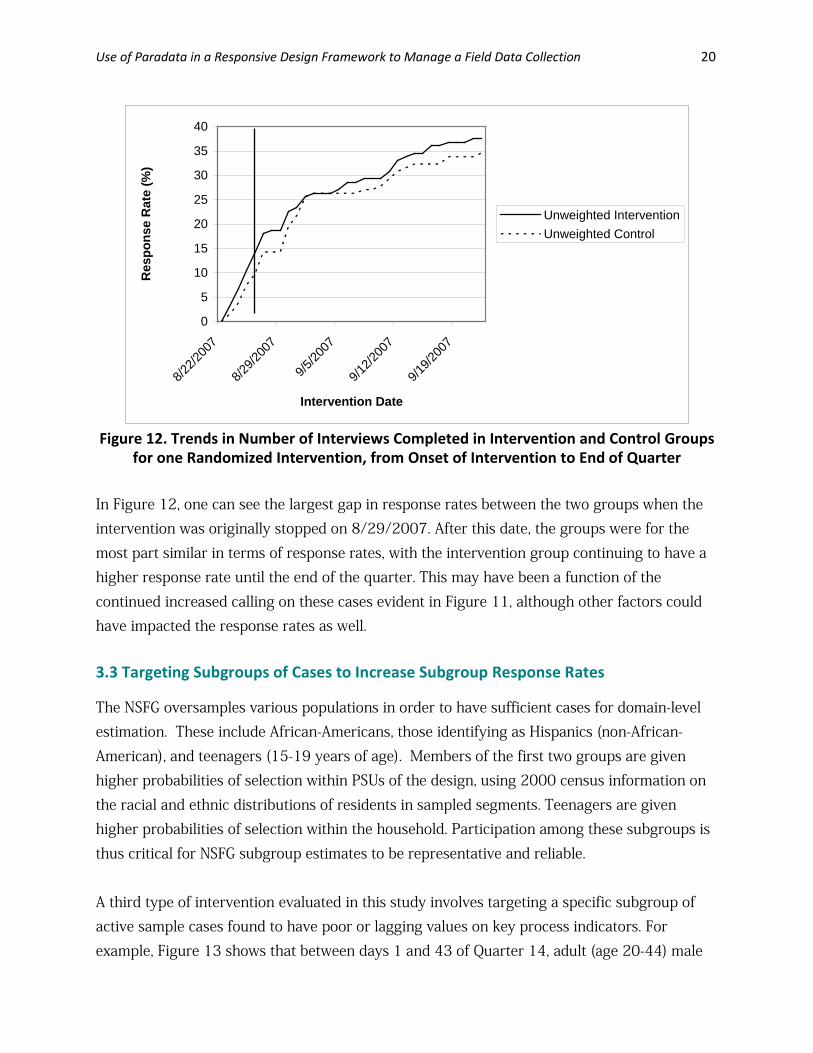
In this intervention (HWHMPS), a random half-sample of 266 active sample units without a screening interview completed and having base sampling weights and estimated response propensities in the top third of all active cases was selected for increased attention from the interviewers, and the remaining 133 cases received standard focus from the interviewers (the “control” group). Figure 11 presents an analysis of the trend in the mean cumulative number of calls made per case in each of the two groups from the beginning of the intervention to the end of the quarter, while Figure 12 presents a similar analysis showing the trend in the cumulative response rate for each group.
0
0.5
1
1.5
2
2.5
8/22
/200
7
8/29
/200
7
9/5/
2007
9/12
/200
7
9/19
/200
7
Mea
n Cu
mul
ativ
e Ca
lls P
er C
ase
Intervention Date
Unweighted Intervention
Unweighted Control
Figure 11. Trends in Number of Interviews Completed in Intervention and Control Groups for
one Randomized Intervention, from Onset of Intervention to End of Quarter Figure 11 presents a clear picture of the long-run benefits of the intervention on calling behavior of the interviewers. After the “end date” of this intervention (8/29/2007), where there was a slight positive difference in mean cumulative calls between the intervention and control groups, the gap between the groups in this indicator continued to rise, where intervention cases receiving roughly 0.5 calls more on average than control cases. These results suggest that intervention cases not only receive higher calling efforts during the intervention periods, but that cases intervened upon will continue to receive more calls in the long-run.
Use of Paradata in a Responsive Design Framework to Manage a Field Data Collection 20
0
5
10
15
20
25
30
35
40
8/22/2
007
8/29/2
007
9/5/20
07
9/12/2
007
9/19/2
007
Intervention Date
Res
pons
e R
ate
(%)
Unweighted InterventionUnweighted Control
Figure 12. Trends in Number of Interviews Completed in Intervention and Control Groups
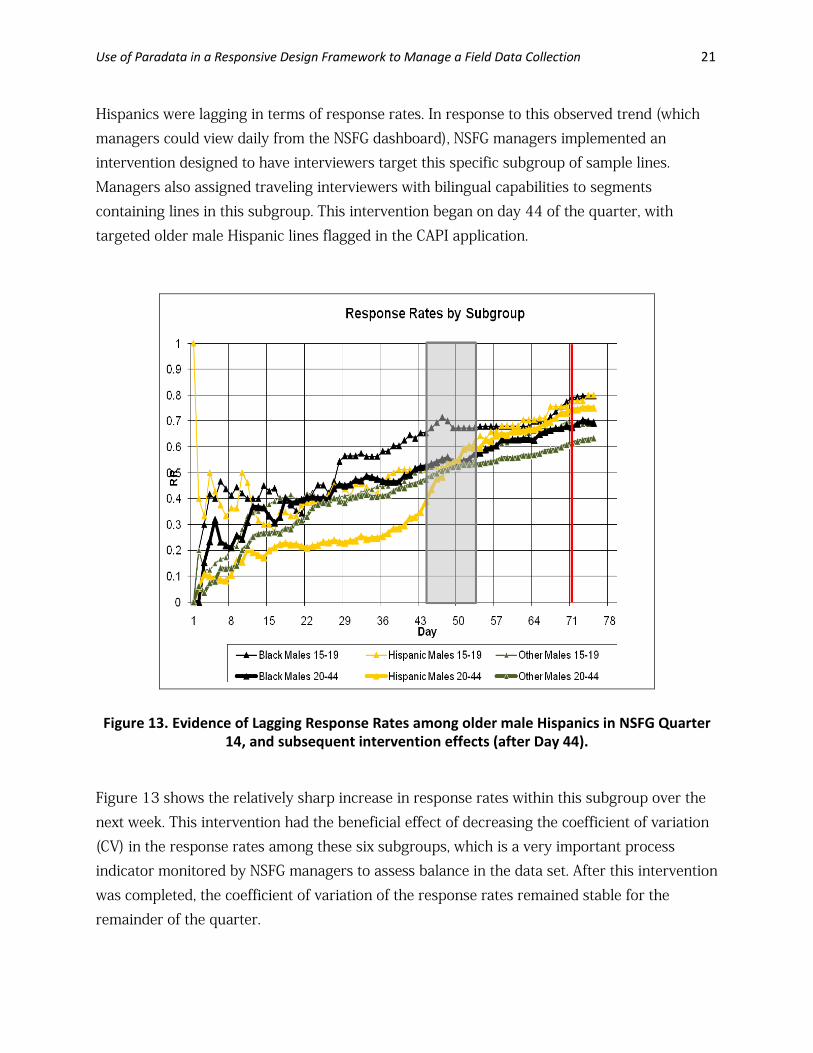
for one Randomized Intervention, from Onset of Intervention to End of Quarter In Figure 12, one can see the largest gap in response rates between the two groups when the intervention was originally stopped on 8/29/2007. After this date, the groups were for the most part similar in terms of response rates, with the intervention group continuing to have a higher response rate until the end of the quarter. This may have been a function of the continued increased calling on these cases evident in Figure 11, although other factors could have impacted the response rates as well. 3.3 Targeting Subgroups of Cases to Increase Subgroup Response Rates The NSFG oversamples various populations in order to have sufficient cases for domain-level estimation. These include African-Americans, those identifying as Hispanics (non-African-American), and teenagers (15-19 years of age). Members of the first two groups are given higher probabilities of selection within PSUs of the design, using 2000 census information on the racial and ethnic distributions of residents in sampled segments. Teenagers are given higher probabilities of selection within the household. Participation among these subgroups is thus critical for NSFG subgroup estimates to be representative and reliable. A third type of intervention evaluated in this study involves targeting a specific subgroup of active sample cases found to have poor or lagging values on key process indicators. For example, Figure 13 shows that between days 1 and 43 of Quarter 14, adult (age 20-44) male
Use of Paradata in a Responsive Design Framework to Manage a Field Data Collection 21
Hispanics were lagging in terms of response rates. In response to this observed trend (which managers could view daily from the NSFG dashboard), NSFG managers implemented an intervention designed to have interviewers target this specific subgroup of sample lines. Managers also assigned traveling interviewers with bilingual capabilities to segments containing lines in this subgroup. This intervention began on day 44 of the quarter, with targeted older male Hispanic lines flagged in the CAPI application.
Figure 13. Evidence of Lagging Response Rates among older male Hispanics in NSFG Quarter 14, and subsequent intervention effects (after Day 44).
Figure 13 shows the relatively sharp increase in response rates within this subgroup over the next week. This intervention had the beneficial effect of decreasing the coefficient of variation (CV) in the response rates among these six subgroups, which is a very important process indicator monitored by NSFG managers to assess balance in the data set. After this intervention was completed, the coefficient of variation of the response rates remained stable for the remainder of the quarter.

Use of Paradata in a Responsive Design Framework to Manage a Field Data Collection 22
4. SUMMARY AND CONCLUSIONS This paper has presented a case study of responsive design based on active monitoring of paradata. It reviewed three types of paradata-driven management interventions: one applied to all interviewers on a very broad level; one applied to a random selection of cases meeting specific criteria; another, to specific cases held by the subset of interviewers assigned those cases. To model the impact of the first intervention, we contrasted the week of the intervention to two prior weeks and two succeeding weeks. We found that rates of interviewer calling were significantly increased in a consistent manner across quarters during the week of the intervention, suggesting that the intervention did indeed impact interviewer behavior. The increased rates of calling, however, did not consistently correspond to increased rates of interviews during the same period. The second analysis examined 16 different randomized interventions, applied to cases classified by a variety of paradata. Here we see that, for the most part, interviewers follow the guidelines of the intervention, making more calls on the experimental intervention cases than the control cases. The intervention cases also tend to achieve larger jumps in response rates than the control cases during the intervention period. However, two of the 16 interventions exhibited backfire effects; these both targeted high weight cases during the second phase of a two-phase sampling operation. This may be a signal that the intervention plan of increased calling may be inadequate to address the causes of lower participation rates among high weight cases, or that requesting addition effort during a phase where all interviewers are already applying additional effort may not be beneficial. The third analysis examined a more targeted intervention, where a subgroup of cases (older female Hispanics) was found to have a lagging response rate by NSFG managers monitoring response rates on a daily basis. By intervening on all of these cases, we were able to reduce the coefficient of variation in the response rate among six key NSFG subgroups, introducing more balance in the final data set. Our experience has found that this type of targeted intervention has been very successful at restoring balance in a data set, either in terms of response rates across subgroups or other key indicators. In general, interviewers were attentive to and accepting of the intervention strategies used for NSFG. Across all interventions, the reason for the request for increased effort on certain
Use of Paradata in a Responsive Design Framework to Manage a Field Data Collection 23
sample lines was not revealed to the interviewers. Instead, they received notification that certain lines would be flagged for increased effort and to place emphasis on these lines as they planned their work. Indicators on these lines were set in the sample management system and removed at the end of the intervention period. Responsive design acts on efforts of the data collection to target different sample cases to manipulate the cost and error properties of the final survey estimates. A sine qua non of responsive design is, therefore, the ability to deliver instructions to the field data collection organization to alter their focus from one activity to another. These three examples give hope that such intervention can lead to the desired changes. All is not perfect, however, and continuous examination of weaknesses in the practice of responsive designs is necessary to improve this active balancing of costs and error. REFERENCES Couper, M.P. (1998). Measuring survey quality in a CASIC environment. Paper presented at the
Joint Statistical Meetings of the American Statistical Association, Dallas, TX.
Fienberg, S.E., and Tanur, J.M. (1988). “From the Inside Out and the Outside In: Combining Experimental and Sampling Structures.” The Canadian Journal of Statistics, 19, 135-151.
Fienberg, S.E., and Tanur, J.M. (1989). “Combining Cognitive and Statistical Approaches to Survey Design.” Science, 243, 1017-1022.
Groves, R.M., and Heeringa, S.G. (2006). “Responsive Design for Household Surveys: Tools for Actively Controlling Survey Nonresponse and Costs,” Journal of the Royal Statistical Society, Series A, 169, pp. 439-457.
Groves, R.M., Mosher, W.D., Lepkowski, J., and Kirgis, N.G. (2009). Planning and Development of the Continuous National Survey of Family Growth. National Center for Health Statistics. Vital Health Statistics, 1, 48.
National Research Council. (2007). Using the American Community Survey: Benefits and Challenges. Panel on the Functionality and Usability of Data from the American Community Survey, Constance F. Citro and Graham Kalton, Editors. Committee on National Statistics, Division of Behavioral and Social Sciences and Education. Washington, D.C.: The National Academies Press.