Use of Need for Closure Scale to Predict and Affect ... · ii Use of Need for Closure Scale to...
83
Use of Need for Closure Scale to Predict and Affect Individual Tendency for Design Fixation by Song-Liang Lai A thesis submitted in conformity with the requirements for the degree of Master of Applied Science Department of Mechanical and Industrial Engineering University of Toronto © Copyright by Song-Liang Lai 2016
-
Upload
trannguyet -
Category
Documents
-
view
218 -
download
3
Transcript of Use of Need for Closure Scale to Predict and Affect ... · ii Use of Need for Closure Scale to...

Use of Need for Closure Scale to Predict and Affect Individual Tendency for Design Fixation
by
Song-Liang Lai
A thesis submitted in conformity with the requirements for the degree of Master of Applied Science
Department of Mechanical and Industrial Engineering University of Toronto
© Copyright by Song-Liang Lai 2016

ii
Use of Need for Closure Scale to Predict and Affect Individual
Tendency for Design Fixation
Song-Liang Lai
Master of Applied Science
Department of Mechanical and Industrial Engineering
University of Toronto
2016
Abstract
Not all individuals may be equally susceptible to design fixation. I sought to identify characteristics
that could predict and affect individual tendency for design fixation, and explored the use of
Kruglanski’s Need for Closure Scale for this purpose. The Need for Closure Scale is an
individual/dispositional difference variable, as well as an environmental variable that can be
manipulated in the laboratory. I devised two experiments that involved developing concepts for
which an example solution was provided. The first experiment investigated whether correlations
exist between participants’ score on the Need for Closure Scale and the degree of fixation in
concepts elicited. A pilot experiment and second experiment investigated whether
environmentally-induced Need for Closure could be used to change participants’ likelihood to
fixate. Significant results were found in the first and second experiments, supporting that Need for
Closure can be used to predict and affect individual tendency for design fixation.

iii
Acknowledgments
Thank you to my supervisor, Professor L.H. Shu for her vision and guidance, all experiment
participants for their contributions, and Professor Birsen Donmez for her assistance in the
statistical analyses.
I am thankful for the support of my parents, brother, and friends.
Thank you to my various lab mates for their support and company: Jayesh Srivastava, Michael
Koerber, Amanda Chou, Greg Fukakusa, Mayukh Chakraborty, and Thomas Schaepsmeyer.
Finally, I gratefully acknowledge the financial support of the Natural Sciences and Engineering
Research Council of Canada (NSERC).

iv
Table of contents
Acknowledgments.......................................................................................................................... iii
Table of contents ............................................................................................................................ iv
List of tables .................................................................................................................................. vii
List of figures ............................................................................................................................... viii
List of appendices ............................................................................................................................x
Introduction ......................................................................................................................................1
Literature review .........................................................................................................................2
1.1 Design fixation .....................................................................................................................2
1.1.1 Classification and definition ....................................................................................2
1.1.2 Contributing factors .................................................................................................2
1.1.3 Overcoming fixation ................................................................................................3
1.2 Need for Closure ..................................................................................................................4
1.2.1 Dispositional Need for Closure measurement and validation..................................4
1.2.2 Environmental Need for Closure manipulation .......................................................4
1.2.3 Short form of the Need for Closure Scale ................................................................5
1.3 Relationship between design fixation and Need for Closure ...............................................5
Terminology and research goals .................................................................................................6
2.1 Terminology and nomenclature ...........................................................................................6
2.2 Research goals .....................................................................................................................7
Experiment 1: NFCd and tendency for design fixation ...............................................................8
3.1 Participants ...........................................................................................................................8
3.2 Method .................................................................................................................................8
3.2.1 Location ...................................................................................................................8
3.2.2 Part 1: NFCd Scale ...................................................................................................9
3.2.3 Part 2: Problem for concept generation ...................................................................9
v
3.2.4 Part 2: Concept generation and submission ...........................................................12
3.2.5 Experiment 1 debriefing ........................................................................................12
3.3 Evaluation of design fixation .............................................................................................12
3.4 Results ................................................................................................................................16
3.4.1 Observations ..........................................................................................................16
3.4.2 Group comparison: low NFCd vs. high NFCd ........................................................18
3.4.3 Comparing individual differences (NFCd) .............................................................19
3.5 Discussion: effect of NFCd on design fixation ..................................................................22
Pilot Experiment: NFCe and tendency for design fixation ........................................................24
4.1 Participants .........................................................................................................................24
4.2 Method ...............................................................................................................................24
4.2.1 Formation of groups prior to experiment ...............................................................24
4.2.2 Game of Taboo ......................................................................................................25
4.2.3 Experimental conditions and relation to NFCe ......................................................25
4.2.4 Implementation ......................................................................................................26
4.2.5 Part 1: Round 1 - Peanut-sheller problem ..............................................................27
4.2.6 Part 2: Round 2 - Alarm-clock problem ................................................................28
4.2.7 Part 3: 15-item NFCd Scale ....................................................................................30
4.2.8 Debrief ...................................................................................................................31
4.3 Results ................................................................................................................................31
4.3.1 Fixation evaluation.................................................................................................31
4.3.2 Observations ..........................................................................................................34
4.3.3 Condition differences .............................................................................................37
4.3.4 Comparing individual differences..........................................................................38
4.4 Discussion: effect of NFCe on design fixation ...................................................................39
Experiment 2: NFCd and NFCe and tendency for design fixation ............................................42

vi
5.1 Participants .........................................................................................................................42
5.2 Method ...............................................................................................................................42
5.2.1 Human Intelligence Task (HIT) set-up and recruitment ........................................43
5.2.2 Experiment registration and group assignment ......................................................43
5.2.3 Part 1: Design problem ..........................................................................................43
5.2.4 Part 1: Preparation for concept generation.............................................................44
5.2.5 Part 1: Manipulation of NFCe during concept generation .....................................44
5.2.6 Part 2: NFCd Scale .................................................................................................44
5.2.7 Part 3: Exit survey ..................................................................................................44
5.2.8 Experiment debriefing ...........................................................................................46
5.3 Evaluation of design fixation .............................................................................................46
5.4 Results and discussion .......................................................................................................46
5.4.1 Observations ..........................................................................................................47
5.4.2 Experimental group differences .............................................................................49
5.5 Discussion: effect of NFCe on design fixation ...................................................................55
Conclusion and Next Steps .......................................................................................................56
References ......................................................................................................................................58
Appendices .....................................................................................................................................62

vii
List of tables
Table 1: Terminology and nomenclature ........................................................................................ 7
Table 2: Fixation score rating scheme .......................................................................................... 13
Table 3: Evaluations of sample concepts ...................................................................................... 13
Table 4: Wilcoxon Rank-Sum test groups .................................................................................... 18
Table 5: Log odds ratio for increase by one in NFCd score on fixation score .............................. 20
Table 6: Odds ratio and corresponding probabilities of a more fixated concept for various increases
in NFCd score ................................................................................................................................ 21
Table 7: Allotted Taboo game-round time per number of submitted concepts ............................ 26
Table 8: Peanut-sheller fixation rating scheme (Linsey et al., (2010) (2013)). ............................ 31
Table 9: Alarm-clock fixation rating scheme (Genco et al., (2012)) ............................................ 32
Table 10: Peanut-sheller problem - uncertain cases ..................................................................... 33
Table 11: Alarm-clock problem - uncertain cases ........................................................................ 33
Table 12: Intervention vs. control condition differences .............................................................. 38
Table 13: Log odds ratio for increase by one in NFCd Score on fixation score ........................... 39
Table 14: NFCe manipulation during concept generation (experiment 2) ................................... 45
Table 15: General comparisons between experimental groups .................................................... 52
Table 16: Wilcoxon Rank-Sum test results between experimental groups .................................. 53
Table 17: Experiment 2 gender differences .................................................................................. 54

viii
List of figures
Figure 1: Design problem description provided to participants.................................................... 10
Figure 2: Examples provided to participants ................................................................................ 11
Figure 3: Participant D, concept 2 of 3, similarity ratings: form 5/5, function 5/5; fixation score
10/10 ............................................................................................................................................. 14
Figure 4: Participant I, concept 3 of 8: similarity ratings: form 3/5, function 5/5; fixation score
8/10 ............................................................................................................................................... 14
Figure 5: Participant J, concept 1 of 8, similarity ratings: form 1/5, function 1/5; fixation score
2/10 ............................................................................................................................................... 15
Figure 6: Histogram of NFCd scores of participants ..................................................................... 16
Figure 7: Fixation scores of accepted concepts vs. NFCd ............................................................. 17
Figure 8: Mean fixation scores of accepted concepts per participant vs. NFCd ........................... 17
Figure 9: Histogram of participants' concept fixation scores ....................................................... 19
Figure 10: Histogram of participants’ concept fixation score categories ..................................... 19
Figure 11: Experiment 1 probability distribution plots for fixation scores by NFCd ................... 22
Figure 12: Problem 1 – Device to shell peanuts (Linsey et al., (2010) (2013))............................ 28
Figure 13: Problem 2 - Alarm clock (Adapted, (Genco, et al., 2012) .......................................... 29
Figure 14: 15-item NFCd Scale vs 42-item NFCd Scale (24 observations) .................................. 30
Figure 15: Histogram of NFCd scores of participants ................................................................... 34
Figure 16: Mean fixation scores of peanut-sheller concepts (Full – PS7) .................................... 35
Figure 17: Mean fixation scores of peanut-sheller concepts (Adjusted – PS4) ............................ 35
Figure 18: Mean fixation scores of alarm-clock concepts (Full – AC9) ...................................... 36

ix
Figure 19: Mean fixation scores of alarm-clock concepts (Adjusted – AC7) .............................. 36
Figure 20: Histogram of NFCd of participants .............................................................................. 47
Figure 21: Fixation scores of accepted concepts vs. NFCd ........................................................... 48
Figure 22: Mean fixation scores of accepted concepts per participant vs NFCd .......................... 48
Figure 23: Histogram of NFCd of participants in Group 1: Low NFCe ........................................ 49
Figure 24: Histogram of NFCd of participants in Group 2: Control ............................................. 49
Figure 25: Histogram of NFCd of participants in Group 3: High NFCe ....................................... 50
Figure 26: Mean fixation scores of accepted concepts per participant vs NFCd in Group1: Low
NFCe .............................................................................................................................................. 50
Figure 27: Mean fixation scores of accepted concepts per participant vs NFCd in Group2: Control
....................................................................................................................................................... 51
Figure 28: Mean fixation scores of accepted concepts per participant vs NFCd in Group3: High
NFCe .............................................................................................................................................. 51

x
List of appendices
Appendix 1: 42-item NFCd Scale (as administered in Experiment 1 and Experiment 2)............. 62
Appendix 2: Profile screen (Experiment 2) .................................................................................. 68
Appendix 3: Drawing canvas (Experiment 2: Group 3, high NFCe condition) ............................ 70
Appendix 4: Sample timestamp output ......................................................................................... 71
Appendix 5: Inquisition of NFC estimate (Experiment 2)............................................................ 73
1
Introduction
Jansson and Smith (1991) described design fixation as “a blind adherence to a set of ideas or
concepts limiting the output of conceptual design”. This limitation or constraint may be viewed as
a detriment during conceptual design.
My research goal was to predict and affect individuals’ tendency for design fixation. I explored
the use of the Need for Closure Scale, an individual difference variable developed by Arie
Kruglanski, for this purpose. Kruglanski (1990) described Need for Closure as a desire for “an
answer on a given topic, any answer”, which I believed to be relevant to design fixation.
I anticipated that individuals with high Need for Closure would be more likely to fixate, and
devised three experiments (including a pilot experiment) to study the effect of both dispositional
and environmental Need for Closure on design fixation.
This thesis is structured into the following chapters:
Chapter 1: A review of relevant research in design fixation and Need for Closure.
Chapter 2: An outline of the research goals and terminology used in this thesis.
Chapter 3: Reporting of Experiment 1, which focused on the effect of dispositional Need for
Closure on design fixation.
Chapter 4: Reporting of pilot experiment for Experiment 2, which studied the effects of
environmental Need for Closure on design fixation.
Chapter 5: Reporting of Experiment 2, which studied the effects of both dispositional and
environmental Need for Closure (i.e. total Need for Closure) on design fixation.
Chapter 6: Conclusion and discussion of the implications of the results.

2
Literature review
1.1 Design fixation
1.1.1 Classification and definition
Youmans and Arciszewski (2014) highlighted the challenge to researchers of inconsistent
definitions of design fixation. They classified design fixation phenomena as: unconscious
adherence, conscious blocking, and intentional resistance. Unconscious adherence deals with a
designer unaware of being influenced by prior designs, conscious blocking occurs when a designer
becomes aware of his or her fixation, and intentional resistance is anecdotally, not “fixing what
isn’t broken” (Youmans & Arciszewski, 2014). Youmans and Arciszewski (2014) proposed an
updated definition of design fixation as “limitations in the inventive design process that occur
when designers are biased towards, or are consciously or unconsciously influenced by, a set of
conceptual ideas or a previous body of knowledge”.
1.1.2 Contributing factors
Many researchers have worked to identify factors that contribute to design fixation. Purcell and
Gero (1996) conducted a study using Jansson and Smith (1991)’s car bike-rack problem and found
no evidence of fixation, except for one feature of a pictorial fixating example, noting that fixation
may depend on familiarity with an example. Tseng et al. (2008) manipulated information type and
timing to study resulting effects on fixation. Viswanathan and Linsey discussed the roles in fixation
of physical modeling as a sunk cost (2011) and of expertise (2013). Crilly (2015) interviewed
professional designers, who despite being aware of design fixation and ways to avoid it, conceded
that fixation is difficult to overcome. Vasconcelos and Crilly (2016) reviewed 25 studies on
inspiration and fixation, in which 14 experimental variables were manipulated. Other researchers
have examined the effects of representation of fixation as well as the fixating example. For
example, Zahner et al. (2010) and Dong and Sarker (2011) studied the differing levels of
representation/abstraction involved in fixation. Cheng et al. (2014) presented photographs of full
versus partial examples for a design problem, and found that those presented with partial
photographs fixated less. Toh et al. (2015) reported the effect of ownership bias during concept

3
selection, and specifically a gender difference where more males than females tended to select
their own ideas during concept selection.
Atilola et al. (2016) explored the effects of differing representations of a fixating example. The
fixating design example took on different forms: a sketch, function tree, and a combination of both.
Atilola et al. (2016) found among their results that the mean number of repeated example features
(where higher means more fixated) were highest in the combination group, followed by sketch,
function tree, and control groups. Atilola et al. (2016) concluded that the use of function tree
representation was not fixation-inducing in a design problem application.
1.1.3 Overcoming fixation
Efforts towards overcoming design fixation have been reported by several researchers including:
Chrysikou and Weisberg (2005) instructing participants to avoid problematic elements in an
example; Kohn and Smith (2009) using incubation and distraction; Youmans (2011) and Kershaw
et al. (2011) using prototyping and critical feedback; Smith and Linsey (2011) adding hints and
clues; Moreno et al. (2014) using analogies; Tsenn et al. (2014) using incubation; and Toh et al.
(2014) using product dissection, further discussed below.
Toh et al. (2014) studied the relationship between product dissection activities on design fixation
as well as individual personality attributes on the product dissection process, in a team-based, first-
year engineering design classroom setting. Tasked with “redesigning an electric tooth-brush for
increased portability”, participants were allotted 90 minutes to dissect various Oral-B electric
toothbrushes (Toh, et al., 2014). A week later, participants were asked to individually generate
toothbrush concepts. Toh et al. (2014) found that those with exposure to more parts in the dis-
section activity generated more ideas and noted that extraverted individuals dissected more brush
head parts. Toh et al. (2014) thus postulated that certain personality traits may play a role in the
amount of fixation experienced and the number of ideas generated. Overall, undergraduate
students exposed to more parts in the product-dissection activity generated less fixated and more
ideas when subsequently redesigning the product.

4
1.2 Need for Closure
1.2.1 Dispositional Need for Closure measurement and validation
Kruglanski and Webster (1993) devised a formal measure of dispositional Need for Closure.
Known as the Need for Closure Scale, it includes five different subscales: 1) order and structure,
2) ambiguity, 3) decisiveness, 4) predictability, and 5) close-mindedness. The Need for Closure
Scale consists of 42 questions scored on a 6-point scale, for a total Need for Closure score range
of 42 (low) – 252 (high). Those with high Need for Closure generally have: preference for order
and structure, discomfort with ambiguity, high decisiveness of judgments, desire for predictability,
and high close-mindedness, while those with low Need for Closure have the opposite
characteristics.
The Need for Closure Scale was validated by Webster and Kruglanski (1994), receiving high
internal consistency in groups of n = 281 (Cronbach's α = .84) and n = 172 (Cronbach's α = .84).
Test-retest reliability was also high (r = .86).
High Need for Closure corresponds to a desire to attain closure quickly, which may manifest as
frantic “seizing” upon relevant cues to come to a quick evaluation, followed by “freezing” or
protecting that evaluation (Kruglanski & Webster, 1996). Plaks (2011) described those with high
Need for Closure as more likely to make snap judgments, while those with low Need for Closure
(or high need to avoid closure) may have enormous difficulty in forming judgments (e.g., deciding
what to order from a restaurant menu). Need for Closure is an individual difference (dispositional)
variable, as well as an environmental variable that can be manipulated in the laboratory.
1.2.2 Environmental Need for Closure manipulation
Kruglanski and Fishman (2009) reported that Need for Closure may be environmentally
manipulated, at least temporarily. For example, Need for Closure can be heightened in time-
pressure situations that require immediate decisions. Mayseless and Kruglanski (1987) studied
environmental Need for Closure. They asked participants to list as many as possible hypotheses
for the identity of everyday objects presented in photographs. These photographs were enlarged to
a point where the identity of the objects was unclear. Participants in the high Need for Closure
condition were told that reaching firm decisions is an indication of general intelligence. Those in

5
the low Need for Closure condition were told that correct visual identification is an indication of
general intelligence. The number of hypotheses produced, from highest to lowest, came from the
low Need for Closure group, a control group, and the high Need for Closure group.
1.2.3 Short form of the Need for Closure Scale
Researchers have developed other versions of the NFC Scale. Roets and Van Hiel (2007)’s revised
41-item NFC Scale used an alternative set of six questions for the decisiveness subscale; the
original scale has seven questions. This revised 41-item NFC Scale’s decisiveness subscale had a
correlation to the original decisiveness subscale of r = .21 (p < .05, n = 164). Roets and Van Hiel
(2011) then developed a 15-item version of the NFC Scale, which was significantly correlated with
their revised 41-item NFC Scale (r = .95, p < .001, n = 1584). Test-rest reliability was r = 0.79 (n
= 93) for the 15-item scale, and r = .87 (n = 93) for the 41-item scale.
1.3 Relationship between design fixation and Need for Closure
There were many parallels to design fixation found in Kruglanski and Webster (1993)’s Need for
Closure Scale statements such as: “When trying to solve a problem I often see so many possible
options that it's confusing”, “I do not usually consult many different options before forming my
own view”, and “When faced with a problem I usually see the one best solution very quickly”.
Hallihan et al. (2012) (2013) found that confirmation bias (which can contribute to design fixation)
can lead designers to “ignore or discount factual contradictory information” and “fixate on initial
(confirmed) ideas”. Confirmation bias is similar to Kruglanski and Webster’s (1996) explanation
of “seizing” and “freezing” in high Need for Closure.

6
Terminology and research goals
2.1 Terminology and nomenclature
The 42-item Need for Closure Scale as devised by Kruglanski and Webster (1993) measures
dispositional Need for Closure, and will be referred to as the NFCd Scale in this thesis. Need for
Closure can also be manipulated environmentally, i.e., increased using time pressure (Kruglanski
& Freund, 1983), environmental noise (Kruglanski & Webster, 1993), and dullness of the task
(Webster, 1993).
Hereafter, I use NFC with the subscripts d, and e to denote dispositional, and environmental Need
for Closure, respectively.
In subsequent sections, I use the term “participant” to refer to actual participants of the
experiments, and the term “individual” to refer to any given individual of a population, e.g., when
interpreting model results. In Experiment 2, I introduce the term “worker” (i.e. Amazon
Mechanical Turk worker), which is distinguished from “participant” in that participants are
workers who completed the experiment as intended. This is to account for the fact that data from
Amazon Mechanical Turk workers can be rejected when they submit poor work, complete a task
faster than is reasonably possible, etc. (Mason & Suri, 2012).
Reoccurring terminology and nomenclature are outlined in Table 1.

7
Table 1: Terminology and nomenclature
NFC Need for Closure
NFCd dispositional Need for Closure
NFCe environmental Need for Closure
participant actual participants of experiments
individual any given individual of a population, e.g., when interpreting model results
worker Amazon Mechanical Turk worker, only participant if work is accepted
(Experiment 2 only)
2.2 Research goals
In Experiment 1, my aim was to investigate if there exists a relation between NFCd as measured
by the NFCd Scale and individual tendency for design fixation. I sought to answer the following
research question:
1) Is an individual’s tendency to fixate during concept generation affected by NFCd?
In the two subsequent studies, the pilot experiment and Experiment 2, my aim was to investigate
whether NFCe has an effect on individual tendency for design fixation. I sought to answer the
following two research questions:
2) Is an individual’s tendency to fixate during concept generation affected by NFCe? (Pilot
experiment and Experiment 2)
Answering these questions would assist in the determination of the validity of NFC as a tool to
predict and affect individual tendency for design fixation.

8
Experiment 1: NFCd and tendency for design fixation
The first experiment, previously reported in Lai and Shu (2016), aimed to study the relationship
between NFCd and tendency for design fixation.
3.1 Participants
Following approval by the University of Toronto Research Ethics Board, 29 participants were
recruited from a fourth-year undergraduate engineering design course. This course covers topics,
e.g., design fixation and design for resource conservation, which may affect the results of the study.
Therefore, Experiment 1 was scheduled before these topics were introduced in the course.
Participants included students studying mechanical engineering, industrial engineering, and
engineering science. Of the 29 participants, 22 were male and 7 were female.
3.2 Method
Experiment 1 was completed during a regularly scheduled 3-hour laboratory session, entitled
“Creativity exercises” on the course syllabus. The experiment consisted of two parts: Participants
1) completed Kruglanski et al. (1993)’s NFCd Scale, and 2) developed concepts intended to reduce
the amount of time that users spent running water in a shower.
3.2.1 Location
Instead of the regular laboratory room, the experiment took place in a computer classroom, with
computer stations fixed in five rows, all facing the front of the room. Participants were seated with
at least one empty computer station between them to reduce their ability to see others’ computer
monitors in the same row.
Upon entering the computer classroom, participants were given personal access codes in their
information packets. The information packet included instructions to visit the online website and
use their personal access codes to complete the prescribed tasks. The personal access codes were
non-identifying and enabled participants to anonymously complete the two parts of the experiment
tasks online.
9
3.2.2 Part 1: NFCd Scale
The NFCd Scale was implemented as an online questionnaire, where participants answered each
question by clicking on radio buttons corresponding to a Likert scale (see Appendix 1). Written
instructions included, "Read each of the following statements and decide how much you agree
with each according to your beliefs and experiences." Participants clicked a submit button at the
end of the questionnaire to move on to the next task. If they neglected to answer any questions,
they were instructed to return to those questions.
3.2.3 Part 2: Problem for concept generation
Participants were provided the shower design problem (Figure 1) and the Intatec shower (Figure
2) as an example solution. This problem was selected as participants were likely to be familiar
with the problem domain. I wrote the specific wording of the problem and added a background to
serve as framing for the intended home-use application. The Intatec shower was selected as an
example solution because of its differing appearance versus a traditional shower head and time-
based mode of operation. I believed that the replication of the time-based mode of operation was
a sign of design fixation or more specifically, intentional resistance, or not “fixing what isn’t
broken” (Youmans & Arciszewski, 2014).
Potential pitfalls of soliciting concepts for this problem were known due to the laboratory’s other
research on resource conservation (Srivastava & Shu, 2013). To address these known pitfalls, I
imposed restrictions on acceptable concepts, by excluding water aeration, and the use of
information, feedback, or automation as behavior-change strategies (see Figure 1 and Figure 2).

10
Figure 1: Design problem description provided to participants
Problem: Reducing water running time while showering
Background: California has declared a state of emergency due to severe drought conditions.
Governor Jerry Brown issued Executive Order B-29-15 on April 1, 2015, imposing a statewide
25% reduction in urban water usage.
Description: Your task is to design products that reduce the amount of time spent running
water while showering. Your solutions must not incorporate information, feedback or
automation. Water aeration is also not an acceptable solution. Information and feedback, such
as the information sign shown, can easily be ignored. Automated showers, such as the motion
sensor activated model shown below, take away user control and are susceptible to sensor
failures, malfunctions, and unintended activation.
A product that does not use information, feedback or automation is the Intatec shower panel
shown below. The Intatec shower panel is operated with a push button that activates a timed
water flow of approximately 15s.
Definitions:
Information: Tell the user about the problem and the benefits of change.
Feedback: The effect of the actions of the user is conveyed to the user.
Automation: Device performs actions for the user.

11
Figure 2: Examples provided to participants
Information sign Motion sensor activated shower
Intatec shower panel

12
3.2.4 Part 2: Concept generation and submission
The concept generation activity was also performed online, using canvases of 1000 by 600 pixels.
To supplement the written instructions, “Please draw your designs on the canvas below,” verbal
instructions provided additional details. For example, participants were told to click and hold the
left button of their workstation mouse to draw on the canvas, as well as to only draw one concept
per canvas. In addition, clicking the right mouse button opened a text box into which they could
type and save annotations for their concepts. A choice of 6 colors (black, blue, red, green, yellow,
gray) was available for both drawing and text input. Participants could also undo and redo drawing
and text-input actions before submitting their concepts.
While no explicit time limit was given for specific parts of the experiment, participants had up to
1 hour 15 minutes to complete both tasks (the usual duration of the laboratory until a mid-lab
break). Participants spent 50 – 75 minutes on the activities, during which they were instructed to
not communicate with other participants, and to raise their hands if they had any questions, which
I answered individually.
3.2.5 Experiment 1 debriefing
Participants were debriefed in a 15-minute session at the end of the 3-hour laboratory, following
activities unrelated to the experiment. Consistent with the ethics protocol, the debriefing consisted
of a short explanation of the NFCd Scale and my research question of whether NFCd is related to
design fixation. I also clarified that the activity did not affect their course grade, and then
distributed information letters requesting permission to use their data. All participants consented
to the use of their data in Experiment 1.
3.3 Evaluation of design fixation
I measured fixation relative to the provided Intatec shower example through degree of similarity
in 1) form and 2) function. This evaluation is similar to the work of Linsey et al., (2010) (2013)
(see Table 8) and Genco et al., (2012) (see Table 9), which compared participant concepts to
features of provided examples. Table 2 shows my fixation rating scheme, whose application I
demonstrate in Table 3 using three example concepts (Figure 3, Figure 4, and Figure 5).

13
Table 2: Fixation score rating scheme
Score Form Similarity Function Similarity
Similarity in appearance to Intatec
example. Fixating features include panel,
push button, but not showerhead.
Similarity in function (strategy) to Intatec
example, which discretizes (interrupts)
water flow through timed button.
1 Concept borrows no features from Intatec
and has novel form
Concept uses strategy other than discretized
flow (e.g., require work)
2 Concept borrows no features from Intatec
but looks like a conventional shower
Concept uses resource-based discretized
water flow (e.g., packetization of water as
in a camping shower)
3 Concept uses features similar, but not
identical, to Intatec (e.g., lever or other
timer instead of timed button)
Concept implements other time-based flow
i.e. “only on when needed” (e.g., pressure-
sensitive pad)
4 Concept uses at least one identical
feature to that used in Intatec
Concept uses an explicit countdown timer
(e.g., kitchen timer)
5 Concept solely uses (multiple) panel(s),
push button(s) as in Intatec
Concept uses timed device to provide water
flow for set time
Table 3: Evaluations of sample concepts
Participant ID
concept #/total
Form Similarity Score and
Reasoning
Function Similarity Score and
Reasoning
D
Concept 2 of 3
5/5, identical panel and push
button elements
5/5, water flow controlled by timed
button
I
Concept 3 of 8
3/5, pulling handle instead of
pushing button
5/5, water flow controlled by timed
button
J
Concept 1 of 8
1/5, no features from Intatec,
novel form
1/5, used neither timed nor discretized
flow as strategy
Figure 3 shows the second of three concepts, as submitted by participant D. For form similarity,
the concept was rated 5/5 because it used an identical panel housing and multiple push buttons.
Although the concept used multiple push buttons versus Intatec’s single button, it was still highly
similar in form. For function similarity, the concept was rated 5/5, as the buttons had to be
functionally identical (timed) push buttons for the concept to work. I treated the absence of explicit
notes to the contrary as the participant intending the same function for the same form on the Intatec.
In this case, while the participant did not explicitly state that the push button activates a timed
water flow, it was rated as such because of the absence of any alternative information.

14
Figure 3: Participant D, concept 2 of 3, similarity ratings: form 5/5, function 5/5; fixation
score 10/10
Figure 4 shows the third of eight concepts, as submitted by participant I. The concept rated 3/5 on
Form Similarity because of the similarity between pulling a handle and pushing a button, especially
given the explicit transfer of the 15-s timed water flow from the Intatec. The concept rated 5/5 on
Function Similarity as the timed-water flow uses the same strategy as the Intatec.
Figure 4: Participant I, concept 3 of 8: similarity ratings: form 3/5, function 5/5; fixation
score 8/10
Figure 5 shows the first of eight concepts, as submitted by participant J. The concept rated 1/5 on
form similarity because it does not borrow any features from the Intatec, and the “balloon spikes”
15
constitute a novel form. The repeated use of a showerhead was not counted in form similarity. The
concept rated 1/5 on function similarity as it does not use discretized (interrupted) water flow as a
resource-conserving strategy. Rather, it aimed to decrease user comfort via “balloon spikes,”
which increasingly inflate as the shower runs.
Figure 5: Participant J, concept 1 of 8, similarity ratings: form 1/5, function 1/5; fixation
score 2/10
In total, the 29 participants generated 110 concepts. Two raters, myself and a second rater, both
rated all 110 concepts. Concepts were rejected if they did not follow the instructions stipulated in
the problem description. Examples of rejected concepts include showers using aeration, and only
information and/or automation as resource-conserving strategies. I accepted 88 concepts while the
second rater accepted 84 concepts, which were a subset of the 88 concepts accepted by myself.
The two components of rating for each concept, form similarity and function similarity, were
summed into a combined similarity, or fixation score. The inter-rater reliability of the fixation
scores of the 84 concepts accepted by both raters was calculated as Krippendorff's α (ordinal) =
0.798, marginally below α ≥ 0.8, which corresponds to perfect agreement (Krippendorff, 2004).
Given this high level of agreement, further statistical analyses were conducted using my ratings
for my 88 accepted concepts.

16
3.4 Results
I analyzed the relationship between participants’ NFCd and fixation scores at both group and
individual levels. At the group level, I assigned participants to two groups based on their NFCd
scores and investigated whether a difference in fixation scores existed between the groups using a
Wilcoxon Rank-Sum test. At the individual level, I used ordinal logistic regression to identify
trends between participants’ NFCd and fixation scores.
3.4.1 Observations
Figure 6 shows a histogram of participants’ NFCd scores. The range was 107 – 196, the mean
was 157.24, and the standard deviation was 21.31.
Figure 6: Histogram of NFCd scores of participants
Figure 7 and Figure 8 plot as functions of participants’ NFCd scores, 1) fixation scores for each
accepted concept, and 2) mean fixation score of accepted concepts per participant. A preliminary
assessment was conducted using the Kendall Tau-b test, which assesses the similarity of ranking
order between pairs, adjusting for ties. The Kendall Tau-b coefficient τb ranges from -1 (perfect

17
negative association) to +1 (perfect positive association). I obtained a significant Kendall’s rank
correlation of τb = 0.26 (Z = 3.27, p = 0.001) for Figure 7, which indicates a weak positive
correlation between participants’ NFCd and their accepted-concepts’ fixation scores. Kendall Tau-
b τb = 0.21 (Z = 1.60, p = 0.11) for Figure 8 indicates a non-significant weak positive association
between participants’ NFCd and their accepted-concepts’ mean fixation scores.
Figure 7: Fixation scores of accepted concepts vs. NFCd
Figure 8: Mean fixation scores of accepted concepts per participant vs. NFCd

18
3.4.2 Group comparison: low NFCd vs. high NFCd
Table 4 shows participants placed in low versus high NFCd groups based on their NFCd score,
using a mean split. Participants who scored below the mean of 157.24 were placed in the low NFCd
group, and the remaining were placed in the high NFCd group. I used the mean fixation scores of
participants’ concepts to meet the Wilcoxon Rank-Sum test assumption of independent samples.
In addition, the ordinal nature of fixation scores did not violate Wilcoxon Rank-Sum test
assumption of non-nominal values. The mean fixation scores of participants’ concepts in the low
NFCd and high NFCd groups were 5.90 and 7.56, respectively.
I used a mean instead of a median split as there were 29 participants/data points and I wanted to
avoid removing 2 data points (two participants had a NFCd score of 159 which was the median).
As a non-parametric technique, the Wilcoxon Rank-Sum test is also inherently more conservative
compared to parametric techniques. Previously published analyses involving the NFCd Scale have
used both mean (Holbert & Hansen, 2006) and median splits (Kardes, et al., 2007).
Table 4: Wilcoxon Rank-Sum test groups
Low NFCd High NFCd
Number of participants, n 16 13
Mean NFCd score 142.88 174.92
Mean participants’ concept fixation scores 5.90 7.56
The Wilcoxon Rank-Sum test revealed significant differences in the mean fixation scores of
concepts between participants in the low NFCd and high NFCd groups (Wilcoxon W = 243.50, Z
= -2.11, mfixationscore1(high) = 7.56, mfixationscore2(low) = 5.90, n1 = 13, n2 = 16, p < 0.05, r = 0.39, two-
tailed). The effect size was r = 0.39, corresponding to a medium effect.
I also tested for, but did not find, significant differences in neither NFCd scores (Z = 0.48, p =
0.63, r = 0.09) nor fixation scores (Z = -0.92, p = 0.36, r = 0.17) by gender in the 29 participants
(7 female and 22 male). The female group had mean NFC score of 160.29 and mean fixation score
of 6.13/10. The male group had mean NFC score of 156.27 and mean fixation score of 6.80/10.

19
3.4.3 Comparing individual differences (NFCd)
Figure 9: Histogram of participants' concept fixation scores
Figure 10: Histogram of participants’ concept fixation score categories

20
As the fixation metric is an ordinal variable, i.e., has two or more ordered/ranked categories, I used
ordinal logistic regression analysis. This regression is used to predict an ordinal dependent variable
given one or more independent variables, and can also use interactions between independent
variables to predict the dependent variable (McCullagh, 1980). I selected participants’ NFCd scores
as the predictor (independent) variable and fixation score of participants’ concepts as the outcome
(dependent) variable. Fixation scores ranged from 2 (least fixated) to 10 (most fixated). Figure 9
shows a histogram of the obtained fixation scores. Because of this large range of possible fixation
scores, I condensed it into three categories for ease of interpretation: low, medium, and high
fixation. Low fixation comprised of concepts with fixation scores of 2-4, while medium fixation
comprised of concepts with fixation scores of 5-7, and high fixation comprised of concepts with
fixation scores of 8-10. Figure 10 shows the histogram of the concepts using the three fixation
score categories.
Because participants produced multiple concepts, the data consisted of repeated measures. I
therefore used generalized estimating equations (GEE) for the model, which was fitted using
PROC GENMOD in SAS 9.1, with further specifications of cumlogit link function and
multinomial distribution. Table 5 shows significant effects for the predictor variable NFCd (log
odds ratio = 0.0243, χ2(1) = 3.90, p < 0.05), which is equivalent to an odds ratio of 1.025 (exp
(0.0243)). This means that if an individual’s NFCd increases by 1 point, there is 1.025 increased
odds that individual’s concept will have a higher fixation score relative to the contiguous lower
fixation score. Table 6 further expands upon this by showing the corresponding probabilities for
an individual’s concept to have a higher fixation score category relative to the contiguous lower
fixation score category for a 1, 5, 10, and 20-unit increase in NFCd score.
I assessed the validity of the model using a likelihood-ratio test, which was significant at the 0.05
level (χ2(1) = 6.24, p = 0.0125).
Table 5: Log odds ratio for increase by one in NFCd score on fixation score
Log Odds Ratio 95% Confidence Interval Wald Test (Type 3)
0.0243 0.0002 – 0.0483 χ2(1) = 3.90, p = 0.048*
*p < .05
21
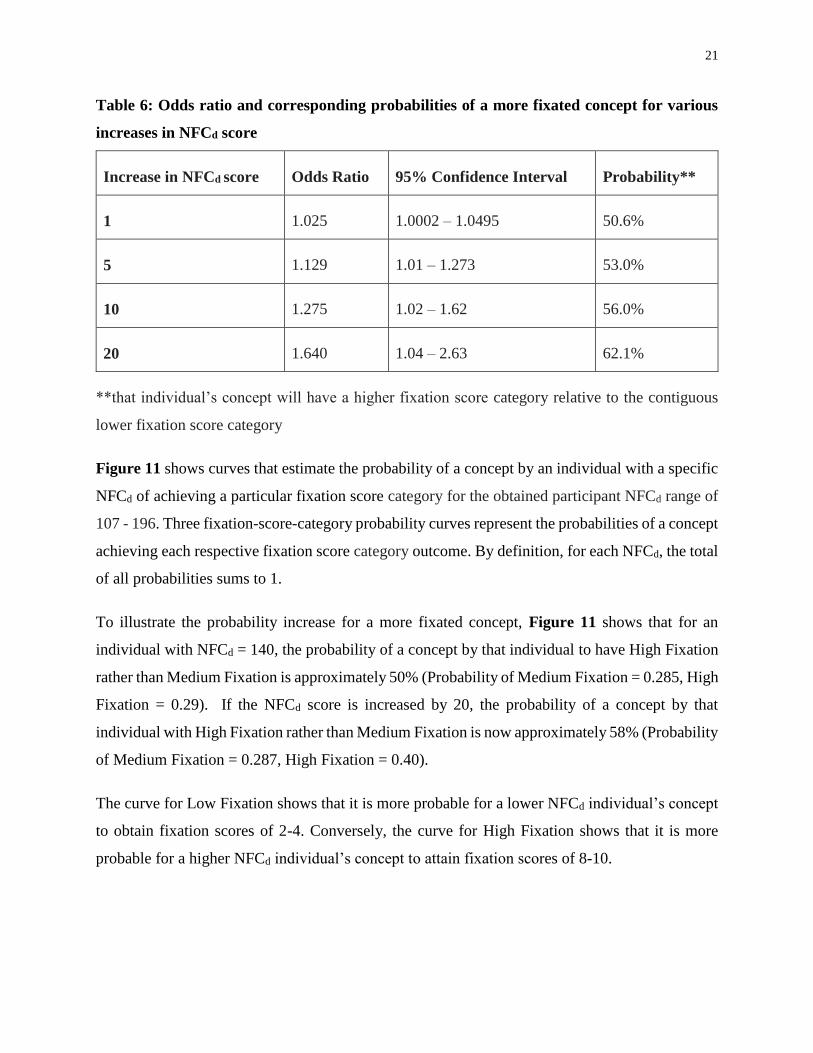
Table 6: Odds ratio and corresponding probabilities of a more fixated concept for various
increases in NFCd score
Increase in NFCd score Odds Ratio 95% Confidence Interval Probability**
1 1.025 1.0002 – 1.0495 50.6%
5 1.129 1.01 – 1.273 53.0%
10 1.275 1.02 – 1.62 56.0%
20 1.640 1.04 – 2.63 62.1%
**that individual’s concept will have a higher fixation score category relative to the contiguous
lower fixation score category
Figure 11 shows curves that estimate the probability of a concept by an individual with a specific
NFCd of achieving a particular fixation score category for the obtained participant NFCd range of
107 - 196. Three fixation-score-category probability curves represent the probabilities of a concept
achieving each respective fixation score category outcome. By definition, for each NFCd, the total
of all probabilities sums to 1.
To illustrate the probability increase for a more fixated concept, Figure 11 shows that for an
individual with NFCd = 140, the probability of a concept by that individual to have High Fixation
rather than Medium Fixation is approximately 50% (Probability of Medium Fixation = 0.285, High
Fixation = 0.29). If the NFCd score is increased by 20, the probability of a concept by that
individual with High Fixation rather than Medium Fixation is now approximately 58% (Probability
of Medium Fixation = 0.287, High Fixation = 0.40).
The curve for Low Fixation shows that it is more probable for a lower NFCd individual’s concept
to obtain fixation scores of 2-4. Conversely, the curve for High Fixation shows that it is more
probable for a higher NFCd individual’s concept to attain fixation scores of 8-10.

22
Figure 11: Experiment 1 probability distribution plots for fixation scores by NFCd
Note: Low Fixation (Fixation Scores = 2-4), Medium Fixation (Fixation Scores = 5-7), High
Fixation (Fixation Score = 8-10)
3.5 Discussion: effect of NFCd on design fixation
In the first statistical analysis, participants were divided into two groups, low NFCd and high NFCd
based on a mean split of their NFCd scores. A Wilcoxon Rank-Sum test confirmed significant
differences between the mean fixation scores of participants’ concepts in the low versus high NFCd
groups. Specifically, the high NFCd group had a higher mean fixation score than the low NFCd
group.
In the second statistical analysis, ordinal logistic regression was used to create a model of
participants’ NFCd and the degree of fixation of their concepts. This model showed that an
individual’s tendency to fixate on the provided example for the concept generation problem
increased with increased NFCd. Specifically, an increase by 20 in an individual’s NFCd score is

23
associated with an odds ratio of 1.64 or 62.1% probability that a concept by that individual to be
rated a higher fixation score category relative to the contiguous lower fixation score category.
The results support my hypothesis of a relationship between NFCd and design fixation, and relate
to differences in design fixation observed by other researchers. For example, Purcell and Gero
(1996) asked mechanical engineering and industrial design students to develop concepts that assist
elderly people in and out of a bathtub, and provided an Autofit fixating example. Of the Autofit’s
12 detail features, the mechanical engineering students fixated on 8, while the industrial design
group fixated on 3. Purcell and Gero (1996) offered a potential explanation as “differences in
educational processes in the two disciplines” where industrial design “emphasizes creativity and
difference”. This difference may correspond to educations that attract and/or encourage higher
NFCd in mechanical engineers and lower NFCd in industrial designers.
Toh et al. (2014) inversely related fixation with the number of parts examined during product
dissection, and noted that extraverts examined more parts. Combined with the results, there may
also be a relationship between NFCd and introversion versus extraversion.
Overall, the results were sufficiently promising towards identifying a link between NFCd and
design fixation. This warranted further studies in NFC, particularly in NFCe.

24
Pilot Experiment: NFCe and tendency for design fixation
Experiment 1’s results showed that NFCd may be potentially used to predict an individual’s
tendency for design fixation. In the study, participants’ NFCd scores were significantly correlated
with their concepts’ design fixation scores in an intuitive manner – higher NFCd scores
corresponded to higher fixation scores, and vice versa.
I wanted to study the effects of NFCe in a pilot experiment. The rationale behind this was that
NFCe manipulation could be a potential mitigation tool for fixation.
4.1 Participants
Following approval by the University of Toronto Research Ethics Board, 27 participants (19 male
and 8 female) were recruited from a fourth-year undergraduate engineering design course. These
participants were students in mechanical engineering, industrial engineering, or engineering
science.
Of the 27 participants, 24 had participated in Experiment 1. The 3 new participants (2 male and 1
female) were absent from the previous experiment but received identical instruction on design
fixation in lecture.
4.2 Method
4.2.1 Formation of groups prior to experiment
In the pilot experiment, I organized the participants into two groups – Taboo-round1 and Taboo-
round2. The groups were similar in size and mean NFCd score (measured during the previous
experiment using the 42-item NFCd Scale) to better detect possible effects of NFCe. The Taboo-
round1 group had 14 members (10 male and 4 female) and a mean NFCd score of 154.9 (42-item

25
NFCd Scale, for 13 previously tested members). The Taboo-round2 group had 13 members (9 male
and 4 female), with a mean NFCd score of 149.9 (42-item NFCd Scale, for 11 previously tested
members). A small difference in mean NFCd score remained between the two groups because some
students were unexpectedly absent from the scheduled course laboratory during which the
experiment was conducted.
4.2.2 Game of Taboo
I used the group-based game of Taboo in the pilot experiment to induce NFCe. In Taboo, a player
is given a card with a target word and five forbidden words, and within a time limit, must give
clues (verbal, visual, etc.) without using any of the forbidden words and target word, to other
players who then attempt to guess the target word. To reduce potential ignorance of the Taboo
target words, I developed Taboo cards that used material from the undergraduate engineering
design course from which the participants were recruited.
4.2.3 Experimental conditions and relation to NFCe
The pilot experiment had two conditions – intervention and control – that both groups underwent.
In the control condition, participants were given written instructions to individually, without
consulting their group, generate as many concepts as possible with each concept on a separate
sheet of paper. The group in the intervention condition had the same written instructions with the
addition of the Taboo game. The participants in the intervention condition were allowed to
communicate only for the purposes of organizing strategies for the Taboo game. They were
informed that they could submit concepts at any point to obtain a Taboo card for the group. In
practice, a group/game leader solicited completed concepts from their group in return for a Taboo
card. Concepts from the group could be submitted in quantities of 1-6 at a time, with more
simultaneously submitted concepts earning more time during the corresponding Taboo game round

26
(see Table 7). Following concept submission, the group leader would have 15 seconds to first
inspect the Taboo card before using the allotted time to give clues to the group. If the group guessed
the target word within the allotted time and rules, they would receive 1 point and 0 otherwise.
Overall, the group with more points would win.
From a NFC viewpoint, I anticipated that the Taboo game would be engaging to the participants
because of the novelty and competitive nature of the activity. However, the time pressure to
constantly submit concepts to keep the game going would potentially induce heightened NFCe in
the intervention group.
Table 7: Allotted Taboo game-round time per number of submitted concepts
# Concepts submitted at same time Allotted time
1 concept 10 seconds
2 concepts 12 seconds
3 concepts 16 seconds
4 concepts 20 seconds
5 concepts 25 seconds
6 concepts (MAX) 30 seconds
4.2.4 Implementation
The experiment took place in the last hour of a regularly scheduled three-hour laboratory in the
course previously described. The laboratory room had a black curtain that could be used to divide
the room in half, allowing for visual but not audio separation.

27
I first instructed all participants on how to play the game of Taboo through an example. The
participants were then given individualized sheets containing their group number and secret
identifier code to enable anonymity. I asked participants to separate into the two previously
organized groups on opposite sides of the laboratory room. The room’s curtain system was then
drawn to visually separate the two groups. I then handed participants written instructions and blank
concept submission sheets.
The pilot experiment consists of three parts: Participants 1) generated concepts for a peanut-sheller
problem, 2) generated concepts for an alarm clock problem, and 3) completed the 15-item NFCd
Scale (Roets & Van Hiel, 2011).
Parts 1 and 2 took 20-minutes each. In part 1, Taboo-round1 had the intervention condition and
Taboo-round2 had control condition, while in part 2, Taboo-round2 had the intervention condition
and Taboo-round1 had the control condition. I had to use different design problems than
Experiment 1 because 24 of the 27 participants were already aware of the problem from completing
Experiment 1 and the experiment design required two problems.
4.2.5 Part 1: Round 1 - Peanut-sheller problem
The peanut-sheller problem (Linsey, et al., 2010) (Viswanathan & Linsey, 2013) is shown in
Figure 12.

28
Figure 12: Problem 1 – Device to shell peanuts (Linsey et al., (2010) (2013))
4.2.6 Part 2: Round 2 - Alarm-clock problem
The alarm-clock problem was adapted from Genco, et al. (2012) and shown in Figure 13. The
problem originally used physical examples and I provided pictorial representations based on the
Problem Description:
In places like Haiti and certain West African countries, peanuts are a significant crop. Most
peanut farmers shell their peanuts by hand, an inefficient and labor-intensive process. The goal
of this project is to design and build a low-cost, easy to manufacture peanut shelling machine
that will increase the productivity of the African peanut farmers. The target throughput is
approximately 50 kg (110 lbs) per hour.
Customer Needs:
Must remove the shell with minimal damage to the peanuts.
Electrical outlets are not available as a power source.
A large quantity of peanuts must be quickly shelled.
Low cost.
Easy to manufacture.
Example: This system uses a gas-powered press to crush the peanut’s shell. The shell and the
peanut then fall into a collection bin.

29
authors’ descriptions of the clocks: "The first alarm clock had a beeping alarm, a digital lit display,
buttons for input, a back-up battery in addition to an electric plug, and a snooze button. The second
alarm clock was a simple analog clock, with a beeping alarm, a wall plug, dials for input and no
snooze feature. Neither clock had the capability of playing music or performing any other
functions.” (Genco, et al., 2012).
Figure 13: Problem 2 - Alarm clock (Adapted, (Genco, et al., 2012)
Problem Description: Assume that you are working for a design company. A client has asked
your design company to design a next-generation alarm clock.
Examples:
This alarm clock has a beeping alarm, a
digital lit display, buttons for input, a back-
up battery in addition to an electric plug,
and a snooze button.
This analog alarm clock has a beeping
alarm, a wall plug, dials (on reverse of
clock) for input, but does not have snooze
feature.

30
4.2.7 Part 3: 15-item NFCd Scale
After the two rounds of concept generation, all participants completed the 15-item NFCd. I chose
the 15-item NFCd Scale because of time constraints, and used it to exclusively determine the NFCd
score for those who did not participate in Experiment 1.
I compared NFCd scores measured using the 15-item NFCd Scale and the 42-item NFCd Scale for
the 24 participants who took part in both Experiment 1 and the pilot (see Figure 14). I multiplied
the scores from the 15-item NFCd Scale by 2.8 to facilitate comparison with the 42-item NFCd
Scale scores. The Pearson product-moment correlation coefficient, which measures the strength of
linear association from -1 to +1, was calculated to be r = 0.55. I concluded that since r = 0.55 is a
large strength of association, the measure of NFCd using the 15-item NFCd Scale was valid.
Figure 14: 15-item NFCd Scale vs 42-item NFCd Scale (24 observations)

31
4.2.8 Debrief
After the experiment, participants were debriefed and provided information letters requesting
permission to use their data. All participants consented to the use of their data in the pilot
experiment.
4.3 Results
4.3.1 Fixation evaluation
I measured fixation relative to the provided examples using evaluation criteria developed by the
problems’ respective authors. For the peanut-sheller problem, I used evaluation criteria developed
by Linsey et al. (2010) (2013). For the alarm-clock problem, I used the conformity score metric
developed by Genco et al. (2012). In both evaluation schemes, concepts received a score of 1 or 0
on each criterion, with 1 indicating a feature shared with the example solution, and 0 indicating a
differing feature. Table 8 shows the peanut-sheller fixation-rating scheme, and Table 9 shows the
alarm-clock fixation-rating scheme. I refer hereafter to the total scores obtained from using these
evaluation schemes as fixation scores.
Table 8: Peanut-sheller fixation rating scheme (Linsey et al., (2010) (2013)).
Function Solution from Example
(Material)
Guide Sloped surface, conveyor
Import Hopper
Position Table legs
Remove (Shell) Crushing plates
Store Bin
Separate (nut and shell) Grate
(Energy)
Convert Gas press
32
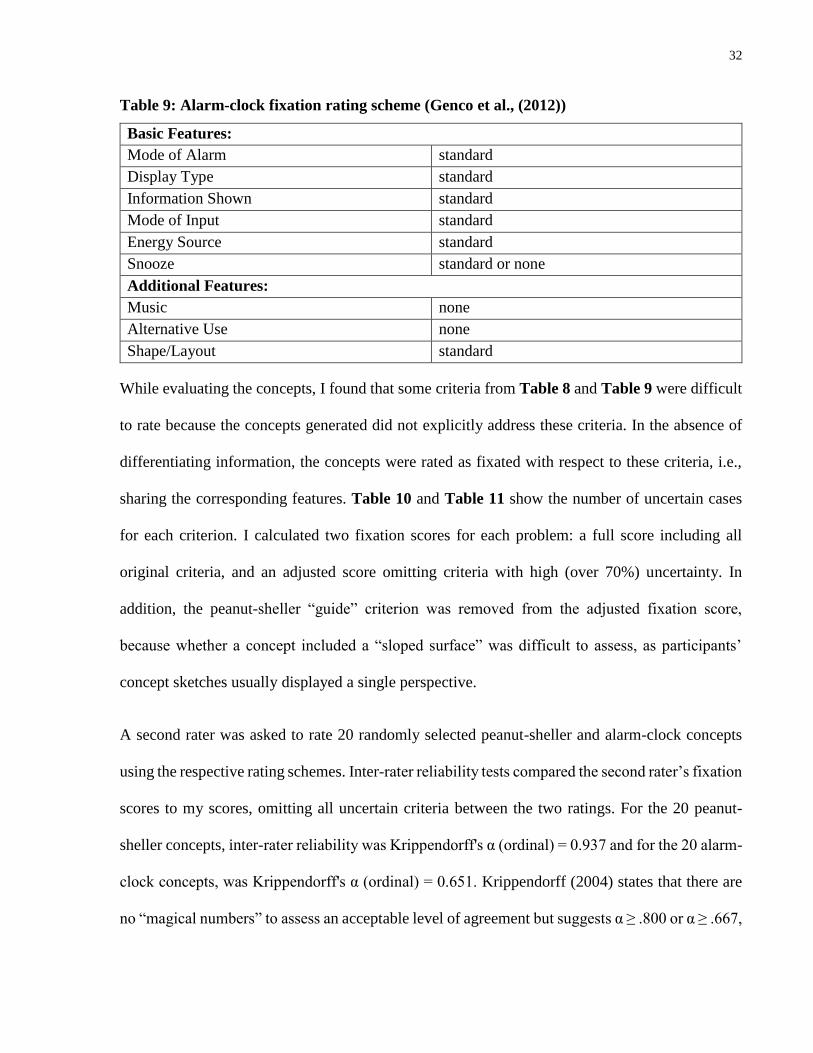
Table 9: Alarm-clock fixation rating scheme (Genco et al., (2012))
Basic Features:
Mode of Alarm standard
Display Type standard
Information Shown standard
Mode of Input standard
Energy Source standard
Snooze standard or none
Additional Features:
Music none
Alternative Use none
Shape/Layout standard
While evaluating the concepts, I found that some criteria from Table 8 and Table 9 were difficult
to rate because the concepts generated did not explicitly address these criteria. In the absence of
differentiating information, the concepts were rated as fixated with respect to these criteria, i.e.,
sharing the corresponding features. Table 10 and Table 11 show the number of uncertain cases
for each criterion. I calculated two fixation scores for each problem: a full score including all
original criteria, and an adjusted score omitting criteria with high (over 70%) uncertainty. In
addition, the peanut-sheller “guide” criterion was removed from the adjusted fixation score,
because whether a concept included a “sloped surface” was difficult to assess, as participants’
concept sketches usually displayed a single perspective.
A second rater was asked to rate 20 randomly selected peanut-sheller and alarm-clock concepts
using the respective rating schemes. Inter-rater reliability tests compared the second rater’s fixation
scores to my scores, omitting all uncertain criteria between the two ratings. For the 20 peanut-
sheller concepts, inter-rater reliability was Krippendorff's α (ordinal) = 0.937 and for the 20 alarm-
clock concepts, was Krippendorff's α (ordinal) = 0.651. Krippendorff (2004) states that there are
no “magical numbers” to assess an acceptable level of agreement but suggests α ≥ .800 or α ≥ .667,

33
“where tentative conclusions are still acceptable”. The obtained α = 0.651 in the alarm-clock
concepts is marginally close to the suggested α ≥ .667 cut-off.
Table 10: Peanut-sheller problem - uncertain cases
Criteria Full
(PS7)
Adjusted
(PS4)
Uncertain Cases (# concepts unclear on
criterion/all concepts)
Guide X
54/106 (50.9%)
*unclear what constitutes “sloped surface”
(definition and also from concepts)
Import X
78/106 (75.6%)
Position X
89/106 (84.0%)
Remove (Shell) X X 1/106
Store X X 54/106
Separate (Nut & Shell) X X 52/106
Convert X X 42/106
Table 11: Alarm-clock problem - uncertain cases
Criteria Full
(AC9)
Adjusted
(AC7)
Uncertain Cases (# concepts
unclear on criterion/all concepts)
Mode of Alarm X X 39/135
Display Type X X 49/135
Information Shown X X 54/135
Mode of Input X 119/135 (88.1%)
Energy Source X 109/135 (80.7%)
Snooze X X 0/135
Music X X 0/135
Alternative Use X X 0/135
Shape/Layout X X 10/135

34
4.3.2 Observations
Figure 15 shows a histogram of participants’ NFCd scores as measure by the 15-item scale. The
range was 98 – 198.8, the mean was 154.62, and the standard deviation was 25.89.
Figure 15: Histogram of NFCd scores of participants
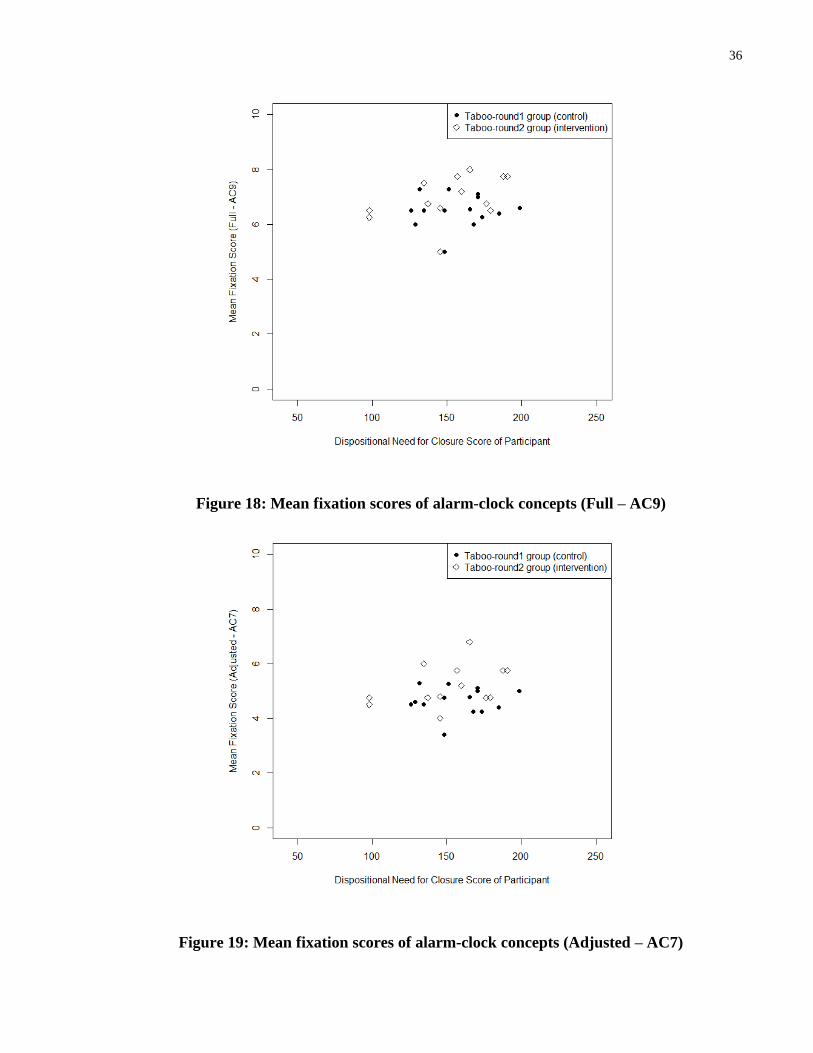
Figure 16, Figure 17, Figure 18, and Figure 19 plot the mean, full and adjusted, mean fixation
scores of each participants’ peanut-sheller and alarm-clock concepts as a function of NFCd for both
experimental groups.
For the peanut-sheller problem, it appeared that there were no differences in the full or adjusted
mean fixation scores between the two groups for. For the alarm-clock problem, the full and
adjusted mean fixation scores appeared to be higher for the intervention group compared to the
control group.

35
Figure 16: Mean fixation scores of peanut-sheller concepts (Full – PS7)
Figure 17: Mean fixation scores of peanut-sheller concepts (Adjusted – PS4)
36
Figure 18: Mean fixation scores of alarm-clock concepts (Full – AC9)
Figure 19: Mean fixation scores of alarm-clock concepts (Adjusted – AC7)

37
4.3.3 Condition differences
Table 12 shows the differences between the 2 groups for the two problems. The Mann-Whitney
U non-parametric statistical test was used to compare (ordinal) fixation scores of concepts by
participants of the intervention versus control groups.
For the peanut-sheller problem, the Mann-Whitney U test did not find significant differences in
the mean fixation scores of peanut-sheller concepts between participants in the intervention and
control groups (Full: Mann–Whitney U = 81.5, Z = -0.44, mTaboo-round2group(control) = 5.20, mTaboo-
round1group(intervention) = 5.10, n1 = 13, n2 = 14, p = 0.66, r = 0.016, two-tailed; Adjusted: Mann–
Whitney U = 90.5, Z = 0, mTaboo-round2 group(control) = 2.59, mTaboo-round1group(intervention) = 2.58, n1 = 13,
n2 = 14, p = 1, r = 0, two-tailed). Effect sizes of r = 0.016 and r = 0 were below the r = 0.10 cutoff
for a small effect.
For the alarm-clock problem however, the Mann-Whitney U test revealed marginally significant
differences in the mean fixation scores of alarm-clock concepts between participants in the
intervention and control groups (Full: Mann–Whitney U = 53.5, Z = -1.79, mTaboo-
round2group(intervention) = 6.95, mTaboo-round1group(control) = 6.49, n1 = 13, n2 = 14, p = 0.07, r = 0.34, two-
tailed; Adjusted: Mann–Whitney U = 55, Z = -1.72, mTaboo-round2 group(intervention) = 5.20,
mTabooround1group(control) = 4.65, n1 = 13, n2 = 14, p = 0.085, r = 0.33, two-tailed). Effect sizes of r =
0.34 and r = 0.33 corresponded to medium effects.

38
Table 12: Intervention vs. control condition differences
Taboo-round2 group Taboo-round1 group
n 13 14
Mean NFCd Score (NFCd C 42) 149.9 (missing 2 values) 154.9 (missing 1 value)
Mean NFCd Score (NFCd 15) 153.2 (missing 2 values) 154.0 (missing 1 value)
Mean NFCd Score (NFCd 15) 151.8 157.2
Total Number of Peanut-Sheller
Concepts 55 (no Taboo) 51 (Taboo)
Mean Fixation Scores – Full (PS7) 5.20 (no Taboo) 5.10 (Taboo)
Mean Fixation Scores – Adjusted (PS4) 2.59 (no Taboo) 2.58 (Taboo)
Total Number of Alarm-Clock
Concepts 48 (Taboo) 87 (no Taboo)
Mean Fixation Scores – Full (AC9) 6.95 (Taboo) 6.49 (no Taboo)
Mean Fixation Scores – Adjusted
(AC7) 5.20 (Taboo) 4.65 (no Taboo)
4.3.4 Comparing individual differences
Similarly to Experiment 1, I wanted to compare whether there was any relationship between
participants’ NFCd scores and the fixation scores of participants’. The 15-item NFCd Scale used in
the pilot experiment would only measure NFCd and not NFCe. Because of this, I anticipated that
an ordinal logistic regression analysis would result in no significant log odds ratios because NFCe
would be absent in the model.
Table 13 shows the log odds ratios obtained from each of the models using NFCd score as a
predictor for the four different fixation scoring metrics: peanut-sheller full (PS7), peanut-sheller
adjusted (PS4), alarm-clock full (AC9), and alarm-clock adjusted (AC7) (one model per scoring
metric).

39
Surprisingly, the log odds ratio obtained using the adjusted fixation score for the peanut-sheller
problem yielded a significant result. I believe this is because the peanut-sheller problem’s round
was executed ineffectively, further discussed in 4.4 Discussion.
Table 13: Log odds ratio for increase by one in NFCd Score on fixation score
Problem Rating Scheme
Used
Log Odds
Ratio Est.
95 %
Confidence
Interval
Wald Test (Type 3)
Peanut
Sheller PS7 – Full 0.0073 -0.0079 - 0.0226 χ2(1) = 0.89, p = 0.35
PS4 - Adjusted 0.0175 0.0016 - 0.0335 χ2(1) = 4.67, p = 0.03*
Alarm
Clock AC9 - Full 0.0064 -0.0080 - 0.0208 χ2(1) = 0.76, p = 0.38
AC7 - Adjusted 0.0074 -0.0063 - 0.0211 χ2(1) =1.12, p = 0.29
*p < .05
4.4 Discussion: effect of NFCe on design fixation
The primary focus of the pilot experiment was to investigate research question 2) Is an individual’s
tendency to fixate during concept generation affected by NFCe?
In round 1 (peanut-sheller problem), a Mann-Whitney U test did not find any significant
differences in the mean fixation scores of concepts between the control and intervention groups.
However, in round 2 (alarm-clock problem), there was a marginally significant difference.
I believe that in round 1, the manipulation of NFCe was not effectively executed (peanut-sheller
problem). An absence of the anticipated NFCe effect would remove differences between the
intervention and control conditions, and participants would perform according to their NFCd
scores. Because the two groups had similar mean NFCd scores, there would be no anticipated

40
differences in mean fixation scores of the concepts generated. Evidence towards this is the fact
that ordinal logistic regression of participants adjusted peanut-sheller fixation scores compared to
their NFCd yielded a significant log odds ratio (similar to in Experiment 1) while the ordinal
logistic regressions for the alarm-clock fixation scores did not.
The difference in the two conditions between rounds – intervention and control – occurred due to
the following reasons: differences in explanation of the experimental procedure, differences in
Taboo game engagement between groups, and learning effect. Although unplanned, there were
differences in how the participants perceived the experimental procedure between the two rounds.
In round 1, the Taboo-round1 group played the Taboo game but they were not told that the Taboo-
round2 group would not be playing the Taboo game in this round, or that there would even be a
second round at all. If the Taboo-round1 group believed that the Taboo-round2 group was playing
the Taboo game concurrently, the fact that Taboo-round2 group was instructed to be completely
silent throughout round 1 would have had an effect. In fact, this may have manifested in Taboo-
round1 group’s relaxed attitude while playing Taboo, where no concept submissions occurred until
the halfway point. In effect, my failure to properly communicate the experimental protocol may
have eliminated any sort of time pressure or urgency in the Taboo-round1 group, reducing the
planned NFCe effect. Furthermore, the Taboo-round2 group in round 1 was only given the control
instructions and may have spent some effort following the Taboo-round1 group, whom they could
hear. This distracting effect may have increased their NFCe as well, further reducing differences
in NFCe between the two groups.
In round 1, the Taboo-round1 group played the Taboo game 9 times, answering correctly 8 times,
with an average of 5.67 concepts per submission. In round 2, the Taboo-round2 group played the
Taboo game 23 times, answering correctly 13 times, with an average of 2.09 concepts per

41
submission. Taboo-round2 group also had the advantage of playing the game second, after having
heard the first group play, and was substantially different in their engagement in the Taboo game
activity. Additionally, they fully realized the competitive aspect of the experiment and emphasized
the need to win this competition, by generating concepts to submit in order to be able to play Taboo
games and earn points. Starting immediately at the beginning of the round, the Taboo-round2
group appointed one member of their group to be the almost exclusive Taboo game leader. There
was a more consistent solicitation for more concepts by the group in general. This frantic system
resulted in heightened time pressure in the members of the Taboo-round2 group to complete
concepts for submission. The heighted time pressure was much more apparent in round 2 as
evidenced by the more frequent submissions compared with Taboo-round1 group’s less frequent
submissions in round 1. Given this, I believe that round 2 was a more successful manipulation of
NFCe in the Taboo-round1 group through the Taboo game.
While this pilot experiment did not provide definitive evidence towards the notion that NFCe
affects individual tendency for fixation, the marginally significant results for the alarm-clock
problem and evidence towards an improper execution of the peanut-sheller problem warranted an
additional experiment. In addition, the pilot experiment provided many learning experiences in the
manipulation of NFCe such as not having intervention and control conditions in the same
environment, the use of the 15-item NFCd Scale as adding another factor of uncertainty, the use of
Taboo as perhaps too elaborate of a way to induce time pressure, and the need for another piece of
information in order to estimate NFCe.

42
Experiment 2: NFCd and NFCe and tendency for design fixation
Experiment 1 showed that individual differences in NFCd could be used to predict an individual’s
tendency for design fixation. I found that participants’ NFCd scores were significantly correlated
with their concepts’ design fixation scores, where higher NFCd scores corresponded to higher
fixation scores, and vice versa.
The pilot experiment attempted to test whether an individual’s tendency to fixate during concept
generation is affected by NFCe and produced mixed results. The pilot experiment provided many
lessons to ensure that a subsequent experiment would be completed effectively.
Building on Experiment 1 and the pilot experiment, I conducted Experiment 2 to study the effect
of NFCe on an individual’s tendency for design fixation. I hypothesized that the manipulation of
NFCe would induce similar tendencies for design fixation as observed in Experiment 1. If shown
to be true, strategies to overcome fixation could be tailored for individuals.
5.1 Participants
Sixty-one participants were recruited from Amazon Mechanical Turk. Of the 61 participants, 26
were male and 35 were female. The mean age of 60 participants was 32.3 (range 18 – 67, SD =
10.12). One participant incorrectly entered their age as “1” but submitted valid entries for all other
questions.
5.2 Method
The experiment consisted of Mechanical Turk workers completing a three-part task: 1) Generating
3 (or more) solution concepts for a design problem, 2) Completing the NFCd Scale (without being
shown their score initially), 3) Completing an exit survey with questions on their age, gender, and
estimation of their NFC score. Upon completion of all three parts, workers were given their
measured NFCd score as well as a unique confirmation code to enter in their HIT assignment. Each
worker’s submission was reviewed and if approved, he or she would be paid and be counted as a

43
participant in this study. A timestamp log of each worker was obtained for the reviewing process
(see Appendix 4).
5.2.1 Human Intelligence Task (HIT) set-up and recruitment
The HIT had the title “Drawing Activity and Questionnaire” and description “Use your mouse to
draw at least 3 concepts for a design activity on a canvas on your browser and answer a few
questions. Should take less than an hour to complete. Approval will be processed within 48 hours.”
The HIT had the following keywords: survey, design, concept, drawing. Each HIT assignment
paid approximately $1.60 USD. I did not require “Master Worker” status or any other additional
qualifications.
5.2.2 Experiment registration and group assignment
Once Mechanical Turk workers were directed to the website, they were greeted with preliminary
instructions, including statements stipulated by the University of Toronto Research Ethics Board
(e.g. “there are no known or anticipated risks associated to participation in this study”) as well as
instructions for registering on the website. To prevent multiple submissions from a single worker,
I processed registrations using their Mechanical Turk unique worker IDs. Once workers were
registered, they would log-in and be taken to their profile page. The three task modules were
displayed on the profile page and each subsequent module would be “locked” until the previous
one was completed. Workers would start on Part 1 (See Appendix 2).
Our experiment consisted of three experimental groups: Group 1: low NFCe, Group 2: control, and
Group 3, high NFCe. Mechanical Turk workers were automatically assigned to the group with the
fewest completed submissions. If all three groups had the same number of completed submissions,
the system would assign the next registered worker to a group randomly.
5.2.3 Part 1: Design problem
I used the same design problem as in Experiment 1 (see Figure 1 and Figure 2). Workers viewed
the problem on a separate webpage, and were not allowed to return to the design problem page
upon exiting it. Once they were ready, and familiarized themselves on the use of the canvas tool,
they were instructed to continue to concept generation.
44
5.2.4 Part 1: Preparation for concept generation
Workers used the same canvas of 1000 by 600 pixels as in Experiment 1 for drawings and text
annotations. Before beginning with concept generation, workers were directed to a webpage
entitled “Drawing Tool Familiarization.” Here, written instructions asked workers to: “draw a
green circle on the canvas”, “type ‘I understand the textbox function.’ in red”, and “click the
Submit button and follow the instructions on the popup to continue to the next part”.
5.2.5 Part 1: Manipulation of NFCe during concept generation
I chose to manipulate NFCe using time pressure during concept generation, as it has been shown
to heighten or increase NFC (Kruglanski & Freund, 1983), and it is relatively straightforward to
implement. I applied time pressure directly using a timer instead of indirectly (such as through the
Taboo game in the pilot experiment).
Table 14 summarizes the three experimental groups, with differences in instruction only on the
concept generation webpage. In Group 1, low NFCe, workers were allotted 30 minutes per concept
while in Group 3, high NFCe, workers were allotted 5 minutes. For both Groups 1 and 3, the page
would refresh after the timer expired, but Group 3 received additional instruction that this refresh
would be documented to discourage them from circumventing the timer (all workers were
instructed not to refresh the webpage) (see Appendix 3).
Once workers had submitted at least three concepts, they were given a link to continue to Part 2 of
the experiment to complete the NFCd Scale.
5.2.6 Part 2: NFCd Scale
The NFCd Scale was administered in an identical manner to Experiment 1 (see Appendix 1).
5.2.7 Part 3: Exit survey
The exit survey consisted of 6 questions. The first question asked for the worker’s familiarity with
the shower problem using a 10-point Likert scale from 1 (not all at familiar) to 10 (very familiar).
The second question asked with which shower models the worker was familiar. The next three
questions asked the worker’s gender, age and personal estimation of their NFC score. The final,
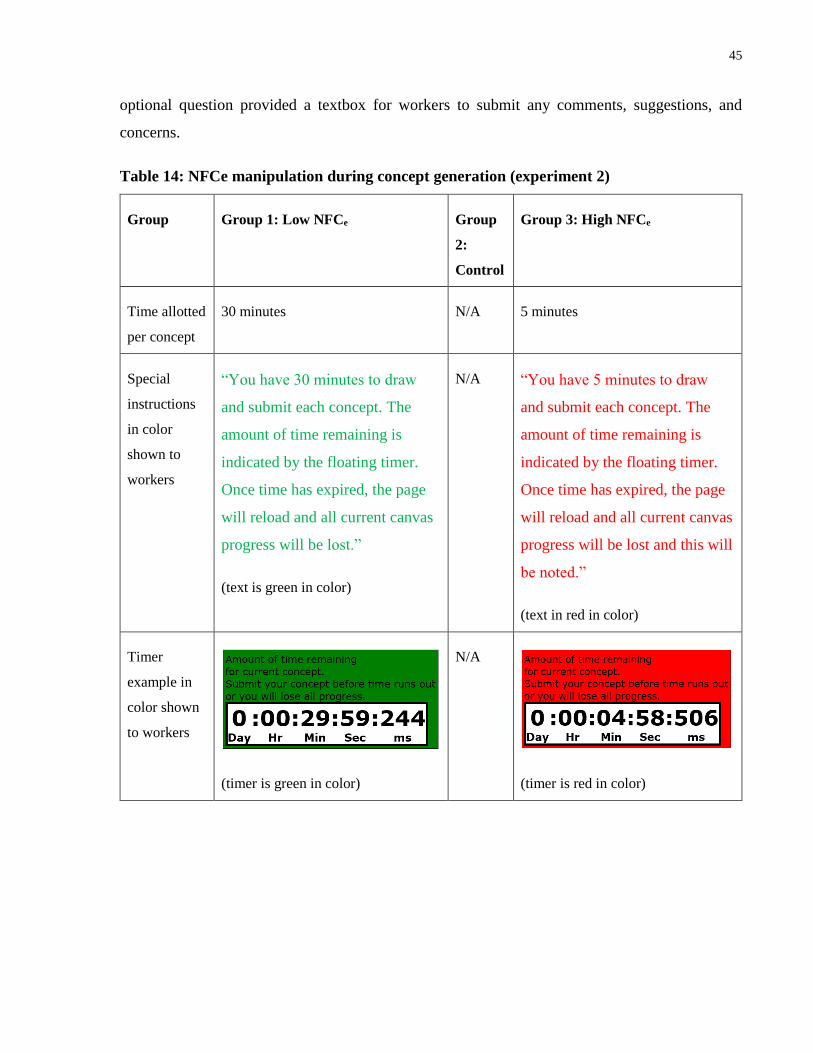
45
optional question provided a textbox for workers to submit any comments, suggestions, and
concerns.
Table 14: NFCe manipulation during concept generation (experiment 2)
Group Group 1: Low NFCe Group
2:
Control
Group 3: High NFCe
Time allotted
per concept
30 minutes N/A 5 minutes
Special
instructions
in color
shown to
workers
“You have 30 minutes to draw
and submit each concept. The
amount of time remaining is
indicated by the floating timer.
Once time has expired, the page
will reload and all current canvas
progress will be lost.”
(text is green in color)
N/A “You have 5 minutes to draw
and submit each concept. The
amount of time remaining is
indicated by the floating timer.
Once time has expired, the page
will reload and all current canvas
progress will be lost and this will
be noted.”
(text in red in color)
Timer
example in
color shown
to workers
(timer is green in color)
N/A
(timer is red in color)

46
5.2.8 Experiment debriefing
After completing the three parts of the experiment, workers were returned to their profile page
where they were given both their measured NFCd score and their unique confirmation code to enter
on Mechanical Turk. All submissions were reviewed within 48 hours of submission. If accepted,
the worker was paid and became part of the participant pool. If rejected, the worker was notified
of the reason, and was not paid or included in the participant pool. Approximately 38% of workers’
submissions were discarded due to reasons such as incompleteness, and random concept
submissions (e.g. smiley faces or indiscernible scribbles). Participants, or workers with accepted
submissions, spent an average of about half an hour to complete Experiment 2.
5.3 Evaluation of design fixation
The same Fixation Score Rating Scheme (Table 2) as Experiment 1 was used in Experiment 2. In
total, the 61 participants generated 191 concepts, of which 120 were accepted. Concepts were
rejected for the same reasons as for Experiment 1, i.e., for not following instructions provided in
the problem description. Examples of rejected concepts include showers using aeration, and only
information and/or automation as resource-conserving strategies. Experiment 2’s concepts used
fewer annotations than Experiment 1’s concepts, which sometimes led to concepts that were not
understandable, leading to their rejection. Participants sometimes submitted the same concept
more than once, each of which were counted towards the 191 generated concepts.
A second rater (not the same rater from Experiment 1) was asked to rate a random subset of 30 of
the accepted concepts. The second rater was provided with only: the design problem (Figure 1),
solution examples (Figure 2), fixation score rating scheme (Table 2), the 30 concepts to be rated,
and a sample concept rated by the first author with fixation score of 10. The inter-rater reliability
of the fixation score on the subset of 30 concepts was calculated as Krippendorff's α (ordinal) =
0.809 (α ≥ 0.8 corresponds to perfect agreement (Krippendorff, 2004)).
5.4 Results and discussion
I analyzed the relationship between participants’ NFCd, NFCe and fixation scores at both group
and individual levels. At the group level, I compared the three experimental groups with respect
to their fixation scores using Wilcoxon Rank-Sum tests (NFCe).

47
5.4.1 Observations
Figure 20 shows a histogram of participants’ NFCd scores. The range was 98 – 199, the mean
was 160.63, and the standard deviation was 22.79.
Figure 20: Histogram of NFCd of participants
Figure 21 and Figure 22 show plots of participants’ NFCd against 1) fixation scores for each
accepted concept, and 2) mean fixation score of accepted concepts per participant.
A preliminary assessment of this data was performed using the Kendall Tau-b test. I obtained a
significant Kendall’s rank correlation of τb = 0.16 (Z = 2.39, p = 0.017) for Figure 21, which
indicates a weak positive correlation between participants’ NFCd and their accepted-concepts’
fixation scores. Kendall’s rank correlation tau τb = 0.12 (Z = 1.31, p = 0.19) for Figure 22 indicates
a non-significant weak positive association between participants’ NFCd and their accepted-
concepts’ mean fixation scores.

48
Figure 21: Fixation scores of accepted concepts vs. NFCd
Figure 22: Mean fixation scores of accepted concepts per participant vs NFCd

49
5.4.2 Experimental group differences
Figure 23, Figure 24, and Figure 25 show the histograms of participants’ NFCd scores in each
group. Group 1, Group 2, and Group 3 all had similar mean NFCd of 162.11, 158.10, and 161.82
respectively.
Figure 23: Histogram of NFCd of participants in Group 1: Low NFCe
Figure 24: Histogram of NFCd of participants in Group 2: Control

50
Figure 25: Histogram of NFCd of participants in Group 3: High NFCe
Figure 26: Mean fixation scores of accepted concepts per participant vs NFCd in Group1:
Low NFCe

51
Figure 27: Mean fixation scores of accepted concepts per participant vs NFCd in Group2:
Control
Figure 28: Mean fixation scores of accepted concepts per participant vs NFCd in Group3:
High NFCe

52
Figure 26, Figure 27, and Figure 28 show the mean fixation scores of accepted concepts per
participant for Group 1, Group 2, and Group 3 respectively. Group 1 and Group 2 had similar
mean fixation scores of 4.57 and 4.59. Group 3 had a much higher mean fixation score at 6.33.
Table 15 outlines the differences between the three experimental groups. Interestingly, the
participants in Group 3: High NFCe gave the highest mean NFC estimate. I had asked participants
to estimate their NFC at the end of the experiment, after they had completed the NFCd Scale but
before they were informed of their NFCd score (see Appendix 5). I believe that their estimation of
NFC may have been affect by their NFCe condition because this estimation was requested right
after they completed the design activity under their assigned condition. My belief is supported by
the fact that the lowest mean estimation of NFC came from the low NFCe group, who were given
30 minutes to submit each concept. This was more than enough time, and likely more time than
they expected, as the experiment description noted that it should take less than an hour in total to
complete. Conversely, the high NFCe group had the highest estimate, possibly because they did
not expect 5-minute time limits given the overall time estimate in the experiment description.
Table 15: General comparisons between experimental groups
Group Group1:
Low NFCe
Group 2:
Control
Group 3:
High NFCe
n 18 21 22
Fixation Score (Mean) 4.57 4.579 6.33
Time spent per accepted concept (seconds) (Mean) 189.26 231.20 164.88
NFCd (Mean) 162.11 158.10 161.82
NFC estimated by participant (Mean) 127.89 147.10 159

53
The Wilcoxon Rank-Sum non-parametric statistical test was selected to compare mean (ordinal)
fixation scores of participants’ concepts of the different groups.
Table 16 shows the results of the Wilcoxon Rank-Sum tests. There were no significant differences
in mean fixation scores between participants in the low NFCe and control groups (Wilcoxon W =
357.50, Z = -0.06, m1 = 4.57, m2= 4.57, n1 = 18, n2 = 21, p = 0.96, r = 0.01, two-tailed). The effect
size was below the r = 0.10 cutoff for a small effect. Therefore, no significant differences were
observed between the low NFCe and control groups.
Table 16: Wilcoxon Rank-Sum test results between experimental groups
Low NFCe (n = 18)
Mean Fixation Score: 4.57
Mean NFCd: 162.11
Control (n = 21)
Mean Fixation Score: 4.579
Mean NFCd: 158.10
Control (n = 21)
Mean Fixation Score: 4.579
Mean NFCd: 158.10
W = 357.50
Z = -0.06
p = 0.96
r = 0.01 (two tailed)
High NFCe (n = 22)
Mean Fixation Score: 6.33
Mean NFCd: 161.82
W = 287.50
Z = -2.21
p = 0.033*
r = 0.35 (two tailed)
W = 369.50
Z = -2.25
p = 0.030*
r = .34 (two tailed)
*p < .05
I did obtain significant results when comparing low NFCe versus high NFCe (Wilcoxon W =
287.50, Z = -2.21, m1 = 4.57, m2= 6.33, n1 = 18, n2 = 22, p = 0.033, r = 0.35, two-tailed; and control
versus high NFCe groups (Wilcoxon W = 369.50, Z = -2.25, m1 = 4.57, m2= 6.33, n1 = 21, n2 = 22,

54
p = 0.030, r = 0.34, two-tailed). Effect sizes of r = 0.35 and r = 0.34 corresponded to medium
effects.
The average time spent per accepted concept was below 5 minutes (high NFCe group’s cutoff) for
all three groups, however, participants in the high NFCe group produced significantly more fixated
concepts than those in the low NFCe and control groups. Referring to Table 15, the three groups
had similar mean NFCd scores, such that their fixation scores should also be similar in the absence
of different conditions. I found particularly interesting that the high NFCe group had a higher mean
self-estimated NFC compared to the low NFCe and control groups.
There were no significant gender differences in the mean fixation scores within the three
experimental groups (see Table 17). The larges difference was observed in the control group
(Wilcoxon W = 125, Z = 1.03, m1(female) = 161.10, m2(male) = 155.36, n1 = 10, n2 = 11, p = 0.30, r =
0.22, two-tailed) but this can also be attributed to the small difference in mean NFCd scores. The
effect size r = 0.22 corresponds to a medium effect.
Table 17: Experiment 2 gender differences
Low NFCe Control High NFCe
Males 6 11 9
Fixation Score (Mean, Males) 4.67 4.09 6.46
NFCd (Mean, Males) 160.17 155.36 161.88
Females 12 10 13
Fixation Score (Mean, Females) 4.53 5.1 6.23
NFCd (Mean, Females) 163.08 161.10 161.80

55
5.5 Discussion: effect of NFCe on design fixation
In Experiment 2, I studied the effect of NFCe on design fixation. Using the same design problem
that solicited concepts to reduce shower water-run time, I split participants into three experimental
groups: Group 1: low NFCe, Group 2: control, and Group 3: high NFCe. Low NFCe participants
were given 30 minutes to submit each concept, high NFCe participants were given only 5 minutes,
and control-group participants were not given a time limit.
In the statistical analysis, participants were divided into three groups, low NFCe, control, and high
NFCe, corresponding with their experimental group condition. Participants in the high NFCe group
produced significantly more fixated concepts than those in the low NFCe and control groups, and
results were statistically significant in Wilcoxon Rank-Sum tests. The three groups had similar
mean NFCd scores as measured by the NFCd Scale, but there were differences in their NFC
estimates, where the high NFCe group had a higher mean NFC estimate than the other two groups.
I believe that their estimated NFC scores may have been impacted by the experimental condition
they had just experienced.
Possible contributions to the difference between Experiments 1 and 2 include the following. I
switched the order of the design activity and NFCd Scale as to prevent the NFCd Scale items from
affecting participants’ behavior in Experiment 2, where I also had a larger sample size. Experiment
1 used engineering students while Experiment 2 used Mechanical Turk workers.

56
Conclusion and Next Steps
This thesis aimed to answer the following research questions:
1) Is an individual’s tendency to fixate during concept generation affected by NFCd?
2) Is an individual’s tendency to fixate during concept generation affected by NFCe?
Experiment 1 aimed to answer research question 1) and showed that individual differences in NFCd
may potentially be used to predict an individual’s tendency for design fixation. When participants
were divided into two groups, low NFCd and high NFCd based on a mean split of their NFCd
scores, a Wilcoxon Rank-Sum test showed that the high NFCd group had significantly higher mean
fixation scores.
An ordinal logistic regression analysis revealed that higher NFCd scores corresponded to higher
probability of higher fixation scores, and vice versa. Specifically, an increase by 20 in an
individual’s NFCd score is associated with an odds ratio of 1.64 or 62.1% probability that a concept
by that individual to be rated a higher fixation score category relative to the contiguous lower
fixation score category. An example was that from NFCd = 140 to NFCd = 160, the probability
that a concept by an individual is of High Fixation (Fixation Score = 8-10) rather than Medium
Fixation (Fixation Score = 5-7) is increased from approximately 50% (Probability of Medium
Fixation = 0.285, High Fixation = 0.29) to 58% (Probability of Medium Fixation = 0.287, High
Fixation = 0.40).
The pilot experiment provided some initial evidence towards research question 2) in that NFCe
affects individual tendency for design fixation. It also provided lessons learned that were
implemented in Experiment 2.
Experiment 2 studied the role of NFCe in design fixation and aimed to answer research questions
2) by manipulating NFCe through time pressure. Three experimental groups were formed (low
NFCe, control, and high NFCe groups). The concepts produced by the high NFCe group were
shown to be significantly more fixated than both the low NFCe and control groups through
Wilcoxon Rank-Sum tests. This result provided evidence towards answering research question 2),
that individual tendency for fixation was affected by NFCe. Additional evidence was provided in
the results of participant’s estimations of their NFC scores. They were asked to estimate their NFC

57
score in the exit survey, after completing the experimental condition concept generation task and
NFCd scale and given a short description of NFCd but before they were shown their measure NFC
score. The high NFCe group had the highest mean NFC score estimate which may be an indication
that the estimates were affected by participants’ respective NFCe conditions.
This work supports the existence of a relationship between Need for Closure and design fixation.
Specifically, NFCd can be used to predict individual tendency for design fixation and NFCe can
affect individual tendency for design fixation.
Further studies are required to ensure the validity of these results. Other design fixation problems
should be used to ensure that the effect of NFCd is repeatable. Additionally, more NFCe
manipulations beyond time pressure should be explored to ensure that the observed NFCe effect is
not exclusive to just time pressure.
Shortcuts to the NFCd questionnaire beyond Roets and Van Hiel’s (2011) 15-item version of the
NFCd Scale could be developed, resulting in quick predictions of individuals’ tendencies to fixate,
and applying interventions as required. Finally, manipulations known to affect NFCe could be used
to develop novel interventions to complement existing interventions to reduce design fixation.

58
References
Atilola, O., Tomko, M. & Linsey, J., 2016. The effects of representation on idea generation and
design fixation: A study comparing sketches and function trees.. Design Studies, 42(1), pp. 110-
136.
Cheng, P., Mugge, R. & Schoormans, J. P., 2014. A new strategy to reduce design fixation:
Presenting partial photographs to designers.. Design Studies, 35(4), pp. 374-391.
Chrysikou, E. & Weisberg, R., 2005. Following the wrong footsteps: fixation effects of pictorial
examples in a design problem-solving task. Journal of Experimental Psychology: Learning,
Memory, and Cognition, 31(5), pp. 1134-1148.
Crilly, N., 2015. Fixation and creativity in concept development: The attitudes and practices of
expert designers.. Design Studies, Volume 38, pp. 54-91.
Dong, A. & Sarkar, S., 2011. Unfixing design fixation: from cause to computer simulation, , :..
The Journal of Creative Behavior, Volume 45, pp. 147-159.
Genco, N., Hölttä‐Otto, K. & Seepersad, C., 2012. An experimental investigation of the innovation
capabilities of undergraduate engineering students. Journal of Engineering Education, 101(1), pp.
60-81.
Hallihan, G., Cheong, H. & Shu, L., 2012. Confirmation and cognitive bias in design cognition.
Chicago, IL, s.n.
Hallihan, G. & Shu, L., 2013. Considering Confirmation Bias in Design and Design Research. J
Integrated Design and Process Science, 17(4), pp. 19-35.
Holbert, R. & Hansen, G., 2006. Fahrenheit 9‐11, Need for Closure and the Priming of Affective
Ambivalence: An Assessment of Intra‐affective Structures by Party Identification. Human
Communication Research, 32(2), pp. 109-129.
Jansson, D. & Smith, S., 1991. Design fixation. Design studies, pp. 12(1): 3-11.

59
Kardes, F. et al., 2007. The role of the need for cognitive closure in the effectiveness of the disrupt-
then-reframe influence technique. Journal of Consumer Research, 34(3), pp. 377-385.
Kershaw, T., Hölttä-Otto, K. & Lee, Y., 2011. The effect of prototyping and critical feedback on
fixation in engineering design. Boston, MA, s.n.
Kohn, N. & Smith, S., 2009. Partly vs. completely out of your mind: effects of incubation and
distraction on resolving fixation. Journal of Creative Behavior, 43(2), pp. 102-118.
Krippendorff, K., 2004. Content Analysis: An Introduction to its Methodology. Thousand
Oaks(CA): Sage.
Krippendorff, K., 2004. Reliability in Content Analysis: Some Common Misconceptions and
Recommendations. Human Communication Research, 30(3), pp. 411-433.
Kruglanski, A., 1990. Motivations for judging and knowing: Implications for causal attribution.
Foundation of social behavior, Volume 2, p. 333–368.
Kruglanski, A. & Fishman, S., 2009. Handbook of Individual Differences in Social Behavior. New
York: Guilford Press.
Kruglanski, A. & Webster, D., 1996. Motivated closing of the mind: ‘‘seizing’’ and ‘‘freezing’’.
Psychological Review, Volume 103, p. 263–283.
Kruglanski, A. & Webster, D. K. A., 1993. Motivated resistance and openness to persuasion in the
presence or absence of prior information. Journal of personality and social psychology, 65(5), pp.
861-876.
Kruglanski, A. W. & Freund, T., 1983. The freezing and unfreezing of lay-inferences: Effects on
impressional primacy, ethnic stereotyping, and numerical anchoring.. Journal of Experimental
Social Psychology, 19(5), pp. 448-468.
Lai, S. & Shu, L., 2016. Individuals Differences in Tendency for Design FIxation. Submitted to
Design Computing and Cognition DCC'16.

60
Linsey, J. et al., 2010. A study of design fixation, its mitigation and perception in engineering
design faculty. Journal of Mechanical Design, 132(4), pp. 041003-1-12.
Mason, W. & Suri, S., 2012. Conducting behavioral research on Amazon’s Mechanical Turk..
Behavior research methods, 44(1), pp. 1-23.
Mayseless, O. & Kruglanski, A., 1987. What makes you so sure? Effects of epistemic motivations
on judgmental confidence. Organizational Behavior and Human Decision Processes, 39(2), pp.
162-183.
McCullagh, P., 1980. Regression models for ordinal data. Journal of the royal statistical society,
Series B (Methodological), pp. 109-142.
Moreno, D. et al., 2014. A Step Beyond to Overcome Design Fixation: A Design-by-Analogy
Approach. s.l., s.n.
Plaks, J., 2011. The Social Psychology of Motivation. s.l.:Oxford Univ. Press.
Purcell, A. & Gero, J., 1996. Design and other types of fixation. Design Studies, 17(4), pp. 363-
383.
Roets, A. & Van Hiel, A., 2007. Separating ability from need: Clarifying the dimensional structure
of the need for closure scale. Personality and Social Psychology Bulletin, 33(2), pp. 266-280.
Roets, A. & Van Hiel, A., 2011. Item selection and validation of a brief, 15-item version of the
Need for Closure Scale. Personality and Individual Differences, 50(1), pp. 90-94.
Smith, S. & Linsey, J., 2011. A three-pronged approach for overcoming design fixation. The
Journal of Creative Behavior, Volume 45, pp. 83-91.
Srivastava, J. & Shu, L., 2013. Encouraging Resource-Conscious Behavior Through Product
Design: The Principle of Discretization. Journal of Mechanical Design, 135(6), p. 061002.
Toh, C., Miller, S. & Kremer, G., 2014. Mitigating design fixation effects in engineering design
through product dissection activities. s.l., Springer Netherlands, pp. 95-113.

61
Toh, C., Patel, A., Strohmetz, A. & Miller, S., 2015. My idea is the best! Ownership Bias and its
influence on engineering concept selection. Boston MA USA, s.n.
Tseng, I., Moss, J., Cagan, J. & Kotovsky, K., 2008. The role of timing and analogical similarity
in the stimulation of idea generation in design.. Design Studies, 29(3), pp. 203-221.
Tsenn, J., Atilola, O., McAdams, D. A. & Linsey, J. S., 2014. The effects of time and incubation
on design concept generation. Design Studies, 35(5), pp. 500-526.
Vasconcelos, L. A. & Crilly, N., 2016. Inspiration and fixation: Questions, methods, findings, and
challenges.. Design Studies, Volume 42, pp. 1-32.
Viswanathan, V. & Linsey, J., 2011. Design fixation in physical modeling: an investigation on the
role of sunk cost. Washington, DC, s.n.
Viswanathan, V. & Linsey, J., 2013. Design fixation and its mitigation: a study on the role of
expertise. Journal of Mechanical Design, 135(5), pp. 051008-1-15.
Webster, D. & Kruglanski, A., 1994. Individual differences in need for cognitive closure. Journal
of personality and social psychology, 67(6), pp. 1049-1062.
Webster, D. M., 1993. Motivated augmentation and reduction of the overattribution bias.. Journal
of personality and social psychology, 65(2), p. 261.
Youmans, R., 2011. The effects of physical prototyping and group work on the reduction of design
fixation.. Design Studies, 32(2), pp. 115-138.
Youmans, R. & Arciszewski, T., 2014. Design fixation: Classifications and modern methods of
prevention.. Artificial Intelligence for Engineering Design, Analysis and Manufacturing, 28(02),
pp. 129-137.
Zahner, D. et al., 2010. A fix for fixation? re-representing and abstracting as creative processes in
the design of information systems. AIEDAM, 24(2), pp. 231-244.
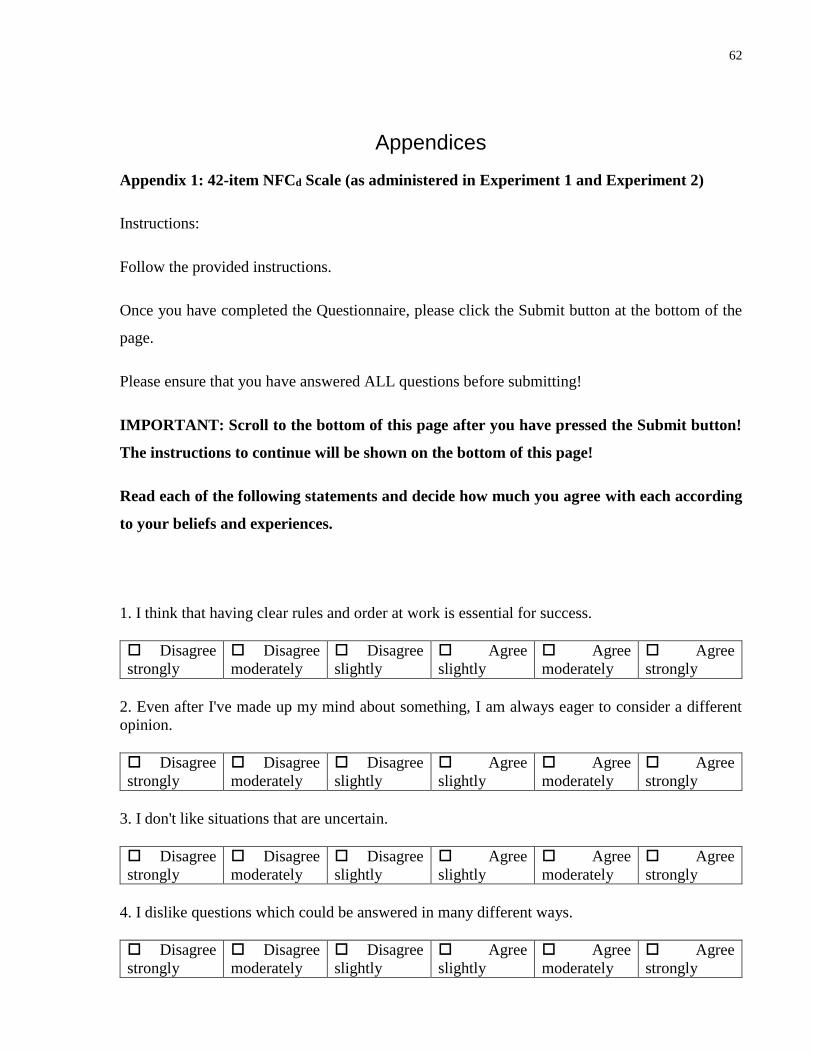
62
Appendices
Appendix 1: 42-item NFCd Scale (as administered in Experiment 1 and Experiment 2)
Instructions:
Follow the provided instructions.
Once you have completed the Questionnaire, please click the Submit button at the bottom of the
page.
Please ensure that you have answered ALL questions before submitting!
IMPORTANT: Scroll to the bottom of this page after you have pressed the Submit button!
The instructions to continue will be shown on the bottom of this page!
Read each of the following statements and decide how much you agree with each according
to your beliefs and experiences.
1. I think that having clear rules and order at work is essential for success.
Disagree
strongly
Disagree
moderately
Disagree
slightly
Agree
slightly
Agree
moderately
Agree
strongly
2. Even after I've made up my mind about something, I am always eager to consider a different
opinion.
Disagree
strongly
Disagree
moderately
Disagree
slightly
Agree
slightly
Agree
moderately
Agree
strongly
3. I don't like situations that are uncertain.
Disagree
strongly
Disagree
moderately
Disagree
slightly
Agree
slightly
Agree
moderately
Agree
strongly
4. I dislike questions which could be answered in many different ways.
Disagree
strongly
Disagree
moderately
Disagree
slightly
Agree
slightly
Agree
moderately
Agree
strongly

63
5. I like to have friends who are unpredictable.
Disagree
strongly
Disagree
moderately
Disagree
slightly
Agree
slightly
Agree
moderately
Agree
strongly
6. I find that a well ordered life with regular hours suits my temperament.
Disagree
strongly
Disagree
moderately
Disagree
slightly
Agree
slightly
Agree
moderately
Agree
strongly
7. I enjoy the uncertainty of going into a new situation without knowing what might happen.
Disagree
strongly
Disagree
moderately
Disagree
slightly
Agree
slightly
Agree
moderately
Agree
strongly
8. When dining out, I like to go to places where I have been before so that I know what to expect.
Disagree
strongly
Disagree
moderately
Disagree
slightly
Agree
slightly
Agree
moderately
Agree
strongly
9. I feel uncomfortable when I don't understand the reason why an event occurred in my life.
Disagree
strongly
Disagree
moderately
Disagree
slightly
Agree
slightly
Agree
moderately
Agree
strongly
10. I feel irritated when one person disagrees with what everyone else in a group believes.
Disagree
strongly
Disagree
moderately
Disagree
slightly
Agree
slightly
Agree
moderately
Agree
strongly
11. I hate to change my plans at the last minute.
Disagree
strongly
Disagree
moderately
Disagree
slightly
Agree
slightly
Agree
moderately
Agree
strongly
12. I would describe myself as indecisive.
Disagree
strongly
Disagree
moderately
Disagree
slightly
Agree
slightly
Agree
moderately
Agree
strongly
13. When I go shopping, I have difficulty deciding exactly what it is I want.
Disagree
strongly
Disagree
moderately
Disagree
slightly
Agree
slightly
Agree
moderately
Agree
strongly

64
14. When faced with a problem I usually see the one best solution very quickly.
Disagree
strongly
Disagree
moderately
Disagree
slightly
Agree
slightly
Agree
moderately
Agree
strongly
15. When I am confused about an important issue, I feel very upset.
Disagree
strongly
Disagree
moderately
Disagree
slightly
Agree
slightly
Agree
moderately
Agree
strongly
16. I tend to put off making important decisions until the last possible moment.
Disagree
strongly
Disagree
moderately
Disagree
slightly
Agree
slightly
Agree
moderately
Agree
strongly
17. I usually make important decisions quickly and confidently.
Disagree
strongly
Disagree
moderately
Disagree
slightly
Agree
slightly
Agree
moderately
Agree
strongly
18. I think it is fun to change my plans at the last moment.
Disagree
strongly
Disagree
moderately
Disagree
slightly
Agree
slightly
Agree
moderately
Agree
strongly
19. My personal space is usually messy and disorganized.
Disagree
strongly
Disagree
moderately
Disagree
slightly
Agree
slightly
Agree
moderately
Agree
strongly
20. In most social conflicts, I can easily see which side is right and which is wrong.
Disagree
strongly
Disagree
moderately
Disagree
slightly
Agree
slightly
Agree
moderately
Agree
strongly
21. I tend to struggle with most decisions.
Disagree
strongly
Disagree
moderately
Disagree
slightly
Agree
slightly
Agree
moderately
Agree
strongly
22. I believe orderliness and organization are among the most important characteristics of a good
student.
Disagree
strongly
Disagree
moderately
Disagree
slightly
Agree
slightly
Agree
moderately
Agree
strongly
65
23. When considering most conflict situations, I can usually see how both sides could be right.
Disagree
strongly
Disagree
moderately
Disagree
slightly
Agree
slightly
Agree
moderately
Agree
strongly
24. I don't like to be with people who are capable of unexpected actions.
Disagree
strongly
Disagree
moderately
Disagree
slightly
Agree
slightly
Agree
moderately
Agree
strongly
25. I prefer to socialize with familiar friends because I know what to expect from them.
Disagree
strongly
Disagree
moderately
Disagree
slightly
Agree
slightly
Agree
moderately
Agree
strongly
26. I think that I would learn best in a class that lacks clearly stated objectives and requirements.
Disagree
strongly
Disagree
moderately
Disagree
slightly
Agree
slightly
Agree
moderately
Agree
strongly
27. When thinking about a problem, I consider as many different opinions on the issue as possible.
Disagree
strongly
Disagree
moderately
Disagree
slightly
Agree
slightly
Agree
moderately
Agree
strongly
28. I don't like to go into a situation without knowing what I can expect from it.
Disagree
strongly
Disagree
moderately
Disagree
slightly
Agree
slightly
Agree
moderately
Agree
strongly
29. I like to know what people are thinking all the time.
Disagree
strongly
Disagree
moderately
Disagree
slightly
Agree
slightly
Agree
moderately
Agree
strongly
30. I dislike it when a person's statement could mean many different things.
Disagree
strongly
Disagree
moderately
Disagree
slightly
Agree
slightly
Agree
moderately
Agree
strongly
31. It's annoying to listen to someone who cannot seem to make up his or her mind.
Disagree
strongly
Disagree
moderately
Disagree
slightly
Agree
slightly
Agree
moderately
Agree
strongly

66
32. I find that establishing a consistent routine enables me to enjoy life more.
Disagree
strongly
Disagree
moderately
Disagree
slightly
Agree
slightly
Agree
moderately
Agree
strongly
33. I enjoy having a clear and structured mode of life.
Disagree
strongly
Disagree
moderately
Disagree
slightly
Agree
slightly
Agree
moderately
Agree
strongly
34. I prefer interacting with people whose opinions are very different from my own.
Disagree
strongly
Disagree
moderately
Disagree
slightly
Agree
slightly
Agree
moderately
Agree
strongly
35. I like to have a plan for everything and a place for everything.
Disagree
strongly
Disagree
moderately
Disagree
slightly
Agree
slightly
Agree
moderately
Agree
strongly
36. I feel uncomfortable when someone's meaning or intention is unclear to me.
Disagree
strongly
Disagree
moderately
Disagree
slightly
Agree
slightly
Agree
moderately
Agree
strongly
37. When trying to solve a problem I often see so many possible options that it's confusing.
Disagree
strongly
Disagree
moderately
Disagree
slightly
Agree
slightly
Agree
moderately
Agree
strongly
38.I always see many possible solutions to problems I face.
Disagree
strongly
Disagree
moderately
Disagree
slightly
Agree
slightly
Agree
moderately
Agree
strongly
39. I'd rather know bad news than stay in a state of uncertainty.
Disagree
strongly
Disagree
moderately
Disagree
slightly
Agree
slightly
Agree
moderately
Agree
strongly
40. I do not usually consult many different options before forming my own view.
Disagree
strongly
Disagree
moderately
Disagree
slightly
Agree
slightly
Agree
moderately
Agree
strongly

67
41. I dislike unpredictable situations.
Disagree
strongly
Disagree
moderately
Disagree
slightly
Agree
slightly
Agree
moderately
Agree
strongly
42. I dislike the routine aspects of my work (studies).
Disagree
strongly
Disagree
moderately
Disagree
slightly
Agree
slightly
Agree
moderately
Agree
strongly
(The below was not shown to participants)
Scoring:
For all questions except 2, 5, 7, 12, 13, 16, 18, 19, 21, 23, 26, 27, 34, 37, 38, and 42.
Disagree strongly 1
Disagree moderately 2
Disagree slightly 3
Agree slightly 4
Agree moderately 5
Agree strongly 6
For questions 2, 5, 7, 12, 13, 16, 18, 19, 21, 23, 26, 27, 34, 37, 38, and 42.
Disagree strongly 6
Disagree moderately 5
Disagree slightly 4
Agree slightly 3
Agree moderately 2
Agree strongly 1
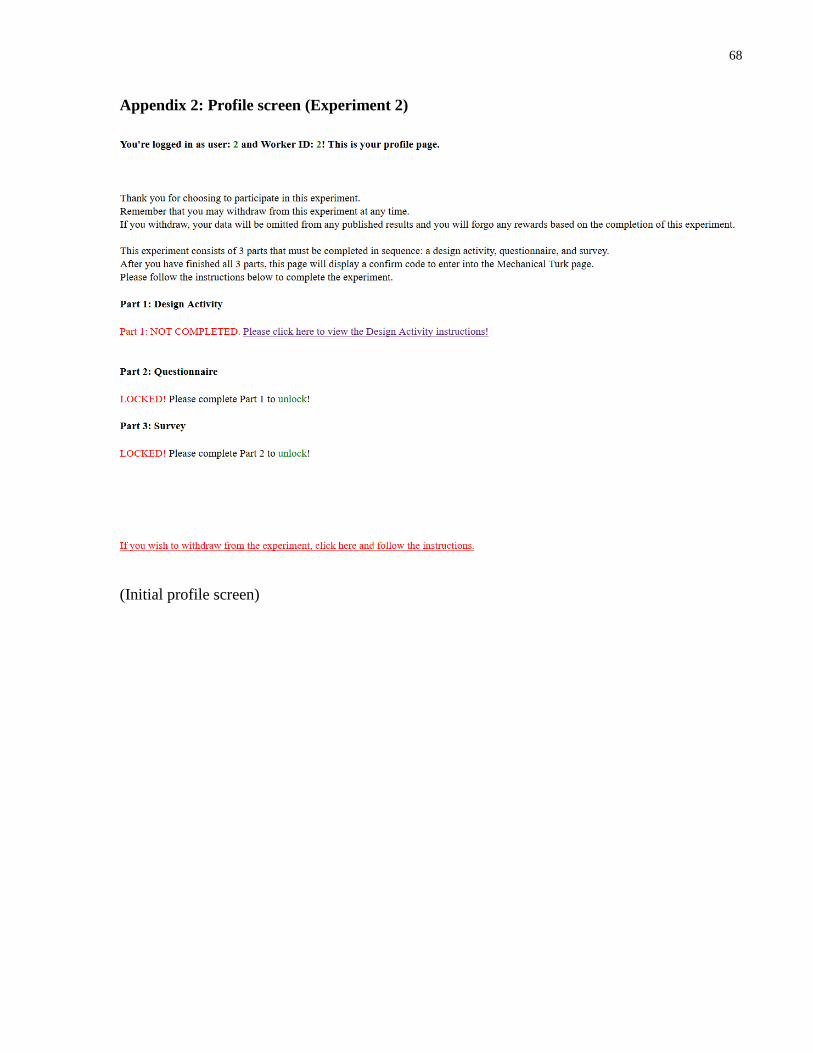
68
Appendix 2: Profile screen (Experiment 2)
(Initial profile screen)

69
(Profile screen after completing all 3 parts)

70
Appendix 3: Drawing canvas (Experiment 2: Group 3, high NFCe condition)

71
Appendix 4: Sample timestamp output
Homepage Worker: A________D (edited for anonymity) Condition: 3 Status: , Wed Mar 23 2016
@ 18:13:44
Looked at Design Problem, Wed Mar 23 2016 @ 18:14:02
entered drawing page (started drawing) (test), Wed Mar 23 2016 @ 18:16:00
submitted test design number 1, Wed Mar 23 2016 @ 18:17:40
entered drawing page (started drawing) (concepts), Wed Mar 23 2016 @ 18:17:51
submitted concept design number 1, Wed Mar 23 2016 @ 18:21:24
entered drawing page (started drawing) (concepts), Wed Mar 23 2016 @ 18:21:34
submitted concept design number 2, Wed Mar 23 2016 @ 18:23:38
entered drawing page (started drawing) (concepts), Wed Mar 23 2016 @ 18:23:40
submitted concept design number 3, Wed Mar 23 2016 @ 18:26:33
Homepage Worker: A________D Condition: 3 Status: , Wed Mar 23 2016 @ 18:26:35
On Personality Questionnaire, Wed Mar 23 2016 @ 18:26:39
Your Need for Closure Score is: 154 <br />
Order Scale: 47 <br />
Predictability Scale: 29 <br />
Decisiveness Scale: 25 <br />
Ambiguity Scale: 30 <br />
Closed Mindedness Scale: 23 <br />, Wed Mar 23 2016 @ 18:31:48
Completed Personality Questionnaire, Wed Mar 23 2016 @ 18:31:48

72
Homepage Worker: A________D Condition: 3 Status: , Wed Mar 23 2016 @ 18:33:09
On Final Survey, Wed Mar 23 2016 @ 18:33:11
Submitted Final Survey., Wed Mar 23 2016 @ 18:34:06
Q1: 1
Q2: Traditional ones
Q3: Female
Q4: 38
Q5: 136
Q6: , Wed Mar 23 2016 @ 18:34:06
Homepage Worker: A________D Condition: 3 Status: 3, Wed Mar 23 2016 @ 18:3

73
Appendix 5: Inquisition of NFC estimate (Experiment 2)
Workers were first given a short description of NFC following completion of the 42-item NFC
scale.
Workers were asked to estimate their NFC score in question 5 of the exit survey.