use of metallic foams for heat transfer enhancement in the cooling
107
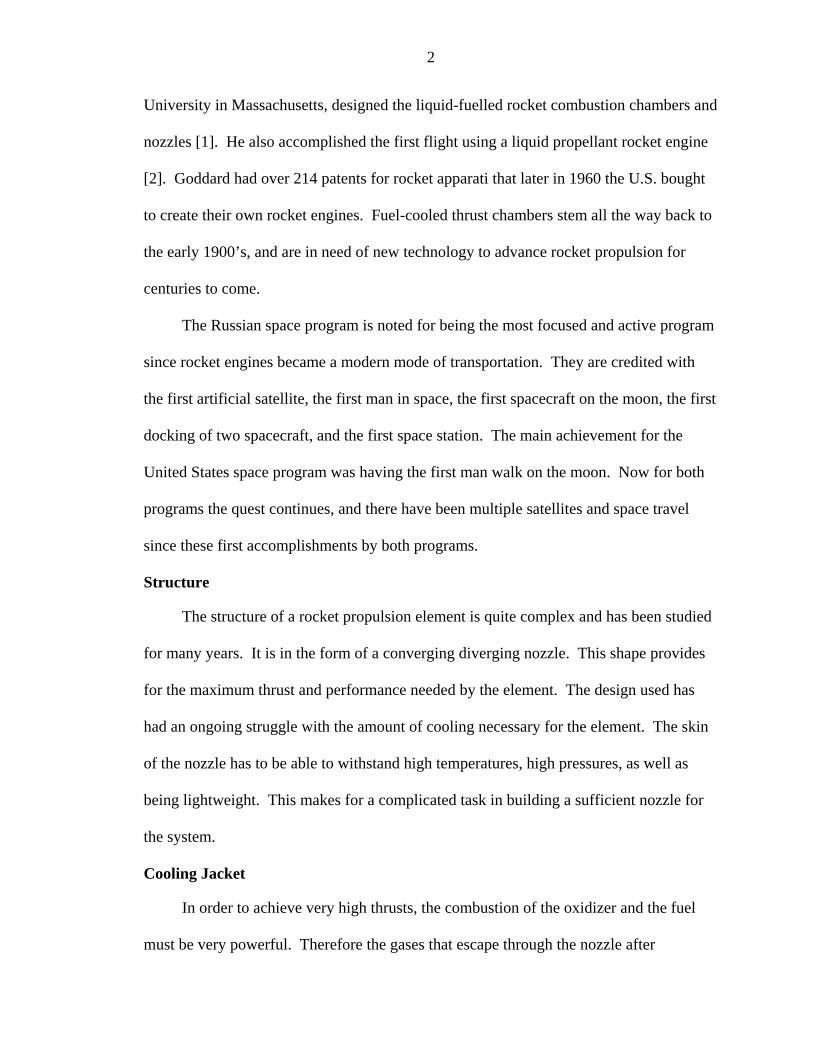
USE OF METALLIC FOAMS FOR HEAT TRANSFER ENHANCEMENT IN THE COOLING JACKET OF A ROCKET PROPULSION ELEMENT By RYAN JEFFREY AVENALL A THESIS PRESENTED TO THE GRADUATE SCHOOL OF THE UNIVERSITY OF FLORIDA IN PARTIAL FULFILLMENT OF THE REQUIREMENTS FOR THE DEGREE OF MASTER OF SCIENCE UNIVERSITY OF FLORIDA 2004
Transcript of use of metallic foams for heat transfer enhancement in the cooling
USE OF METALLIC FOAMS FOR HEAT TRANSFER ENHANCEMENT IN THE COOLING JACKET OF A ROCKET PROPULSION ELEMENT
By
RYAN JEFFREY AVENALL
A THESIS PRESENTED TO THE GRADUATE SCHOOL OF THE UNIVERSITY OF FLORIDA IN PARTIAL FULFILLMENT
OF THE REQUIREMENTS FOR THE DEGREE OF MASTER OF SCIENCE
UNIVERSITY OF FLORIDA
2004

Copyright 2004
by
Ryan Jeffrey Avenall

This document is dedicated to the Lord, the giver of life, my provider, for without Him none of this would have been possible.

ACKNOWLEDGMENTS
I would like to thank my advisor, Dr. Jacob N. Chung, for believing in me and for
giving me the opportunity to embark on this wonderful research topic. I would also like
to thank my committee, Dr. Skip Ingley, and Dr. Bhavani Sankar, for their much needed
help and advice. NASA provided the funding for this project through URETI.
I would also like to thank my parents who have persevered with me through this
campaign and have given me the guidance in every walk of life. Also, I thank my fiancée
Debbie Simonson, who has repeatedly help me through the times when I wanted to quit.
I also would like to thank my roommate Landon Tully for his continued support. He has
helped me prepare my test facility as well as give me motivation to continue pursuing this
degree. I thank the people involved with me at the Rock Church of Gainesville for all
their prayers and support. Finally I would like to thank the One who has given me life
more abundantly, and whose name is above all names.
iv

TABLE OF CONTENTS
page ACKNOWLEDGMENTS ................................................................................................. iv
LIST OF TABLES............................................................................................................ vii
LIST OF FIGURES ........................................................................................................... ix
ABSTRACT...................................................................................................................... xii
CHAPTER 1 ROCKET PROPULSION.............................................................................................1
History ..........................................................................................................................1 Structure ................................................................................................................2 Cooling Jacket .......................................................................................................2
Problems with Cooling .................................................................................................3 2 PREVIOUS WORK......................................................................................................5
Metallic Elements .........................................................................................................5 Metallic Porous Materials......................................................................................5 Metal Foam Processing and Fabrication ...............................................................7
Rocket Combustion Testing .........................................................................................7 Heat Transfer Analysis .................................................................................................8
Sub critical Fluids..................................................................................................8 Supercritical Fluids and Rocket Heat Transfer ...................................................12
3 NUMERICAL AND ANALYTICAL APPROACH..................................................15
4 LARGE SYSTEM EXPERIMENTAL SIMULATION AND RESULTS.................21
Test Apparatus Setup and Procedure..........................................................................21 Experimental Results and Comparisons .....................................................................25
5 SMALL SYSTEM EXPERIMENTAL SIMULATION AND RESULTS ................43
Test Apparatus Setup and Procedure..........................................................................43 Experimental Results and Comparison.......................................................................44
6 PRACTICAL ROCKET ENGINE APPLICATION..................................................56
7 RECOMMENDATIONS FOR FUTURE WORK .....................................................58
v

8 UNCERTAINTY OF RESULTS ...............................................................................62
9 CONCLUSIONS ........................................................................................................65
APPENDIX A NOMENCLATURE ...................................................................................................68
B COOLANT PROPERTIES.........................................................................................70
C LARGE SYSTEM COLLECTED DATA..................................................................72
D LARGE SYSTEM HEAT TRANSFER ENHANCEMENTS ...................................77
E SMALL SYSTEM COLLECTED DATA..................................................................82
F SMALL SYSTEM HEAT TRANSFER ENHANCEMENTS ...................................87
LIST OF REFERENCES...................................................................................................92
BIOGRAPHICAL SKETCH .............................................................................................94
vi

LIST OF TABLES
Table page 8-1.Uncertainty of Results .................................................................................................64
B-1. Properties for Liquid Nitrogen Referenced from [15]. .............................................70
B-2. Properties for Nitrogen Vapor Referenced from [15]...............................................70
B-3. Properties for Liquid Water Referenced from [11]...................................................71
B-4. Properties for Water Vapor Referenced from [11]. ..................................................71
C-1.Test Results for a Heat Flux of 1.9 Mbtu/in2-s. .........................................................73
C-2.Test Results for a Heat Flux of 5.69 Mbtu/in2-s. .......................................................74
C-3.Test Results for a Heat Flux of 7.58 Mbtu/in2-s. .......................................................75
C-4.Test Results for a Heat Flux of 9.48 Mbtu/in2-s. .......................................................76
D-1.Average Temperatures @ Heat Flux = 1.9 Mbtu/in2-s ..............................................78
D-2.Heat Transfer Enhancement @ Heat Flux = 1.9 Mbtu/in2-s......................................78
D-3.Average Temperatures @ Heat Flux = 5.69 Mbtu/in2-s. ...........................................79
D-4.Heat Transfer Enhancement @ Heat Flux = 5.69 Mbtu/in2-s....................................79
D-5.Average Temperatures @ Heat Flux = 7.58 Mbtu/in2-s. ...........................................80
D-6.Heat Transfer Enhancement @ Heat Flux = 7.58 Mbtu/in2-s....................................80
D-7.Average Temperatures @ Heat Flux = 9.48 Mbtu/in2-s. ...........................................81
D-8.Heat Transfer Enhancement @ Heat Flux = 9.48 Mbtu/in2-s....................................81
E-1.Test Results for a Heat Flux of 1.9 Mbtu/in2-s...........................................................83
E-2.Test Results for a Heat Flux of 5.69 Mbtu/in2-s.........................................................84
E-3.Test Results for a Heat Flux of 7.58 Mbtu/in2-s.........................................................85
vii

E-4.Test Results for a Heat Flux of 9.48 Mbtu/in2-s.........................................................86
F-1.Average Temperatures @ Heat Flux = 1.9 Mbtu/in2-s...............................................88
F-2.Heat Transfer Enhancement @ Heat Flux = 1.9 Mbtu/in2-s.......................................88
F-3.Average Temperatures @ Heat Flux = 5.69 Mbtu/in2-s.............................................89
F-4.Heat Transfer Enhancement @ Heat Flux = 5.69 Mbtu/in2-s.....................................89
F-5.Average Temperatures @ Heat Flux = 7.58 Mbtu/in2-s.............................................90
F-6.Heat Transfer Enhancement @ Heat Flux = 7.58 Mbtu/in2-s.....................................90
F-7.Average Temperatures @ Heat Flux = 9.48 Mbtu/in2-s.............................................91
F-8.Heat Transfer Enhancement @ Heat Flux = 9.48 Mbtu/in2-s.....................................91
viii

LIST OF FIGURES
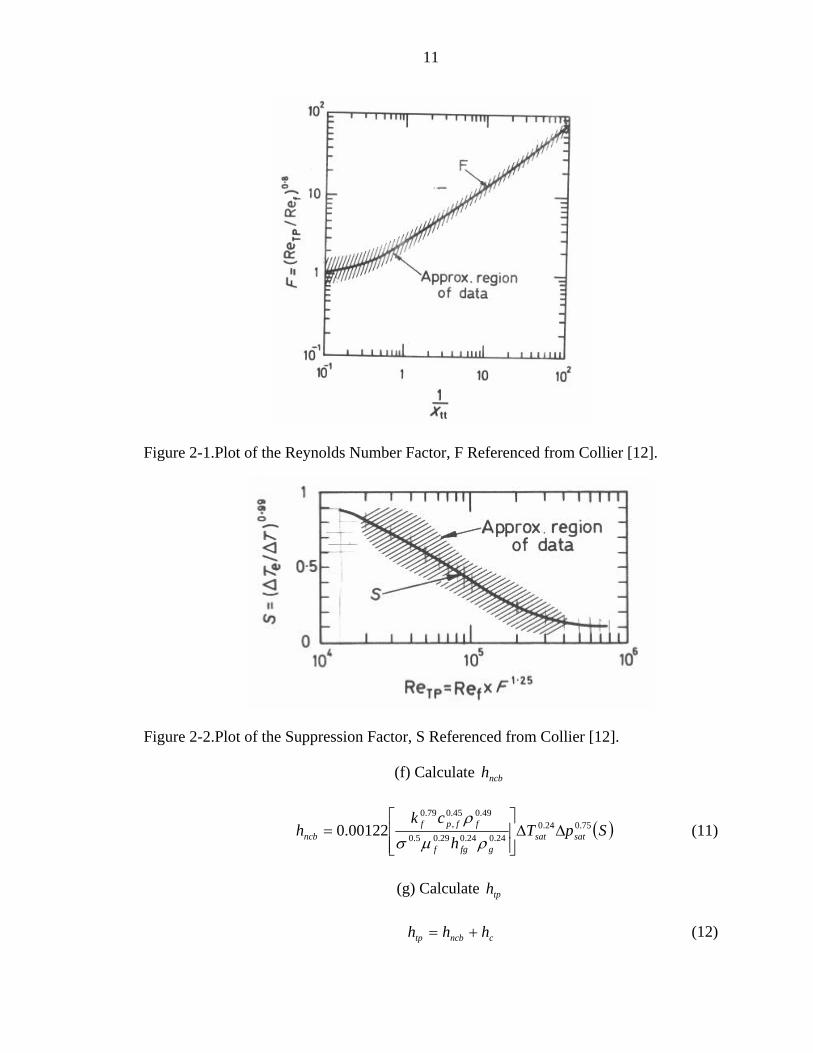
Figure page 2-1.Plot of the Reynolds Number Factor, F Referenced from Collier [12]. ......................11
2-2.Plot of the Suppression Factor, S Referenced from Collier [12].................................11
2-3.Plot of Sub Critical and Supercritical Coolant Heat Transfer Referenced from [2]....12
3-1.2-D Geometrical Representation of a Rocket Engine Combustion Chamber for use in Numerical Code........................................................................................................15
4-1.Representation of Large Testing Apparatus and System.............................................21
4-2.SEM Photograph of Copper Foam Structure...............................................................23
4-3.Photograph Showing the Brazing of the Copper Foam to the Inner Tube. .................23
4-4.SEM Photograph of Nickel Foam Structure................................................................24
4-5.Photograph Showing the Brazing of the Nickel Foam to the Inner Tube. ..................24
4-6.Open Channel Cross-Section.......................................................................................26
4-7.Copper Foam Cross Sectional View............................................................................27
4-8.Nickel Foam Cross Sectional View.............................................................................28
4-9.Comparison Between Nickel Foam, Copper Foam, and Open Channel Hot Wall Temperature Readings Using a Heat Flux of 1.9 Mbtu/in2-s & 23 cfm. .................29
4-10.Comparison Between Nickel Foam, Copper Foam, and Open Channel Coolant Temperature Readings Using a Heat Flux of 1.9 Mbtu/in2-s & 23 cfm. .................29
4-11.Comparison Between Nickel Foam, Copper Foam, and Open Channel Hot Wall Temperature Readings Using a Heat Flux of 1.9 Mbtu/in2-s & 45 cfm. .................30
4-12.Comparison Between Nickel Foam, Copper Foam, and Open Channel Coolant Temperature Readings Using a Heat Flux of 1.9 Mbtu/in2-s & 45 cfm. .................30
4-13.Comparison Between Nickel Foam, Copper Foam, and Open Channel Hot Wall Temperature Readings Using a Heat Flux of 5.69 Mbtu/in2-s & 23 cfm. ...............31
ix

4-14.Comparison Between Nickel Foam, Copper Foam, and Open Channel Coolant Temperature Readings Using a Heat Flux of 5.69 Mbtu/in2-s & 23 cfm. ...............31
4-15.Comparison Between Nickel Foam, Copper Foam, and Open Channel Hot Wall Temperature Readings Using a Heat Flux of 5.69 Mbtu/in2-s & 45 cfm. ...............32
4-16.Comparison Between Nickel Foam, Copper Foam, and Open Channel Coolant Temperature Readings Using a Heat Flux of 5.69 Mbtu/in2-s & 45 cfm. ...............32
4-17.Comparison Between Nickel Foam, Copper Foam, and Open Channel Hot Wall Temperature Readings Using a Heat Flux of 7.58 Mbtu/in2-s & 23 cfm. ...............33
4-18.Comparison Between Nickel Foam, Copper Foam, and Open Channel Coolant Temperature Readings Using a Heat Flux of 7.58 Mbtu/in2-s & 23 cfm. ...............33
4-19.Comparison Between Nickel Foam, Copper Foam, and Open Channel Hot Wall Temperature Readings Using a Heat Flux of 7.58 Mbtu/in2-s & 45 cfm. ...............34
4-20.Comparison Between Nickel Foam, Copper Foam, and Open Channel Coolant Temperature Readings Using a Heat Flux of 7.58 Mbtu/in2-s & 45 cfm. ...............34
4-21.Comparison Between Nickel Foam, Copper Foam, and Open Channel Hot Wall Temperature Readings Using a Heat Flux of 9.48 Mbtu/in2-s & 23 cfm. ...............35
4-22.Comparison Between Nickel Foam, Copper Foam, and Open Channel Coolant Temperature Readings Using a Heat Flux of 9.48 Mbtu/in2-s & 23 cfm. ...............35
4-23.Comparison Between Nickel Foam, Copper Foam, and Open Channel Hot Wall Temperature Readings Using a Heat Flux of 9.48 Mbtu/in2-s & 45 cfm. ...............36
4-24.Comparison Between Nickel Foam, Copper Foam, and Open Channel Coolant Temperature Readings Using a Heat Flux of 9.48 Mbtu/in2-s & 45 cfm. ...............36
4-25.Representation of Thermal Circuit for Heat Transfer into the Metallic Foam..........41
5-1.Representation of Small Testing Apparatus. ...............................................................43
5-2.Open Channel Cross-Section for Small System. .........................................................44
5-3.Copper Foam Cross-Section for Small System. ..........................................................44
5-4.Nickel Foam Cross-Section for Small System. ...........................................................45
5-5.Comparison Between Nickel Foam, Copper Foam, and Open Channel Hot Wall Temperature Readings Using a Heat Flux of 1.9 Mbtu/in2-s & 23 cfm. .................46
5-6.Comparison Between Nickel Foam, Copper Foam, and Open Channel Coolant Temperature Readings Using a Heat Flux of 1.9 Mbtu/in2-s & 23 cfm. .................46
x

5-7.Comparison Between Nickel Foam, Copper Foam, and Open Channel Hot Wall Temperature Readings Using a Heat Flux of 1.9 Mbtu/in2-s & 45 cfm. .................47
5-8.Comparison Between Nickel Foam, Copper Foam, and Open Channel Coolant Temperature Readings Using a Heat Flux of 1.9 Mbtu/in2-s & 45 cfm. .................47
5-9.Comparison Between Nickel Foam, Copper Foam, and Open Channel Hot Wall Temperature Readings Using a Heat Flux of 5.69 Mbtu/in2-s & 23 cfm. ...............48
5-10.Comparison Between Nickel Foam, Copper Foam, and Open Channel Coolant Temperature Readings Using a Heat Flux 5.69 Mbtu/in2-s & 23 cfm. ...................48
5-11.Comparison Between Nickel Foam, Copper Foam, and Open Channel Hot Wall Temperature Readings Using a Heat Flux of 5.69 Mbtu/in2-s & 45 cfm. ...............49
5-12.Comparison Between Nickel Foam, Copper Foam, and Open Channel Coolant Temperature Readings Using a Heat Flux of 5.69 Mbtu/in2-s & 45 cfm. ...............49
5-13.Comparison Between Nickel Foam, Copper Foam, and Open Channel Hot Wall Temperature Readings Using a Heat Flux of 7.58 Mbtu/in2-s & 23 cfm. ...............50
5-14.Comparison Between Nickel Foam, Copper Foam, and Open Channel Coolant Temperature Readings Using a Heat Flux of 7.58 Mbtu/in2-s & 23 cfm. ...............50
5-15.Comparison Between Nickel Foam, Copper Foam, and Open Channel Hot Wall Temperature Readings Using a Heat Flux of 7.58 Mbtu/in2-s & 45 cfm. ...............51
5-16.Comparison Between Nickel Foam, Copper Foam, and Open Channel Coolant Temperature Readings Using a Heat Flux of 7.58 Mbtu/in2-s & 45 cfm. ...............51
5-17.Comparison Between Nickel Foam, Copper Foam, and Open Channel Hot Wall Temperature Readings Using a Heat Flux of 9.48 Mbtu/in2-s & 23 cfm. ...............52
5-18.Comparison Between Nickel Foam, Copper Foam, and Open Channel Coolant Temperature Readings Using a Heat Flux of 9.48 Mbtu/in2-s & 23 cfm. ...............52
5-19.Comparison Between Nickel Foam, Copper Foam, and Open Channel Hot Wall Temperature Readings Using a Heat Flux of 9.48 Mbtu/in2-s & 45 cfm. ...............53
5-20.Comparison Between Nickel Foam, Copper Foam, and Open Channel Coolant Temperature Readings Using a Heat Flux of 9.48 Mbtu/in2-s & 45 cfm. ...............53
7-1.Closed Loop Testing Apparatus Proposed Diagram. ..................................................59
xi

Abstract of Thesis Presented to the Graduate School of the University of Florida in Partial Fulfillment of the
Requirements for the Degree of Master of Science
USE OF METALLIC FOAMS FOR HEAT TRANSFER ENHANCEMENT IN THE COOLING JACKET OF A ROCKET PROPULSION ELEMENT
By
Ryan Jeffrey Avenall
December 2004
Chair: Jacob Chung Major Department: Mechanical and Aerospace Engineering
Rocket propulsion has been used in many different aspects of space travel and
military tasks. Nearly 800 years ago, the Chinese were the first to develop this concept
using solid propellants. Since the early 1900’s, fuel-cooled thrust chambers have been a
concern as well as an ongoing advancement in rocket propulsion. With the higher
demand today for longer lasting and farther travel, and the extreme temperatures that
these elements experience, a break-through technology is needed in the cooling of these
thrust chambers. In this thesis the idea of using a porous metallic foam will be
implemented and tested for its heat transfer capabilities inorder to solve this problem.
The goal is to cool the hot wall temperatures without creating large pressure drops in the
coolant passage.
The testing of this idea involves two systems: a large-scale system and a small-
scale system. In both these systems the coolant will be nitrogen gas compressed to 300
psig. The nitrogen then flows through an annulus and is exhausted into the atmosphere.
xii

Constant heat flux heaters placed inside the inner tube of the annulus will produce the hot
wall temperatures. Then using thermocouples, the hot wall temperatures will be read into
an Excel spreadsheet. The pressure drop is measured using two digital pressure gauges.
For the large system a heat transfer enhancement for the copper foam was found to
be 1.5 or 50% and for nickel foam was found to be 1.82 or 82%. This caused the hot wall
temperatures to decrease by an average of 71.84°F and 100.74°F for the copper and
nickel foams, respectively. The pressure drop through the copper foam and nickel foam
remained about the same and was 1 psig for 23 cfm and 3 psig for 45 cfm in comparison
to zero pressure drop for the open channel system. For the small system a heat transfer
enhancement for the copper foam was found to be 1.14 or 14% and for nickel foam was
found to be 1.15 or 15%. The wall temperatures in this system decreased by an average
of 29.04°F and 36.04°F for the copper and nickel foams respectively. The pressure drop
through the copper foam and nickel foam relative to the open channel is 1.2 psig and 0.8
psig, respectively, for 23 cfm, and for 45 cfm the pressure drop is 2.8 psig and 2.6 psig,
respectively.
xiii

CHAPTER 1 ROCKET PROPULSION
History
Rocket Propulsion is used in many different devices for different purposes.
Propulsion is mainly used for transportation of some kind. Missiles, space aircraft,
military aircraft, satellites, and commercial aircraft are some examples where propulsion
is utilized. The rocket principle is thought to have been founded by Hero of Alexandria
in 67 A.D. He invented many machines that used the reaction principle which is the
theoretical basis for the rocket. Most of his work was successful in the creation of two
opposing jets exhausting steam. Rocket propulsion uses stored matter, or propellants, to
achieve its thrust by combusting and ejecting these propellants. The three main types of
rocket propulsion are solar propulsion, nuclear propulsion, and chemical propulsion.
Two main types of propellants used are solid and liquid propellants. The first inventor of
the rocket is said to be Feng Jishen a Chinese scientist back in 970 A.D. His work dealt
with two experiments using bamboo tubes and gunpowder, which is now similar to what
we use as fireworks. The first time the rocket principle was used as a weapon was back
in 1275. It wasn’t until the twentieth century when rocket propulsion design and theory
started growing rapidly. In 1903, Konstantin Tsiolkovsky, who was a mathematics
teacher, discovered most of the theories for the modern rocket. He developed the rocket
flight equation and invented the multi-stage rocket [1]. He also found that liquid oxygen
and hydrogen would be good propellants to achieve the high exhaust velocity necessary
to travel into space. In 1926, Robert H. Goddard, a professor of physics at Clark
1
2
University in Massachusetts, designed the liquid-fuelled rocket combustion chambers and
nozzles [1]. He also accomplished the first flight using a liquid propellant rocket engine
[2]. Goddard had over 214 patents for rocket apparati that later in 1960 the U.S. bought
to create their own rocket engines. Fuel-cooled thrust chambers stem all the way back to
the early 1900’s, and are in need of new technology to advance rocket propulsion for
centuries to come.
The Russian space program is noted for being the most focused and active program
since rocket engines became a modern mode of transportation. They are credited with
the first artificial satellite, the first man in space, the first spacecraft on the moon, the first
docking of two spacecraft, and the first space station. The main achievement for the
United States space program was having the first man walk on the moon. Now for both
programs the quest continues, and there have been multiple satellites and space travel
since these first accomplishments by both programs.
Structure
The structure of a rocket propulsion element is quite complex and has been studied
for many years. It is in the form of a converging diverging nozzle. This shape provides
for the maximum thrust and performance needed by the element. The design used has
had an ongoing struggle with the amount of cooling necessary for the element. The skin
of the nozzle has to be able to withstand high temperatures, high pressures, as well as
being lightweight. This makes for a complicated task in building a sufficient nozzle for
the system.
Cooling Jacket
In order to achieve very high thrusts, the combustion of the oxidizer and the fuel
must be very powerful. Therefore the gases that escape through the nozzle after

3
combustion are extremely hot. For many years the idea of a cooling jacket has been used
to surround the outside of this nozzle. The purpose for this cooling jacket is to cool the
inner walls of the combustion chamber and nozzle regions, which can help in many ways.
First, the parts surrounding the outside of this nozzle won’t see as much of the heat from
the combustion. Second, the material of the nozzle itself will be at a much cooler
temperature range, increasing its life expectancy. Third, the use of lighter materials will
help with the overall weight requirement of the system.
To use this cooling channel, a fluid of some sort has to be provided to the system
and then recycled through and back around again. The current method, and probably the
most efficient is to have a separate line from the fuel tank deliver a pressurized flow rate
to the cooling jacket. This then will allow for a continuous supply of coolant without
having to attach another tank. Using the fuel is also a good idea because most of the
fuels used are cryogenic. This means that the coolant will enter the jacket at very cold
temperatures allowing cooling of the walls even further. Most of the rocket engines
today have some form of cooling channel or jacket that was just described. However,
further research into these jackets is necessary.
Problems with Cooling
There still exist many problems today with cooling these nozzles even with the
coolant jacket in place. The main problem is that the coolant channel does not have a
large enough heat transfer coefficient to sufficiently decrease the wall temperature. This
is mainly due to the coolant’s fluid properties and dynamics.
The properties of the supercritical fluid dictate how well the fluid will transfer heat.
Supercritical fluids are fluids that are at very high pressures or very high temperatures.
The problem with these supercritical fluids is the extreme pressures they supply to the

4
surrounding apparatus as well as having systems like pumps that can handle these types
of pressures and temperatures. In using a supercritical fluid you also get the benefit of a
much higher heat transfer coefficient when compared to that of a sub-critical fluid. The
use of these fluids provides cooling for the combustion chamber as well as fuel for the
combustion process. By using these fluids for cooling the heat transfer to the fluid helps
heat up the fluid to a much more combustible state.
However, these extreme temperatures are still too high and need to be decreased.
The throat area is the main concern for improved heat transfer through this cooling
jacket. If the heat transfer can be improved then the life expectancy of the nozzle can be
improved which would save money. Therefore, this is an area of great significance, and
research for innovative ideas is an ongoing task. One area being extensively explored is
the use of metallic elements in the cooling channel to increase the heat transfer.

CHAPTER 2 PREVIOUS WORK
Metallic Elements
Metallic Porous Materials
Previous work has been done using the idea that metal’s high conductivity will
work well as an agent in increasing the heat transfer coefficient in certain aspects. Koh
and Stevens [3] found that the heat transfer effectiveness could be greatly increased by
using a porous medium. Koh and Stevens [3] filled a stainless steel annulus with peen
shot (steel particles). The results for Koh and Stevens [3] project were for a fixed coolant
flux of 9.65 sftlb −2 , the heat flux through the wall was increased from 16 to 20
sftBtu −2 and the maximum wall temperature was reduced from 1450 to 350 . As
seen here porous metallic materials can be very helpful in increasing the heat transfer
effectiveness.
Fo
Koh and Colony [4] as well as Bartlett and Viskanta [5] have done analytical
studies on the enhancement of the heat transfer due to a high thermal conductivity porous
medium. In Bartlett and Viskanta [5], their analytical approach for the heat transfer
effectiveness was compared with already known data for a particular diameter and heat
flux. Their results show very similar results to that of the experimental, and prove that
the effectiveness of heat transfer should be greatly increased with the introduction of a
porous medium with high conductivity. Koh and Colony [4] completed a similar
5

6
procedure earlier by using basic models of heat transfer. They discovered that the heat
transfer using a porous medium is increased significantly.
Metallic foams were then looked at as a possibility in enhancement of heat
transfer for rocket engine cooling passages. Brockmeyer et al. [6] showed the benefits of
using metallic foam for heat transfer enhancement. They looked at cooper alloy and
nickel alloy foams. It is stated here that for the heat transfer enhancement to be
beneficial it must be able to enhance the heat transfer, have improved elevated
temperature properties, reduced weight, simplified manufacturing, and lower system cost.
Brockmeyer et al. [6] found that the heat transfer in the foam structure is excellent due to
the enhanced mixing in the flow paths. They discovered that relative to a flat plate the
heat transfer would be enhanced by a factor of 4 for foam packed heat exchangers. The
relatively high void fraction of the foams also helps with the pressure drop criterion
through the cooling chamber.
Another testing of metallic foams for their enhanced heat transfer was conducted
by Boomsma et al. [7]. They used aluminum alloy foams placed in-between two parallel
plates for heat transfer analysis. Boomsma et al. [7] performed experimental tests on
different porosities, flow rates, and even compared their results with the best commercial
heat exchangers available in that size range. The aluminum foam proved to have very
little pressure drop, if any, and an increase in the efficiency of the heat transfer by nearly
two over any commercial product made for the same situation. Metallic foams have been
proven to show that the efficiency of the heat transfer, along with little loss in pressure, is
a viable way to cool processes effectively.

7
Metal Foam Processing and Fabrication
There are many different ways to make metallic foams. Metallic sintering, electro
deposition or chemical vapor decomposition (CVD), metal deposition through
evaporation, and investment casting are a few of the processes. When creating a metallic
foam using metal sintering, metallic particles are suspended in slurry and then coated on
a polymeric foam substrate [8]. The substrate vaporizes during this process, and the
metallic particle becomes an object which is the foam. The CVD method uses the
chemical decomposition of a reactive gas in a vacuum onto a heated substrate [8].
Molten metal infiltration can also be used to form such foam materials such as aluminum
and copper [8]. In this process, the foam precursor is coated with a casting and then
packed into casting sand. This assembly is then heated to decompose the precursor and
to harden the casting. Then the molten metal is pressure infiltrated filling all the voids.
When it solidifies it forms a product with solid struts. However, this process is very
expensive and time consuming [8].
Rocket Combustion Testing
Some examples of previous projects dealing with only rocket engine combustion
help to give a better understanding of what is taking place inside of a rocket engine.
These papers were also used for verification purposes of a numerical model that will be
talked about later in this thesis. Tamura et al. [9] performed an investigation on staged
combustion with liquid oxygen and methane. In their study they used water as the
coolant for the cooling passage, and had a scaled down rocket engine assembly for their
combustion. Their tests looked at different injection geometries, speeds, temperatures,
and different mixture ratios as well. Tamura et al. [9] had results for characteristic
velocity vs. mixture ratio, pre burner temperature vs. mixture ratio, efficiency vs.

8
chamber length, heat flux vs. chamber pressure, and heat flux vs. axial distance away
from the throat. Most of the data collected here is insignificant for our purposes other
than the heat flux vs. axial distance. This will provide a good experimental comparison
between the numerical code and their results. Some assumptions had to be made
however, which could have skewed the results slightly in the numerical simulation. The
coolant velocity, the combustion velocity, and some other geometrical constraints such as
exit diameter were not given in their report. Their results showed about a 9:1 or 9:2 ratio
for heat flux at the throat compared to the combustion chamber.
Results from other papers were also helpful in determining the procedure and
design of our test rig. Elam [10] studied rocket combustion using liquid oxygen and
hydrogen. Here results of hot wall temperatures and heat flux with respect to the location
from the throat were helpful in determining ranges for temperatures and fluxes that might
be needed to get an accurate representation of rocket combustion. Also this paper
showed that many of the rocket engines operate under severe pressures (supercritical
fluids) giving rise to pressure drop concerns with the usage of foam materials.
Heat Transfer Analysis
Sub critical Fluids
Heat transfer analysis of sub critical fluids is based on properties and laminar, or
turbulent flow. For single-phase flow, Incropera and DeWitt [11] present a good
description of the heat transfer analysis. In our case turbulent flow will be the ideal
conditions for consideration. Using Incropera and DeWitt’s [11] ideals of annulus flow
one can start to analyze how the fluid reacts to different initial conditions. For instance,
the overall heat transfer analysis changes when using a free stream approach, a constant
heat flux approach, or even a constant wall temperature approach. For both liquid and

9
vapor phases of the coolant turbulent correlations can be used to figure out the heat
transfer coefficient, the heat flux, and the wall temperatures all of which are extremely
important in designing the test rig for experimental analysis.
For conducting a study on the heat transfer analysis, many equations and theories
are involved. The basic models for heat transfer analysis from Incropera and DeWitt [11]
will be shown here and further explained in Chapter 3. For general considerations
( mspp
sm TThcmP
cmPq
dxdT
−==&&
"
) where DP π= (1)
Eq. (1) explains the energy balance across a basic system with P as the perimeter. For
constant heat flux considerations
xcmPq
TxTp
simm &
"
,)( += (2)
Eq. (2) shows the relationship between the fluid temperature and the wall heat flux. For
constant wall temperature considerations
⎟⎟⎠
⎞⎜⎜⎝
⎛−=
−−
hcm
PxTT
xTT
pims
ms
&exp
)(
,
(3)
Eq. (3) provides an explanation of how the fluid temperature changes due to the constant
surface temperature. When dealing with a free stream constraint the following equation
provides detail into how that heat transfer is considered.
⎟⎟⎠
⎞⎜⎜⎝
⎛−=
−
−=
∆∆
∞
∞
p
s
im
om
i
o
cmAU
TTTT
TT
&exp
,
, (4)
where U is the overall heat transfer coefficient given by
111
−
⎟⎠⎞⎜
⎝⎛ +=
oi hhU (5)

10
For turbulent flow the entrance length and heat transfer analysis differ significantly from
the laminar correlations. Since turbulent flow is our main concern the correlations used
are
61
Re4.4 De
DL
= (6)
4.054
PrRe023.0 DDNu = (7)
Next is the consideration of the two-phase boiling characteristics of a sub critical fluid.
In Collier [12] the two-phase region is described by many correlations. The two-phase
region occurs when the liquid at the surface starts nucleate boiling. Nucleate boiling is
the formation of vapor bubbles by nucleation on the surface and causes the liquid to
change phase. According to Collier [12] there are seven steps to accomplish in order to
calculate the heat transfer coefficient in this region. These steps are listed below.
(a) Calculate 1/Xtt (Martinelli parameter)
1.05.09.01
⎟⎟⎠
⎞⎜⎜⎝
⎛⎟⎟⎠
⎞⎜⎜⎝
⎛⎟⎟⎠
⎞⎜⎜⎝
⎛ −=
g
f
f
gtt quality
qualityXµµ
ρρ
(8)
(b) Evaluate F from figure
(c) Calculate ch
( ) ( )FDk
kc
Dqualitym f
f
fpf
f⎟⎟⎠
⎞⎜⎜⎝
⎛
⎥⎥⎦
⎤
⎢⎢⎣
⎡
⎥⎥⎦
⎤
⎢⎢⎣
⎡ −4.0
,
8.014023.0
µµπ
& (9)
(d) Calculate tpRe
( )
ftp
ff
F
Dqualitym
ReRe
14Re
25.1=
−=
µπ&
(10)
(e) Evaluate S from figure
11
Figure 2-1.Plot of the Reynolds Number Factor, F Referenced from Collier [12].
Figure 2-2.Plot of the Suppression Factor, S Referenced from Collier [12].
(f) Calculate ncbh
( )SpTh
ckh satsat
gfgf
ffpfncb
75.024.024.024.029.05.0
49.045.0,
79.0
00122.0 ∆∆⎥⎥⎦
⎤
⎢⎢⎣
⎡=
ρµσρ
(11)
(g) Calculate tph
cncbtp hhh += (12)

12
These equations are used to evaluate the overall heat transfer coefficient in the two-
phase region. Properties should be taken at the average temperature of the fluid.
Supercritical Fluids and Rocket Heat Transfer
For supercritical fluids the question is whether or not the heat transfer trends are
similar to that of sub critical fluids. This would help in an overall analysis of the fluids
used. The properties of the fluid will be different as well as the way the fluid reacts
chemically at such high pressures and temperatures. Some articles that can be helpful in
better understanding the phenomenon of supercritical fluids are Watts and Chou [13] as
well as Labuntsov [14]. Additional information on supercritical fluids is found in Sutton
and Ross [2]. The detail is limited about the supercritical region other than a graph that
shows that supercritical fluids follow the same pattern of heat transfer as sub critical
fluids except the nucleate boiling region. This graph is shown in the figure below.
Figure 2-3.Plot of Sub Critical and Supercritical Coolant Heat Transfer Referenced from [2].

13
In Sutton and Ross [2] their contribution is the explanation of how heat transfer
analysis is carried out for regeneratively cooled rocket engines. They discuss everything
from the heat transfer coefficients to the method of calculating individual heat fluxes at
different areas of the engine. Some of these ideas or examples are listed below.
( ) AQTThq lo =−= (13)
l
w
g
lg
hkt
h
TTq
11 ++
−= (14)
( )wgog TThq −= (15)
( )wlwgw
TTtkq −⎟
⎠⎞⎜
⎝⎛= (16)
( )lwll TThq −= (17)
These explain the heat flux through different regions as well as the overall heat flux
through the regeneratively cooled thrust chamber.
odg R
kh2
PrRe026.0 4.08.0= (18)
322.0 PrRe023.0
−−= dl Amch&
(19)
These correlations explain the heat transfer coefficient for the hot gases as well as that for
the coolant side during its forced convection as a liquid. These models can be used to get
an overall idea of how the heat transfer throughout the chamber is occurring, and where
problem situations will and can occur.

14
In Barron [15], it discusses how supercritical fluids follow the same pattern of heat
transfer as those of near critical fluids. They discuss in further detail the correlations
used to study the heat transfer for the near critical fluid.
⎥⎦
⎤⎢⎣
⎡⎟⎟⎠
⎞⎜⎜⎝
⎛+=
wb
bwD
fl D
kh
ρµρµ
01457.01PrRe0208.0 4.08.0 (20)
Where the subscript ‘w’ stands for wall temperature, and ‘b’ stands for bulk temperature.
All the other correlations are identical and can be calculated using the non-near
critical correlations.

CHAPTER 3 NUMERICAL AND ANALYTICAL APPROACH
By using all the correlations stated in chapter 2 the numerical analysis can begin.
The analysis is based on a very crude 2-D model of a rocket combustion system, which is
shown below.
Figure 3-1.2-D Geometrical Representation of a Rocket Engine Combustion Chamber for use in Numerical Code.
As seen in this figure the wall thickness will be neglected, therefore neglecting the
conduction heat transfer due to the wall thickness. From this model two different
assumptions are made which change the overall process. First, there is uniform constant
free stream combustion gas temperatures in the combustion chamber, and second, that a
15
16
uniform heat flux on the surface is prevalent. These two models will be built in order to
show real life simulation as well as experimental simulation. Starting with the free
stream combustion gases, the simulation is built on the basis of changing area with
respect to the distance x down the chamber. The analysis is also carried out for sub
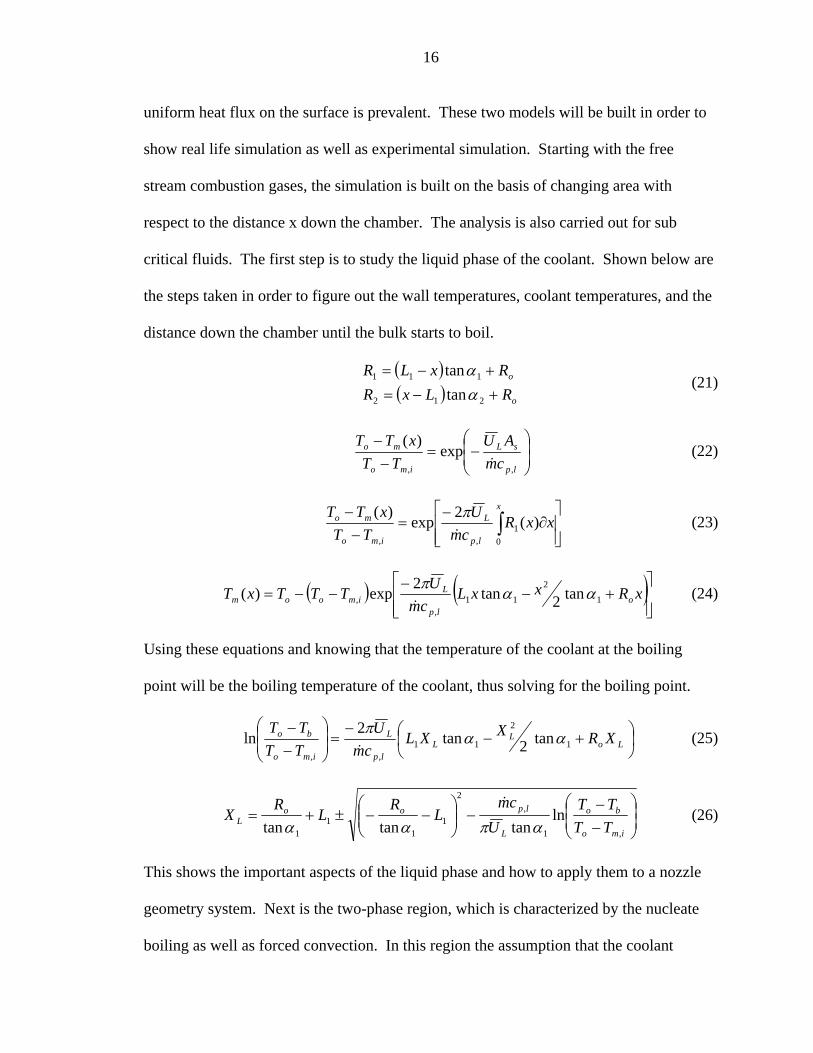
critical fluids. The first step is to study the liquid phase of the coolant. Shown below are
the steps taken in order to figure out the wall temperatures, coolant temperatures, and the
distance down the chamber until the bulk starts to boil.
( )( ) o
o
RLxRRxLR
+−=+−=
212
111
tantan
αα
(21)
⎟⎟⎠
⎞⎜⎜⎝
⎛−=
−−
lp
sL
imo
mo
cmAU
TTxTT
,,
exp)(
& (22)
⎥⎥⎦
⎤
⎢⎢⎣
⎡∂
−=
−−
∫x
lp
L
imo
mo xxRcmU
TTxTT
01
,,
)(2exp)(
&
π (23)
( ) ( )⎥⎥⎦
⎤
⎢⎢⎣
⎡+−
−−−= xRxxL
cmUTTTxT o
lp
Limoom 1
2
11,
, tan2tan2exp)( ααπ&
(24)
Using these equations and knowing that the temperature of the coolant at the boiling
point will be the boiling temperature of the coolant, thus solving for the boiling point.
⎟⎠⎞
⎜⎝⎛ +−
−=⎟
⎟⎠
⎞⎜⎜⎝
⎛
−−
LoL
Llp
L
imo
bo XRXXLcmU
TTTT
1
2
11,,
tan2tan2ln ααπ&
(25)
⎟⎟⎠
⎞⎜⎜⎝
⎛
−−
−⎟⎟⎠
⎞⎜⎜⎝
⎛−−±+=
imo
bo
L
lpooL TT
TTU
cmL
RL
RX
,1
,2
11
11
lntantantan απαα&
(26)
This shows the important aspects of the liquid phase and how to apply them to a nozzle
geometry system. Next is the two-phase region, which is characterized by the nucleate
boiling as well as forced convection. In this region the assumption that the coolant

17
temperature remains constant at the boiling temperature is used. This changes when it
completely vaporizes.
∫∫ ∂∆=∂V
L
g
f
X
Xb
H
H
xxRTUHm )(2 2φπ& (27)
This distance however is based on whether or not it occurs before the throat or after the
throat. Since it is unknown both cases must be considered.
for ( )1LX v ⟨
⎟⎟⎠
⎞⎜⎜⎝
⎛+−+
∆−⎟⎟
⎠
⎞⎜⎜⎝
⎛−−±+=
1
21
12
2
11
11 tan
22
tantantan ααπαα φ
LoLL
b
fgooV
XRXXL
TUhm
LR
LR
X&
(28)
for ( )1LXV ⟩
( )⎥⎥⎦
⎤
⎢⎢⎣
⎡−+−++
∆
−
−⎟⎟⎠
⎞⎜⎜⎝
⎛+−
±−=
2
211
221
2
1
22
2
21
21
tan2
2tantan
tan
tantan
ααα
απ
α
α
φ
LoLL
b
fg
o
oV
XRLXLXL
TUhm
RL
RLX
& (29)
Next the vapor phase must be analyzed. Here only the temperatures need to be
determined, and they follow a similar analysis as the liquid phase. This is also going to
be affected by whether or not the distance to full vaporization takes place before the
throat or after the throat.
for ( )1LX v ⟨ and 1: LXx V=
( ) ( )( ) ⎥
⎥⎦
⎤
⎢⎢⎣
⎡
⎟⎟
⎠
⎞
⎜⎜
⎝
⎛
−+
+−−−−−=
Vo
VV
vp
Vboom
XxR
XXLxxLcmU
TTTxT2
12
11
,
21
21tan2
exp)(απ
& (30)
for ( )1LX v ⟨ and LLx :1=

18
( ) ( )( ) ⎥
⎥⎦
⎤
⎢⎢⎣
⎡
⎟⎟
⎠
⎞
⎜⎜
⎝
⎛
−+
+−−−−=
1
211
22
,1
21
21tan2
exp)()(LxR
LxLxcmU
LTTTxTovp
Vmoom
απ&
(31)
for ( )1LX v ⟩ and LXx V :=
( ) ( )( ) ⎥
⎥⎦
⎤
⎢⎢⎣
⎡
⎟⎟
⎠
⎞
⎜⎜
⎝
⎛
−+
+−−−−−=
Vo
VV
vp
Vboom
XxR
XLXxLxcmU
TTTxT 12
12
2
,
21
21tan2
exp)(απ
& (32)
Then in order to solve for the wall temperatures, a specific equation that works for all
three regions is shown below.
ig
miogs hh
ThThT
+
+= where vli ,2, φ= (33)
These are the main important characteristics needed in order to study what is occurring in
the chambers. The wall temperature being the most important shows how the foam will
affect the overall heat transfer throughout the chamber.
Similarly a constant heat flux simulation is generated to compare with the free
stream simulation. This is used to simulate how the test rig reacts for comparison with
the experimental results as well as what takes place in real simulations with the free
stream gases. Again the first step is to calculate the liquid phase of the coolant.
lp
sm
cmPq
xT
,
"
&=
∂∂ where )(2 1 xRP π= (34)
[ ]xRxxLcmq
TxT olp
simm +−+= 1
211
,
"
, tan21tan
2)( αα
π&
(35)
( )1
",,
2
111
1 tantantan απαα s
lpimbooL q
cmTTL
RRLX
&−−⎟⎟
⎠
⎞⎜⎜⎝
⎛−−±⎟⎟
⎠
⎞⎜⎜⎝
⎛+= (36)

19
The next step to consider is the two-phase region. It is again important to note that the
analysis is dependent upon whether or not the distance to be fully vaporized occurs
before the throat or after the throat.
PdxqdHm s"=& (37)
for ( )1LXV ⟨
⎥⎦
⎤⎢⎣
⎡−⎟⎟
⎠
⎞⎜⎜⎝
⎛++−⎟⎟
⎠
⎞⎜⎜⎝
⎛−−±⎟⎟
⎠
⎞⎜⎜⎝
⎛+= 2
11
1"
2
11
11 tan
22
tantantan Lo
Ls
fgooV X
RLX
qhmR
LR
LXααπαα
& (38)
for ( )1LXV ⟩
( ) ⎥⎦
⎤⎢⎣
⎡++−−+
+⎟⎟⎠
⎞⎜⎜⎝
⎛−
±⎟⎟⎠
⎞⎜⎜⎝
⎛−=
21
2
21
21
2
1
2"
2
12
21
tan2
2tantan
tan
tantan
LXR
LXXLq
hm
LR
RLX
LoLL
s
fg
o
oV
ααα
απ
αα &
(39)
The final aspect to consider is the vapor phase for constant heat flux. However the
temperatures during the vapor phase are again a function of where the distance to full
vaporization occurs.
for ( )1LXV ⟨ and 1: LXx V=
( ) ([ ]VoVVvp
sbm XxRXXLxxL
cmq
TxT −++−−+= 12
12
1,
"
tan21
212
)( απ&
) (40)
for ( )1LXV ⟨ and LLx :1=
( ) ( )[ ]12211
2
,
"
1 tan21
212
)()( LxRLxLxcmq
LTxT ovp
sm −++−+= α
π&
(41)
for ( )1LXV ⟩ and LXx V :=
20
( ) ([ ]VoVVvp
sbm XxRXLXxLx
cmq
TxT −+−−−+= 212
12
,
"
tan21
212
)( απ&
) (42)
The wall temperatures are again calculated by one simple equation. This equation is
dependent on what phase the coolant is in. This equation is shown below.
)("
xThq
T mi
ss += (43)
The same type of analysis is carried out for a cylindrical geometry. These equations are
then used to formulate a simulation for both the free stream combustion gas consideration
and the constant heat flux consideration.
For supercritical fluids the numerical model is different. There is not a two-phase
flow to deal with. The only difference between the calculations for this flow and for the
two-phase flow is how the heat transfer coefficients are calculated. These calculations
are shown in chapter 2.

CHAPTER 4 LARGE SYSTEM EXPERIMENTAL SIMULATION AND RESULTS
Test Apparatus Setup and Procedure
The large test rig for this project is a stainless steel cylindrical annulus which is
set up to test high-pressure gaseous nitrogen. It will operate under the constant heat flux
consideration discussed earlier in chapter 3. The setup and equipment for the testing
procedure is listed below.
Figure 4-1.Representation of Large Testing Apparatus and System.
1. Test Apparatus
2. Band Heaters
3. Power Switching Units
4. Temperature Control Units
21

22
5. Thermocouples
6. Pressure Gauges
7. Piping, valves and parts
8. Nitrogen Tanks
9. Metallic Foam
10. Data Acquisition Board and Computer
The first step is to power up everything starting with the data acquisition unit and ending
with the band heaters. When the band heaters are powered up they will be given enough
time to heat up to an assumed temperature. The system is then charged with 300 psig of
nitrogen, and the exhaust valve is opened enough to obtain the desired flow rate reading.
Eight cases will be run with three tests each completed without any metallic foams
present. These tests include heat fluxes of 1.9 MBtu/in2-s, 5.69 Mbtu/in2-s, 7.58
Mbtu/in2-s and 9.48 Mbtu/in2-s. At each individual heat flux there will be three tests
completed at a flow rate of 45 cfm or 1.16 lb/s @ a pressure of 250 psig and three tests
also completed at a flow rate of 23 cfm or 567 lb/s @ a pressure of 225 psig. The same
process will also be completed for the copper based foam. Figures below show the
structure of this foam and how it is brazed to the outside of the inner tube.

23
Figure 4-2.SEM Photograph of Copper Foam Structure.
Figure 4-3.Photograph Showing the Brazing of the Copper Foam to the Inner Tube.
This same process will be completed for the nickel-based foam. Figures below show
photographs of the structure of this foam as well as how it is brazed.

24
Figure 4-4.SEM Photograph of Nickel Foam Structure.
Figure 4-5.Photograph Showing the Brazing of the Nickel Foam to the Inner Tube.
25
Experimental Results and Comparisons
Some preliminary tests were done to see how the system functioned. The tests
were confusing at first as the temperature profiles were scattered and inconsistent unlike
the conclusions from the theoretical analysis. The temperature profiles were decreasing
in nature at one instant and increasing at another. The first correction attempted was to
check the calibration of the thermocouples. This was done by taking all the
thermocouples and placing them in a glass of cold water. All the results came out almost
identical with a few varying but within the expected limit of the thermocouple reader.
However when the thermocouples were moved around or shaken it was noticed that the
values of some altered. The next step was to change the frequency that the thermocouple
reader responded at from 50 Hz to 400 Hz. This made the difference and now all the
thermocouples seem to be working properly. Just for completion the thermocouples were
also placed in a heated glass of water to make sure that they still read identical
temperatures.
This did not correct the problem with the incorrect and varying temperature
profiles. The next step was to look at the heaters and how they functioned. First the
controllers that supply the power to the heaters are set up to run on a percent power basis.
The max power or heat flux that the heaters can provide is 37 MBtu/in2-s. The
controllers where set up at 2% power or heat flux to check how the heaters worked. It
was determined immediately that the heaters do not heat up uniformly like expected. The
heaters had a cold side (side that heated up slower) and a hot side (side that heated up
faster). The next step then was to see if the hot side of one heater being up against the
cold side of the next heater would produce the same temperature reading. This
functioned best and produced good results when the cold side of the heater was on the

26
inside of the hot side of the other heater. This then gave an almost perfect contact
between the two heaters when heated up because the heaters expand. However this
would not work inside the tubes because it was impractical to push them down the tube
and keep the heater just on the inside of the other. So instead the heaters are pushed
together as they are slid down the tube, which provided good results as well.
The temperature readings appear linear, but that is from a combination of two
things. First it should be linear by theoretical understanding because of the convective
heat transfer across these. Second the heaters having a cold side and a hot side do not
provide the same heat flux uniformly across their surface providing a linear response to
the control. This type of temperature profile however was very consistent over multiple
tests at different heat fluxes and coolant flow rates, and will be used to check the percent
enhancement of the foam to the overall heat transfer. The figure below shows the open
channel cross-section.
Figure 4-6.Open Channel Cross-Section.

27
The test results for the open channel flow cannot be shown in comparison with
that of the numerical model. The reason for this is that the heaters that are used do not
provide a uniform heat flux. Therefore the data will not exactly portray that of a
theoretical constant heat flux at the surface.
The metallic foam is brazed to the outside of the inner tube and fills the gap
between the inner tube and the outer tube of the annulus. The figure below shows the
cross section with the copper foam.
Figure 4-7.Copper Foam Cross Sectional View.
Just like the copper foam, the nickel foam is brazed to the outside of the inner tube and
fills the gap between the inner tube and the outer tube of the annulus. The figure below
shows the cross section with the foam.

28
Figure 4-8.Nickel Foam Cross Sectional View.
The copper foam data as well as the nickel foam data is shown below with the
open channel data for comparison. All 8 test cases are shown below providing the hot
wall temperature, bulk fluid temperature, and the pressure drop.
From these figures, the trend of increasing heat flux provides an increase in the
hot wall temperature which is expected. It is also shown predominantly that with three
tests at each individual test case the temperature profiles remain the same which means
that the system is functioning properly and is calibrated well. From these profiles it is
also determined that a linear increase in temperature over each heated area, and a linear
increase for the coolant temperature is predominant. This is expected with theoretical
analyses explaining this linear dependence.
When looking at the data collected in Appendix D for the copper and nickel
foams some interesting characteristics are found. First of all our notion that the foam

29
Nickel Foam, Copper Foam & Open Channel Hot Wall Temperature Comparison (@ 1.9 Mbtu/in2-s & 23 cfm)
100110120130140150160170180190200210220230240
0 5 10 15 20 25
Length (in)
Tem
pera
ture
(F)
Open Test #1Open Test #2Open Test #3Copper Test #1Copper Test #2Copper Test #3Nickel Test #1Nickel Test #2Nickel Test #3
Figure 4-9.Comparison Between Nickel Foam, Copper Foam, and Open Channel Hot Wall Temperature Readings Using a Heat Flux of 1.9 Mbtu/in2-s & 23 cfm.
Nickel Foam, Copper Foam & Open Channel Coolant Temperature Comparison (@ 1.9 Mbtu/in2-s & 23 cfm)
70
72
74
76
78
80
82
84
86
88
0 0.5 1 1.5 2 2.5
Tem
pera
ture
(F)
Open Test #1
Open Test #2
Open Test #3
Copper Test #1
Copper Test #2
Copper Test #3
Nickel Test #1
Nickel Test #2
Nickel Test #3
Figure 4-10.Comparison Between Nickel Foam, Copper Foam, and Open Channel Coolant Temperature Readings Using a Heat Flux of 1.9 Mbtu/in2-s & 23 cfm.

30
Nickel Foam, Copper Foam & Open Channel Hot Wall Temperature Comparison (@ 1.9 Mbtu/in2-s & 45 cfm)
90100110120130140150160170180190200210220
0 5 10 15 20 25
Length (in)
Tem
pera
ture
(F)
Open Test #1
Open Test #2
Open Test #3
Copper Test #1
Copper Test #2
Copper Test #3
Nickel Test #1
Nickel Test #2
Nickel Test #3
Figure 4-11.Comparison Between Nickel Foam, Copper Foam, and Open Channel Hot Wall Temperature Readings Using a Heat Flux of 1.9 Mbtu/in2-s & 45 cfm.
Nickel Foam, Copper Foam & Open Channel Coolant Temperature Comparison (@ 1.9 Mbtu/in2-s & 45 cfm)
68
70
72
74
76
78
80
82
84
86
88
0 0.5 1 1.5 2 2.5
Tem
pera
ture
(F)
Open Test #1
Open Test #2
Open Test #3
Copper Test #1
Copper Test #2
Copper Test #3
Nickel Test #1
Nickel Test #2
Nickel Test #3
Figure 4-12.Comparison Between Nickel Foam, Copper Foam, and Open Channel Coolant Temperature Readings Using a Heat Flux of 1.9 Mbtu/in2-s & 45 cfm.

31
Nickel Foam, Copper Foam & Open Channel Hot Wall Temperature Comparison (@ 5.69 Mbtu/in2-s & 23 cfm)
160180200220240260280300320340360380400420440460
0 5 10 15 20 25
Length (in)
Tem
pera
ture
(F)
Open Test #1
Open Test #2
Open Test #3
Copper Test #1
Copper Test #2
Copper Test #3
Nickel Test #1
Nickel Test #2
Nickel Test #3
Figure 4-13.Comparison Between Nickel Foam, Copper Foam, and Open Channel Hot Wall Temperature Readings Using a Heat Flux of 5.69 Mbtu/in2-s & 23 cfm.
Nickel Foam, Copper Foam & Open Channel Coolant Temperature Comparison (@ 5.69 Mbtu/in2-s & 23 cfm)
6870727476788082848688909294
0 0.5 1 1.5 2 2.5
Tem
pera
ture
(F)
Open Test #1
Open Test #2
Open Test #3
Copper Test #1
Copper Test #2
Copper Test #3
Nickel Test #1
Nickel Test #2
Nickel Test #3
Figure 4-14.Comparison Between Nickel Foam, Copper Foam, and Open Channel Coolant Temperature Readings Using a Heat Flux of 5.69 Mbtu/in2-s & 23 cfm.

32
Nickel Foam, Copper Foam & Open Channel Hot Wall Temperature Comparison (@ 5.69 Mbtu/in2-s & 45 cfm)
160180200220240260280300320340360380400420440
0 5 10 15 20 25
Length (in)
Tem
pera
ture
(F)
Open Test #1Open Test #2Open Test #3Copper Test #1Copper Test #2Copper Test #3Nickel Test #1Nickel Test #2Nickel Test #3
Figure 4-15.Comparison Between Nickel Foam, Copper Foam, and Open Channel Hot Wall Temperature Readings Using a Heat Flux of 5.69 Mbtu/in2-s & 45 cfm.
Nickel Foam, Copper Foam & Open Channel Coolant Temperature Comparison (@ 5.69 Mbtu/in2-s & 45 cfm)
55
60
65
70
75
80
85
90
95
100
0 0.5 1 1.5 2 2.5
Tem
pera
ture
(F)
Open Test #1
Open Test #2
Open Test #3
Copper Test #1
Copper Test #2
Copper Test #3
Nickel Test #1
Nickel Test #2
Nickel Test #3
Figure 4-16.Comparison Between Nickel Foam, Copper Foam, and Open Channel Coolant Temperature Readings Using a Heat Flux of 5.69 Mbtu/in2-s & 45 cfm.

33
Nickel Foam, Copper Foam & Open Channel Hot Wall Temperature Comparison (@ 7.58 Mbtu/in2-s & 23 cfm)
180200220240260280300320340360380400420440460480500520540
0 5 10 15 20 25
Length (in)
Tem
pera
ture
(F)
Open Test #1
Open Test #2
Open Test #3
Copper Test #1
Copper Test #2
Copper Test #3
Nickel Test #1
Nickel Test #2
Nickel Test #3
Figure 4-17.Comparison Between Nickel Foam, Copper Foam, and Open Channel Hot Wall Temperature Readings Using a Heat Flux of 7.58 Mbtu/in2-s & 23 cfm.
Nickel Foam, Copper Foam & Open Channel Coolant Temperature Comparison (@ 7.58 Mbtu/in2-s & 23 cfm)
65
70
75
80
85
90
95
100
0 0.5 1 1.5 2 2.5
Tem
pera
ture
(F)
Open Test #1
Open Test #2
Open Test #3
Copper Test #1
Copper Test #2
Copper Test #3
Nickel Test #1
Nickel Test #2
Nickel Test #3
Figure 4-18.Comparison Between Nickel Foam, Copper Foam, and Open Channel Coolant Temperature Readings Using a Heat Flux of 7.58 Mbtu/in2-s & 23 cfm.

34
Nickel Foam, Copper Foam & Open Channel Hot Wall Temperature Comparison (@ 7.58 Mbtu/in2-s & 45 cfm)
180200220240260280300320340360380400420440460480500520
0 5 10 15 20 25
Length (in)
Tem
pera
ture
(F)
Open Test #1Open Test #2Open Test #3Copper Test #1Copper Test #2Copper Test #3Nickel Test #1Nickel Test #2Nickel Test #3
Figure 4-19.Comparison Between Nickel Foam, Copper Foam, and Open Channel Hot Wall Temperature Readings Using a Heat Flux of 7.58 Mbtu/in2-s & 45 cfm.
Nickel Foam, Copper Foam & Open Channel Coolant Temperature Comparison (@ 7.58 Mbtu/in2-s & 45 cfm)
65
70
75
80
85
90
95
100
0 0.5 1 1.5 2 2.5
Tem
pera
ture
(F)
Open Test #1Open Test #2Open Test #3Copper Test #1Copper Test #2Copper Test #3Nickel Test #1Nickel Test #2Nickel Test #3
Figure 4-20.Comparison Between Nickel Foam, Copper Foam, and Open Channel Coolant Temperature Readings Using a Heat Flux of 7.58 Mbtu/in2-s & 45 cfm.

35
Nickel Foam, Copper Foam & Open Channel Hot Wall Temperature Comparison (@ 9.48 Mbtu/in2-s & 23 cfm)
200220240260280300320340360380400420440460480500520540560580600620
0 5 10 15 20 25
Length (in)
Tem
pera
ture
(F)
Open Test #1
Open Test #2
Open Test #3
Copper Test #1
Copper Test #2
Copper Test #3
Nickel Test #1
Nickel Test #2
Nickel Test #3
Figure 4-21.Comparison Between Nickel Foam, Copper Foam, and Open Channel Hot Wall Temperature Readings Using a Heat Flux of 9.48 Mbtu/in2-s & 23 cfm.
Nickel Foam, Copper Foam & Open Channel Coolant Temperature Comparison (@ 9.48 Mbtu/in2-s & 23 cfm)
65
70
75
80
85
90
95
100
105
0 0.5 1 1.5 2 2.5
Tem
pera
ture
(F)
Open Test #1
Open Test #2
Open Test #3
Copper Test #1
Copper Test #2
Copper Test #3
Nickel Test #1
Nickel Test #2
Nickel Test #3
Figure 4-22.Comparison Between Nickel Foam, Copper Foam, and Open Channel Coolant Temperature Readings Using a Heat Flux of 9.48 Mbtu/in2-s & 23 cfm.

36
Nickel Foam, Copper Foam & Open Channel Hot Wall Temperature Comparison (@ 9.48 Mbtu/in2-s & 45 cfm)
180200220240260280300320340360380400420440460480500520540560580600
0 5 10 15 20 25
Length (in)
Tem
pera
ture
(F)
Open Test #1Open Test #2Open Test #3Copper Test #1Copper Test #2Copper Test #3Nickel Test #1Nickel Test #2Nickel Test #3
Figure 4-23.Comparison Between Nickel Foam, Copper Foam, and Open Channel Hot Wall Temperature Readings Using a Heat Flux of 9.48 Mbtu/in2-s & 45 cfm.
Nickel Foam, Copper Foam & Open Channel Coolant Temperature Comparison (@ 9.48 Mbtu/in2-s & 45 cfm)
646668707274767880828486889092949698
0 0.5 1 1.5 2 2.5
Tem
pera
ture
(F)
Open Test #1
Open Test #2
Open Test #3
Copper Test #1
Copper Test #2
Copper Test #3
Nickel Test #1
Nickel Test #2
Nicke Test #3
Figure 4-24.Comparison Between Nickel Foam, Copper Foam, and Open Channel Coolant Temperature Readings Using a Heat Flux of 9.48 Mbtu/in2-s & 45 cfm.

37
would enhance the heat transfer is true. We did not get the enhancement we thought
were possible, but that is mainly due to the open system parameters and the fact that the
heaters did not function as intended. If the system had been closed loop then the tests
could have been run for hours until a true equilibrium had been accomplished. This then
might have described the true form of the foam enhancement. The average percent
enhancement is based on the average overall temperatures recorded experimentally and
the supposed heat flux. Using these parameters we can come up with an estimate of the
heat transfer coefficient at each position down the tube and compare the values with and
without foam.
fs
s Thq
T +="
(44)
Ts = surface temperature (hot wall temperature)
Tf = fluid bulk temperature
The results for the foam filled channels in comparison to that of the open channel are now
considered. As can be determined from these tables shown in Appendix E, the average
heat transfer enhancement remains relatively the same for the particular foams. However
with increasing heat flux the temperature differential increases. The overall systems
average heat transfer enhancement is 50.22% for the copper foam and 81.58% for the
nickel foam. From analytical reviews a higher enhancement is expected. Particularly
from Kuzay et al. [16] it is shown how liquid nitrogen interacts with metallic foams.
From this paper the Nusselt number and the friction factor can be calculated for our
particular situation. The friction factor is calculated as shown below.
29.623.0Re8.26 −−= εCf (45)

38
Here the constant C is equal to 1.0 for brazed foams, the Reynolds number will be
replaced with our Reynolds number based on the hydraulic diameter, and ε is the
porosity of the metallic foam. The friction factor will then be used to calculate the
pressure drop. This pressure drop uses the normal horizontal cylinder calculation.
fD
LVph2
2
ρ=∆ (46)
The Nusselt number is calculated as shown below.
2.556.0606.0 −= εPeNud (47)
The Nusselt number here is based on the diameter and for our purposes it will be based
on the hydraulic diameter. is the Peclet number, which is equivalent to the Reynolds
number times the Prandtl number. Again we will use the Reynolds number based on the
hydraulic diameter to determine the Peclet number. In order to calculate the porosity it
either had to be provided to me from the manufacturer, or it can be calculated with a few
known parameters. A study done by Zhao et al. [8] shows the particular details needed
for my foam purchased from Porvair Fuel Cell Company. Their study shows an average
cell size and the ligament size of a copper foam from Porvair. Their average cell size is
.104 in and the ligament size is .0104 in. Then it explains how to use these two
parameters to calculate the porosity of the foam. Shown below are the steps in order to
calculate the porosity.
Pe
( )⎟⎟⎟⎟
⎠
⎞
⎜⎜⎜⎜
⎝
⎛
⎟⎠⎞⎜
⎝⎛ −−
−=
04.01exp1
13
118.1επ
ε
p
f
dd
(48)
Here df is the ligament diameter and dp is the pore size diameter or cell size diameter.
From here the porosity can be calculated and used to solve for the Nusselt number as well

39
as the friction factor. By using the before mentioned diameters of the copper foam (they
will also be used to estimate the porosity of the nickel foam) the porosity used in the
experiments was found to be .955.
The fluid properties were then calculated at two different state points 225 psig &
90 F and 250 psig & 85 F. The density at the two given points is 1.07 lb/ft3 and 1.2 lb/ft3
respectively. The viscosity is 3.84e-7 lb-s/ft2 and 3.82e-7 lb-s/ft2 respectively. The
conductivity is 0.0034 lb/s-R for both states. Then the Prandtl number is .717 and .718
respectively. The Reynolds and Peclet numbers can now be calculated and used to
calculate the Nusselt number and friction factor for our system. The first friction factor is
2.59 and the second is 2.94. These factors lead to the expected pressure drops of 0.18 psi
and 0.06 psi respectively. The corresponding pressure drops experimentally were 4 psi
and 2 psi for the copper foam respectively, and 3 psi and 1 psig respectively for the nickel
foam, which are much higher than the expected pressure drops. This could be due to
many different aspects. First, the correlations being used for liquid nitrogen might not be
a good assumption for gaseous nitrogen. However, being that liquids usually have a
higher viscosity than gases this does not seem to be a basis reason for error. Second, the
foam could not be completely open in all pore areas. With closer inspection of the foam
it is evident that some of the pores are closed off and not completely open. In the making
of the foam it is possible that not all the pores become open of its metallic substance,
therefore causing a higher pressure drop in the system. Third, there is a possible flaw in
the design of the system’s apparatus. Inside the outer tube there is an inner tube that
connects together immediately after the foam to provide a method to insert the
thermocouples and heaters for testing. The two flanges that are bolted together form this
40
connection. These flanges create a disturbance in the flow’s path, which can also be
shown in these results.
Using the traditional internal flow calculation for the open channel Nusselt
number, the new Nusselt number which is based on the foam properties can now be
compared. The internal flow calculation is shown below.
4.08.0 PrRe023.0 DhDhNu = (49)
Using this equation for the experimental system, the Nusselt number for the two different
Reynolds number cases is 187.49 @ 45 cfm and 120.83 @ 23 cfm. The Nusselt numbers
based on the foam properties are 384.56 @ 45 cfm and 282.78 @ 23 cfm. This shows
that there should be a great enhancement by using the foam over the open channel flow.
The conductivities for each case with the foam and with the open channel change. Using
this information the overall expected heat transfer ratio or enhancement could be
calculated. For the open channel case, all that is needed is the conductivity of the fluid.
In order to calculate the heat transfer coefficient the Nusselt number definition as
described below is used.
khD
Nu hDh = (50)
For the foam case the effective conductivity must be calculated in order to find the
effective heat transfer coefficient. This conductivity is calculated using the equation
below from Calmidi and Mahajan [17].
( ) fseff kkk εε +−= 1 (51)
where ks is the conductivity of the solid
kf is the conductivity of the fluid

41
The conductivity of the solid is found by using the given data sheet from Porvair for the
various foams, and calculating the relative density based on the porosity mentioned
earlier. The conductivities where found to be 0.219 lb/s-R for copper foam and 0.05 lb/s-
R for the nickel foam. Using these properties the calculated effective conductivities are
0.0131 lb/s-R for the copper foam and 0.0055 lb/s-R for the nickel foam. The typical
heat transfer coefficient ratios were then found to be 7.97 for copper foam and 3.34 for
nickel foam at 45 cfm, and 8.87 for copper foam and 3.81 for nickel foam at 23 cfm.
In experiments it was shown that the average heat transfer was increased by a
factor of 1.5 for the copper foam and 1.82 for the nickel foam. This could be low for a
couple of reasons. First, the heaters that were supplied do not act as constant heat flux
heaters. Therefore, not providing the right amount of heat flux specified. The second
reason is how well the foam is brazed to the tube. If there is space between many of the
ligaments and the tube then the heat transfer will not be greatly increased. In light of this
an analytical review of the gap being a contact resistance was undertaken. A simple
thermal circuit was constructed describing the path for the heat transfer through the wall
and is shown below.
Figure 4-25.Representation of Thermal Circuit for Heat Transfer into the Metallic Foam.
effC
C
B
B
A
A
Nsx
hKL
KL
KL
TTq
11,"
+++
−= (52)

42
Here the subscript ‘s’ stands for surface, ‘N’ stands for nitrogen, ‘A’ stands for the
stainless steel wall, ‘B’ stands for the brazing foil, ‘C’ stands for the nitrogen gap, and
is calculated from the above equations for the heat transfer with metallic foam
inserts. The wall temperature used was 192.92 F and the nitrogen temperature used was
82.87 F. The calculated heff was 23.733 lb/ft-s-R for 23 cfm. The thickness and
conductivity of the stainless steel wall is 0.12 in and 2.07 lb/s-R respectively. The
thickness and conductivity of the foil is 0.079 in and 53.1 lb/s-R respectively, and the
conductivity of the nitrogen gap is 0.0034 lb/s-R. With the known heat flux for the
particular flow rate and wall temperatures collected the length of the gap can now be
solved for. The result is 0.019 in in length for the gap of nitrogen between the foil and
the foam. After talking with engineers at Porvair it is difficult for them to get a good
braze on this large of a system. This is most likely the reason for the lower numbers in
heat transfer enhancement.
effh
CHAPTER 5 SMALL SYSTEM EXPERIMENTAL SIMULATION AND RESULTS
Test Apparatus Setup and Procedure
The small test rig for this project will again be an annulus made from stainless
steel, but all the parts are off the shelf parts that screw together. It will also operate under
the constant heat flux consideration talked about earlier in chapter 3. The setup and
equipment for the testing procedure is listed below.
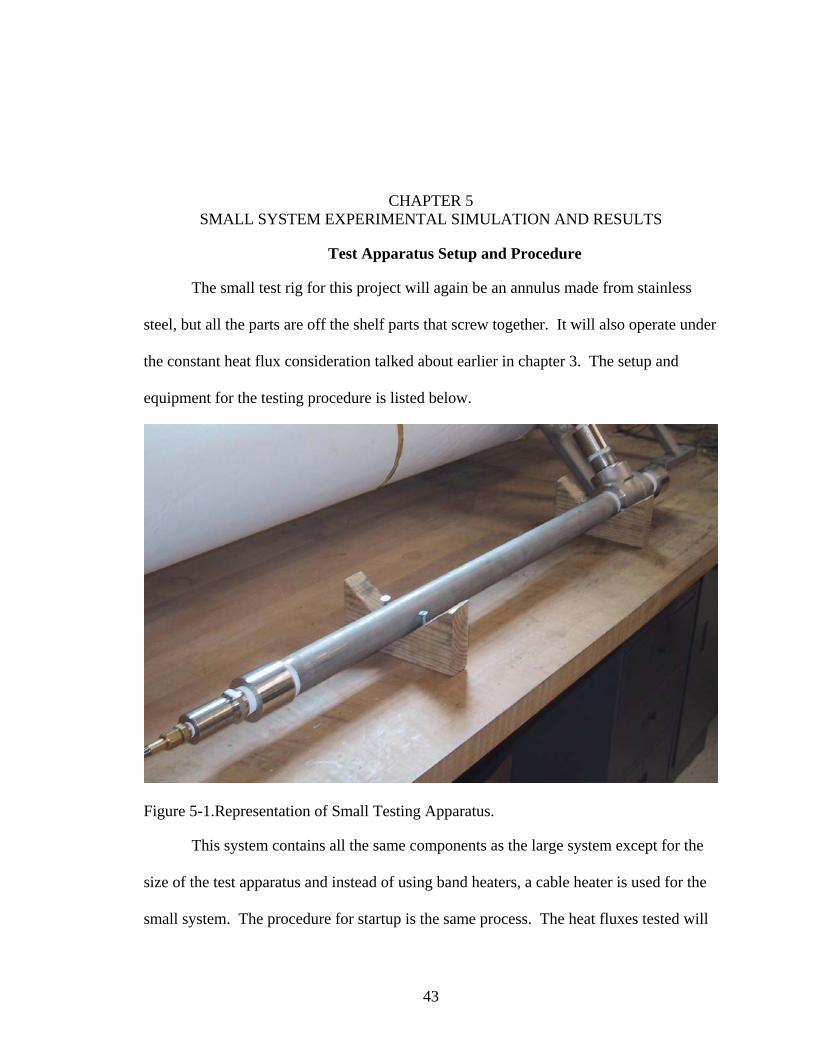
Figure 5-1.Representation of Small Testing Apparatus.
This system contains all the same components as the large system except for the
size of the test apparatus and instead of using band heaters, a cable heater is used for the
small system. The procedure for startup is the same process. The heat fluxes tested will
43

44
also remain the same as well as the flow rates. By using the same flow rates, the velocity
of the nitrogen will be much quicker in the smaller system than in the larger system
providing faster cooling.
Experimental Results and Comparison
Like the large system, the small system will test open channel heat transfer, heat
transfer with copper foam inserts, and heat transfer with nickel foam inserts. The system
has a hydraulic diameter of 0.56 inches, and contains a foam testing section of 5 inches in
length. The foam will be the same 10 ppi foam that was used in the larger system. The
cross-sectional views of each testing situation are shown below.
Figure 5-2.Open Channel Cross-Section for Small System.
Figure 5-3.Copper Foam Cross-Section for Small System.

45
Figure 5-4.Nickel Foam Cross-Section for Small System.
All 8 test cases for the three testing situations are combined below for comparison
purposes, providing the hot wall temperature, bulk fluid temperature, and the pressure
drop. The test results are also compared to the large system to determine the validity of
the large system results.
These figures show that the trend of increasing the heat flux provides an increase in
the hot wall temperature which is expected. It is also shown predominantly that with
multiple tests of each individual test case the temperature profiles remain the same, which
means that the system is running properly and is calibrated. From these profiles it is also
shown that a linear increase in temperature over each heated area, and a linear increase
for the coolant temperature is predominant. This is expected with theoretical analyses
that explain this linear dependence.
When looking at the data collected for the copper and nickel foams, some
interesting characteristics are found. First of all our notion that the foam would enhance
the heat transfer is true. However, the results that are obtained are not what was
expected. The heat transfer enhancement is much lower than anticipated, and is much

46
Nickel Foam, Copper Foam & Open Channel Hot Wall Temperature Comparison (@ 1.9 Mbtu/in2-s & 23 cfm)
100110120130140150160170180190200210220230240
0 1 2 3 4 5
Length (in)
Tem
pera
ture
(F)
Open Test #1Open Test #2Open Test #3Copper Test #1Copper Test #2Copper Test #3Nickel Test #1Nickel Test #2Nickel Test #3
Figure 5-5.Comparison Between Nickel Foam, Copper Foam, and Open Channel Hot Wall Temperature Readings Using a Heat Flux of 1.9 Mbtu/in2-s & 23 cfm.
Nickel Foam, Copper Foam & Open Channel Coolant Temperature Comparison (@ 1.9 Mbtu/in2-s & 23 cfm)
70
72
74
76
78
80
82
84
86
88
0 0.5 1 1.5 2 2.5
Tem
pera
ture
(F)
Open Test #1Open Test #2Open Test #3Copper Test #1Copper Test #2Copper Test #3Nickel Test #1Nickel Test #2Nickel Test #3
Figure 5-6.Comparison Between Nickel Foam, Copper Foam, and Open Channel Coolant Temperature Readings Using a Heat Flux of 1.9 Mbtu/in2-s & 23 cfm.

47
Nickel Foam, Copper Foam & Open Channel Hot Wall Temperature Comparison (@ 1.9 Mbtu/in2-s & 45 cfm)
90100110120130140150160170180190200210220
0 1 2 3 4 5
Length (in)
Tem
pera
ture
(F)
Open Test #1Open Test #2Open Test #3Copper Test #1Copper Test #2Copper Test #3Nickel Test #1Nickel Test #2Nickel Test #3
Figure 5-7.Comparison Between Nickel Foam, Copper Foam, and Open Channel Hot Wall Temperature Readings Using a Heat Flux of 1.9 Mbtu/in2-s & 45 cfm.
Nickel Foam, Copper Foam & Open Channel Coolant Temperature Comparison (@ 1.9 Mbtu/in2-s & 45 cfm)
68
70
72
74
76
78
80
82
84
86
88
0 0.5 1 1.5 2 2.5
Tem
pera
ture
(F)
Open Test #1Open Test #2Open Test #3Copper Test #1Copper Test #2Copper Test #3Nickel Test #1Nickel Test #2Nickel Test #3
Figure 5-8.Comparison Between Nickel Foam, Copper Foam, and Open Channel Coolant Temperature Readings Using a Heat Flux of 1.9 Mbtu/in2-s & 45 cfm.

48
Nickel Foam, Copper Foam & Open Channel Hot Wall Temperature Comparison (@ 5.69 Mbtu/in2-s & 23 cfm)
160180200220240260280300320340360380400420440460
0 1 2 3 4 5
Length (in)
Tem
pera
ture
(F)
Open Test #1Open Test #2Open Test #3Copper Test #1Copper Test #2Copper Test #3Nickel Test #1Nickel Test #2Nickel Test #3
Figure 5-9.Comparison Between Nickel Foam, Copper Foam, and Open Channel Hot Wall Temperature Readings Using a Heat Flux of 5.69 Mbtu/in2-s & 23 cfm.
Nickel Foam, Copper Foam & Open Channel Coolant Temperature Comparison (@ 5.69 Mbtu/in2-s & 23 cfm)
6870727476788082848688909294
0 0.5 1 1.5 2 2.5
Tem
pera
ture
(F)
Open Test #1Open Test #2Open Test #3Copper Test #1Copper Test #2Copper Test #3Nickel Test #1Nickel Test #2Nickel Test #3
Figure 5-10.Comparison Between Nickel Foam, Copper Foam, and Open Channel Coolant Temperature Readings Using a Heat Flux 5.69 Mbtu/in2-s & 23 cfm.

49
Nickel Foam, Copper Foam & Open Channel Hot Wall Temperature Comparison (@ 5.69 Mbtu/in2-s & 45 cfm)
160180200220240260280300320340360380400420440
0 1 2 3 4 5
Length (in)
Tem
pera
ture
(F)
Open Test #1
Open Test #2
Open Test #3
Copper Test #1
Copper Test #2
Nickel Test #1
Nickel Test #2
Figure 5-11.Comparison Between Nickel Foam, Copper Foam, and Open Channel Hot Wall Temperature Readings Using a Heat Flux of 5.69 Mbtu/in2-s & 45 cfm.
Nickel Foam, Copper Foam & Open Channel Coolant Temperature Comparison (@ 5.69 Mbtu/in2-s & 45 cfm)
55
60
65
70
75
80
85
90
95
100
0 0.5 1 1.5 2 2.5
Tem
pera
ture
(F)
Open Test #1
Open Test #2
Open Test #3
Copper Test #1
Copper Test #2
Nickel Test #1
Nickel Test #2
Figure 5-12.Comparison Between Nickel Foam, Copper Foam, and Open Channel Coolant Temperature Readings Using a Heat Flux of 5.69 Mbtu/in2-s & 45 cfm.

50
Nickel Foam, Copper Foam & Open Channel Hot Wall Temperature Comparison (@ 7.58 Mbtu/in2-s & 23 cfm)
180200220240260280300320340360380400420440460480500520540
0 1 2 3 4 5
Length (in)
Tem
pera
ture
(F)
Open Test #1Open Test #2Open Test #3Copper Test #1Copper Test #2Nickel Test #1Nickel Test #2
Figure 5-13.Comparison Between Nickel Foam, Copper Foam, and Open Channel Hot Wall Temperature Readings Using a Heat Flux of 7.58 Mbtu/in2-s & 23 cfm.
Nickel Foam, Copper Foam & Open Channel Coolant Temperature Comparison (@ 7.58 Mbtu/in2-s & 23 cfm)
65
70
75
80
85
90
95
100
0 0.5 1 1.5 2 2.5
Tem
pera
ture
(F)
Open Test #1Open Test #2Open Test #3Copper Test #1Copper Test #2Nickel Test #1Nickel Test #2
Figure 5-14.Comparison Between Nickel Foam, Copper Foam, and Open Channel Coolant Temperature Readings Using a Heat Flux of 7.58 Mbtu/in2-s & 23 cfm.

51
Nickel Foam, Copper Foam & Open Channel Hot Wall Temperature Comparison (@ 7.58 Mbtu/in2-s & 45 cfm)
180200220240260280300320340360380400420440460480500520
0 1 2 3 4 5
Length (in)
Tem
pera
ture
(F)
Open Test #1Open Test #2Open Test #3Copper Test #1Copper Test #2Nickel Test #1Nickel Test #2
Figure 5-15.Comparison Between Nickel Foam, Copper Foam, and Open Channel Hot Wall Temperature Readings Using a Heat Flux of 7.58 Mbtu/in2-s & 45 cfm.
Nickel Foam, Copper Foam & Open Channel Coolant Temperature Comparison (@ 7.58 Mbtu/in2-s & 45 cfm)
65
70
75
80
85
0 0.5 1 1.5 2 2.5
Tem
pera
ture
(F)
Open Test #1Open Test #2Open Test #3Copper Test #1Copper Test #2Nickel Test #1Nickel Test #2
Figure 5-16.Comparison Between Nickel Foam, Copper Foam, and Open Channel Coolant Temperature Readings Using a Heat Flux of 7.58 Mbtu/in2-s & 45 cfm.

52
Nickel Foam, Copper Foam & Open Channel Hot Wall Temperature Comparison (@ 9.48 Mbtu/in2-s & 23 cfm)
200220240260280300320340360380400420440460480500520540560580600620
0 1 2 3 4 5
Length (in)
Tem
pera
ture
(F)
Open Test #1
Open Test #2
Open Test #3
Copper Test #1
Copper Test #2
Nickel Test #1
Nickel Test #2
Figure 5-17.Comparison Between Nickel Foam, Copper Foam, and Open Channel Hot Wall Temperature Readings Using a Heat Flux of 9.48 Mbtu/in2-s & 23 cfm.
Nickel Foam, Copper Foam & Open Channel Coolant Temperature Comparison (@ 9.48 Mbtu/in2-s & 23 cfm)
65
70
75
80
85
90
95
100
105
0 0.5 1 1.5 2 2.5
Tem
pera
ture
(F)
Open Test #1
Open Test #2
Open Test #3
Copper Test #1
Copper Test #2
Nickel Test #1
Nickel Test #2
Figure 5-18.Comparison Between Nickel Foam, Copper Foam, and Open Channel Coolant Temperature Readings Using a Heat Flux of 9.48 Mbtu/in2-s & 23 cfm.

53
Nickel Foam, Copper Foam & Open Channel Hot Wall Temperature Comparison (@ 9.48 Mbut/in2-s & 45 cfm)
180200220240260280300320340360380400420440460480500520540560580600
0 1 2 3 4 5
Length (in)
Tem
pera
ture
(F)
Open Test #1
Open Test #2
Open Test #3
Copper Test #1
Copper Test #2
Nickel Test #1
Nickel Test #2
Figure 5-19.Comparison Between Nickel Foam, Copper Foam, and Open Channel Hot Wall Temperature Readings Using a Heat Flux of 9.48 Mbtu/in2-s & 45 cfm.
Nickel Foam, Copper Foam & Open Channel Coolant Temperature Comparison (@ 9.48 Mbtu/in2-s & 45 cfm)
72
74
76
78
80
82
0 0.5 1 1.5 2 2.5
Tem
pera
ture
(F)
Open Test #1
Open Test #2
Open Test #3
Copper Test #1
Copper Test #2
Nickel Test #1
Nickel Test #2
Figure 5-20.Comparison Between Nickel Foam, Copper Foam, and Open Channel Coolant Temperature Readings Using a Heat Flux of 9.48 Mbtu/in2-s & 45 cfm.

54
lower then the results shown with the larger system. With a smaller system better
controllability was expected as well as quicker response to the heat transfer, but based on
the results this was not achieved. Many characteristics could have caused this
unfavorable result with the most obvious being the process of installing the heaters and
thermocouples. The thermocouples were placed on the inside of the coil heater for the
smaller system because of clearance issues, but in the larger system the thermocouples
were located between the outside of the band heater and the inner wall. Also in the small
system the thermocouples were connected to the heater using a product called JB Weld
that is widely used in the automobile industry, but not knowing it’s conductivity
properties creates difficulty in determining the heat transfer characteristics.
A positive result is the small magnitude of pressure drop that is associated with the
foam. In comparing both the larger system and smaller system the pressure drops
through the foams stayed relatively constant from one system to the next. The pressure
drop that occurred with the copper foam at 23 cfm for the larger system was 1 psi and for
the smaller system was 1.2 psi. These pressures are taken relative to the pressure drop
that occurred with open channel flow and proves that the foam induces low pressure
drops. This was expected since the length and diameter ratio stayed the same between
the two systems. The pressure drop plays an important role in how effective the heat
transfer is, but more importantly how feasible it is to use foam in a high-pressure minimal
loss system. For the nickel the pressure drop produced similar results with 1 psi for the
larger system and 0.8 psi for the smaller system.
The average heat transfer enhancement although not favorable still proved the
theory. For the copper foam the enhancement is 14% in comparison to 50% for the larger

55
system, and for the nickel foam 15% in comparison to 82% for the larger system. These
numbers are far from what is desired, but proved that a better process is needed to
determine the feasibility of the foams for use in rocket propulsion elements. The pressure
drop and enhancement show that this is a viable technology for propulsion elements and
needs to be considered further.
CHAPTER 6 PRACTICAL ROCKET ENGINE APPLICATION
For scaling purposes these experimental results for the copper foam and nickel
foam were used to determine what could possibly happen at rocket engine specifications.
The properties that were used to determine the heat transfer enhancement and pressure
drop are a combination of specifications known as well as some from page 333 of Rocket
Propulsion Elements [2]. The specifications used are as follows: wall thickness is 0.02
in, total flow area for the coolant is .566 in2, max heat flux is 60 Btu/in2s, and a max wall
temperature of 1400 R. Assumed properties were as follows: Reynolds number is
1,000,000, the pressure of the coolant is 1500 psi, and the temperature of the coolant at
the highest heat flux is 90 R. The coolant temperature provides us with a Prandtl number
of 1.22 and a conductivity of 0.0104 lb/s-R. Using the Nusselt number and the effective
conductivity correlations in chapter 4 the Nusselt number with foam is 2025.37 with a
porosity of 95%, and the effective conductivity is 0.024 lb/s-R with the foam
conductivity being .287 lb/s-R. By using these correlations an effective heat transfer
coefficient can be calculated, and is found to be 691.54 lb/ft-s-R. Using the Nusselt
correlation in chapter 4 for internal flow without foam the Nusselt number is 1570.91.
The heat transfer coefficient for the internal flow without foam is 228.99 lb/ft-s-R. We
also know that the heat flux is equal to the heat transfer coefficient multiplied by the
temperature difference between the wall and the coolant. Since the heat flux is going to
stay the same whether or not there is foam in the cooling channel we can then set the two
56

57
equations equal to each other and solve for the new surface temperature. The new
surface temperature would be 523.79 R compared to the original temperature of 1400 R.
By using my experimental results where there is an average of 1.5 times the enhancement
in heat transfer then the new surface temperature would be 963.33 R compared to 1400
R. For the pressure drop calculation an average temperature of the coolant which is
194.508 R will be used to calculate the properties and determine the pressure drop over a
2-foot length. The properties are as follows: Prandtl number is 0.785, the conductivity is
0.0116 lb/s-R, the density is 1.36 lb/ft3, and the viscosity is 1.13e-7 lb-s/ft2. Using the
definition of the Reynolds number the velocity is calculated to be 37.75 ft/s for a
Reynolds number of 1,000,000. Using the correlations for friction factor and pressure
drop as outlined in chapter 4 the expected pressure drop can be determined. This
expected pressure drop comes out to be 9.11 psi with a friction factor of 1.54. With my
experimental results of 3 psi at an expected 0.18 psi, then the pressure drop for this
system would be 151.78 psi with an expected of 9.11 psi. These numbers depict a
positive heat transfer enhancement even with my experimental results as well as minimal
pressure drop. However, these correlations and scaling based on my experimental results
need to be performed on exact dimensions of a cooling channel and with exact
specifications for that rocket engine that the cooling channel in question resides. When
this is completed a more accurate representation of what can be achieved with this idea of
metallic foam inserts used in the cooling channels will be shown. Also a more accurate
representation of how much pressure drop through these cooling passages can be
achieved.

CHAPTER 7 RECOMMENDATIONS FOR FUTURE WORK
This experimental project can be improved especially in the heating elements that
are used in the test rig. These heating elements do not provide a uniform constant heat
flux which is desired. Results that could compare with the numerical code would be
more favorable in this situation. Also with these heating elements it might be more
beneficial to use some kind of combustion process to simulate activity that is closer to the
actual function of a rocket engine. I believe that this would give more insight into the
enhancement due to the foam, and be directly applicable to the rocket engines in use
today. However, using a constant heat flux model can still be beneficial where the
enhancement of the foam can be scaled to the largest heat flux in a rocket engine. This
would then provide an estimate of how well the foam improves the most critical point on
a rocket engine.
The next improvement would be to make the system a closed loop system unlike
it’s current state of an open loop system. The open loop system uses the nitrogen directly
from the tanks at a relatively constant pressure, and the system exhausts the nitrogen into
the atmosphere. This causes many problems with the system with the most important
being the time frame that the nitrogen can be used. As the nitrogen exhausts into the
atmosphere less nitrogen is available from the tanks. After a certain time the pressure in
the system starts to decreases at a given volumetric flow rate. When using the larger heat
fluxes it takes an excessive amount of time to come to an equilibrium state. Even then
58

59
with any of the heat fluxes it is not a guarantee that the system is able to reach
equilibrium. With a closed loop system the testing could continue for hours with out a
huge loss in nitrogen which would provide a better estimate of the equilibrium state.
The closed loop system would have a pump that cycles the nitrogen and
overcomes any small pressure drop in the system. When the nitrogen exits the test rig it
will enter into a heat exchanger in order to cool it back down to its original starting
temperature. This system is shown below.
Figure 7-1.Closed Loop Testing Apparatus Proposed Diagram.
Using a closed loop system will improve the measurements for flow rate and pressure. In
the closed loop system both the flow rate and pressure would remain constant which
would provide more accurate results for the overall system parameters. There also could
be some temperature control instituted at the inlet of the apparatus to make sure the
temperature remains constant at the inlet to the system.

60
Another problem that could have skewed some of the data was the placement of
the thermocouples which were placed on top of the heaters between the heaters and the
inner wall of the inner tube. Because of the expanding nature of the heaters the
thermocouples could then be held tightly in place. A better solution is needed to imbed
the thermocouples in the wall of the inner tube from the inside of the tube. This would
provide a better understanding of what is taking place in the wall itself without having the
heaters dictate the results. Also imbedding some thermocouples into the foam in
different areas would have been beneficial to see how the foam was reacting to the wall
heat flux.
Another ongoing problem is how to perfectly braze or connect the foam to the
surface. When inspecting the foam not every single ligament that wraps around the pipe
is actually sintered to the pipe. This is extremely necessary in order to achieve maximum
enhancement of the heat transfer. If there is any space at all between the ligament and the
surface the contact resistance of that gap is extremely high, and is incapable of achieving
good conduction at that particular point. As shown in chapter 4 the length of the gap only
has to be one half of a millimeter to achieve the skewed data that was taken. The idea of
compressing the foam into the foil before brazing seems like a very plausible technique
as long as the compression does not deform the foam. If too much deformation is caused
then the void percentage or porosity decreases and the pressure drop will increase.
The pressure drop of the foam could also be improved by constructing the foam
so that some pores are not blocked. This will then provide the most efficient flow
through the foam that can be achieved. Another consideration is designing a better inner
tube for the apparatus. With the connection flanges at the end of the inner tube the

61
pressure drop is skewed, and is not an accurate representation of the pressure drop
through the foam. The foams can also be created with a 5 ppi (pores per linear inch)
instead of ours which was 10 ppi which will allow more flow to pass through and
therefore decreasing the pressure drop.
Finally a concentrated model of the nozzle throat region would be ideal. If
building a converging-diverging shape a more accurate representation of the rocket
engine can be tested and simulated. The foam would then be reacting similar to the most
critical point on a rocket engine. The overall enhancement could then determine how the
critical point could be better cooled and protected.
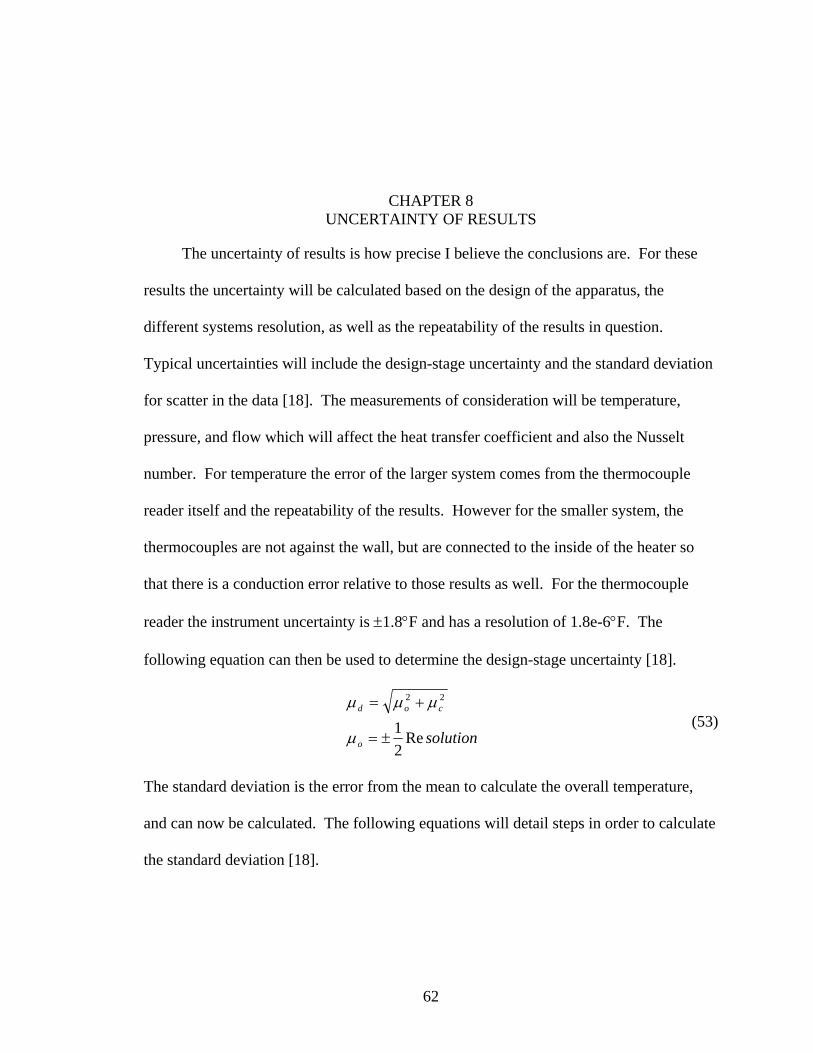
CHAPTER 8 UNCERTAINTY OF RESULTS
The uncertainty of results is how precise I believe the conclusions are. For these
results the uncertainty will be calculated based on the design of the apparatus, the
different systems resolution, as well as the repeatability of the results in question.
Typical uncertainties will include the design-stage uncertainty and the standard deviation
for scatter in the data [18]. The measurements of consideration will be temperature,
pressure, and flow which will affect the heat transfer coefficient and also the Nusselt
number. For temperature the error of the larger system comes from the thermocouple
reader itself and the repeatability of the results. However for the smaller system, the
thermocouples are not against the wall, but are connected to the inside of the heater so
that there is a conduction error relative to those results as well. For the thermocouple
reader the instrument uncertainty is ±1.8°F and has a resolution of 1.8e-6°F. The
following equation can then be used to determine the design-stage uncertainty [18].
solutiono
cod
Re21
22
±=
+=
µ
µµµ (53)
The standard deviation is the error from the mean to calculate the overall temperature,
and can now be calculated. The following equations will detail steps in order to calculate
the standard deviation [18].
62

63
( )∑
∑
=
=
−−
=
=
=
±=
N
iiT
pv
N
ii
Tpvi
TTN
S
t
TN
T
StTT
1
22
,
1
,
11
303.4
1
(54)
By using these two error calculations the uncertainty can be determined in the
temperature measurements for the larger system. For the smaller system the conduction
error also must be calculated. This error will be based on the conductivity of the heater,
the length of the heater, as well as the heat flux that is provided by the heater. This error
is ±1.8°F for 1.9 Mbtu/in2-s, ±5.598°F for 5.69 Mbtu/in2-s, ±7.452°F for 7.58 Mbtu/in2-
s, and ±9.324°F for 9.48 Mbtu/in2-s. These are calculated using the conductivity of the
heater which is 2.37 Rs
lb−
. Using these equations the uncertainty of the temperature
data for the larger system is , and is for the smaller system. Fo828.27± Fo566.28±
For pressure calculations a digital pressure gage is used to measure the static
pressure at the inlet to the apparatus and at the exit. The resolution for these pressure
gages is 0.1 psi and the instrument uncertainty is ±1 psi. Using the same process for the
temperature the uncertainty in pressure is ±1.479 psi. For the flow measurement the
same process is followed with a resolution of 2 scfm, and instrument uncertainty of ±1
scfm which provides a total uncertainty of ±1.414 scfm. Using this information the
uncertainty of the heat transfer coefficient is ±2.46e-5 Rsft
lb−−
for the larger system
and ±2.4e-5 Rsft
lb−−
for the smaller system.

64
The data in the appendices reflects the values that have the uncertainties explained
in this chapter. There may be other uncertainties that may have occurred from instrument
malfunction or other undeterminable quantities. These uncertainties are the best
description for the data recorded in these experiments using the values that would
influence them the most.
Table 8-1.Uncertainty of Results Apparatus Temperature Pressure Flow Rate Heat Transfer Enhancement
F Psi Cfm % Large ±27.828 ±1.479 ±1.414 ±0.0646 Small ±28.566 ±1.479 ±1.414 ±0.063

CHAPTER 9 CONCLUSIONS
In conclusion the engineering modeling and overall experimentation was a success.
For the large system even though the results did not meet expectations they did prove that
the theory of using a metallic medium will increase the heat transfer enhancement. The
results for pressure drop were also positive, but the pressure drop did not meet
expectations. The heat transfer enhancement can be explained by defective brazing of the
foam to the outside of the hot wall. When looking at the test section it is clear that there
is space between the ligaments of the foam and the hot wall. The connection of these
ligaments to the hot wall is vital to the transfer of heat from one medium to the next.
When analyzing a thermal circuit to predict the amount of space between the wall and the
foam that would provide the desired enhancement it was found that a distance of only 0.5
0.02 in would work. This then corresponds to the fact that if I can see the gap then this
gap is the main reason for our lack of heat transfer enhancement. When discussing with
the engineers that built and brazed our foam they stated that it is very difficult for them to
get good contact on such a large piece. With the smaller system the engineers advised
that the contact would be much better and that there should be improved performance.
For the small system the results were not what was expected as the results were
much lower than the larger system. However, the system still produced results of
increasing heat transfer and minimal pressure drop which is favorable. The
thermocouples that were used to measure the wall temperature were attached to the inside
65

66
of the heater using a product called JB Weld. The problem with using this product is the
conductivity is not known which doesn’t allow for the calculation of the heat transfer
through the material. I believe that this is the main reason for the unfavorable results
obtained from this system. The temperature differential across the heater itself also has a
major effect on the heat transfer read by the thermocouples.
The results for these systems provide heat transfer enhancements for the copper
foam of 50% for the larger system and 14% for the smaller system. The nickel foam
provided heat transfer enhancements of 82% for the larger system and 15% for the
smaller system. The pressure drops are 1 psi at 23 cfm and 3 psi at 45 cfm for copper in
the larger system and 1.2 psi at 23 cfm and 2.8 psi at 45 cfm for copper in the smaller
system. For nickel foam the pressure drops were about the same in all cases.
When scaling these results to rocket engine specifications it is calculated that the
expected heat transfer enhancement would be 1.55 or 55% and the expected pressure
drop would be 151.78 psi. These results are all based on assumptions, and need to be
scaled to an exact system with current coolant properties for that particular rocket engine.
By analyzing these results new technology for the brazing technique is needed in
order to achieve the full potential of the porous metallic medium or foams. Some ideas
are already being tested while others are still in the development stage. One possibility is
to have one side of the system under vacuum, and the other side under pressure in order
to press the ligaments into the brazing foil so that when they are heated everything sinters
together.
For the future a combustion test rig would be the best scenario to predict heat
transfer enhancements from the metallic foams. Some theories for this are also in the

67
development stage such as creating a half converging-diverging nozzle where the bottom
side is flat and the top side is the converging-diverging shape. On the flat side the
material will be clear in order to see the hot wall which will be covered with a
temperature sensitive paint. This then could be photographed to get a complete picture of
how the hot wall temperature profiles appear. The foam would then conform to the
outside of the converging-diverging shape, and hot air will be passed through the
chamber to simulate hot combustion gases.

APPENDIX A NOMENCLATURE
R inside radius of the outer skin Ro inside radius of the inner skin or the radius of the nozzle throat XL distance where the liquid begins to boil XV distance where the liquid becomes completely vaporized A cross sectional flow area of the coolant thk wall thickness D hydraulic diameter
gh heat transfer coefficient of the combustion gases
lh heat transfer coefficient of the coolant in its liquid phase
φ2h heat transfer coefficient of the coolant in its two phase region
vh heat transfer coefficient of the coolant in its vapor phase
LU overall heat transfer during the liquid phase
φ2U overall heat transfer during the two phase region
vU overall heat transfer during the vapor phase
fk thermal conductivity of the combustion gases
lk thermal conductivity of the coolant in its liquid phase
dRe Reynolds number based on diameter Pr Prandtls number for combustion gases
lPr Prandtls number for the coolant in liquid phase
vPr Prandtls number for the coolant in vapor phase
oT combustion gas temperature in degree F
bT boiling temperature of the coolant in degree F
imT , coolant inlet temperature in degree F
1LT coolant temperature at L1 in degree F
sT wall surface temperature in degree F m& coolant mass flow rate
lpc , specific heat of the coolant during its liquid phase
vpc , specific heat of the coolant during its vapor phase
gRe Reynolds number based on the gaseous form of the coolant quality quality of the coolant
lµ kinematic viscosity of the coolant in liquid phase
68

69
gµ kinematic viscosity of the coolant in vapor phase f friction factor
loFr Froude number with all flow as liquid
LTNu Nusselt number for laminar-turbulent flow
lρ density of the coolant in liquid phase
gρ density of the coolant in vapor phase
fgh heat of vaporization of the coolant "sq heat flux
1R inside radius of the inner skin upstream of the nozzle throat
2R inside radius of the inner skin downstream of the nozzle throat
1L length from entrance of nozzle to the throat
2L length from throat to exit of nozzle L total length of nozzle
1α angle of inclination upstream of throat
2α angle of inclination downstream of throat As surface area d coolant channel width

APPENDIX B COOLANT PROPERTIES
Table B-1. Properties for Liquid Nitrogen Referenced from [15]. Temp. psat rhof Cp mu k hfg Pr sigmaL Betat
(K) (kPa) (kg/m3) (kJ/kg-K)
(muPa-s)
(mW/m-K) (kJ/kg) (mN/m) (K-1)
65 17.4 860.9 2.008 278 158.7 214 3.52 11.66 0.0047 70 38.5 840 2.024 220 149.9 208.3 2.97 10.48 0.0050475 76 818.1 2.042 173 143 202.3 2.47 9.3 0.0054477.36 101.3 807.3 2.051 158 139.6 199.3 2.32 8.75 0.0056680 136.7 795.1 2.063 141 136.2 195.8 2.14 8.22 0.0059285 228.4 771 2.088 119 129.3 188.7 1.922 7.18 0.0065 90 359.8 745.6 2.122 104 122.4 180.9 1.803 6.12 0.0072395 539.8 718.6 2.17 93 115.5 172 1.747 5.08 0.00816100 777.8 689.6 2.24 85 108.5 161.6 1.755 4.04 0.00942105 1083.6 657.7 2.35 78 101.1 149.4 1.813 0.01119110 1467.2 621.7 2.533 73 93.6 135 1.976 0.01394115 1939.4 579.3 2.723 68 84.7 117.3 2.19 0.01884120 2512.9 524.9 2.92 65 74.6 94.3 2.54 0.0305 125 3204.4 436.8 3.124 62 61.5 54.9 3.14
Table B-2. Properties for Nitrogen Vapor Referenced from [15]. Temp. rhog Cp mu k Pr
(K) (kg/m3) (kJ/kg-K) (muPa-s) (mW/m-K)
65 0.911 1.056 4.62 6.12 0.797 70 1.893 1.064 4.95 6.58 0.8 75 3.532 1.076 5.29 7.03 0.81 77.36 4.604 1.084 5.41 7.23 0.811 80 6.071 1.095 5.62 7.49 0.822 85 9.789 1.13 5.94 7.95 0.844 90 15.027 1.185 6.27 8.4 0.885 95 22.21 1.279 6.6 8.86 0.953 100 31.9 1.407 6.98 9.33 1.053 105 44.93 1.593 7.54 10.16 1.182 110 62.57 1.88 8.26 11.14 1.394 115 87.21 2.36 9.32 12.59 1.75 120 124.44 3.29 10.27 13.91 2.43 125 197.08 5.86 12.86 16.69 4.51
70

71
Table B-3. Properties for Liquid Water Referenced from [11]. Temp. p vf *
10^3 hfg cp,f mu,f * 10^6 kf Prf sigma *
10^3 beta * 10^6
(K) (bars) (m3/kg) (kJ/kg) (kJ/kg-K) (Ns/m2) (mW/m-K) (N/m) (K-1)
300 0.03531 1.003 2438 4.179 855 613 5.83 71.7 276.1 310 0.06221 1.007 2414 4.178 695 628 4.62 70 361.9 320 0.1053 1.011 2390 4.18 577 640 3.77 68.3 436.7 330 0.1719 1.016 2366 4.184 489 650 3.15 66.6 504 340 0.2713 1.021 2342 4.188 420 660 2.66 64.9 566 350 0.4163 1.027 2317 4.195 365 668 2.29 63.2 624.2 360 0.6209 1.034 2291 4.203 324 674 2.02 61.4 697.9 370 0.904 1.041 2265 4.214 289 679 1.8 59.5 728.7 373.15 1.0133 1.044 2257 4.217 279 680 1.76 58.9 750.1 380 1.2869 1.049 2239 4.226 260 683 1.61 57.6 788 390 1.794 1.058 2212 4.239 237 686 1.47 55.6 841 400 2.455 1.067 2183 4.256 217 688 1.34 53.6 896 410 3.302 1.077 2153 4.278 200 688 1.24 51.5 952 420 4.37 1.088 2123 4.302 185 688 1.16 49.4 1010 430 5.699 1.099 2091 4.331 173 685 1.09 47.2 440 7.333 1.11 2059 4.36 162 682 1.04 45.1 450 9.319 1.123 2024 4.4 152 678 0.99 42.9 460 11.71 1.137 1989 4.44 143 673 0.95 40.7 470 14.55 1.152 1951 4.48 136 667 0.92 38.5
Table B-4. Properties for Water Vapor Referenced from [11].
Temp. p Vg cp,g mu,g * 10^6 kg Prg
(K) (bars) (m3/kg) (kJ/kg-K) (Ns/m2) (mW/m-
K) 300 0.03531 39.13 1.872 9.09 19.6 0.857 310 0.06221 22.93 1.882 9.49 20.4 0.873 320 0.1053 13.98 1.895 9.89 21 0.894 330 0.1719 8.82 1.911 10.29 21.7 0.908 340 0.2713 5.74 1.93 10.69 22.3 0.925 350 0.4163 3.846 1.954 11.09 23 0.942 360 0.6209 2.645 1.983 11.49 23.7 0.96 370 0.904 1.861 2.017 11.89 24.5 0.978 373.15 1.0133 1.679 2.029 12.02 24.8 0.984 380 1.2869 1.337 2.057 12.29 25.4 0.999 390 1.794 0.98 2.104 12.69 26.3 1.013 400 2.455 0.731 2.158 13.05 27.2 1.033 410 3.302 0.553 2.221 13.42 28.2 1.054 420 4.37 0.425 2.291 13.79 29.8 1.075 430 5.699 0.331 2.369 14.14 30.4 1.1 440 7.333 0.261 2.46 14.5 31.7 1.12 450 9.319 0.208 2.56 14.85 33.1 1.14 460 11.71 0.167 2.68 15.19 34.6 1.17 470 14.55 0.136 2.79 15.54 36.3 1.2

APPENDIX C LARGE SYSTEM COLLECTED DATA

73
Table C-1.Test Results for a Heat Flux of 1.9 Mbtu/in2-s. 23 cfm 45 cfm
Test # T (F) @ T (F) @ T (F) @ N2 In N2 Out P T (F) @ T (F) @ T (F) @ N2 In N2 Out P X=0 in X=10 in X=20 in (F) (F) (Psi) X=0 in X=10 in X=20 in (F) (F) (Psi)
Open 1 159.278 227.3252 227.9768 75.78 75.7755 250 – 250 134.283 201.44489 203.39474 73.92 78.1767 225 –225
Open 2 167.050 229.8974 229.8974 73.72 75.2967 250 – 250 146.755 212.85109 213.71793 69.10 76.2695 225 –225
Open 3 162.328 221.49 227.558 75.34 76.4629 250 – 250 147.809 208.27061 212.60477 69.29 76.2389 225 –225
Copper 1 116.277 182.42126 187.40555 79.76 82.6727 250 – 248 113.455 177.94101 187.47365 78.96 82.9950 225 –221
Copper 2 118.831 190.07349 195.48978 76.27 83.8909 250 – 248 113.635 181.2204 189.2365 73.17 84.8174 225 –221
Copper 3 117.881 189.5883 195.87119 78.46 82.0455 250 – 248 113.351 181.34206 191.74677 71.44 85.5640 225 –221
Nickel 1 104.318 153.28725 182.75182 77.44 84.3848 250 – 249 103.183 146.55618 179.05389 78.99 83.9215 225 –222
Nickel 2 102.781 153.31686 186.46452 72.54 85.9833 250 – 249 100.981 148.1098 182.774 75.67 85.5276 225 –222
Nickel 3 101.901 151.81512 185.17941 71.66 86.6705 250 – 249 97.6681 145.12112 181.95186 70.56 86.9174 225 –222

74
Table C-2.Test Results for a Heat Flux of 5.69 Mbtu/in2-s. 23 cfm 45 cfm
Test # T (F) @ T (F) @ T (F) @ N2 In N2 Out P T (F) @ T (F) @ T (F) @ N2 In N2 Out P X=0 in X=10 in X=20 in (F) (F) (Psi) X=0 in X=10 in X=20 in (F) (F) (Psi)
Open 1 270.29 429.4525 433.2375 69.88 77.0507 250 –250 250.161 411.75292 413.64544 71.18 75.2201 225 –225
Open 2 284.87 438.8863 444.3536 69.17 81.0526 250 –250 271.904 424.10916 426.84283 64.86 78.0789 225 –225
Open 3 295.86 443.2950 455.2811 68.72 86.4217 250 –250 274.225 424.10198 429.98986 59.47 81.4317 225 –225
Copper 1 184.492 376.81930 391.83865 79.91 86.6322 250 – 248 168.423 342.30212 381.86007 73.82 89.5055 225 –221
Copper 2 185.344 376.59332 397.53579 79.44 86.1689 250 – 248 173.517 343.25683 381.12249 77.74 90.7403 225 –221
Copper 3 187.756 377.25683 402.63143 73.88 93.1427 250 – 248 170.246 342.43515 385.81216 71.43 95.4023 225 –221
Nickel 1 176.461 302.76589 394.15112 80.34 84.6011 250 – 249 169.478 280.11035 388.23553 80.26 85.6463 225 –222
Nickel 2 173.756 299.48980 402.07992 81.13 90.9873 250 – 249 164.486 276.47708 386.47784 77.14 84.0919 225 –222
Nickel 3 164.880 291.88162 399.13226 78.00 93.2346 250 – 249 161.692 274.17184 387.13412 77.39 84.7868 225 –222

75
Table C-3.Test Results for a Heat Flux of 7.58 Mbtu/in2-s. 23 cfm 45 cfm
Test # T (F) @ T (F) @ T (F) @ N2 In N2 Out P T (F) @ T (F) @ T (F) @ N2 In N2 Out P X=0 in X=10 in X=20 in (F) (F) (Psi) X=0 in X=10 in X=20 in (F) (F) (Psi)
Open 1 328.033 516.68865 525.94104 66.93 89.3400 250 –250 307.078 498.96701 503.59198 74.60 82.2235 225 –225
Open 2 334.812 524.05572 525.10717 68.87 89.2662 250 –250 315.739 503.20904 507.83523 67.58 86.8526 225 –225
Open 3 335.708 520.48193 527.83984 73.56 88.5713 250 –250 315.561 503.40328 508.65893 67.01 92.1013 225 –225
Copper 1 208.951 439.59527 472.60073 79.44 87.7290 250 – 248 199.158 427.77948 464.56900 77.82 85.2194 225 –221
Copper 2 211.918 450.25210 481.36550 77.58 85.6444 250 – 248 197.252 417.31130 458.09515 77.20 87.7290 225 –221
Copper 3 206.692 441.24813 485.19686 72.81 95.8905 250 – 248 195.347 420.29760 468.85986 69.85 95.1661 225 –221
Nickel 1 198.530 352.23730 481.19842 78.74 86.1383 250 – 249 190.708 330.63854 471.92694 76.93 86.7872 225 –222
Nickel 2 196.587 353.72534 478.89318 78.75 86.1459 250 – 249 191.814 335.52566 475.52236 76.50 85.0184 225 –222
Nickel 3 188.818 353.75427 485.01846 76.09 88.8643 250 – 249 190.954 327.07125 464.38754 78.08 85.2500 225 –222

Table C-4.Test Results for a Heat Flux of 9.48 Mbtu/in2-s. 23 cfm 45 cfm
Test # T (F) @ T (F) @ T (F) @ N2 In N2 Out P T (F) @ T (F) @ T (F) @ N2 In N2 Out P X=0 in X=10 in X=20 in (F) (F) (Psi) X=0 in X=10 in X=20 in (F) (F) (Psi)
Open 1 382.471 597.07354 606.11560 71.70 92.3136 250 –250 339.472 559.33056 572.41320 77.46 83.0671 225 –225
Open 2 383.537 597.71154 603.59942 71.93 93.6655 250 –250 358.313 572.01416 577.90197 70.09 87.7947 225 –225
Open 3 368.068 583.60125 590.11993 73.47 88.9379 250 –250 364.457 573.28295 584.00732 66.07 91.8349 225 –225
Copper 1 224.565 482.07531 546.82489 68.70 104.990 250 – 248 215.219 473.84771 519.88720 77.41 87.2658 225 –221
Copper 2 224.289 482.64846 534.57421 75.14 90.1468 250 – 248 215.480 466.11245 525.60638 71.40 96.2706 225 –221
Copper 3 220.426 483.52532 537.55334 68.23 102.951 250 – 248 210.438 464.16293 515.45806 76.49 88.5943 225 –221
Nickel 1 206.374 388.66555 558.18426 76.77 94.4712 250 – 249 193.114 349.69885 523.45385 76.95 86.5862 225 –222
Nickel 2 202.676 368.97787 531.26098 78.32 87.2888 250 – 249 209.631 368.36495 539.06091 78.80 88.4316 225 –222
Nickel 3 214.405 389.31463 547.05664 76.12 88.6632 250 – 249 198.059 343.10491 522.36676 76.46 85.6520 225 –222
76

APPENDIX D LARGE SYSTEM HEAT TRANSFER ENHANCEMENTS

Table D-1.Average Temperatures @ Heat Flux = 1.9 Mbtu/in2-s 23 cfm 45 cfm
Type Position Avg. Wall T Avg. N2 T Avg. Wall T Avg. N2 T (in) (F) (F) (F) (F)
Open Channel X=0 162.8865814 74.9489619 142.9490407 70.77190908Open Channel X=10 226.2375895 75.39702352 207.5221965 73.83348973Open Channel X=20 229.0490519 75.84508515 209.9058126 76.89507039Copper Foam X=0 117.6630986 78.16603343 113.4805324 74.5269165Copper Foam X=10 187.3610178 80.51787567 180.1678212 79.49287923Copper Foam X=20 192.92217 82.86971792 189.4856364 84.45884196Nickel Foam X=0 103.0001271 73.883667 100.6110509 75.07815297Nickel Foam X=10 152.8064117 79.78161621 146.595703 80.26685587Nickel Foam X=20 184.7985839 85.67956543 181.259918 85.4555587
78Table D-2.Heat Transfer Enhancement @ Heat Flux = 1.9 Mbtu/in2-s. 23 cfm 45 cfm
Type Position h – Ratio % Enhancement Temp. Differential (F) h – Ratio % Enhancement Temp. Differential (F) Copper X=0 2.22643427 122.64 45.2234828 1.852899414 85.29 29.4685Copper X=10 1.411794552 41.18 38.8765717 1.3279243 32.79 27.35437523Copper X=20 1.392099529 39.21 36.1268819 1.266445795 26.64 20.42017616Copper Avg. 1.676776117 67.68 40.07564546 1.482423169 48.24 25.7476838Nickel X=0 3.020202978 202.02 59.8864543 2.826828815 182.68 42.3379898Nickel X=10 2.06560751 106.56 73.4311778 2.015543953 101.55 60.9264935Nickel X=20 1.545656616 54.57 44.250468 1.388357933 38.84 28.6458946Nickel Avg. 2.210489035 121.05 59.1893667 2.076910233 107.69 43.97012596

Table D-3.Average Temperatures @ Heat Flux = 5.69 Mbtu/in2-s. 23 cfm 45 cfm
Type Position Avg. Wall T Avg. N2 T Avg. Wall T Avg. N2 T (in) (F) (F) (F) (F)
Open Channel X=0 283.6784058 69.26132202 265.4305623 65.17510732Open Channel X=10 437.2113139 75.38485082 419.9880269 71.70937782Open Channel X=20 444.2907918 81.50837962 423.4927165 78.2436142Copper Foam X=0 185.8645325 77.74797058 170.7290802 74.33611552Copper Foam X=10 376.8898214 83.19547516 342.664703 83.10943349Copper Foam X=20 397.3352966 88.64797974 382.9315796 91.88275147Nickel Foam X=0 171.6995341 79.82757568 165.218867 78.27136231Nickel Foam X=10 298.0457763 84.71764628 276.9197591 81.55653254Nickel Foam X=20 398.4544377 89.60771688 387.2825012 84.84170278
79Table D-4.Heat Transfer Enhancement @ Heat Flux = 5.69 Mbtu/in2-s. 23 cfm 45 cfm
Type Position h – Ratio % Enhancement Temp. Differential (F) h – Ratio % Enhancement Temp. Differential (F) Copper X = 0 1.983202944 98.32 97.813873 2.07749036 107.75 94.7014821 Copper X = 10 1.231983073 23.2 60.3214925 1.34182846 34.18 77.32332393 Copper X = 20 1.175242364 17.52 46.95549517 1.18622399 18.62 40.5611369 Copper Avg. 1.463476127 46.35 68.36362022 1.535180937 53.52 70.86198098Nickel X = 0 2.333868652 133.39 111.9788717 2.303176563 130.32 100.2116953 Nickel X = 10 1.696102915 69.61 139.1655376 1.782723674 78.27 143.0682679 Nickel X = 20 1.174635791 17.46 45.8363541 1.141542755 14.15 36.2102153 Nickel Avg. 1.734869119 73.49 98.9935878 1.742480997 74.25 93.163392833

80Table D-5.Average Temperatures @ Heat Flux = 7.58 Mbtu/in2-s. 23 cfm 45 cfm
Type Position Avg. Wall T Avg. N2 T Avg. Wall T Avg. N2 T (in) (F) (F) (F) (F)
Open Channel X=0 332.8514709 69.79203542 312.7929891 69.7369105Open Channel X=10 520.4087728 79.42562739 501.8597819 78.39803314Open Channel X=20 526.2960205 89.05921936 506.6953837 87.05915578Copper Foam X=0 209.1875204 76.6129303 197.2526092 74.9626592Copper Foam X=10 443.6985067 83.1838061 421.7961324 82.1671168Copper Foam X=20 479.7210388 89.75468191 463.8413391 89.3715744Nickel Foam X=0 194.645401 77.86675852 191.1592153 77.1743036Nickel Foam X=10 353.238973 82.45815191 331.0784912 81.42978790Nickel Foam X=20 481.7033589 87.04954529 470.6122843 85.68527221
Table D-6.Heat Transfer Enhancement @ Heat Flux = 7.58 Mbtu/in2-s. 23 cfm 45 cfm
Type Position h – Ratio % Enhancement Temp. Differential (F) h – Ratio % Enhancement Temp. Differential (F) Copper X = 0 1.984237216 98.42 123.6631506 1.987539275 98.75 115.5403798 Copper X = 10 1.223204337 22.32 76.71026613 1.246838195 24.68 80.0636495 Copper X = 20 1.121216724 12.12 46.5749817 1.120614446 12.06 42.8540446 Copper 1.451663972 Avg. 1.442886092 44.29 82.31639947 45.16 79.48602464Nickel X = 0 2.25263310 125.26 138.2060699 2.132353089 113.24 121.6337738 Nickel X = 10 1.62856122 62.86 167.1697998 1.696230515 69.62 170.7812907 Nickel X = 20 1.107899597 10.79 44.5926616 1.090170902 9.02 36.0830994 Nickel Avg. 1.663031305 66.30 116.6561771 1.639584835 63.96 109.4993879

Table D-7.Average Temperatures @ Heat Flux = 9.48 Mbtu/in2-s. 23 cfm 45 cfm
Type Position Avg. Wall T Avg. N2 T Avg. Wall T Avg. N2 T (in) (F) (F) (F) (F)
Open Channel X=0 378.0259298 72.37232971 354.0811971 71.2113088Open Channel X=10 592.7954509 82.00568517 568.2092285 79.38845952Open Channel X=20 599.944987 91.63904063 578.1075032 87.56561025Copper Foam X=0 223.0940094 70.69442749 213.7131653 75.10685221Copper Foam X=10 482.749705 85.02868779 468.041036 82.90857188Copper Foam X=20 539.6508179 99.3629481 520.31722 90.71029154 Nickel Foam X=0 207.8185475 77.07605235 200.2684326 77.40847015Nickel Foam X=10 382.3193563 83.60859172 353.7229105 82.14922968Nickel Foam X=20 545.5006307 90.14113108 528.2938436 86.88998922
81Table D-8.Heat Transfer Enhancement @ Heat Flux = 9.48 Mbtu/in2-s. 23 cfm 45 cfm
Type Position h – Ratio % Enhancement Temp. Differential (F) h – Ratio % Enhancement Temp. Differential (F) Copper X = 0 2.005606553 100.56 154.9319204 2.040815328 104.08 140.3680318 Copper X = 10 1.28429161 28.43 110.0457459 1.269227641 26.92 100.1681926 Copper X = 20 1.154485466 15.45 60.29416913 1.141838877 14.18 57.7902832 Copper Avg. 1.48146121 48.15 108.4239451 1.483960616 48.39 99.4421692Nickel X = 0 2.337829025 133.78 170.2073823 2.302376483 130.24 153.8127645 Nickel X = 10 1.709981113 71.00 210.4760946 1.799956342 80.00 214.486318 Nickel X = 20 1.116273948 11.63 54.4443563 1.111322178 11.13 49.8136596 Nickel Avg. 1.721361362 72.14 145.042611067 1.737885001 73.79 139.370914033

APPENDIX E SMALL SYSTEM COLLECTED DATA

Table E-1.Test Results for a Heat Flux of 1.9 Mbtu/in2-s. 23 cfm 45 cfm
Test # T (F) @ T (F) @ T (F) @ N2 In N2 Out P T (F) @ T (F) @ T (F) @ N2 In N2 Out P X=0 in X=2.00 in X=3.94 in (F) (F) (Psi) X=0 in X=2.00 in X=3.94 in (F) (F) (Psi)
Open 1 165.52 192.1659 213.1811 78.44 80.454250 –249.2 165.37 190.2827 209.9980 80.52 82.315 225 –224
Open 2 163.60 193.0621 215.3773 76.45 80.485250 –249.2 164.11 192.0604 212.8589 80.12 83.033 225 –224
Open 3 174.29 203.3263 222.1749 80.12 82.361250 –249.2 169.66 195.0120 214.9440 79.59 81.157 225 –224
Copper 1 139.90 166.9825 196.8803 75.92 77.713 250 – 248 136.89 163.7549 190.6197 75.50 77.064225 –221.2
Copper 2 136.15 164.1066 192.7121 75.61 77.405 250 – 248 139.35 166.8621 195.6767 76.25 79.605225 –221.2
Copper 3 N/A N/A N/A N/A N/A N/A N/A N/A N/A N/A N/A N/A
Nickel 1 145.66 175.1364 199.1910 75.81 76.038250 – 248.4 135.37 164.1809 186.0627 74.82 76.609
225 –221.4
Nickel 2 140.30 169.7693 192.0843 75.89 77.010250 – 248.4 135.14 163.9568 183.0221 73.67 75.481
225 –221.4
Nickel 3 N/A N/A N/A N/A N/A N/A N/A N/A N/A N/A N/A N/A
83

84
Table E-2.Test Results for a Heat Flux of 5.69 Mbtu/in2-s. 23 cfm 45 cfm
Test # T (F) @ T (F) @ T (F) @ N2 In N2 Out P T (F) @ T (F) @ T (F) @ N2 In N2 Out P X=0 in X=2.00 in X=3.94 in (F) (F) (Psi) X=0 in X=2.00 in X=3.94 in (F) (F) (Psi)
Open 1 325.16 399.6222 453.2384 78.97 83.002250 –249.2 271.55 353.2010 400.7974 73.05 78.872 225 –224
Open 2 310.10 394.0860 439.5377 78.04 82.068250 –249.2 278.56 359.1530 402.0888 77.11 80.470 225 –224
Open 3 308.04 396.0406 440.2188 76.30 82.122250 –249.2 274.57 356.8550 400.8553 75.35 80.501 225 –224
Copper 1 279.23 349.6771 426.3079 74.24 77.604 250 – 248 263.75 335.8836 405.4524 72.18 78.678225 –221.2
Copper 2 278.61 352.8575 425.2640 75.37 78.508 250 – 248 267.78 338.8597 407.1486 73.54 77.798225 –221.2
Copper 3 N/A N/A N/A N/A N/A N/A N/A N/A N/A N/A N/A N/A
Nickel 1 270.66 349.3570 420.5239 72.11 74.578250 – 248.4 263.07 333.5133 399.0906 75.94 78.408
225 –221.4
Nickel 2 274.05 351.0493 421.7853 73.23 75.698250 – 248.4 260.55 331.8354 395.7205 73.27 77.080
225 –221.4
Nickel 3 N/A N/A N/A N/A N/A N/A N/A N/A N/A N/A N/A N/A

Table E-3.Test Results for a Heat Flux of 7.58 Mbtu/in2-s. 23 cfm 45 cfm
Test # T (F) @ T (F) @ T (F) @ N2 In N2 Out P T (F) @ T (F) @ T (F) @ N2 In N2 Out P X=0 in X=2.00 in X=3.94 in (F) (F) (Psi) X=0 in X=2.00 in X=3.94 in (F) (F) (Psi)
Open 1 360.40 478.3792 528.6232 78.88 80.447250 –249.2 332.48 443.0685 498.3579 78.21 80.231 225 –224
Open 2 357.05 477.1538 529.5001 78.02 81.157250 –249.2 336.52 450.0203 501.5257 78.23 80.246 225 –224
Open 3 357.08 480.5461 532.8924 76.71 80.964250 –249.2 329.90 433.9856 490.3261 75.26 77.945 225 –224
Copper 1 327.25 414.5352 502.1995 74.92 78.724 250 – 248 323.81 406.4892 490.9999 77.77 79.783225 –221.2
Copper 2 332.13 418.5368 507.0419 75.82 79.852 250 – 248 316.85 399.1341 483.0258 73.30 78.230225 –221.2
Copper 3 N/A N/A N/A N/A N/A N/A N/A N/A N/A N/A N/A N/A
Nickel 1 313.23 401.8642 486.3750 72.39 76.199250 – 248.4 307.30 391.2782 477.3210 75.51 77.976
225 –221.4
Nickel 2 317.47 407.1270 491.2174 75.54 77.551250 – 248.4 304.12 389.5859 473.9573 71.70 76.184
225 –221.4
Nickel 3 N/A N/A N/A N/A N/A N/A N/A N/A N/A N/A N/A N/A
85

Table E-4.Test Results for a Heat Flux of 9.48 Mbtu/in2-s. 23 cfm 45 cfm
Test # T (F) @ T (F) @ T (F) @ N2 In N2 Out P T (F) @ T (F) @ T (F) @ N2 In N2 Out P X=0 in X=2.00 in X=3.94 in (F) (F) (Psi) X=0 in X=2.00 in X=3.94 in (F) (F) (Psi)
Open 1 420.76 536.5902 596.7148 72.81 77.736250 –249.2 406.05 513.6828 575.2790 74.61 78.864 225 –224
Open 2 437.41 552.1902 611.6840 77.56 81.142250 –249.2 416.36 522.7652 576.1766 75.65 77.667 225 –224
Open 3 423.91 540.7947 600.9194 75.72 79.080250 –249.2 385.11 501.8813 565.7901 75.92 78.833 225 –224
Copper 1 372.71 472.7391 575.7499 75.78 78.022 250 – 248 370.15 460.7346 564.3760 76.43 79.790225 –221.2
Copper 2 379.04 477.1610 581.4331 76.69 80.269 250 – 248 368.25 459.6907 562.9117 74.87 78.454225 –221.2
Copper 3 N/A N/A N/A N/A N/A N/A N/A N/A N/A N/A N/A N/A
Nickel 1 360.82 465.7585 571.5021 74.17 76.408250 – 248.4 345.77 454.3775 558.8598 74.36 76.825
225 –221.4
Nickel 2 363.56 469.7456 576.7506 73.94 77.296250 – 248.4 347.46 456.9002 558.4393 73.24 76.153
225 –221.4
Nickel 3 N/A N/A N/A N/A N/A N/A N/A N/A N/A N/A N/A N/A
86

APPENDIX F SMALL SYSTEM HEAT TRANSFER ENHANCEMENTS

Table F-1.Average Temperatures @ Heat Flux = 1.9 Mbtu/in2-s. 23 cfm 45 cfm
Type Position Avg. Wall T Avg. N2 T Avg. Wall T Avg. N2 T (in) (F) (F) (F) (F)
Open Channel X=0 167.80333 78.3367 166.38 80.07666 Open Channel X=2.00 196.18477 79.71835 192.4517 81.1225 Open Channel X=3.94 216.91111 81.1 212.6003 82.16833 Copper Foam X=0 138.025 75.765 138.12 75.875Copper Foam X=2.00 165.54455 76.662 165.3085 77.10475 Copper Foam X=3.94 194.7962 77.559 193.1482 78.3345 Nickel Foam X=0 142.98 75.85 135.255 74.245 Nickel Foam X=2.00 172.45285 76.187 164.06885 75.145Nickel Foam X=3.94 195.63765 76.524 184.5424 76.045
88Table F-2.Heat Transfer Enhancement @ Heat Flux = 1.9 Mbtu/in2-s. 23 cfm 45 cfm
Type Position h – Ratio % Enhancement Temp. Differential (F) h – Ratio % Enhancement Temp. Differential (F) Copper X = 0 1.437 43.6984 29.77833 1.3865 38.6510 28.26 Copper X = 2.00 1.3103 31.034 30.64022 1.2622 26.2182 27.1432 Copper X = 3.94 1.1584 15.843 22.11491 1.136 13.6031 19.4521 Copper Avg. 1.3019 30.19 27.511153 1.2616 26.15667 24.951767Nickel X = 0 1.3327 33.2736 24.82333 1.4146 41.4577 31.125 Nickel X = 2.00 1.2098 20.9841 23.73192 1.252 25.1961 28.38285Nickel X = 3.94 1.1402 14.0181 21.27346 1.2022 20.216678 28.0579Nickel Avg. 1.2276 22.7567 23.276237 1.2896 28.96 29.188583

89
Table F-3.Average Temperatures @ Heat Flux = 5.69 Mbtu/in2-s. 23 cfm 45 cfm
Type Position Avg. Wall T Avg. N2 T Avg. Wall T Avg. N2 T (in) (F) (F) (F) (F)
Open Channel X=0 314.43333 77.77 274.89333 75.17Open Channel X=2.00 396.58293 80.08367 356.403 77.5588 Open Channel X=3.94 444.33163 82.3973 401.24717 79.9477Copper Foam X=0 278.92 74.805 265.765 72.86Copper Foam X=2.00 351.2673 76.4305 337.37165 75.549 Copper Foam X=3.94 425.78595 78.056 406.3005 78.238 Nickel Foam X=0 272.355 72.67 261.81 74.605Nickel Foam X=2.00 350.20315 73.904 332.67435 76.1745Nickel Foam X=3.94 421.1546 75.138 397.40555 77.744
Table F-4.Heat Transfer Enhancement @ Heat Flux = 5.69 Mbtu/in2-s. 23 cfm 45 cfm
Type Position h – Ratio % Enhancement Temp. Differential (F) h – Ratio % Enhancement Temp. Differential (F) Copper X = 0 1.1595 15.9461 35.51333 1.0353 3.53456 9.12833 Copper X = 2.00 1.1516 15.1589 45.31563 1.065 6.5018 19.03135 Copper X = 3.94 1.0408 4.08489 18.54568 .9793 0 -5.05333 Copper Avg. 1.1173 11.73 33.12488 1.0265 2.65333 7.70212Nickel X = 0 1.1852 18.51833 42.07833 1.0669 6.68696 13.08333 Nickel X = 2.00 1.1455 14.54948 46.37978 1.0871 8.71125 23.72865Nickel X = 3.94 1.046 4.60028 23.17703 1.0051 .51239 3.84162Nickel Avg. 1.1256 12.55667 37.2117133 1.0530 5.30333 13.5512

Table F-5.Average Temperatures @ Heat Flux = 7.58 Mbtu/in2-s. 23 cfm 45 cfm
Type Position Avg. Wall T Avg. N2 T Avg. Wall T Avg. N2 T (in) (F) (F) (F) (F)
Open Channel X=0 358.17667 77.87 332.96667 77.2333 Open Channel X=2.00 478.69303 79.363 442.35813 78.35365Open Channel X=3.94 530.33857 80.856 496.73657 79.474Copper Foam X=0 329.69 75.37 320.33 75.535 Copper Foam X=2.00 416.536 77.329 402.81165 77.27075 Copper Foam X=3.94 504.6207 79.288 487.01285 79.0065 Nickel Foam X=0 315.35 73.965 305.71 73.605Nickel Foam X=2.00 404.4956 75.42 390.43205 75.3425 Nickel Foam X=3.94 488.7962 76.875 475.63915 77.08
90Table F-6.Heat Transfer Enhancement @ Heat Flux = 7.58 Mbtu/in2-s. 23 cfm 45 cfm
Type Position h – Ratio % Enhancement Temp. Differential (F) h – Ratio % Enhancement Temp. Differential (F) Copper X = 0 1.1022 10.2181 28.48667 1.0447 4.46838 12.63667 Copper X = 2.00 1.1772 17.72458 62.15703 1.1182 11.81528 39.54648 Copper X = 3.94 1.0568 5.67788 25.71787 1.0227 2.26865 9.72372 Copper Avg. 1.1121 11.20667 38.78719 1.0619 6.18667 20.635623Nickel X = 0 1.1612 16.12431 42.82667 1.1018 10.18003 27.25667 Nickel X = 2.00 1.2135 21.3490 74.19743 1.1552 15.52413 51.92608Nickel X = 3.94 1.0912 9.11858 41.54237 1.0469 4.69276 21.09742Nickel Avg. 1.1553 15.53 52.85549 1.1013 10.13 33.426723

Table F-7.Average Temperatures @ Heat Flux = 9.48 Mbtu/in2-s. 23 cfm 45 cfm
Type Position Avg. Wall T Avg. N2 T Avg. Wall T Avg. N2 T (in) (F) (F) (F) (F)
Open Channel X=0 427.36 75.3633 402.50667 75.3933Open Channel X=2.00 543.1917 77.3413 512.77643 76.92398 Open Channel X=3.94 603.1061 79.31933 572.41523 78.45467 Copper Foam X=0 375.875 76.235 369.2 75.65 Copper Foam X=2.00 474.95005 77.69025 460.21265 77.386 Copper Foam X=3.94 578.5915 79.1455 563.64385 79.122 Nickel Foam X=0 362.19 74.055 346.615 73.8 Nickel Foam X=2.00 467.75205 75.4535 455.63885 75.1445Nickel Foam X=3.94 574.12635 76.852 558.64955 76.489
91Table F-8.Heat Transfer Enhancement @ Heat Flux = 9.48 Mbtu/in2-s. 23 cfm 45 cfm
Type Position h – Ratio % Enhancement Temp. Differential (F) h – Ratio % Enhancement Temp. Differential (F) Copper X = 0 1.1747 17.4732 51.485 1.1143 11.43361 33.30667 Copper X = 2.00 1.1727 17.26593 68.24165 1.1385 13.85113 52.56378 Copper X = 3.94 1.0487 4.873554 24.5146 1.0195 1.948046 8.77138 Copper Avg. 1.1320 13.2033 48.0804167 1.0907 9.07667 31.547277Nickel X = 0 1.2216 22.163812 65.17 1.1990 19.90300 55.89167 Nickel X = 2.00 1.1875 18.748948 75.43965 1.1455 14.54899 57.13758Nickel X = 3.94 1.0533 5.331548 28.97975 1.0244 2.44732 13.76568Nickel Avg. 1.1541 15.41333 56.5298 1.1230 12.29667 42.2649767

LIST OF REFERENCES
[1] M.J.L. Turner, Rocket and Spacecraft Propulsion, Praxis Publishing, Chichester, UK, 2000.
[2] G.P. Sutton, D.M. Ross, Rocket Propulsion Elements, 7ed., John Wiley & Sons, Inc., Toronto, Canada, 1998.
[3] J.C.Y. Koh, R.L. Stevens, Enhancement of Cooling Effectiveness by Porous Materials in Coolant Passage, Journal of Heat Transfer V.97, May 1975 309-311.
[4] J.C.Y. Koh, R. Colony, Analysis of Cooling Effectiveness for Porous Material in a Coolant Passage, Journal of Heat Transfer, August 1974 324-330.
[5] R.F. Bartlett, R. Viskanta, Enhancement of Forced Convection in an Asymmetrically Heated Duct Filled with High Thermal Conductivity Porous Media, Journal of Enhanced Heat Transfer V.6, January 1996 1-9.
[6] J.W. Brockmeyer, A.J. Fortini, B.E. Williams, R.H. Tuffias, High-Efficiency Open-Cell Foam Heat Exchangers For Actively Cooled Propulsion Components, AIAA-98-3441, Pacoima, CA, 1998.
[7] K. Boomsma, D. Poulikakos, F. Zwick, Metal Foams as Compact High Performance Heat Exchangers, Mechanics of Materials V.35, 2003 1161-1176.
[8] C.Y. Zhao, T. Kim, T.J. Lu, H.P. Hodson, Thermal Transport Phenomena in Porvair Metal Foams and Sintered Beds, University of Cambridge, England, August 2001.
[9] H. Tamura, F. Ono, A. Kumakawa, N. Yatsuyanagi, LOX/Methane Staged Combustion Rocket Combustor Investigation, AIAA-87-1856 23rd Propulsion Conference, San Diego,CA, July 1987.
[10] S.K. Elam, Subscale LOX/Hydrogen Testing with a Modular Chamber and a Swirl Coaxial Injector, AIAA-91-1874 27th Joint Propulsion Conference, Sacramento,CA, June 1991.
[11] F.P. Incropera, D.P. Dewitt, Fundamentals of Heat and Mass Transfer, 5ed., John Wiley & Sons, Inc., Toronto, Canada, 2002.
[12] J.G. Collier, Convective Boiling and Condensation, 2ed., McGraw-Hill Book Company, New York, 1981.

93
[13] M.J. Watts, C.T. Chou, Mixed Convection Heat Transfer to Supercritical Pressure Water, Proceedings of the International Heat Transfer Conference V.16, 1982 495-500.
[14] D.A. Labuntsov, Some Questions of Convective Heat Transfer in the Supercritical Region, Thermal Engineering V.19, March 1972 101-104.
[15] R.F. Barron, Cryogenic Heat Transfer, Taylor & Francis, Philadelphia, 1999.
[16] T.M. Kuzay, J.T. Collins, J. Koons, Boiling Liquid Nitrogen Heat Transfer in Channels with Porous Copper Inserts, International Journal of Heat and Mass Transfer V.42, 1999 1189-1204.
[17] V.V. Calmidi, R.L. Mahajan, The Effective Thermal Conductivity of High Porosity Fibrous Metal Foams, Journal of Heat Transfer V.121, May 1999 466-471.
[18] R.S. Figliola, D.E. Beasley, Theory and Design for Mechanical Measurements, 2 ed., John Wiley and Sons, Inc., Toronto, Canada, 1995.
BIOGRAPHICAL SKETCH
Ryan Jeffrey Avenall was born April 15, 1980, in Ann Arbor, Michigan. He
graduated from Leon High School in May 1998. He attended the University of Florida
and received a B.S. with honors in mechanical engineering in December, 2002. He
received a graduate assistantship from the University of Florida where a Master of
Science was awarded in December 2004.
94