Use of MEMS sensors for condition monitoring of devices ...
9
RESEARCH ARTICLE Use of MEMS sensors for condition monitoring of devices: discussion about the accuracy of features for diagnosis Giulio D’Emilia and Emanuela Natale * Department of Industrial and Information Engineering and Economics, University of L’Aquila, L’Aquila 67100, Italy Received: 19 January 2021 / Accepted: 16 May 2021 Abstract. This paper analyses the effect of the variability of metrological characteristics of a set of low-cost Micro Electro-Mechanical Systems (MEMS) for the acceleration measurement, on the calculation of typical features used for condition monitoring (CM) of automatic production lines. The knowledge of the contribution of the variability of metrological characteristics to the final accuracy of features is an aspect of interest when networks of low-cost sensors are used, in particular in case the variability of their characteristics is high. In fact, due to a mass production, the calibration is not carried out sensor by sensor, but the characteristics are determined on a sample basis and assigned to the entire batch. Neglecting the variability between sensors can lead to effects on the results of data analysis, which are not easily predictable. In this paper, the real variability of the sensor’s characteristics, experimentally evaluated through the calibration of a set of 25 low-cost MEMS accelerometers, has been taken into account. Digital sensitivity, signal-to-noise ratio and data rate variability of each device have been considered for the analysis. The analysis has been carried out with reference to two different test cases of industrial interest, by modifying the real outputs of high performance piezoelectric accelerometers used for CM, in order to simulate the effect of the metrological characteristics of MEMS sensors. The results show which features, among those typically used for CM, are more affected and which characteristics of MEMS are more influencing the features themselves, with reference to the specific considered applications. Keywords: Condition monitoring / accuracy / sensor networks / MEMS accelerometers 1 Introduction The most modern industrial realities are structured as systems of collaborating computational entities which are in intensive connection with each other and with the physical world. This kind of operations provides and uses, at the same time, large amount of data, with the aim at realizing totally or partially autonomous operations. If applications concerning improvement of energy efficiency, reliability and safety of assets are considered, autonomous tuning, diagnosis and prognosis of devices could be achieved [1–3]. In this kind of industrial contexts, sensors and sensor networks cover a relevant role, because they must provide accurate quantitative information about physical processes which, ultimately, allows people or smart devices to make suitable decisions. In case condition-based maintenance and device CM are of interest, one of the most common technique for fault diagnosis/prognosis in rotating machinery is the vibration analysis [4,5]. Traditionally, this type of analysis has been carried out using sensors with very good performance, like piezoelectric accelerometers. In the last years, however, thanks to the advance of MEMS technology, large-band low-noise MEMS accelerometer have been proposed on the market, and many MEMS-based solutions for vibration analysis are being proposed in literature [6–9]. Many advantages could be envisaged by using these accelerom- eters, like miniaturizing, embedding, networking of sensors for more powerful measuring capabilities; however, some typical metrological attributes of measuring instruments, such as traceability and accuracy, should be guaranteed, to supply reliable measurement data from which to extract correct information about the system condition [10,11]. Traditionally, these requirements are satisfied for high performance accelerometers according to well established procedures of management of the instrumentation systems, according to standards (ISO 10012:2003, Measurement management systems — Requirements for measurement processes and measuring equipment), which require single calibration of sensors and management of the whole * Corresponding author: [email protected] Int. J. Metrol. Qual. Eng. 12, 15 (2021) © G. D’Emilia and E. Natale, Published by EDP Sciences, 2021 https://doi.org/10.1051/ijmqe/2021011 International Journal of Metrology and Quality Engineering Available online at: www.metrology-journal.org This is an Open Access article distributed under the terms of the Creative Commons Attribution License (https://creativecommons.org/licenses/by/4.0), which permits unrestricted use, distribution, and reproduction in any medium, provided the original work is properly cited.
Transcript of Use of MEMS sensors for condition monitoring of devices ...
Int. J. Metrol. Qual. Eng. 12, 15 (2021)© G. D’Emilia and E. Natale, Published by EDP Sciences, 2021https://doi.org/10.1051/ijmqe/2021011
International Journal ofMetrology and Quality Engineering
Available online at:www.metrology-journal.org
RESEARCH ARTICLE
Use of MEMS sensors for condition monitoring of devices:discussion about the accuracy of features for diagnosisGiulio D’Emilia and Emanuela Natale*
Department of Industrial and Information Engineering and Economics, University of L’Aquila, L’Aquila 67100, Italy
* Correspo
This is anO
Received: 19 January 2021 / Accepted: 16 May 2021
Abstract. This paper analyses the effect of the variability of metrological characteristics of a set of low-costMicro Electro-Mechanical Systems (MEMS) for the acceleration measurement, on the calculation of typicalfeatures used for condition monitoring (CM) of automatic production lines. The knowledge of the contributionof the variability of metrological characteristics to the final accuracy of features is an aspect of interest whennetworks of low-cost sensors are used, in particular in case the variability of their characteristics is high. Infact, due to a mass production, the calibration is not carried out sensor by sensor, but the characteristics aredetermined on a sample basis and assigned to the entire batch. Neglecting the variability between sensors canlead to effects on the results of data analysis, which are not easily predictable. In this paper, the real variabilityof the sensor’s characteristics, experimentally evaluated through the calibration of a set of 25 low-cost MEMSaccelerometers, has been taken into account. Digital sensitivity, signal-to-noise ratio and data rate variabilityof each device have been considered for the analysis. The analysis has been carried out with reference to twodifferent test cases of industrial interest, by modifying the real outputs of high performance piezoelectricaccelerometers used for CM, in order to simulate the effect of the metrological characteristics of MEMSsensors. The results show which features, among those typically used for CM, are more affected and whichcharacteristics of MEMS are more influencing the features themselves, with reference to the specific consideredapplications.
Keywords: Condition monitoring / accuracy / sensor networks / MEMS accelerometers
1 Introduction
The most modern industrial realities are structured assystems of collaborating computational entities which arein intensive connection with each other and with thephysical world. This kind of operations provides and uses,at the same time, large amount of data, with the aim atrealizing totally or partially autonomous operations. Ifapplications concerning improvement of energy efficiency,reliability and safety of assets are considered, autonomoustuning, diagnosis and prognosis of devices could beachieved [1–3].
In this kind of industrial contexts, sensors and sensornetworks cover a relevant role, because they must provideaccurate quantitative information about physical processeswhich, ultimately, allows people or smart devices to makesuitable decisions.
In case condition-based maintenance and device CMare of interest, one of the most common technique for fault
nding author: [email protected]
penAccess article distributed under the terms of the CreativeComwhich permits unrestricted use, distribution, and reproduction
diagnosis/prognosis in rotating machinery is the vibrationanalysis [4,5]. Traditionally, this type of analysis has beencarried out using sensors with very good performance, likepiezoelectric accelerometers. In the last years, however,thanks to the advance of MEMS technology, large-bandlow-noise MEMS accelerometer have been proposed on themarket, and many MEMS-based solutions for vibrationanalysis are being proposed in literature [6–9]. Manyadvantages could be envisaged by using these accelerom-eters, like miniaturizing, embedding, networking of sensorsfor more powerful measuring capabilities; however, sometypical metrological attributes of measuring instruments,such as traceability and accuracy, should be guaranteed, tosupply reliable measurement data from which to extractcorrect information about the system condition [10,11].Traditionally, these requirements are satisfied for highperformance accelerometers according to well establishedprocedures of management of the instrumentation systems,according to standards (ISO 10012:2003, Measurementmanagement systems — Requirements for measurementprocesses and measuring equipment), which require singlecalibration of sensors and management of the whole
monsAttribution License (https://creativecommons.org/licenses/by/4.0),in any medium, provided the original work is properly cited.
2 G. D’Emilia and E. Natale: Int. J. Metrol. Qual. Eng. 12, 15 (2021)
measuring process, which are expensive and no moresuitable. A large debate is in literature in order to realizethe better trade-off betweenmetrological requirements andcost, suggesting many possible solutions [12–14]. Anyway,even though solutions suitable for many new and low-costsensors have been suggested, the requirement of set low thecost of services for low-cost sensors, as in case of MEMS,affects the final accuracy of sensors themselves.
The accuracy of a MEMS sensor is linked to thecharacteristics of all the elements that constitute theelectronic device. In fact, typically, within a digital sensorall the elements of a measuring chain are included: sensingelement, charge amplifier, A/D converter, timing genera-tor. These elements are integrated on the chip and are,usually, inaccessible from the outside, so their behaviour isnot entirely knowable and controllable. For example, it isknown that the sampling times are subject to fluctuations,due to temperature drift or other internal processes in thesensor, so the samples points are not strictly equidistant[15]. This behaviour can, of course, affect the successivedata processing, in particular the analysis based onFourier-transform-methods, that are typical of CMapproaches.
The topic of digital MEMS sensors is beginning to betreated by the metrological institutes from the point ofview of calibration methodologies [15,16], but the effectsthat the metrological characteristics of these sensors mayhave on the results of CM have not yet been thoroughlyinvestigated.
The problem has been addressed in some scientificpapers. For example, in [17] a system able to emulatebearing failures is used, to prove that a kind of MEMS-based device can match the performance requirementsneeded to implement a reliable CM system.
Reference [18] describes some preliminary results ofcomparison of a cheap MEMS accelerometer and a goodquality piezoelectric accelerometer in CM of internalcombustion engines. The research proved that MEMSaccelerometers can provide measurements of goodquality, able to realize at a reduced cost CM of internalcombustion engines, with the detection of some typicalfailures.
However, it must be considered that the metrologicalcharacteristics of MEMS sensors could be not homoge-neous, and the features for CM could be differently affectedfrom each other, depending on the characteristic influenc-ing the feature itself [19]; these aspects should beinvestigated in order to fully evaluate the effect of theuse of MEMS sensor networks in CM applications.
The features for CM, which synthetize conditioninformation about the system, can be sensitive to thevariability of static characteristics of sensors, some other tothe variability of dynamic ones, which are also related tothe specific technology of devices, which is varied andevolving.
According to the previous considerations, the aim ofthis paper is to analyse the effect of the variability ofmetrological characteristics of a set of MEMS-baseddevices, on the calculation of typical features used inCM. The set of sensors taken into account is composed of 253-axis low-power digital MEMS accelerometers.
In order to estimate in the practical case, the influenceon CM of the characteristics of MEMS devices, their effectwill be simulated by appropriately modifying the vibrationsignals acquired during the monitoring of real industrialsystems. This type of analysis has already been faced in aprevious work of the authors [19] in a preliminary form,with reference to a single test case. In the present work, themethodology is refined and it is applied to two cases ofindustrial interest, very different in amplitude andbandwidth of vibration signals, in order to get a moregeneral idea about these effects.
Calibration data will be used to separate the differenteffects, like the influence of sensitivity or acquisition ratevariability, according to the availability of accuratereference data.
The impact of these elements on the calculation of themain features used for CM will be evaluated, also in termsof variability among MEMS. In literature studies can befound showing the effectiveness of using single low costaccelerometer in CM applications [17] or comparisonbetween high performance and cost piezoelectric accel-erometers and low-cost ones [18]; quite new seems thisapproach, aiming at considering the further contribution tothe uncertainty of features due to the variability ofperformances among MEMS of the same batch.
The awareness about these effects can help incomprehensively evaluating the uncertainty of featuresand in understanding the resolution of CM techniques.
Section 2 describes the materials and the methodologyused to evaluate the effect of both static and dynamiccharacteristics of MEMS devices, on CM features.
Section 3 shows the results with reference to two realtest cases; many different features are taken into account.
Conclusions and future work will end the paper.
2 Materials and methods
The digital MEMS accelerometer considered in this work isa commercial ultra-low-power digitalMEMS accelerometer(STMicroelectronics, model LSM6DSR), connected toan external IC-board (STMicroelectronics, model32F769IDISCOVERY) [20]. The LSM6DSR, to be precise,is a system-in-package featuring a digital accelerometerand a digital gyroscope, but only the functionality as anaccelerometer has been considered in this work, being ofinterest in condition monitoring applications.
The output signals range ±(216�1) =±32768Decimal16-bit-signed, where the digit unit is a signed16-bit sequence converted into a decimal number. Then,the sensitivity of the digital MEMS accelerometer isexpressed in linear units of Decimal16bit-signed/(m s�2)[20,21].
The variability of metrological characteristics withinunits and between units has been evaluated with referenceto a set of 25 MEMS accelerometers made available by themanufacturer for a characterization study.
Calibration of MEMS accelerometers has been carriedout using two different test benches, an oscillating linearslide in the low frequency range (3–10Hz) [19] and anelectromagnetic shaker, for vibration frequencies up to

Fig. 1. 3D drawing of the first test case [19,22].
G. D’Emilia and E. Natale: Int. J. Metrol. Qual. Eng. 12, 15 (2021) 3
1000Hz. It is to be pointed out that in the range offrequency 10–1000Hz, sensitivity of MEMS can beconsidered nearly constant [21].
In order to estimate in the practical cases theinfluence of the metrological characteristics of MEMS-based devices on CM, the effect of these aspects will beevaluated with reference to two different real industrialapplications:
– The first case (test case 1) is a high performance cuttingstage for non-woven tissue (Fig. 1), described in [19,22].The system includes a revolving cylinder with sharpprofiles and a non-driven roller, supported in a lubricatedcradle, that exerts an elastic force against the firstelement, by means of a pneumatic system. Piezoelectricaccelerometers and other kind of sensors have beenconveniently installed onto the cutting unit. In particu-lar, the signal of an accelerometer positioned on a knifesupport, acquired in a CM campaign, has been consideredin the present study. The aim of CM, in this application,is to recognize the actual working status of the machineryamong 4 different conditions, corresponding to 4 differentlevels of the knife wear, called ‘0’, ‘1’, ‘2’, ‘3’. Condition‘0’ corresponds to a new unit; the subsequent conditionscorrespond to increasing levels of wear.–
The second case (test case 2) is a mechatronic system inreal scale (Fig. 2) [23] used for application of caps ontocans. The test bench is composed of one ball screw, twonuts and a spline shaft, and it is driven by a synchronousservomotor, able to realize a translation of the shaft. Thesystem is monitored using a three-axis accelerometer,installed on the ball screw shaft. Experiments have beencarried out, corresponding to different settings of thecontrol system: in particular, tests for different values ofthe “jload” parameter have been carried out, that meanschanging the motor response to the inertia of the wholesystem. An incorrect setting can affect the accuracy ofthe motion.The aim of CM, in this application, is to recognize threedifferent operation conditions, corresponding to three differ-ent setting of the “jload” parameter: 300, 550 and 800kg cm2.
The methodology used in this work is according to thefollowing steps, which will be described in detail in the nextsections:
Fig. 2. Picture of the second test case.
–
evaluation of the metrological characteristics which areof interest for all the available MEMSs, connected to theexternal microcontroller;–
evaluation of the effect of the metrological characteristicsof the MEMS-based devices, which in turn provides forthe following operations:• modification of the real monitoring signals according tothe metrological characteristic of interest, to simulatethe effect of the characteristics of interest;• data processing of original and modified monitoringsignals in order to evaluate features and theirvariability;
–
analysis of variance (ANOVA) to statistically examinethe effect on features of the metrological characteristicsof MEMS sensors–
comparison among different features.Classical features have been considered for the analysis[24,25], which have proved sensitive to changes inoperating conditions, both in case 1 and in case 2:
– Root mean square (RMS): for a vector of n elements xi,RMS ¼ffiffiffiffiffiffiffiffiffiffiffiffiffiffiffi1
n
Xni¼1
x2i
s

4 G. D’Emilia and E. Natale: Int. J. Metrol. Qual. Eng. 12, 15 (2021)
–
en
Kurtosis: is defined as k ¼ E x�mð Þ4s4 where m is the mean
of the input vector, s is the standard deviation, andE(t) represents the expected value of the quantity t.
–
Crest factor: Peak-magnitude-to-RMS ratio. – Mean of the peaks: average of the signal peaks. – Signal-to-noise-and-distortion ratio (SINAD): signal tonoise and distortion ratio in dBc. The SINAD isdetermined using a modified periodogram of the samelength as the input signal. The modified periodogramuses a Kaiser window with b=38.–
Shape factor: ratio between RMS and average of theabsolute values of the input vector.In addition, also features designed for the specificapplications have been calculated, as, in particular, in thefrequency domain:
– percentage ratio of the power spectrum content forharmonics multiple of the principal frequency of impact(in the first case) or of oscillation (in the second case)with respect to the frequency spectrum on the whole(called band);–
percentage ratio of the power spectrum content forharmonics multiple of the principal frequency, in specificranges of frequencies. These ranges are different in the twoconsidered cases, and are specifically selected because theyare more sensitive to the conditions to be identified. Inparticular:• for case 1:� band1: [1400, 1800] Hz� band2: [2700, 3000] Hz� band3: [3200, 3700] Hz• for case 2:� band4: [0, 50] Hz� band5: (50, 100] Hz
2.1 Evaluation of characteristics of the MEMS-baseddevices
The following metrological characteristics have beenevaluated: digital sensitivity, signal-to-noise ratio (SNR)and sampling rate. The methodology for the assessment ofthese characteristics is described in [19].
The results, used in this work, can be synthetized asfollow:
1.vo
Sampling rate:• Nominal sampling rate: 1660 Hz• Evaluated average sampling rate: 1602 Hz• Variability:� Variability calculated cycle by cycle for eachaccelerometer: 1.9%
� Variability of the sampling rate among sensors:0.93%
� Overall variability: 2.1%
2. Sensitivity:• Nominal sensitivity: 1671 Decimal16bit-signed/(m s−2).• Variability among sensors: 12 Decimal16bit-signed/(ms−2).
3.
Noise:The SNR relative to the sinusoidal carrier has beenaluated, and the maximum standard deviation of theise results to be 0.066m s−2.2.2 Evaluation of the effect of the metrologicalcharacteristics of the MEMS-based devices
The modification of the original monitoring signals,according to the variability of the metrological character-istic of interest, has been realized as described in thefollowing procedure:
– Evaluation of the sensitivity effectThe effect of using the nominal sensitivity instead of thereal one has been estimated by multiplying the originalsignal by the ratio between measured sensitivity andnominal one:
modified_signal ¼ original_signal⋅Smeas
Snomð1Þ
where:original_signal: original accelerometer output;modified_signal: acceleration signal that, theoreti-
cally, we could obtain using a MEMS of the consideredtype with the nominal sensitivity provided by themanufacturer;
Snom: nominal sensitivity, set equal for all the MEMSsensors;
Smeas: average measured sensitivity, obtained bycalibration of the whole set of sensors.
– Evaluation of the noise effectThe standard deviation of the noise, evaluated bythe signal-to-noise analysis of the data by the calibra-tion, has been used to generate a normally distributednoise, which has been added to the original monitoringsignal.
– Evaluation of the sampling rate effectA different time array has been defined on the basis ofthe real sampling rate. The percentage variability of thesampling rate, estimated in the calibration phase, hasbeen applied to the sampling period used in the real case(10�4 s in test case 1, 10�3 s in test case 2). In particular,this variability value has been used as standard deviationof a normally distributed noise, that has been added tothe time array. Then, the acceleration values corre-sponding to the new time array, have been calculated byinterpolation.
Different interpolation methods have been considered:linear, spline, modified Akima cubic Hermite interpolation,piecewise cubic Hermite interpolating polynomial, cubicconvolution, nearest neighbour interpolation [26]. Amongall the interpolation methods, the nearest neighbourmethod has been considered, because it doesn’t reducethe signal amplitude, unlike the others, and it keeps thebandwidth of the signal unchanged.
On the basis of data thus modified, the features havebeen calculated, and the differences with respect to thosebased on the original data have been estimated.
The evaluation of features has been carried out on dataof 5 repeated tests, for each condition of the system, and themean values have been considered.
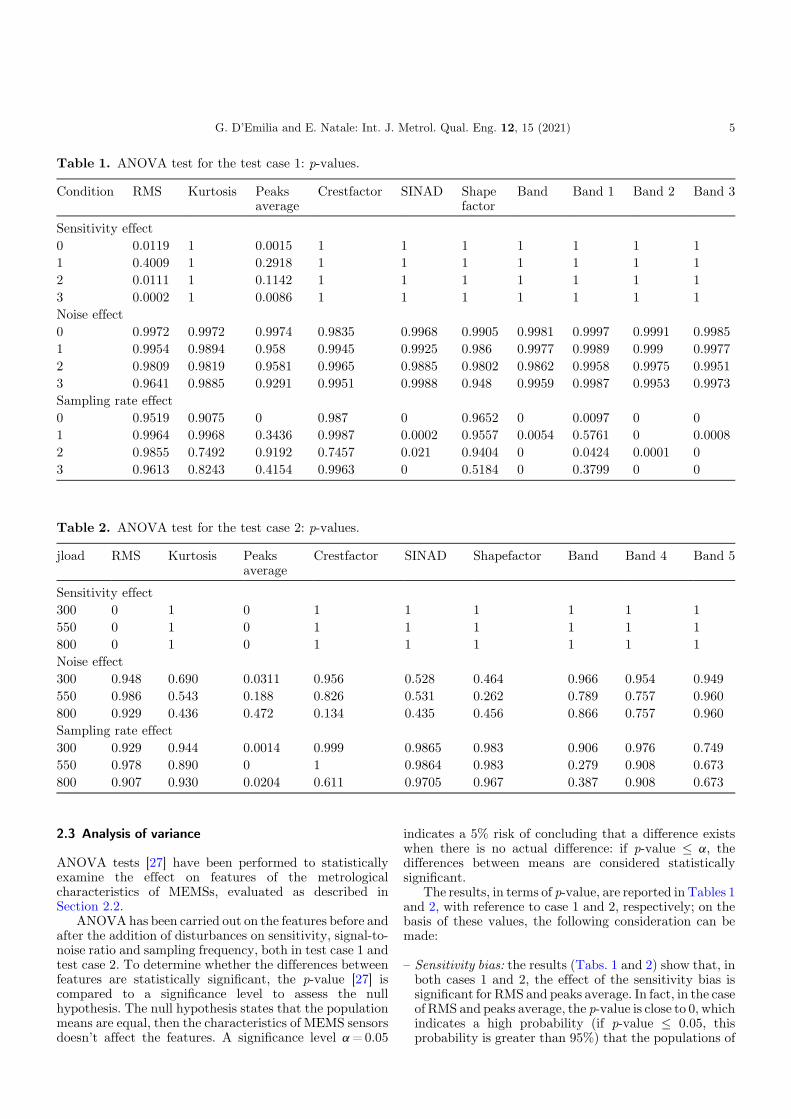
Table 1. ANOVA test for the test case 1: p-values.
Condition RMS Kurtosis Peaksaverage
Crestfactor SINAD Shapefactor
Band Band 1 Band 2 Band 3
Sensitivity effect0 0.0119 1 0.0015 1 1 1 1 1 1 11 0.4009 1 0.2918 1 1 1 1 1 1 12 0.0111 1 0.1142 1 1 1 1 1 1 13 0.0002 1 0.0086 1 1 1 1 1 1 1Noise effect0 0.9972 0.9972 0.9974 0.9835 0.9968 0.9905 0.9981 0.9997 0.9991 0.99851 0.9954 0.9894 0.958 0.9945 0.9925 0.986 0.9977 0.9989 0.999 0.99772 0.9809 0.9819 0.9581 0.9965 0.9885 0.9802 0.9862 0.9958 0.9975 0.99513 0.9641 0.9885 0.9291 0.9951 0.9988 0.948 0.9959 0.9987 0.9953 0.9973Sampling rate effect0 0.9519 0.9075 0 0.987 0 0.9652 0 0.0097 0 01 0.9964 0.9968 0.3436 0.9987 0.0002 0.9557 0.0054 0.5761 0 0.00082 0.9855 0.7492 0.9192 0.7457 0.021 0.9404 0 0.0424 0.0001 03 0.9613 0.8243 0.4154 0.9963 0 0.5184 0 0.3799 0 0
Table 2. ANOVA test for the test case 2: p-values.
jload RMS Kurtosis Peaksaverage
Crestfactor SINAD Shapefactor Band Band 4 Band 5
Sensitivity effect300 0 1 0 1 1 1 1 1 1550 0 1 0 1 1 1 1 1 1800 0 1 0 1 1 1 1 1 1Noise effect300 0.948 0.690 0.0311 0.956 0.528 0.464 0.966 0.954 0.949550 0.986 0.543 0.188 0.826 0.531 0.262 0.789 0.757 0.960800 0.929 0.436 0.472 0.134 0.435 0.456 0.866 0.757 0.960Sampling rate effect300 0.929 0.944 0.0014 0.999 0.9865 0.983 0.906 0.976 0.749550 0.978 0.890 0 1 0.9864 0.983 0.279 0.908 0.673800 0.907 0.930 0.0204 0.611 0.9705 0.967 0.387 0.908 0.673
G. D’Emilia and E. Natale: Int. J. Metrol. Qual. Eng. 12, 15 (2021) 5
2.3 Analysis of variance
ANOVA tests [27] have been performed to statisticallyexamine the effect on features of the metrologicalcharacteristics of MEMSs, evaluated as described inSection 2.2.
ANOVA has been carried out on the features before andafter the addition of disturbances on sensitivity, signal-to-noise ratio and sampling frequency, both in test case 1 andtest case 2. To determine whether the differences betweenfeatures are statistically significant, the p-value [27] iscompared to a significance level to assess the nullhypothesis. The null hypothesis states that the populationmeans are equal, then the characteristics of MEMS sensorsdoesn’t affect the features. A significance level a=0.05
indicates a 5% risk of concluding that a difference existswhen there is no actual difference: if p-value � a, thedifferences between means are considered statisticallysignificant.
The results, in terms of p-value, are reported in Tables 1and 2, with reference to case 1 and 2, respectively; on thebasis of these values, the following consideration can bemade:
–
Sensitivity bias: the results (Tabs. 1 and 2) show that, inboth cases 1 and 2, the effect of the sensitivity bias issignificant for RMS and peaks average. In fact, in the caseof RMS and peaks average, the p-value is close to 0, whichindicates a high probability (if p-value � 0.05, thisprobability is greater than 95%) that the populations of
Fig. 3. Standard deviation of features for CM, in cases 1 (a) and 2 (b).
Fig. 4. Effect of the sensitivity on features for CM, in cases 1 (a) and 2 (b).
6 G. D’Emilia and E. Natale: Int. J. Metrol. Qual. Eng. 12, 15 (2021)
the values before and after the modification on thesensitivity, have different means, so that the effect can beconsidered significant. All the other features, on thecontrary, being characterized by a p-value equal to 1, arenot at all influenced by the disturbances that have beenadded.
–
Noise effect: in both cases the addition of the MEMSnoise to the real data doesn’t produce significantvariations on the considered features, the p-value beingnear 1, as explained in the previous point. In case 2, theaddition of noise produces greater effects (even if notsignificant at the 0.05 level) on peaks average, SINADand shape factor, due to the lower amplitude of theoriginal signal (100m/s2 in the first case, 1.5m/s2 in thesecond case). In these cases, in fact, p-value � 0.5.–
Sampling rate effect: in the first case the bias of thenominal sampling rate with respect to the real onesignificantly affects, in particular, the calculation of thefeatures in the frequency domain, based on theidentification of the harmonics multiple of the cuttingfrequency, the so called “band” features. In these cases, infact, the p-value is close to 0, or just equal to 0. Instead, inthe second case, this effect is not significant. In fact, theidentification of peaks of the FFT, in the first case, ismuch more critical due to the presence of a higher level ofnoise (SNR≈�17 dB in case 1, SNR≈ 10 dB in case 2), sothat the shift in the sampling frequency can lead to thedetermination of wrong peaks, close to those of interest.In fact, the system analysed in case 1 is extremely morecomplex than the system in case 2: in case 2, a shafttranslates according to a sinusoidal law; in case 1, twocylinders in contact, one of which with sharp profiles,rotate at high speed, and various effects produced by therotation and impacts of the knife on the anvil, contributeto determine the harmonic content of the accelerometersignal.
3 Results and discussion
With reference to the two different CM applications,described in Section 2, the results have been represented inFigures 3–6, in order to highlight in a graphical way theextent of the effects produced on the features.
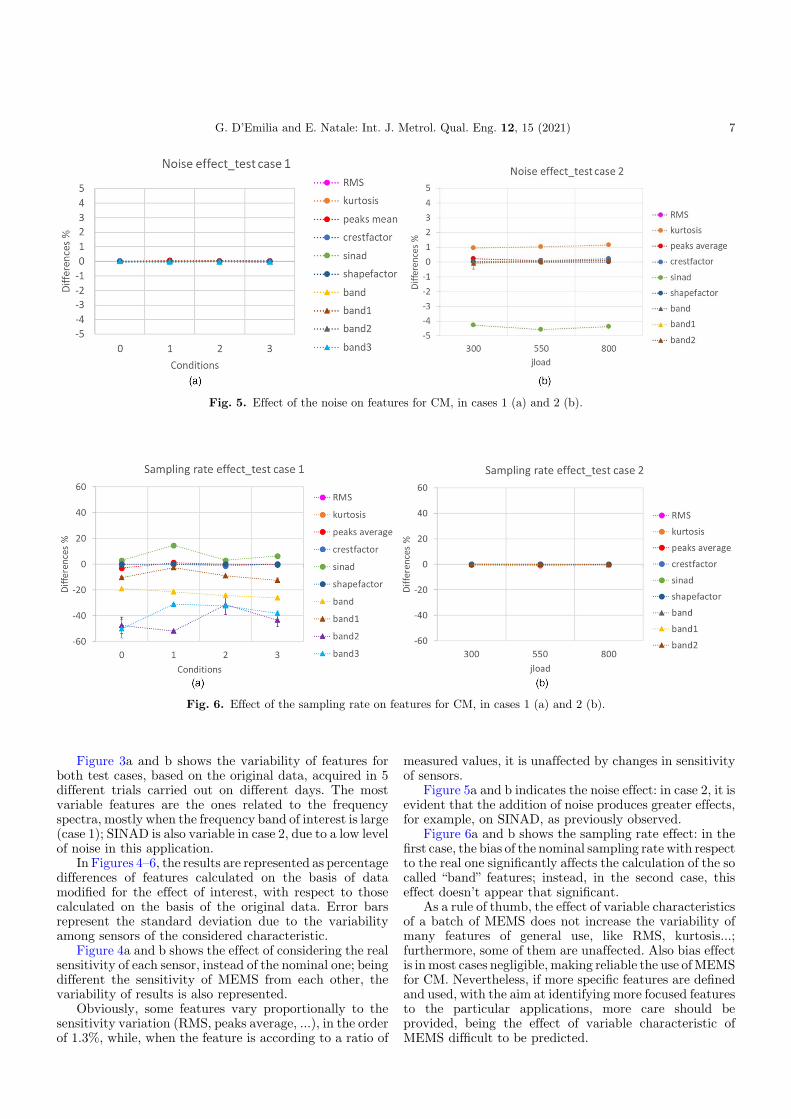
Fig. 6. Effect of the sampling rate on features for CM, in cases 1 (a) and 2 (b).
Fig. 5. Effect of the noise on features for CM, in cases 1 (a) and 2 (b).
G. D’Emilia and E. Natale: Int. J. Metrol. Qual. Eng. 12, 15 (2021) 7
Figure 3a and b shows the variability of features forboth test cases, based on the original data, acquired in 5different trials carried out on different days. The mostvariable features are the ones related to the frequencyspectra, mostly when the frequency band of interest is large(case 1); SINAD is also variable in case 2, due to a low levelof noise in this application.
In Figures 4–6, the results are represented as percentagedifferences of features calculated on the basis of datamodified for the effect of interest, with respect to thosecalculated on the basis of the original data. Error barsrepresent the standard deviation due to the variabilityamong sensors of the considered characteristic.
Figure 4a and b shows the effect of considering the realsensitivity of each sensor, instead of the nominal one; beingdifferent the sensitivity of MEMS from each other, thevariability of results is also represented.
Obviously, some features vary proportionally to thesensitivity variation (RMS, peaks average, ...), in the orderof 1.3%, while, when the feature is according to a ratio of
measured values, it is unaffected by changes in sensitivityof sensors.
Figure 5a and b indicates the noise effect: in case 2, it isevident that the addition of noise produces greater effects,for example, on SINAD, as previously observed.
Figure 6a and b shows the sampling rate effect: in thefirst case, the bias of the nominal sampling rate with respectto the real one significantly affects the calculation of the socalled “band” features; instead, in the second case, thiseffect doesn’t appear that significant.
As a rule of thumb, the effect of variable characteristicsof a batch of MEMS does not increase the variability ofmany features of general use, like RMS, kurtosis…;furthermore, some of them are unaffected. Also bias effectis inmost cases negligible, making reliable the use ofMEMSfor CM. Nevertheless, if more specific features are definedand used, with the aim at identifying more focused featuresto the particular applications, more care should beprovided, being the effect of variable characteristic ofMEMS difficult to be predicted.

8 G. D’Emilia and E. Natale: Int. J. Metrol. Qual. Eng. 12, 15 (2021)
4 Conclusions
This paper analyses the effect of the variability ofmetrological characteristics of a set of low-cost MEMSaccelerometers, on the calculation of typical features usedin CM of automatic production lines. The real variability ofthe sensors characteristics has been experimentallyevaluated by means the calibration of 25 MEMS accel-erometers. Digital sensitivity, signal-to-noise ratio andsampling rate variability of each sensor have beenconsidered for the analysis.
In order to estimate the influence of the metrologicalcharacteristics of these MEMS-based devices on CM, theeffect of these aspects has been evaluated with reference totwo real industrial applications, that are very different inamplitude and bandwidth of signals, to cover a range ofapplications.
The results show that some characteristics of MEMS, inparticular the difference between real and nominalsampling rate, could significantly affect the calculationof some features in the frequency domain, if the nominalvalue is used for data processing. This happens, inparticular, for the features based on the identification ofprecise frequencies linked to hits, cuts, rotations, especiallyin signals with low SNR.
On the whole, it can be observed that using MEMSaccelerometers in CM does not cause major problems, aslong as the most appropriate features are chosen, depend-ing on the applications.
The knowledge of the characteristics of the MEMSsensors is a further element for a comparative evaluation ofthe most suitable features. More care should be providedwith reference to customized features, designed in order tohighlight specific effect of the device under examination.
Furthermore, it should be emphasized that MEMSaccelerometers appear to be usable in CM without majorprecautions when only their basic characteristics areconsidered. This means further studies are still neededto make corresponding statements when more complexuses, from a metrological point of view, are envisaged.
In the future work a more in-depth and systematicanalysis will be carried out through a design of theexperiments, to evaluate also the cross effects of thedifferent aspects taken into account, and of othermetrological characteristics of MEMS accelerometers, likestability and phase response.
References
1. A. Diez Olivan, J. Del Ser, D. Galar, B. Sierra, Data fusionand machine learning for industrial prognosis: Trends andperspectives towards Industry 4.0., Inform. Fusion 50,92–111 (2019)
2. L. Ciani, Future trends in IM: Diagnostics, maintenance andcondition monitoring for cyber-physical systems, IEEEInstru. Meas. Mag. 22, 48–49 (2019)
3. M. Catelani, L. Ciani, D. Galar, G. Patrizi, Risk assessmentof a wind turbine: a new FMECA-Based tool with RPNthreshold estimation, IEEE Access 8, 8966244, 20181–20190(2020)
4. A. Ragab, S. Yacout, M.S. Ouali, H. Osman, Prognostics ofmultiple failure modes in rotating machinery using a pattern-based classifier and cumulative incidence functions, J. Intell.Manuf. 30, 255–274 (2019)
5. A. Choudhury, Vibration monitoring of rotating electricalmachines: vibration monitoring, Advanced condition moni-toring and fault diagnosis of electric machines, IGI Global163–188 (2019)
6. S. Gao, F. Shang, C. Du, Design of multichannel andmultihop low-power wide-area network for aircraft vibrationmonitoring, IEEE Trans. Instrum. Meas. 68, 4887–4895(2019)
7. S. Gao, X. Zhang, C. Du, Q. Ji, A multichannel low-powerwide area network with high-accuracy synchronizationability for machine vibration monitoring, IEEE InternetThings J. 6, 5040–5047 (2019)
8. T. Addabbo, A. Fort, E. Landi, R Moretti, M. Mugnaini, L.Parri, V. Vignoli, A wearable low-cost measurement systemfor estimation of human exposure to vibrations, in:Proceedings of the IEEE 5th International forum onResearchand Technology for Society and Industry (RTSI), 2019,pp. 442–446
9. N.I. Hossain, S. Reza, M. Ali, VibNet: application of wirelesssensor network for vibration monitoring using ARM, in:Proceedings of the International Conference on Robotics,Electrical and Signal Processing Techniques (ICREST),2019
10. R.W. Supler,Uncertainty error and drift evaluation consid-erations involving analog to digital upgrades in nuclear powerplants, in: Proceedings of the 11th Nuclear Plant Instrumen-tation, Control, and Human-Machine Interface Technolo-gies, NPIC and HMIT, Orlando, United States, 9–14February, 2019, pp. 1275–1283
11. G. D’Emilia, A. Gaspari, F. Mazzoleni, E. Natale, A. Schiavi,Calibration of tri-axial MEMS accelerometers in the low-frequency range � part 1: comparison among methods, J.Sens. Sens. Syst. 7, 245–257 (2018)
12. B. Xu, Design of metrology equipment running managementsystem based on the internet of things technology, in:Proceedings of the 13th IEEE International Conference onElectronic Measurement & Instruments (ICEMI), 2017,pp. 253–259
13. A.Carullo,Metrologicalmanagement of large-scalemeasuringsystems, IEEE Trans. Instrum. Meas. 55, 471–476 (2006)
14. B.D. Hall, An opportunity to enhance the value ofmetrological traceability in digital systems, in: Proceedingsof the II Workshop on Metrology for Industry 4.0 and IoT(MetroInd4. 0 & IoT), 2019, pp. 16–21
15. S. Benedikt, T. Bruns, S. Eichstädt, Methods for dynamiccalibration and augmentation of digital acceleration MEMSsensors, in: Proceedings of the 19th International Congress ofMetrology (CIM2019), 2019, EDP Sciences
16. W.S. Cheung, Effects of the sample clock of digital-outputMEMS accelerometers on vibration amplitude and phasemeasurements, Metrologia 57, 015008 (2020)
17. T. Addabbo, A. Fort, E. Landi, R. Moretti, M. Mugnaini, L.Parri, V. Vignoli, A Characterization system for bearingcondition monitoring sensors, a case study with a low powerwireless Triaxial MEMS based sensor, in: Proceedings ofthe2020 IEEE International Workshop on Metrology forIndustry 4.0 & IoT, 2020, pp. 11–15
18. D. Bismor, Analysis and comparison of vibration signals frominternal combustion engine acquired using piezoelectric andMEMS accelerometers, Vib. Phys. Syst. 30, 1–8 (2019)

G. D’Emilia and E. Natale: Int. J. Metrol. Qual. Eng. 12, 15 (2021) 9
19. G. D’Emilia, E. Natale, Network of MEMS sensors forcondition monitoring of industrial systems: accuracy assess-ment of features used for diagnosis, in: Proceedings of the17th IMEKO TC 10 and EUROLAB Virtual Conference:“Global Trends in Testing, Diagnostics & Inspection for2030”, 20–22 October, 2020
20. A. Schiavi, G. D’Emilia, A. Prato, A. Gaspari, F. Mazzoleni,E. Natale, Calibration of digital 3-axis MEMS accelerom-eters: a double-blind «multi-bilateral» comparison, in:Proceedings of the IEEE international Workshop onMetrology for Industry 4.0 and IoT, 2020, pp. 542–547
21. A. Prato, F. Mazzoleni, A. Schiavi, Traceability of digital 3-axis MEMS accelerometer: simultaneous determination ofmain and transverse sensitivities in the frequency domain,Metrologia 53, 035013 (2020)
22. G. D’Emilia, A. Gaspari, E. Natale, Measurement uncertain-ty of contact and non-contact techniques on condition
monitoring of complex industrial components, J. Phys. Conf.Ser. 1110, 012005 (2018)
23. G. D’Emilia, A. Gaspari, E. Natale, Measurements for smartmanufacturing in an Industry 4.0 scenario; a case-study on amechatronic system, in: Proceedings of Workshop onMetrology for Industry 4.0 and IoT, MetroInd 4.0 and IoT2018, 2018, IEEE, pp. 107–111
24. A. Choudhary, T. Mian, S. Fatima, Convolutionalneuralnetworkbasedbearing faultdiagnosisof rotatingmachineusing thermal images, Measurement 176, 109196 (2021)
25. M. Abubakr, M.A. Hassan, G.M. Krolczyk, N. Khanna, H.Hegab, Sensors selection for tool failure detection duringmachining processes: a simple accurate classification model.CIRP J. Manuf. Sci. Technol. 32, 108–119 (2021)
26. https://it.mathworks.com/help/matlab/ref/interp1.html(accessed November 10, 2020)
27. D.C. Montgomery, Statistical quality control, McGraw-Hill,New York, (2009)
Cite this article as: Giulio D’Emilia, Emanuela Natale, Use of MEMS sensors for condition monitoring of devices: discussionabout the accuracy of features for diagnosis, Int. J. Metrol. Qual. Eng. 12, 15 (2021)