Redalyc.Comparative analyzes among electrical resistivity ...

U.S. Department of the InteriorU.S. Geological Survey
Use of Electrical Resistivity to DetectUnderground Mine Voids in Ohio
Water-Resources Investigations Report 02-4041
In cooperation with theOhio Department of Transportationand theU.S. Department of Transportation,Federal Highway Administration

Use of Electrical Resistivity to DetectUnderground Mine Voids in Ohio
By Rodney A. Sheets
Abstract
Electrical resistivity surveys were completed at two sites along State Route 32 in Jackson and Vin-ton Counties, Ohio. The surveys were done to determine whether the electrical resistivity method could identify areas where coal was mined, leaving air- or water-filled voids. These voids can be local sources of potable water or acid mine drainage. They could also result in potentially dangerous collapse of roads or buildings that overlie the voids. The resistivity response of air- or water-filled voids compared to the surrounding bedrock may allow electrical resistivity surveys to delineate areas underlain by such voids.
Surface deformation along State Route 32 in Jackson County led to a site investigation, which included electrical resistivity surveys. Several highly resistive areas were identified using axial dipole-dipole and Wenner resistivity surveys. Sub-sequent drilling and excavation led to the discov-ery of several air-filled abandoned underground mine tunnels.
A site along State Route 32 in Vinton County, Ohio, was drilled as part of a mining per-mit application process. A mine void under the highway was instrumented with a pressure trans-ducer to monitor water levels. During a period of high water level, electrical resistivity surveys were completed. The electrical response was dominated by a thin, low-resistivity layer of iron ore above where the coal was mined out. Nearby overhead powerlines also affected the results.
Introduction
In some areas of Ohio, remnant underground voids from abandoned coal mines can be an important source of potable water (Crouch and others, 1980). In other areas, water qual-ity of streams is adversely affected by acid mine drainage discharging from these voids. Collapse of the material over-lying abandoned underground mine voids is sometimes associated with rise and fall of the water level in the void, which creates instability in the support structure within the mine workings (L.R. Ruesgegger, Ohio Department of Transportation, oral commun., 2001). Hazardous conditions may result if the mine void collapses, causing subsidence beneath roadways, buildings, or other structures.
A previous study (Munk and Sheets, 1997) in coop-eration with the Ohio Department of Transportation (ODOT) tested use of surface geophysical methods to detect underground mine voids in Ohio. The present study— an extension of the previous work—focuses on electrical resis-tivity surveys of the subsurface by application of direct cur-rent at the surface and was designed to test the effectiveness of using electrical resistivity in revealing voids. The purpose of this report is to describe the results of electrical resistivity surveys at two abandoned coal-mine sites in southeastern Ohio (fig. 1). At one site, subsidence was noted along a roadway, and resistivity was used to investigate the presence of unmapped mine voids beneath the site before remediation of the roadway commenced. At a second site, where a known mine void was instrumented with a water-level trans-ducer, resistivity surveys were done to determine whether the known mine void could be detected.
Abstract 1Introduction

Methods
The electrical resistivity method discussed in this report measures lateral or vertical changes in the resistivity of the subsurface. Resistivity differences typically correspond to changes in the lithologic composition of subsurface materi-als or the chemistry of pore fluids. The electrical resistivity method employs a direct current (DC) applied to a pair of electrodes in contact with the ground; the voltage or electri-
cal potential is measured between a second pair of elec-trodes. Data were collected by use of automated resistivity measurements, which allow placement of multiple elec-trodes at equal spacing along a survey line. Each electrode is connected to a computer-controlled device that sequences electrical pulses between selected combinations of electrode configurations. The applied current, the resulting voltage potentials, and the electrode geometry are recorded by soft-ware. In general, the greater the distance between elec-trodes, the greater the depth of current penetration. A fixed
Jackson County
82°30'23"
9°5'26"
9°5'37"
82°22'50" 82°22'40"
39°7'40"
39°7'50"
0 200 400100 Meters 0 200 400100 Meters
County Road 38
State Route 32
Line J2
Line V1
Boring B1
Line V2
Line J1
Vinton County
OHIO
Base from U.S. Geological Survey Wellston 1:24,000, 1961; photo revised 1971, 1975 Base from U.S. Geological Survey McArthur 1:24,000 1961;
photo revised 1985
82°30'45" 82°22'30"
0 20
20
40 MILES
40 KILOMETERS0
300 300
Figure 1. Locations of electrical resistivity survey lines along State Route 32, in Jackson and Vinton Counties, Ohio.
2 Use of Electrical Resistivity to Detect Underground Mine Voids in Ohio

electrode spacing along a survey line typically is used to examine lateral variations in earth resistivity; multiple elec-trode configurations over a common midpoint are used for investigating vertical changes in resistivity. Given the same number of electrodes, a larger electrode spacing in an array gains more depth of penetration, and a smaller electrode spacing gains more resolution. In this report, surveys are denoted by the electrode spacing and array type (for exam-ple, 3-m Wenner).
Three types of arrays—dipole-dipole, Wenner, and Schlumberger—were employed for this study (Zohdy and others, 1974). The configuration of current and potential electrodes for these arrays is shown in figure 2. For the sur-veys done in this study, 28 electrodes were placed either 2 or 3 m apart along survey lines, and the elevation of each electrode was determined. The automated system allowed data collection for all three survey arrays and various elec-trode spacings with static placement of electrodes.
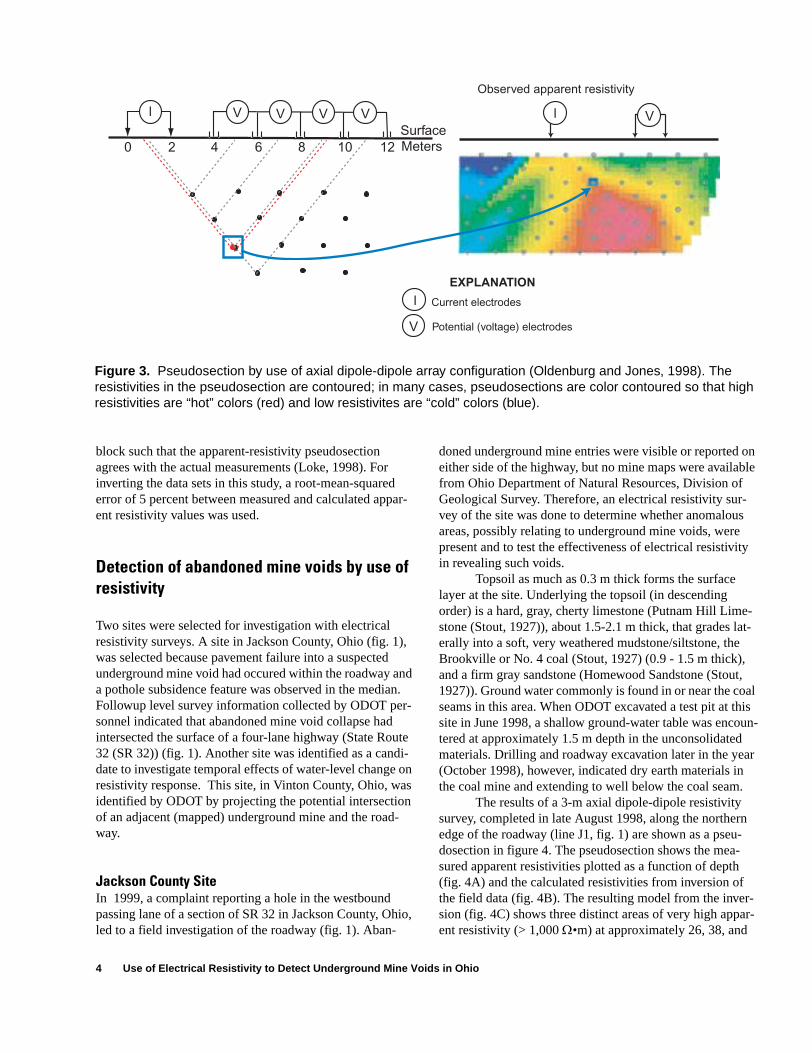
Results were plotted in the field to verify proper col-lection of data. Pseudosections (fig. 3) were used to plot the data; in pseudosections, values of apparent resistivity are plotted against electrode geometry. Because pseudosec-tions are difficult to interpret, an inversion of the data was done to determine the electrical properties that give rise to the measured (apparent) electrical resistivity. Inversion of a geophysical data set results in a model of the resistivity chararacteristics of the subsurface; in this case, a model of the electrical properties of the subsurface. The inversion routine is based on the smoothness-constrained least-squares method (Sasaki, 1992) and can be used for many electrode configurations, including those used in this study. The inversion program used (RES2DINV; Loke and Barker, 1996; Loke, 1998) requires electrode spacing to be held constant and divides the subsurface into rectangular blocks; therefore, the inversion of resistivity data is not affected by the geometry of subsurface resistivity anomalies. The pur-pose of the program is to determine a resistivity of each
VI
a
n*a
a
V
I
a a
a
V
I
a
r
A. Axial dipole-dipole array
where a = electrode spacing andn = 1,2,3, ...
B. Wenner array
C. Schlumberger array
EXPLANATION
I
V
aa
Current electrode
Potential (voltage) electrode
Electrode spacing (usually held constant for the survey)
Figure 2. Electrode configurations for resistivity surveys: (A) axial dipole-dipole array (B) Wenner array, and (C) Schlumberger array. For the Schlumberger array, the potential electrode spacing is kept small relative to r, which is increased during the survey.
Methods 3
block such that the apparent-resistivity pseudosection agrees with the actual measurements (Loke, 1998). For inverting the data sets in this study, a root-mean-squared error of 5 percent between measured and calculated appar-ent resistivity values was used.
Detection of abandoned mine voids by use of resistivity
Two sites were selected for investigation with electrical resistivity surveys. A site in Jackson County, Ohio (fig. 1), was selected because pavement failure into a suspected underground mine void had occured within the roadway and a pothole subsidence feature was observed in the median. Followup level survey information collected by ODOT per-sonnel indicated that abandoned mine void collapse had intersected the surface of a four-lane highway (State Route 32 (SR 32)) (fig. 1). Another site was identified as a candi-date to investigate temporal effects of water-level change on resistivity response. This site, in Vinton County, Ohio, was identified by ODOT by projecting the potential intersection of an adjacent (mapped) underground mine and the road-way.
Jackson County SiteIn 1999, a complaint reporting a hole in the westbound passing lane of a section of SR 32 in Jackson County, Ohio, led to a field investigation of the roadway (fig. 1). Aban-
doned underground mine entries were visible or reported on either side of the highway, but no mine maps were available from Ohio Department of Natural Resources, Division of Geological Survey. Therefore, an electrical resistivity sur-vey of the site was done to determine whether anomalous areas, possibly relating to underground mine voids, were present and to test the effectiveness of electrical resistivity in revealing such voids.
Topsoil as much as 0.3 m thick forms the surface layer at the site. Underlying the topsoil (in descending order) is a hard, gray, cherty limestone (Putnam Hill Lime-stone (Stout, 1927)), about 1.5-2.1 m thick, that grades lat-erally into a soft, very weathered mudstone/siltstone, the Brookville or No. 4 coal (Stout, 1927) (0.9 - 1.5 m thick), and a firm gray sandstone (Homewood Sandstone (Stout, 1927)). Ground water commonly is found in or near the coal seams in this area. When ODOT excavated a test pit at this site in June 1998, a shallow ground-water table was encoun-tered at approximately 1.5 m depth in the unconsolidated materials. Drilling and roadway excavation later in the year (October 1998), however, indicated dry earth materials in the coal mine and extending to well below the coal seam.
The results of a 3-m axial dipole-dipole resistivity survey, completed in late August 1998, along the northern edge of the roadway (line J1, fig. 1) are shown as a pseu-dosection in figure 4. The pseudosection shows the mea-sured apparent resistivities plotted as a function of depth (fig. 4A) and the calculated resistivities from inversion of the field data (fig. 4B). The resulting model from the inver-sion (fig. 4C) shows three distinct areas of very high appar-ent resistivity (> 1,000 Ω•m) at approximately 26, 38, and
0 2 4 6 8 10 12
l V V V VSurfaceMeters
V
Observed apparent resistivity
Current electrodes
Potential (voltage) electrodes
EXPLANATION
l
l
V
Figure 3. Pseudosection by use of axial dipole-dipole array configuration (Oldenburg and Jones, 1998). The resistivities in the pseudosection are contoured; in many cases, pseudosections are color contoured so that high resistivities are “hot” colors (red) and low resistivites are “cold” colors (blue).
4 Use of Electrical Resistivity to Detect Underground Mine Voids in Ohio

72 m (horizontal distance). These anomalous areas are about 3 m deep. The very high apparent resistivity is proba-bly not related to natural geologic materials and is instead interpreted to be air-filled voids (abandoned coal mine tun-nels). The somewhat continuous subhorizontal high-resis-tivity anomaly that spans the very high-resistivity anomalies from 38 to 72 m (horizontal) likely is a series of mine voids (tunnels) separated by sections of unmined coal. Drillers’ descriptions of borings completed along the survey line are
listed in table 1; in general, the high-resistivity areas corre-spond to void locations found in the borings. Coal typically has higher resistivity (10-1011 Ω•m) than sandstone (10-108 Ω•m) or limestone (50-107 Ω•m) (Robinson and Coruh, 1988, p. 477). Less resistive and shallower (<2 m deep) anomalies are at 16 m and 45-51 m (horizontal); these are probably caused by the lateral gradation from hard, cherty limestone to semiconsolidated mudstone or siltstone (table 1).
36.00.0 24.012.0 48.0 60.0 72.0
36.00.0 24.012.0 48.0 60.0 72.0
36.00.0 24.012.0 48.0 60.0 72.0
2.12.93.74.45.25.96.7
1.2
7.5
1.32.33.14.14.95.96.8
0.4
7.6
2.12.93.74.45.25.96.7
1.2
7.5
DE
PT
H, I
N M
ET
ER
SD
EP
TH
, IN
ME
TE
RS
DE
PT
H, I
N M
ET
ER
S
DISTANCE, IN METERS
A. Measured apparent resistivity pseudosection
B. Calculated apparent resistivity pseudosection
C. Inverse model resistivity pseudosection
1.93 5.48 15.6 44.2 125 356 1012 2873
Resisitivity, in
Unit electrode spacing 3.0 meters
Line J1ohm-meters
Figure 4. Dipole-dipole resistivity survey results along State Route 32 in Jackson County, Ohio. High- resistivity anomalies (>1,000 Ω•m (ohm-meters); for exam-ple, at approximately 26 meters horizontal and 3.5 meters vertical in the inverse section (C)) are inter-preted to be air-filled mine voids. Locations of borings also are shown on the inverse model section.
Detection of abandoned mine voids by use of resistivity 5

Table 1. Drillers’ descriptions of borings along resistivity survey line, Jackson County, Ohio
[For locations of borings along resistivity survey line, see figs. 4 and 5. Dark line denotes top of consolidated bedrock; area described as “void” is shaded. Driller’s descriptions are abbreviated (L.R. Ruesgegger, Ohio Department of Transportation, written commun., 1999). *, field inspection after removal of overburden revealed semiconsolidated siltstone or mudstone ]
BORING NAME AND DISTANCE (METERS) ALONG RESISTIVITY SURVEY LINE
Depth below land surface
(meters)
B-54.8
B-412.5
B-318.9
B-225.0
B-133.8
B-2246.9
B-2763.4
0.00 TOPSOIL TOPSOIL TOPSOIL TOPSOIL TOPSOIL OVERBURDEN SOD
0.15 CLAY* SILTY CLAY* SILT* TOPSOIL TOPSOIL OVERBURDEN SILT/CLAY*
0.30 CLAY* SILTY CLAY* SILT* BOULDERS SILTY CLAY* LIMESTONE SILT/CLAY*
0.46 CLAY* SILTY CLAY* SILT* BOULDERS SILTY CLAY* LIMESTONE SILT/CLAY*
0.61 CLAY* SILTY CLAY* LIMESTONE BOULDERS SILTY CLAY* LIMESTONE SILT/CLAY*
0.76 LIMESTONE SILTY CLAY* LIMESTONE BOULDERS SILTY CLAY* LIMESTONE SILT/CLAY*
0.91 LIMESTONE SILTY CLAY* LIMESTONE LIMESTONE SILTY CLAY* LIMESTONE SILT/CLAY*
1.07 LIMESTONE SILTY CLAY* LIMESTONE LIMESTONE SILTY CLAY* LIMESTONE SILT/CLAY*
1.22 LIMESTONE SANDY SILT* LIMESTONE LIMESTONE SILTY CLAY* LIMESTONE LIMESTONE
1.37 LIMESTONE SANDY SILT* LIMESTONE LIMESTONE SILTY CLAY* LIMESTONE LIMESTONE
1.52 LIMESTONE SHALE SHALE SHALE SILTY CLAY* LIMESTONE LIMESTONE
1.68 LIMESTONE COAL SHALE SHALE SHALE LIMESTONE LIMESTONE
1.83 LIMESTONE COAL SHALE SHALE SHALE LIMESTONE LIMESTONE
1.98 LIMESTONE COAL SHALE SHALE SHALE SHALE LIMESTONE
2.13 VOID COAL VOID SHALE VOID SHALE LIMESTONE
2.29 VOID COAL VOID VOID VOID SHALE SHALE
2.44 SHALE COAL VOID VOID VOID SHALE SHALE
2.59 SHALE COAL VOID VOID VOID COAL SHALE
2.74 SHALE COAL VOID VOID VOID COAL VOID2.90 SHALE COAL VOID VOID VOID COAL VOID3.05 SHALE CLAY-SHALE SHALE COAL VOID VOID VOID3.20 CLAY-SHALE CLAY-SHALE SHALE COAL VOID COAL VOID3.35 CLAY-SHALE CLAY-SHALE SHALE SHALE SHALE COAL VOID3.51 SILTSTONE CLAY-SHALE SHALE SHALE SHALE COAL VOID3.66 SILTSTONE SILTSTONE SHALE SHALE SHALE COAL VOID3.81 SANDSTONE SILTSTONE SHALE SANDSTONE SHALE COAL VOID3.96 SANDSTONE SILTSTONE SHALE SANDSTONE SHALE SHALE
4.11 SANDSTONE SANDSTONE SHALE SANDSTONE SHALE SHALE
4.27 SANDSTONE SANDSTONE SHALE SANDSTONE SHALE SHALE
4.42 SANDSTONE SANDSTONE SHALE SANDSTONE SANDSTONE SHALE
4.57 SANDSTONE SANDSTONE SHALE SANDSTONE SANDSTONE SHALE
4.72 SANDSTONE
4.88 SILTSTONE
5.03 SILTSTONE
5.18 SANDSTONE(continues to 10.7
meters)
6 Use of Electrical Resistivity to Detect Underground Mine Voids in Ohio

The results of a 3-m Wenner resistivity survey inver-sion for line J1 are shown in figure 5. These results also show the three highly resistive areas recognized in the axial dipole-dipole array results and the shallow anomaly at 48 m (horizontal), but they are generally not as detailed as the axial dipole-dipole results. Forward modeling of similar areas has shown that the axial dipole-dipole array is more appropriate than the Wenner array for detection of anoma-lously high-resistivity areas due to voids (Munk and Sheets, 1997). A subsequent 2-m axial dipole-dipole resistivity sur-vey centered on the large anomaly at 26 m horizontal con-firmed location and horizontal extent of that anomaly.
Axial dipole-dipole, Wenner, and Schlumberger sur-veys also were performed along the median strip at this site (line J2, fig. 1). The Wenner and Schlumberger resistivity surveys were uninterpretable; several data points were severely affected by background electromagnetic noise associated with traffic along the highway. The inversion results of an axial dipole-dipole survey also are noisy, but several high-resistivity anomalies indicating possible air-filled mine voids are interpreted at 18, 30, and 72 m (hori-zontal) and at about 3.5-4.0 m depth.
After the resistivity surveys were completed, ODOT drilled boreholes in the roadway to determine the possible presence and extent of mine voids (Sept.-Dec. 1998; table 1). Boring B-2 was completed at the major anomaly at 25 m on line J1 (figs. 1, 4, 5; table 1); a mine void was encoun-tered from a depth of 2.3 to 3.1 m (L.R. Ruesgegger, Ohio Department of Transportation, written commun., 1999). The roadway and network of underlying mine voids was subse-quently excavated and numerous tunnels were located. Three tunnels converged at or very near the anomaly at 25 m (figs. 1, 4, and 5). This finding may illustrate that although the resistivity arrays used were linear, the current and poten-tial pathways in the subsurface may be affected by features outside the survey line, especially in areas of air-filled voids.
Vinton County SiteAs a result of a mining permit application received by ODNR-DMR, a section of SR 32 in Vinton County, Ohio (fig. 3), was identified for a subsurface investigation because the mining might affect highway structures. Explor-atory borings by ODNR-DMR adjacent to the permit-appli-cation area and along the highway intersected subsurface voids related to mapped and unmapped abandoned coal mines. Examination of maps of abandoned mine VN-94 (on file with ODNR, Division of Geological Survey) revealed a system of underground tunnels that continue under the high-way. A monitoring well was installed in one of the borings (B-1, figs. 1 and 6; table 2) for ODOT purposes, and the site was established as a Surface Deformation Site (L.R. Rues-gegger, Ohio Department of Transportation, written com-mun., 1998).
The geology of the site is similar to that of the Jack-son County site except that the overburden consists of top-soil, sand, and clay or fill material, which is more variable in thickness (0.6-7.6 m). The log for boring B-1 (fig. 7) is listed in table 2. The coal mined in this area is the No. 4a or Clarion Coal, which is overlain by the Vanport Limestone and the Vanport or Ferriferous Ore (Stout, 1927). During 1830–70, the Ferriferous Ore was the most important eco-nomic strata in southern Ohio (Stout, 1927), making Ohio the second largest producer of iron in the United States (Ohio Historical Society, written commun., 2001).
At the time the borings were made at the site (November 1997), no appreciable ground water was found (L.R. Ruesgegger, Ohio Department of Transportation, writ-ten commun., 1998); however, for the purposes of this study, boring B-1 was instrumented with a submersible pressure transducer to measure water levels. As evident in figure 6, ground water partially filled the void from spring or early summer (March–June 2000), until midsummer (July–August 2000). The specfic conductance of ground water in the void was 632 µS/cm (June 2000).
B-5 B-2
B-1
B-2
2
B-2
7
0.0 12.0 24.0 36.0 48.0 60.0 72.0202468
10
1412
DE
PT
H, I
N M
ET
ER
S
12.8 24.6 47.4 91.4 176 339 653 1258
Resistivity, in ohm-meters Unit electrode spacing 3.0 m
Line J1
DISTANCE, IN METERS
B-4 B-3
Figure 5. Wenner resistivity survey results, including topography, along State Route 32 in Jackson County, Ohio. This calculated inverse model section shows a high-resistivity anomaly at the same location as an axial dipole-dipole survey along the same line (fig. 4). Locations of borings also are shown above.
Detection of abandoned mine voids by use of resistivity 7

1/1/1999 7/1/1999 1/1/2000 7/1/2000 1/1/2001 7/1/2001 1/1/2002
7.4
7.2
7.0
6.8
6.6
WAT
ER
LE
VE
L, D
EP
TH
BE
LOW
LA
ND
SU
RFA
CE
(M
ET
ER
S)
DATE
Figure 6. Depth to water at boring B-1, Vinton County, Ohio. The bottom of the pressure transducer was set on debris in the mine void at approximately 7.4 meters.
Table 1. Geologist and driller description of boring B-1, Vinton County, Ohio. [The boring was drilled 11/17/97. Boring collapsed to approximately 7.4 meters depth; a 5-centimeter well was completed as an open hole from about 5.8 to 7.4 meters. (L.R. Ruesgegger, Ohio Department of Transportation, written commun., 1998)]
Depth (m) Depth (ft) Description
0 - 0.6 0-2 Brown, gray, and black silty sand with stone fragments.
0.6 - 1.7 2-5.5 Gray, weathered sandstone (driller’s description).
1.7 - 2.8 5.5-9.3 Gray, brown, firm, feldspathic, fine to medium-grained sandstone. Loosely cemented in places; medium bedded, thin bedded at the bottom. No core loss.
2.8 - 3.3 9.3-10.7 Black, firm, carbonaceous shale, with carbonaceous laminae. Arenaceous, micaceous, jointed at the top half. Grading to sandstone at the bottom. No core loss.
3.3 - 4.3 10.7-14.0 Brown, fine, micaceous, ferruginous, feldspathic sandstone. Fine to medium grained; jointed in part. No core loss.
4.3 - 4.4 14-14.4 Brown, firm, broken and jointed iron ore. No core loss.
4.4 - 5.7 14.4-18.7 Dark gray, hard, limestone. Jointed in part. No core loss.
5.7 - 6.3 18.7-20.7 VOID
6.3 - 6.5 20.7-21.2 Black, firm, highly carbonaceous shale; broken and jointed in part. No core loss.
6.5 - 8.0 21.2-26.2 VOID
8.0 - 8.2 26.2-26.8 Black, coaly, fissile shale; weathered at the top, with an underclay seam at the bottom. No core loss.
2
8 Use of Electrical Resistivity to Detect Underground Mine Voids in Ohio
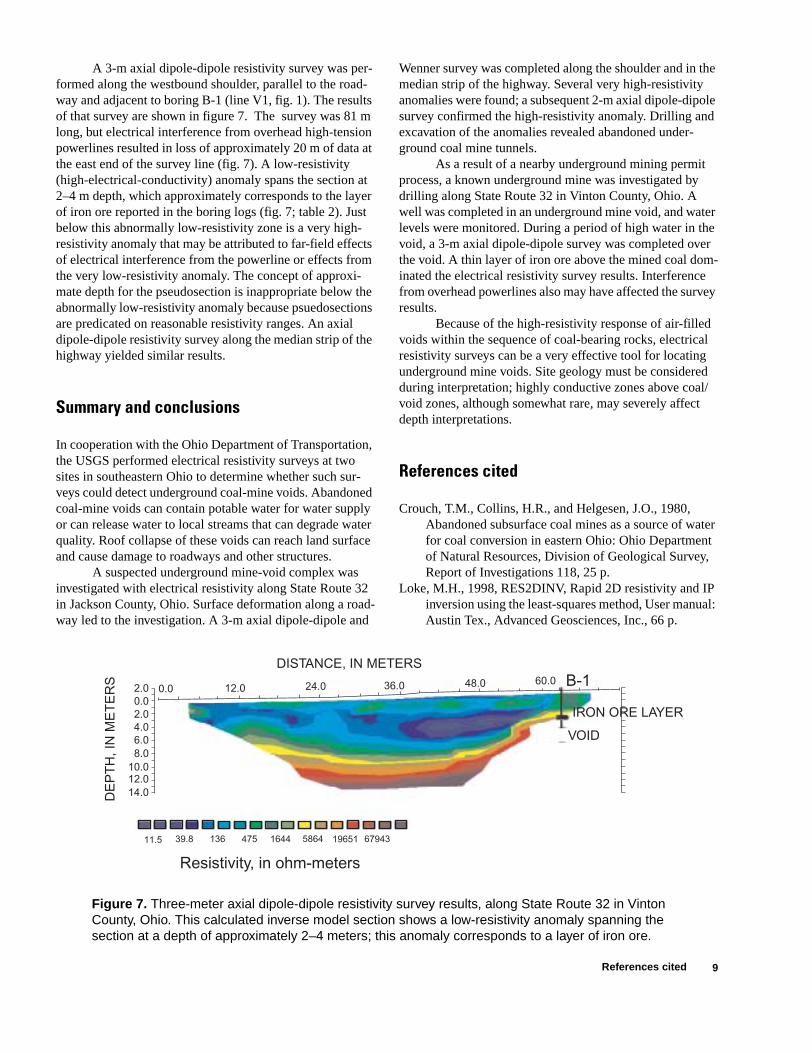
A 3-m axial dipole-dipole resistivity survey was per-formed along the westbound shoulder, parallel to the road-way and adjacent to boring B-1 (line V1, fig. 1). The results of that survey are shown in figure 7. The survey was 81 m long, but electrical interference from overhead high-tension powerlines resulted in loss of approximately 20 m of data at the east end of the survey line (fig. 7). A low-resistivity (high-electrical-conductivity) anomaly spans the section at 2–4 m depth, which approximately corresponds to the layer of iron ore reported in the boring logs (fig. 7; table 2). Just below this abnormally low-resistivity zone is a very high-resistivity anomaly that may be attributed to far-field effects of electrical interference from the powerline or effects from the very low-resistivity anomaly. The concept of approxi-mate depth for the pseudosection is inappropriate below the abnormally low-resistivity anomaly because psuedosections are predicated on reasonable resistivity ranges. An axial dipole-dipole resistivity survey along the median strip of the highway yielded similar results.
Summary and conclusions
In cooperation with the Ohio Department of Transportation, the USGS performed electrical resistivity surveys at two sites in southeastern Ohio to determine whether such sur-veys could detect underground coal-mine voids. Abandoned coal-mine voids can contain potable water for water supply or can release water to local streams that can degrade water quality. Roof collapse of these voids can reach land surface and cause damage to roadways and other structures.
A suspected underground mine-void complex was investigated with electrical resistivity along State Route 32 in Jackson County, Ohio. Surface deformation along a road-way led to the investigation. A 3-m axial dipole-dipole and
Wenner survey was completed along the shoulder and in the median strip of the highway. Several very high-resistivity anomalies were found; a subsequent 2-m axial dipole-dipole survey confirmed the high-resistivity anomaly. Drilling and excavation of the anomalies revealed abandoned under-ground coal mine tunnels.
As a result of a nearby underground mining permit process, a known underground mine was investigated by drilling along State Route 32 in Vinton County, Ohio. A well was completed in an underground mine void, and water levels were monitored. During a period of high water in the void, a 3-m axial dipole-dipole survey was completed over the void. A thin layer of iron ore above the mined coal dom-inated the electrical resistivity survey results. Interference from overhead powerlines also may have affected the survey results.
Because of the high-resistivity response of air-filled voids within the sequence of coal-bearing rocks, electrical resistivity surveys can be a very effective tool for locating underground mine voids. Site geology must be considered during interpretation; highly conductive zones above coal/void zones, although somewhat rare, may severely affect depth interpretations.
References cited
Crouch, T.M., Collins, H.R., and Helgesen, J.O., 1980, Abandoned subsurface coal mines as a source of water for coal conversion in eastern Ohio: Ohio Department of Natural Resources, Division of Geological Survey, Report of Investigations 118, 25 p.
Loke, M.H., 1998, RES2DINV, Rapid 2D resistivity and IP inversion using the least-squares method, User manual: Austin Tex., Advanced Geosciences, Inc., 66 p.
DE
PT
H, I
N M
ET
ER
S
DISTANCE, IN METERSB-1
11.5 39.8 136 475 1644 5864 6794319651
Resistivity, in ohm-meters
0.0 12.0 24.0 36.0 48.0 60.0
IRON ORE LAYER
VOID
2.00.02.04.06.08.0
10.012.014.0
Figure 7. Three-meter axial dipole-dipole resistivity survey results, along State Route 32 in Vinton County, Ohio. This calculated inverse model section shows a low-resistivity anomaly spanning the section at a depth of approximately 2–4 meters; this anomaly corresponds to a layer of iron ore.
Summary and conclusions 9References cited
Loke, M.H., and Barker, R.D., 1996, Rapid least-squares inversion of apparent resistivity pseudosections by a quasi-Newton method: Geophysical Prospecting, v. 44, p. 131–152.
Munk, Jens, and Sheets, R.A., 1997, Detection of under-ground voids in Ohio by use of geophysical methods: U.S. Geological Survey Water-Resources Investiga-tions Report 97–4221, 28 p.
Oldenburg, D.W., and Jones, F.H.M., 1998, Tutorial—Basic concepts of resistivity and induced polarization profil-ing: University of British Columbia Geophysical Inver-sion Facility, accessed September 30, 2001, at URL http://www.geop.ubc.ca/ubcgif/tutorials/resip/index.html
Robinson, E.S., and Coruh, Cahit, 1988, Basic exploration geophysics: New York, John Wiley & Sons, 562 p.
Sasaki, Yutaka, 1992, Resolution of resistivity tomography inferred from numerical simulation: Geophysical Pros-pecting, v. 40, p. 453–464.
Stout, W.L., 1927, Geology of Vinton County: Ohio Geo-logical Survey Bulletin 31, 402 p.
Zohdy, A.A.R., Eaton, G.P., and Mabey, D.R., 1974, Appli-cation of surface geophysics to ground-water investiga-tions: U.S. Geological Survey Techniques of Water-Resources Investigations, book 2, chap. D1, 116 p.
10 Use of Electrical Resistivity to Detect Underground Mine Voids in Ohio