Use of Derivatives by Registered Investment Companies · PDF fileUse of Derivatives by...
97
Division of Economic and Risk Analysis 1 Use of Derivatives by Registered Investment Companies Daniel Deli, Paul Hanouna, Christof W. Stahel, Yue Tang and William Yost 1 December 2015 1. Summary Anecdotal evidence and press reports suggest the potential increased use of derivatives by investment companies registered under the Investment Company Act of 1940. However, granular information is not available on the extent to which funds 2 may be making use of derivatives in pursuing their investment strategies. To better understand how funds currently use derivatives, we gathered a detailed, hand- collected random sample of 10% of funds based on Form N-CSR filed for 2014, assembling data on certain of those funds’ derivatives positions. Because section 18 of the Investment Company Act restricts the ability of a fund to issue “senior securities,” 3 we focused on those derivatives (and certain financial commitment transactions) that implicate section 18 because a fund that enters into these transactions is or may be required to make a payment or deliver cash or other assets during the life of the instrument or at maturity or early termination. For brevity, we generally use the term “derivatives” in this paper to refer only to these derivatives, which include, for example, futures, swaps, currency forwards, and written options. In contrast, other derivatives, such as purchased options and purchased swaptions, often provide the economic equivalent of leverage because they expose the fund to gains on an amount in excess of the fund’s investment but do not impose a payment obligation on the fund beyond its investment. While these transactions involve economic leverage, they generally do not implicate section 18 of the Act, and we therefore did not focus on these kinds of derivatives. 4 Supplementing our random sample of Form N-CSR filings with information gathered from Morningstar and Form N-SAR, we analyze the use of those derivatives together with certain financial commitment 1 This white paper was prepared for Mark Flannery, Director and Chief Economist of the Division of Economic and Risk Analysis (DERA). Paul Hanouna’s contributions were made while he was a visiting scholar in DERA. The U.S. Securities and Exchange Commission, as a matter of policy, disclaims responsibility for any private publication or statement of any of its employees. The views expressed herein are those of the authors and do not necessarily reflect the views of the Commission or of the authors’ colleagues on the staff of the Commission. 2 The term “funds” refers to mutual funds (other than money market funds), exchange-traded funds (ETFs), closed-end funds and business development companies (BDCs). We classify funds using Morningstar’s nine broad categories based on asset classes and investment strategies; see appendix for a list of these categories. 3 Section 18 of the Act imposes various limitations on the capital structure of funds, including, in part, by restricting the ability of funds to issue “senior securities.” Section 18(g) of the Investment Company Act defines “senior security,” in part, as “any bond, debenture, note, or similar obligation or instrument constituting a security and evidencing indebtedness.” 4 As set forth in Appendix B, we have collected data regarding purchased options and purchased swaptions but have not included that data in our descriptions of the use of derivatives by funds herein.
Transcript of Use of Derivatives by Registered Investment Companies · PDF fileUse of Derivatives by...

Division of Economic and Risk Analysis 1
Use of Derivatives by Registered Investment Companies
Daniel Deli, Paul Hanouna, Christof W. Stahel, Yue Tang and William Yost1
December 2015
1. Summary
Anecdotal evidence and press reports suggest the potential increased use of derivatives by investment companies registered under the Investment Company Act of 1940. However, granular information is not available on the extent to which funds2 may be making use of derivatives in pursuing their investment strategies. To better understand how funds currently use derivatives, we gathered a detailed, hand-collected random sample of 10% of funds based on Form N-CSR filed for 2014, assembling data on certain of those funds’ derivatives positions. Because section 18 of the Investment Company Act restricts the ability of a fund to issue “senior securities,”3 we focused on those derivatives (and certain financial commitment transactions) that implicate section 18 because a fund that enters into these transactions is or may be required to make a payment or deliver cash or other assets during the life of the instrument or at maturity or early termination. For brevity, we generally use the term “derivatives” in this paper to refer only to these derivatives, which include, for example, futures, swaps, currency forwards, and written options. In contrast, other derivatives, such as purchased options and purchased swaptions, often provide the economic equivalent of leverage because they expose the fund to gains on an amount in excess of the fund’s investment but do not impose a payment obligation on the fund beyond its investment. While these transactions involve economic leverage, they generally do not implicate section 18 of the Act, and we therefore did not focus on these kinds of derivatives.4
Supplementing our random sample of Form N-CSR filings with information gathered from Morningstar and Form N-SAR, we analyze the use of those derivatives together with certain financial commitment
1 This white paper was prepared for Mark Flannery, Director and Chief Economist of the Division of Economic and Risk Analysis (DERA). Paul Hanouna’s contributions were made while he was a visiting scholar in DERA. The U.S. Securities and Exchange Commission, as a matter of policy, disclaims responsibility for any private publication or statement of any of its employees. The views expressed herein are those of the authors and do not necessarily reflect the views of the Commission or of the authors’ colleagues on the staff of the Commission. 2 The term “funds” refers to mutual funds (other than money market funds), exchange-traded funds (ETFs), closed-end funds and business development companies (BDCs). We classify funds using Morningstar’s nine broad categories based on asset classes and investment strategies; see appendix for a list of these categories. 3 Section 18 of the Act imposes various limitations on the capital structure of funds, including, in part, by restricting the ability of funds to issue “senior securities.” Section 18(g) of the Investment Company Act defines “senior security,” in part, as “any bond, debenture, note, or similar obligation or instrument constituting a security and evidencing indebtedness.” 4 As set forth in Appendix B, we have collected data regarding purchased options and purchased swaptions but have not included that data in our descriptions of the use of derivatives by funds herein.

Division of Economic and Risk Analysis 2
transactions5 and other senior securities funds may issue, which similarly implicate section 18 of the Investment Company Act.6 We document the following empirical facts:
1. Based on data from Morningstar, total AUM of the U.S. registered fund industry was $17.9 trillion as of June 2015. With a share of 38%, US Equity represents the largest category of funds, followed by Taxable Bond, Allocation, and International Equity funds with 19%, 17%, and 15%, respectively. Alt Strategies funds7 comprise 3% of total AUM with the bulk being invested in Alternative funds and Nontraditional Bond funds. Between 2010 and 2014, the total number of funds grew by an average of 8% per year. During the same period, the number of Alt Strategies funds grew at an annual rate of 17%. While the industry experienced an annual growth rate in AUM of 12% over this period, the Alt Strategies funds grew by only 10%. However, this appears to be attributable to the fact that Commodity funds experienced significant contraction in AUM over the period (-12% annually), while Alternative funds’ and Nontraditional Bond funds’ AUM grew at an annual rate of 22%.
2. Form N-SAR data8 indicates many funds often do not use derivatives even if their investment policies allow them to do so. For example, 77% of all funds that completed Form N-SAR for 2014 have investment policies that allow the use of equity options, but only 6% report that they have actually used equity options during the reporting period.
3. Based on the random sample drawn from N-CSR filings, 32% of funds held one or more derivatives. The most commonly used derivatives were currency forwards (used by 13% of funds), followed by equity futures (12%) and interest rate futures (11%). Equity swaps and written equity options were used by around 5% of funds, and over-the-counter (OTC) interest rate swaps, cleared or exchange-traded interest rate swaps and OTC credit default swaps (CDS) were used by 4% of funds. Ten percent of funds used one or more financial commitment transactions and 6% of funds issue other senior securities.
4. We define a fund’s “derivatives exposure” to be its gross notional amount of derivatives. This measure of derivatives exposure averaged 20% of NAV. Among all funds, 68% had zero exposure, 89% had less than 50% exposure. The average aggregate exposure9 from derivatives, financial commitment transactions and other senior securities was 23% of NAV. Among all funds, 96% had aggregate exposure below 150%.
5. Interest rate derivatives, equity derivatives, and currency derivatives were the most heavily used with the notional amounts averaging 8%, 7%, and 4% of NAV, respectively. The average amounts
5 We use the term “financial commitment transactions” to refer to reverse repurchase agreements, short sale borrowings, and firm or standby commitment agreements or similar agreements. 6 Other senior securities include bank borrowings, margin loans, and with respect to closed-end funds and BDCs, senior debt and preferred shares. 7 We use “Alt Strategies” funds to refer collectively to Alternative funds, Commodities funds, and Nontraditional Bond funds. Nontraditional Bond funds are a category of Taxable Bond funds in Morningstar. We consider them as Alt Strategies funds primarily because many of the funds in this category aim to provide low correlations to the Traditional bond indexes and often feature absolute-return mandates. Moreover, there are a substantial number of funds within the category, primarily those with long-short credit strategies, that meet Morningstar’s shorting criteria used to classify alternative funds. We refer to all other funds collectively as Traditional funds. 8 Form N-SAR does not distinguish between written and purchased options. 9 Aggregate exposure refers to the sum of the aggregate notional amounts of the fund’s derivatives, the aggregate potential obligations of the fund under financial commitment transactions, and the aggregate indebtedness (and with respect to any closed-end fund or business development company, involuntary liquidation preference) with respect to any other senior securities.

Division of Economic and Risk Analysis 3
of financial commitment transactions and issuance of other senior securities were each 2% of NAV.
6. “Alt Strategies” mutual funds (which we define as Alternative mutual funds, Commodities mutual funds, and Nontraditional Bond mutual funds) tended to use derivatives more often than other fund types, which we describe collectively as “Traditional” mutual funds. Seventy-three percent of Alt Strategies mutual funds used derivatives compared to 29% of Traditional mutual funds, and their average gross notional amount was 121% of NAV compared to 10% among Traditional mutual funds. Fifty-two percent of Alt Strategies mutual funds had derivatives with gross notional amounts exceeding 50% of NAV compared to only 6% of the Traditional mutual funds. Alt Strategies mutual funds’ aggregate exposure averaged 132% of NAV compared to 11% among Traditional mutual funds, and 27% of Alt Strategies mutual funds had 150% or greater aggregate exposure compared to less than 2% of the Traditional mutual funds.
7. Among closed-end funds and ETFs, 47% and 29%, respectively, had exposure to derivatives. None of the BDCs in the sample had any exposure to derivatives. Nine percent of closed-end funds and 18% of ETFs had derivatives with gross notional amounts exceeding 50% of NAV. No closed-end fund had 150% or greater aggregate exposure, but 8% of ETFs did.
2. Introduction
A growing number of academic studies and press reports point to the importance or increased use of derivatives by registered funds.10 This trend may have been amplified by the advent of new derivatives products and by the growing number and size of Alt Strategies funds that seek to implement hedge fund-like strategies.
Despite the perceived increase in the use of derivatives, there is currently little systematic evidence on their use by funds. It is likely the case that the paucity of investigation is driven by a lack of easily accessible detailed data on funds’ derivatives transactions. As a result, studies have limited their examinations to whether a fund uses any derivatives, investigated a small set of funds, or examined only a single type of derivative. For example, Koski and Pontiff (1999) compare funds that use derivatives with those that do not, using a sample of 679 funds they surveyed by phone. Frino, Lepone, and Wong (2009) use survey data for 273 Australian fund managers. Cao, Ghysels, and Hatheway (2011) investigate 322 funds with information gathered from Form N-SAR and Form N-CSR. Adam and Guettler (2015) examine the use of CDS by corporate bond funds in 2004, and Jiang and Zhu (2015) examine the holdings for a sample of funds from 2007 and 2008. Each of these studies use information collected from Form N-CSR. Finally, Cici and Palacios (2015) examine the use of equity and index options by 250 US Equity funds from 2003-2010 using information collected from Form N-CSR.
10 For example, Koski and Pontiff (1999) contend that the increasing use of derivatives in registered funds stems from the 1997 repeal of the short-short rule which previously made derivatives usage disadvantageous from a tax standpoint. Prior to The Taxpayer Relief Act of 1997, mutual funds were subject to the “short-short” rule, which eliminates preferential pass-through tax status for funds that realize more than 30 percent of their capital gains from positions held less than three months. The rule effectively inhibited derivative use because some derivative securities such as options and futures contracts involve realizing capital gains for holding periods of less than three months. The Taxpayer Relief Act of 1997 included the repeal of the short-short rule.

Division of Economic and Risk Analysis 4
This paper provides data to inform the Commission’s consideration of the regulation of funds’ use of derivatives. To that end, we provide a comprehensive analysis of derivatives holdings based on a highly detailed hand-collected cross-sectional dataset representing a 10% random sample of all funds. This sample includes 1,188 open-end funds, closed-end funds, ETFs, and business development companies.11 The data contain notional amounts on an extensive list of derivative instruments including written options, swaps, forwards, and futures related to commodity, currency, credit, interest rate, and equity market risks. The data also contain detailed information on financial commitment transactions and other senior security issuances.
We investigate the extent of derivatives usage by funds, including the types of derivatives and types of risk exposures taken, by analyzing the notional amounts of derivatives held by individual funds and across different fund category groups and size quintiles. We also measure aggregate exposure as the sum of the notional amount of derivatives, together with obligations under financial commitment transactions and other senior securities.
The rest of the paper is structured as follows. In Section III we discuss the regulatory background governing derivatives usage by funds. In Section IV we describe our data. Section V provides an overview of the US fund industry and describes recent trends in industry growth. Section VI provides evidence on fund policies regarding derivatives and a high-level analysis of their use. Section VII provides detailed results on the use of derivatives by funds, and Section VIII concludes.
3. Regulatory background
The activities and capital structures of funds are regulated extensively under the Investment Company Act, Commission rules, and Commission guidance. The use of derivatives by funds implicates certain requirements under the Investment Company Act, including section 18 of that Act. Section 18 limits a fund’s ability to obtain leverage, or incur obligations to persons other than the fund’s common shareholders, through the issuance of senior securities as defined in that section. Funds’ current practices with respect to derivatives and certain other transactions are based on their applications of Commission guidance concerning the requirements of section 18 provided in a release issued by the Commission in 1979, together with other guidance provided by the Commission’s staff.12
This examination of the use of derivatives is designed to evaluate the extent to which funds use derivatives, in light of this framework, and to inform the Commission’s consideration of the regulation of funds’ use of derivatives, as described in more detail in a contemporaneous release published by the Commission proposing a new regulatory framework for funds’ use of derivatives and financial commitment transactions.
11 We include BDCs because they are closed-end investment companies and are subject to the requirements of section 18 of the Investment Company Act (as made applicable to a BDC by section 61 of the Act). 12 For a discussion of certain of the requirements under the Investment Company Act that are applicable to funds’ use of derivatives, see Use of Derivatives by Registered Investment Companies and Business Development Companies, Investment Company Act Release No. 31933 (Dec. 11, 2015), at section II.B.

Division of Economic and Risk Analysis 5
4. Data
Our base sample uses Morningstar Direct and allows us to provide a broad overview of the fund industry. It consists of all funds registered under the Investment Company Act in the database as of June 2015. We include funds marketed as part of variable insurance products, because they have the same legal structure as open-end funds and are subject to the Investment Company Act, but we exclude Money Market Funds13. The Morningstar sample consists of 11,973 funds.
The derivatives data currently provided by Morningstar (as well as other commercial vendors) is of somewhat limited detail.14 As a result, we create a second sample based on funds’ most recent Form N-SAR filing with the Commission. Funds are required to indicate on Form N-SAR whether their fund policies allow for investment in certain derivatives and whether they used those derivatives during the reporting period. Therefore, this N-SAR sample offers the advantage of allowing us to examine the ability to use derivatives as well as the actual usage of derivatives. The N-SAR sample consists of 12,360 funds.15
Unfortunately, some Form N-SAR data are coarse. For example, not all types of derivatives are included and certain data are only reported at an aggregate level. Form N-SAR also does not distinguish in all cases between those derivatives that create potential future obligations (e.g., written options) and those that do not (e.g., purchased options). Funds also report market values of certain derivatives holdings, which do not necessarily represent the potential exposures of the holdings or the extent of senior claims.16
To facilitate a more detailed examination of derivatives usage, we create a third sample by drawing a random sample of 10% of the funds in our base Morningstar sample17 and hand collect data on derivatives investments, financial commitment transactions and senior security issuances from each fund’s annual Form N-CSR filings. If a fund has not yet filed a Form N-CSR for 2014, it is dropped from the sample and replaced by one that has filed a Form N-CSR. The N-CSR sample consists of 1,188 funds.
13 Under rule 2a-7, money market funds are required to limit their investments to short-term, high-quality debt securities that fluctuate very little in value under normal market conditions. Money market funds thus do not engage in derivatives transactions. 14 The three vendors that provide fund holdings are Morningstar, Thomson Reuters’s Lipper, and Bloomberg. However, there are a large variety of derivatives and no standard reporting scheme exists. Many of the derivatives are OTC and customized. Even for exchange-traded derivatives, no common identification scheme like CUSIP exists. This leads to incomplete collection of information on derivatives in fund holdings. Even if derivatives are collected in fund holdings, basic descriptors such as the notional amount of the derivatives are not readily available. 15 See Appendix for a listing of the investment practices queried by Form N-SAR. In certain cases, funds omitted answers if their answers were unchanged from a previous filing. We corrected the missing answers due to this convention. After the correction, out of 12,360 funds that filed N-SAR, about 2.2% of funds still had missing answers to these questions. The sample is larger than the Morningstar sample because we sample from all funds filing Form N-SAR rather than requiring funds to be in the Morningstar database. We note that Form N-SAR is self-reported and not verified by a third party or the SEC. 16 For example, futures and swaps generally have zero market value at initiation. 17 To ensure that all subcategories of the Alt Strategies are represented in our sample, we randomly select funds within each of the subcategory groups (subject to a minimum of three funds per category).

Division of Economic and Risk Analysis 6
5. US fund industry growth and composition
5.1. Overview of the industry
In Table 1 we present an overview of the fund industry based on the Morningstar sample. As of June 2015, 11,973 funds with AUM information in Morningstar, had a total of $17.9 trillion AUM with the majority being in open-end funds. US Equity is the largest fund category group with 3,361 funds and 38% of total industry AUM. The next largest three fund category groups – Taxable Bond, Allocation, and International Equity funds – each have slightly less than 2,100 funds and about 17% of total industry AUM. Among the Alt Strategies funds, the largest category group is Alternative funds containing 894 funds with a total of 1% of total industry AUM.18 Based on Form 10-K and 10-Q filings (at the end of June 2015), there are 88 active BDCs with an estimated $52.3 billion in AUM.
5.2. Growth of Alt strategies funds
Table 2 presents information on the growth rates and net flows of different fund category groups between the end of 2010 and the end of 2014. We measure the number of funds and AUM at the end of each year and the net flows over the intervening years. Overall, the total number of registered funds grew from 8,577 to 11,573, an annual growth rate of 8%. While US Equity funds, International Equity funds, Allocation funds and Taxable Bond funds each added approximately 500 to 600 funds or about 8% per year in total, the largest percentage growth in number of funds occurred among Alt Strategies funds. The number of Nontraditional Bond funds increased from 39 to 138, an annual increase of 37% per year. The number of Alternative and Commodities funds grew by 16% and 13% per year, respectively.19
While total industry AUM increased 12% annually from 2010 to 2014, there was a large variation in annual growth rates across category groups. Nontraditional Bond funds experienced the largest growth (29%) and Commodity funds experienced negative growth (-12%). Interestingly, Figure 1.2 presents evidence that most of the dispersion in growth rates occurred in the years 2013 and 2014.
Growth in AUM is the result of both portfolio returns and net inflows of investor capital. Table 2 shows that as a percentage of AUM, US Equity and Municipal Bond funds received, on average, almost no net inflows. This contrasts with Nontraditional Bond funds and Alternative funds which received annual net inflows averaging 29% and 21%, respectively. The annual net flows as a percentage of industry flows in Table 2 reveal that Alt Strategies funds received a disproportionate amount of inflows given their industry share.
18 Alt Strategies funds tend to be smaller in size with a median size of $40-$70 million as compared to the median size of $200-$300 million for equity or taxable bond funds. 19 When plotting the cumulative growth in the number of funds between 2010 and 2014, Figure 1.1 reveals the large cross-sectional dispersion with positive growth rates in all category groups and Municipal Bond funds experienced the lowest growth rate and Nontraditional Bond funds the highest.

Division of Economic and Risk Analysis 7
Comparing net inflows to growth in AUM suggests that US Equity funds experienced growth in AUM almost entirely driven by portfolio returns. In contrast, the growth in AUM of Alt Strategies funds was driven by inflows, despite relatively poor returns. Figure 1.3 plots the cumulative net inflows from 2010 to 2014 as a percentage of 2010 AUM. Like the growth rates in AUM, there is significant variation in net inflows across category groups with most of the dispersion coming from the years 2013 and 2014. While Nontraditional Bond funds and Alternative funds received the largest net inflows in 2013, US Equity funds had nearly zero net inflows and Commodity funds saw a net outflow of 10%. The long-term growth rates for Alt Strategies funds presented in Figures 2.1, 2.2, and 2.3 indicate that these funds have grown rapidly over the past 10 years.
6. Derivatives policies and usage
As discussed above, the Morningstar data do not offer insight into the usage of derivatives. We turn to the N-SAR Sample, which provides information on fund policies for investments in certain derivatives, fund usage of those derivatives, and the market value of the derivatives positions during the reporting period.
6.1. Fund policies allowing the use of derivatives and the actual use of derivatives
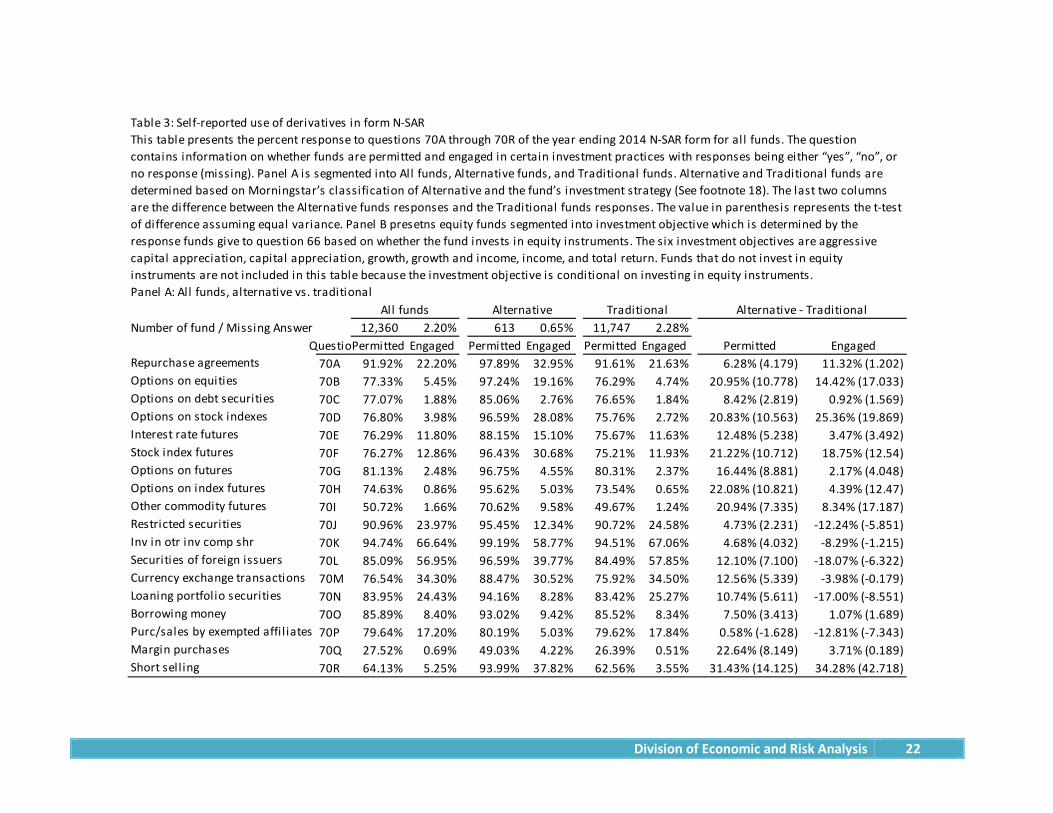
Funds are required to indicate on Form N-SAR whether their policies allow for investment in certain derivatives and whether they used those derivatives during the reporting period. We sought to identify funds filing Form N-SAR that pursue an “Alternative” 20 investment policy as defined by Morningstar. This involved matching our Morningstar sample of Alternative funds to N-SAR data by fund name and size. We also searched in the fund names for “Alternative”, “Bear market”, “Long/Short” and other keywords that indicate the fund is an Alternative fund. Accordingly, the number of “Alternative” and “Traditional” funds in Table 3 and 4 will not correspond identically to those identified using the Morningstar criteria in Tables 1 and 2. Panel A in Table 3 reports descriptive statistics on the fund responses to questions 70A through 70R on Form N-SAR as of 201421 for all funds and separately for Alternative funds and Traditional funds. The last two columns report the difference between Alternative fund responses and Traditional fund responses with a t-test for the difference reported in parentheses.
20 Because of the resources required to match N-SAR and Morningstar data, for the purposes of the analysis using N-SAR data, we focus on Alternative funds rather than the combination of Nontraditional Bond funds, Alternative funds, and Commodity funds (our definition of Alt Strategies funds). All funds other than Alternative funds are treated as Traditional funds for this analysis. Note also that the category Traditional funds includes the small number of Nontraditional Bond funds and Commodity funds and hence is distinct from Traditional Mutual funds use elsewhere in the paper. 21 We also examined historical responses to question 70 from 1993 to 2014. We find no cyclical patterns or increased use of derivatives during stressed market periods. We find a steadily increasing trend on the percentage of funds reporting the use of derivatives over the period. We present only the current snapshot of the N-SAR response.

Division of Economic and Risk Analysis 8
The results in Table 3 indicate that on average 74% of funds had investment policies that allow the use of certain derivatives22 but that only 5% did so. There is significant variation in the policy provisions across investment types. For example, investments in other investment company shares were allowed by 95 of funds. Only 28% of funds had policies which allow margin purchases. The list of instruments actually being used by funds is dominated by investments in other investment company shares with 67% of all funds making such investments. Stock index futures and interest rate futures were used by 13% and 12% of all funds while various option contracts were used by between 5% and 1% of all funds. While 64% of all funds were allowed to engage in short selling, only 5% of all funds actually did so.
Among Alternative funds, an average of 91% of funds had investment policies allowing the use of certain derivatives. Alternative funds appear to have been less restricted than the Traditional funds in their ability to use derivatives. Only 73% of Traditional funds’ policies allowed for the use of certain derivatives. The largest differences between Alternative funds and Traditional funds, in terms of investment policies, was short selling (for which allowed use was 94% compared to 63%), options on index futures (96% compared to 74%), stock index futures (96% compared to 75%), options on equities (97% compared to 76%), other commodity futures (71% compared to 50%), options on stock indexes (97% compared to 76%),
With an average actual usage of 14%, Alternative funds are also more likely to use derivatives compared to Traditional funds, of which 5% actually use derivatives, as reported on Form N-SAR. Alternative funds were more likely to use short selling and options and futures and Traditional funds were more likely to invest in securities of foreign issuers, loan portfolio securities, purchases and sales by exempted affiliates, and invest in restricted securities. In particular, 38% of Alternative funds engaged in short selling while only 4% of Traditional funds did so. Fifty-eight percent of Traditional funds invested in securities of foreign issuers while only 40% of Alternative funds did so.
In Panel B of Table 3, we report results on derivatives policies for a subsample of equity funds within six investment objectives:23 Total Return, Aggressive Capital Appreciation, Capital Appreciation, Growth, Growth and Income, and Income. These funds all invest in equities, but they likely differ in their investment policies and potentially in their use of derivatives depending on their aggressiveness or investment objectives. Indeed, the results suggest that funds with more aggressive investment objectives were more likely to have investment policies that allowed the use of (equity) derivatives, borrowing money, and engaging in short selling. For example, 92% of Aggressive Capital Appreciation equity funds allowed the use of stock index futures but only 75% of Income equity funds allowed their use. Ninety-three percent of Aggressive Capital Appreciation funds allowed borrowing compared to 81% of Income funds. The same pattern emerges with respect to the actual usage of (equity) derivatives, borrowing money, or engaging in short selling. For example, while 29% of Aggressive Capital Appreciation equity funds invested in stock index futures, only between 10% and 20% of funds in the other objectives did so. Finally, we note that income funds were more likely to use interest rate futures than other equity fund types.
22 Average of percent of funds having: options on equities, options on debt securities, options on stock indexes, interest rate futures, stock index futures, options on futures, options on index futures and other commodity futures. 23 See question 66 on Form N-SAR.
Division of Economic and Risk Analysis 9
6.2. Market values of certain derivatives positions
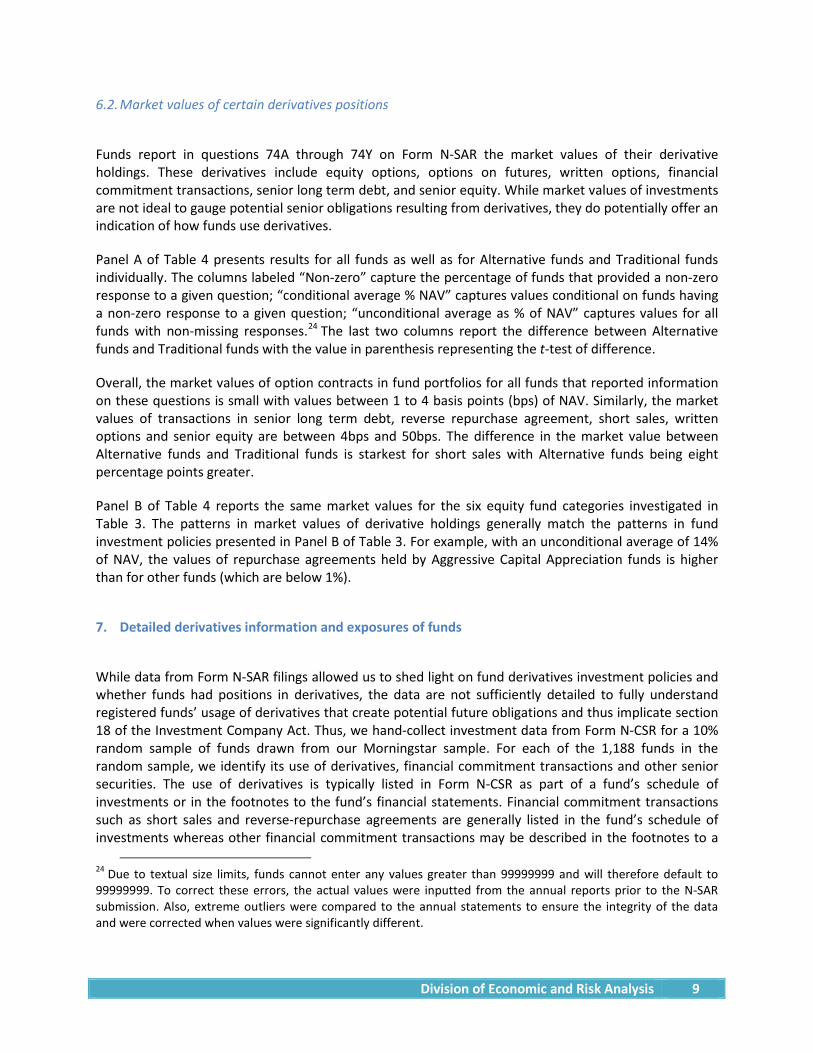
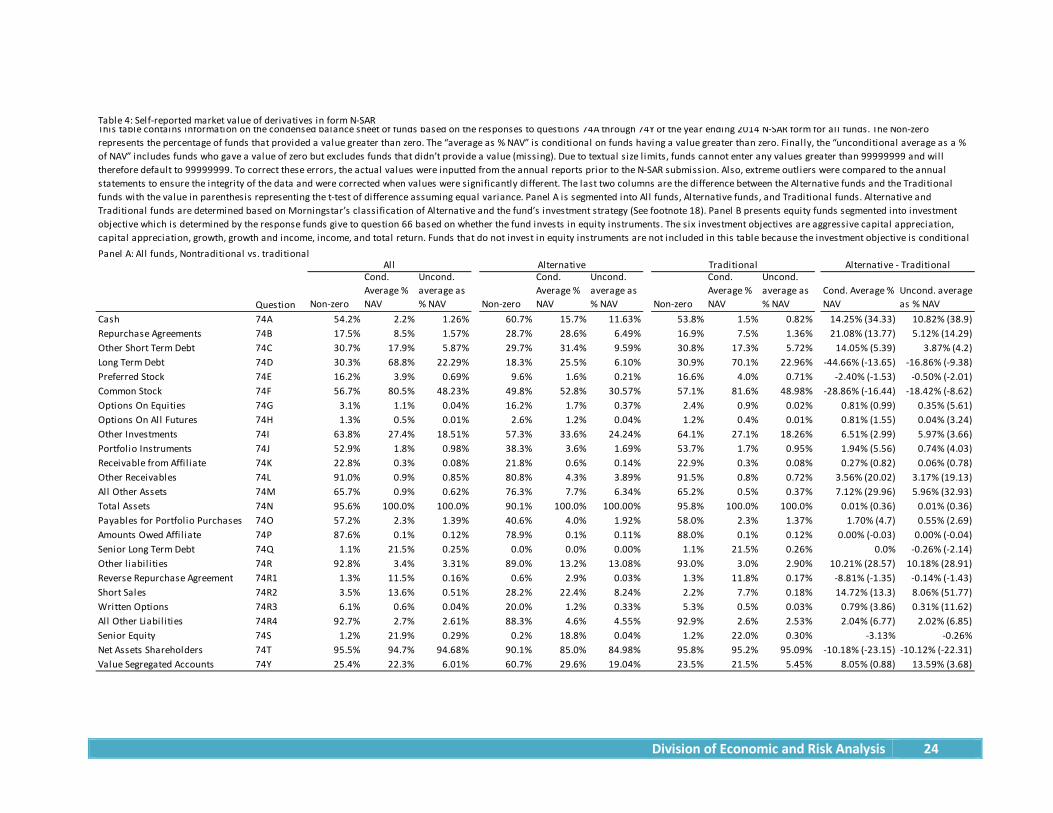
Funds report in questions 74A through 74Y on Form N-SAR the market values of their derivative holdings. These derivatives include equity options, options on futures, written options, financial commitment transactions, senior long term debt, and senior equity. While market values of investments are not ideal to gauge potential senior obligations resulting from derivatives, they do potentially offer an indication of how funds use derivatives.
Panel A of Table 4 presents results for all funds as well as for Alternative funds and Traditional funds individually. The columns labeled “Non-zero” capture the percentage of funds that provided a non-zero response to a given question; “conditional average % NAV” captures values conditional on funds having a non-zero response to a given question; “unconditional average as % of NAV” captures values for all funds with non-missing responses.24 The last two columns report the difference between Alternative funds and Traditional funds with the value in parenthesis representing the t-test of difference.
Overall, the market values of option contracts in fund portfolios for all funds that reported information on these questions is small with values between 1 to 4 basis points (bps) of NAV. Similarly, the market values of transactions in senior long term debt, reverse repurchase agreement, short sales, written options and senior equity are between 4bps and 50bps. The difference in the market value between Alternative funds and Traditional funds is starkest for short sales with Alternative funds being eight percentage points greater.
Panel B of Table 4 reports the same market values for the six equity fund categories investigated in Table 3. The patterns in market values of derivative holdings generally match the patterns in fund investment policies presented in Panel B of Table 3. For example, with an unconditional average of 14% of NAV, the values of repurchase agreements held by Aggressive Capital Appreciation funds is higher than for other funds (which are below 1%).
7. Detailed derivatives information and exposures of funds
While data from Form N-SAR filings allowed us to shed light on fund derivatives investment policies and whether funds had positions in derivatives, the data are not sufficiently detailed to fully understand registered funds’ usage of derivatives that create potential future obligations and thus implicate section 18 of the Investment Company Act. Thus, we hand-collect investment data from Form N-CSR for a 10% random sample of funds drawn from our Morningstar sample. For each of the 1,188 funds in the random sample, we identify its use of derivatives, financial commitment transactions and other senior securities. The use of derivatives is typically listed in Form N-CSR as part of a fund’s schedule of investments or in the footnotes to the fund’s financial statements. Financial commitment transactions such as short sales and reverse-repurchase agreements are generally listed in the fund’s schedule of investments whereas other financial commitment transactions may be described in the footnotes to a
24 Due to textual size limits, funds cannot enter any values greater than 99999999 and will therefore default to 99999999. To correct these errors, the actual values were inputted from the annual reports prior to the N-SAR submission. Also, extreme outliers were compared to the annual statements to ensure the integrity of the data and were corrected when values were significantly different.

Division of Economic and Risk Analysis 10
fund’s financial statements. Other senior securities, such as bank borrowings, drawn credit lines, senior debt and preferred shares are set forth in the fund’s financial statements.
7.1. Collecting and measuring derivatives exposure
Based on these data, we calculate the notional amount of each derivatives position. The choice of using notional amount to measure derivatives usage reflects some compromise. On one hand, the notional amount generally reflects an equivalent position in the underlying reference asset for the derivatives transaction. Further, since the concept of notional amount is applicable across various derivatives instrument types as well as underlying reference assets, notional amounts allow for aggregation. Mark-to-market value is an alternative measure of a derivatives position. The mark-to-market value of a derivative on the fund’s financial statements generally only reflects the fund’s gain or loss on the derivative and may be zero (as will generally be the case at the inception of a transaction). It does not reflect the market exposure or potential leverage resulting from the derivative. The notional amount achieves this goal to a greater extent.
On the other hand, there are drawbacks to using notional amounts. First, because of differences in expected volatilities of the underlying assets, notional amounts of derivatives across different underlying asset generally do not represent the same unit of risk. For example, the level of risk associated with a $100 million notional of a S&P500 index futures is not equivalent to the level of risk of a $100 million notional of interest rate swaps, currency forwards or commodity futures.
Second, data are not available to delta-adjust notional amounts of options. Funds do not report the delta of their option positions and we are not able to obtain that information from other sources. We do not delta-adjust due to this limitation in our data. This may lead to the deviation of notional amounts from economic exposure. Delta-adjusting would tend to reduce the calculated exposure for options.
Collecting the notional amounts of derivatives from fund annual reports posed several challenges. First, a significant percentage of funds do not clearly report the notional amounts for various derivatives or provide precise descriptions of notional amounts. For options and futures, for example, we manually looked up the contract size, historical value of the underlying, or spot price of the underlying asset (as applicable) as of the report date. Second, there is no standardized reporting of derivatives. For example, some funds reported numbers without units. In some cases the number of contracts for some options was reported in the same column as the notional amount for other options. We applied our judgment based on the magnitude, type of derivative, and consistency with other financial statement information to assign an appropriate notional amount in such cases. Third, when notional amounts were reported, there were instances where they were not consistent with other parameters of the derivatives. We correct such errors wherever possible. Fourth, many derivatives or underlying assets were denominated in foreign currencies. We converted their notional amounts to dollar amounts at the exchange rate on the reporting date. Fifth, for some types of derivatives, funds may enter into offsetting transactions in order to reduce or eliminate their economic exposure. In some cases, both initial and offsetting transactions continued to be reported on the fund’s schedule of investments. For example, for some futures contracts that trade on foreign exchanges, offseting positions remain open and carried forward until the maturity date, whereas for futures that trade on US exchanges, offsetting positions generally

Division of Economic and Risk Analysis 11
are extinguished. We manually matched offsetting derivatives and netted them out. We only net the offsetting positions that have the same underlying asset, strike price and maturities, but we do not require the same counterparty.25 As a result, our calculations reflect cancelled notional amounts for certain offsetting derivatives entered into with different counterparties. Sixth, for total return swaps, we computed the notional amounts as the sum of the notional amounts of securities referenced in the swaps. Finally, for short term interest rate futures, such as 90-day Euro-dollar futures, we followed the apparent industry convention to divide the notional amount by the appropriate divisor to adjust any interest rate future having a term shorter than one year. For example, with respect to 90-day Euro-dollar futures, the notional amount is divided by four.
We collect notional amounts separately for long and short positions or record them as NA when a direction is not applicable, categorize the derivatives positions by instrument, underlying risk factor, and whether the derivative is exchange-traded, centrally cleared, or neither.26 We aggregate notional amounts for each fund by derivative instrument and primary underlying risk factor. The instrument categories are forwards, futures, swaps, options, and swaptions, and the underlying risk factors are interest rate risk, credit risk, equity market risk, currency risk, and commodity risk.
7.2. Descriptive statistics
The N-CSR random sample of 1,188 funds contains 81 Alt Strategies Mutual Funds27, 899 Traditional mutual funds, 58 Closed-end funds, 22 Alt Strategies ETFs, 118 Traditional ETFs and 10 BDCs. In Table 5 we report summary statistics on notional amounts of the derivatives as well as information on financial commitment transactions and other senior securities. The first column shows the percentage of funds that use a certain type of derivative. The most commonly used derivatives are currency forwards, equity futures, and interest rate futures, with 13%, 12% and 11% of all funds using them, respectively. Five percent of all funds write equity options or use equity swaps, and 4% of all funds use cleared or exchange-traded interest rate swaps, OTC interest rate swaps, and OTC CDS. Cleared CDS are used by 3% of funds, 5% of all funds engage in short selling and 4% use bank borrowings.28 All other types of derivatives and financial commitment transactions are typically used by less than 2% of the funds.
Table 5 also shows that the average gross notional amount of interest rate futures as a percentage of NAV is 4% across all funds and 38% among funds that use interest rate futures. The average notional amounts relative to fund NAV for currency forwards, equity futures, cleared/exchange-traded interest
25 This provides a representation of the fund’s economic exposure in cases where a fund chooses to use an offsetting transaction with a second counterparty rather than terminate its initial position, which could be less efficient due to tax or other considerations. Counterparty risk could be different depending on the relative riskiness of the two counterparties. 26 Many OTC derivatives are not cleared. For a comparison among OTC, cleared and exchange-traded derivatives, see International Swaps and Derivatives Association FAQ at: http://www.isda.org/educat/faqs.html. 27 We further divided the Alt Strategies Mutual Funds into the two categories, Index Alt Strategies Mutual Funds and Non-index Alt Strategies Mutual Funds. The sample contains 12 Index Alt Strategies Mutual Funds and 69 Non-index Alt Strategies Mutual Funds. We define index Alt Strategies Mutual Funds later in this section. 28 Under section 18(g) of the Investment Company Act, certain loans for temporary purposes that do not exceed 5% of a fund’s total assets are excluded from the definition of “senior security”. It is possible that some funds in the sample that had bank borrowings were relying on this provision.

Division of Economic and Risk Analysis 12
rates swaps, and written equity options are between 1% and 3% for all funds, and between 16% and 33% conditional on holding any derivative. Obligations related to short sales are only between 1% and 2% of NAV for all funds and between 8% and 20% for funds that engage in these transactions. What stands out is that, while the average notional amount of equity swaps is only 3% of NAV of all funds, the average notional amount is 70% of NAV for those funds that do engage in equity swaps.
7.3. Notional amounts across different risk exposures and instruments
In Table 6 we summarize the notional amounts aggregated by reference asset and instrument type. Panel A shows the statistics on the entire random sample. Overall, 32% of funds hold derivatives with an average gross notional amount 20% of the NAV. Equity derivatives, the most commonly used derivatives, are held by 18% of funds, currency derivatives by 14%, and cleared/exchange-traded interest rate derivatives by 12%. Interest rate derivatives, equity derivatives, and currency derivatives represent 8%, 7% and 4% of NAV, respectively. Classified by instrument type, 21% of funds use futures, 13% use currency forwards, 12% use swaps, 7% have written options. Average notional amounts as a percentage of NAV for futures, swaps, and currency forwards are 7%, 7%, and 3%, respectively. Ten percent of funds use some financial commitment transactions with an average of 2% of NAV. Only 5% of funds issue other senior securities with an average amount of 2% of NAV.
Since derivatives, financial commitment transactions, and other senior securities all allow funds to obtain additional market exposure and potentially create leverage, we calculate an aggregate exposure for each fund. Specifically, we calculate aggregate exposure by adding (i) the gross notional amounts of the derivatives; (ii) the aggregate obligations of the fund under financial commitment transactions; and (iii) the aggregate indebtedness (and with respect to any closed-end fund or business development company, involuntary liquidation preference) with respect to any other senior securities, including bank borrowings, margin loans, senior debt issuances and preferred shares. While the leveraging effect of derivatives transactions depends on a variety of factors, the aggregate exposure can be regarded as a rough measure of the total potential leverage that a fund may obtain from different types of derivatives and other senior securities transactions. For the entire random sample, the average aggregate exposure is 23% of NAV.
In Panel B, we examine the mutual funds in the Alt Strategies fund group that are not index funds. These non-index Alt Strategies mutual funds are more likely to use all types of derivatives and financial commitment transactions, but are not more likely to issue other senior securities. For example, 71% of the non-index Alt Strategies mutual funds use some type of derivative as compared to only 29% of Traditional mutual funds. Furthermore, among non-index Alt Strategies mutual funds, 51% use equity derivatives and 42% use currency derivatives whereas 15% and 14% of Traditional mutual funds use these derivatives.
Alt Strategies funds also hold derivatives with significantly larger notional amounts compared to Traditional mutual funds. For example, their interest rate derivatives represent 44% of NAV, currency derivatives 34%, equity derivatives 32%, and commodity derivatives 12%. Aggregated by instruments, futures represent 60% of NAV, swaps 30%, currency forwards 22% and written options 15%. On average,
Division of Economic and Risk Analysis 13
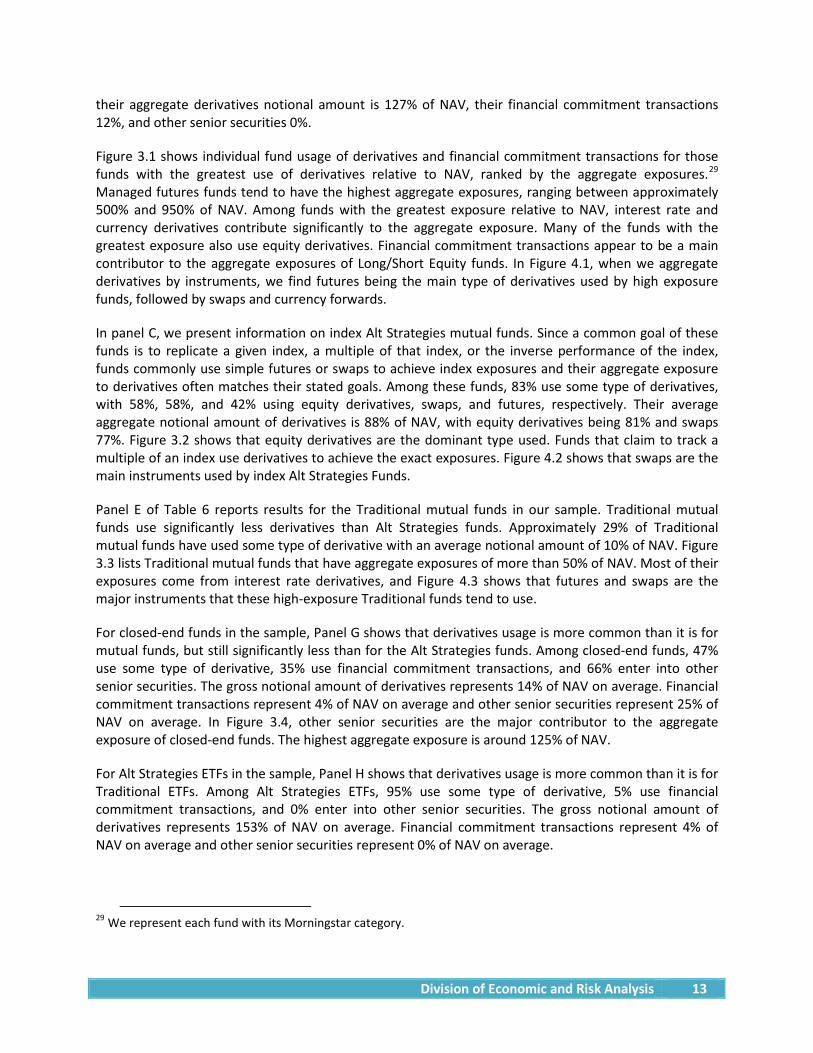
their aggregate derivatives notional amount is 127% of NAV, their financial commitment transactions 12%, and other senior securities 0%.
Figure 3.1 shows individual fund usage of derivatives and financial commitment transactions for those funds with the greatest use of derivatives relative to NAV, ranked by the aggregate exposures.29 Managed futures funds tend to have the highest aggregate exposures, ranging between approximately 500% and 950% of NAV. Among funds with the greatest exposure relative to NAV, interest rate and currency derivatives contribute significantly to the aggregate exposure. Many of the funds with the greatest exposure also use equity derivatives. Financial commitment transactions appear to be a main contributor to the aggregate exposures of Long/Short Equity funds. In Figure 4.1, when we aggregate derivatives by instruments, we find futures being the main type of derivatives used by high exposure funds, followed by swaps and currency forwards.
In panel C, we present information on index Alt Strategies mutual funds. Since a common goal of these funds is to replicate a given index, a multiple of that index, or the inverse performance of the index, funds commonly use simple futures or swaps to achieve index exposures and their aggregate exposure to derivatives often matches their stated goals. Among these funds, 83% use some type of derivatives, with 58%, 58%, and 42% using equity derivatives, swaps, and futures, respectively. Their average aggregate notional amount of derivatives is 88% of NAV, with equity derivatives being 81% and swaps 77%. Figure 3.2 shows that equity derivatives are the dominant type used. Funds that claim to track a multiple of an index use derivatives to achieve the exact exposures. Figure 4.2 shows that swaps are the main instruments used by index Alt Strategies Funds.
Panel E of Table 6 reports results for the Traditional mutual funds in our sample. Traditional mutual funds use significantly less derivatives than Alt Strategies funds. Approximately 29% of Traditional mutual funds have used some type of derivative with an average notional amount of 10% of NAV. Figure 3.3 lists Traditional mutual funds that have aggregate exposures of more than 50% of NAV. Most of their exposures come from interest rate derivatives, and Figure 4.3 shows that futures and swaps are the major instruments that these high-exposure Traditional funds tend to use.
For closed-end funds in the sample, Panel G shows that derivatives usage is more common than it is for mutual funds, but still significantly less than for the Alt Strategies funds. Among closed-end funds, 47% use some type of derivative, 35% use financial commitment transactions, and 66% enter into other senior securities. The gross notional amount of derivatives represents 14% of NAV on average. Financial commitment transactions represent 4% of NAV on average and other senior securities represent 25% of NAV on average. In Figure 3.4, other senior securities are the major contributor to the aggregate exposure of closed-end funds. The highest aggregate exposure is around 125% of NAV.
For Alt Strategies ETFs in the sample, Panel H shows that derivatives usage is more common than it is for Traditional ETFs. Among Alt Strategies ETFs, 95% use some type of derivative, 5% use financial commitment transactions, and 0% enter into other senior securities. The gross notional amount of derivatives represents 153% of NAV on average. Financial commitment transactions represent 4% of NAV on average and other senior securities represent 0% of NAV on average.
29 We represent each fund with its Morningstar category.

Division of Economic and Risk Analysis 14
For Traditional ETFs in the sample, 16% use some type of derivative, 1% use financial commitment transactions, and 0% enter into other senior securities. The gross notional amount of derivatives represents 7% of NAV on average; financial commitment transactions and other senior securities each represent 0% of NAV on average.
None of the business development companies in the sample uses derivatives, but 80% use financial commitment transactions, and 80% enter into other senior securities. The gross notional amount of derivatives represents 0% of NAV on average. Financial commitment transactions represent 16% of NAV on average and other senior securities represent 42% of NAV on average.
7.4. Gross notional amounts by fund category groups
In this subsection we examine how gross notional amounts differ across fund category groups. We use Morningstar broader US category groups for Traditional funds and the detailed Morningstar categories for Alt Strategies Funds.
Figures 5.1 and 6.1 show results for the entire sample. Overall, Alternative funds have the highest average aggregate exposure with 142% of NAV. They use interest rate, equity, and currency derivatives, mostly in the form of futures or swaps. Commodity funds have the second highest aggregate exposure at 91%, with a majority of exposure coming from commodity futures. All other funds have aggregate exposure below 50%.
Figures 5.2 and 6.2 present aggregate exposures for non-index Alt Strategies funds. With 450%, Managed futures funds have the highest average aggregate exposure. Interest rate derivatives represent more than half of their exposure, followed by equity and currency derivatives. These funds achieve most of their exposures through futures. The remaining categories have average aggregate exposures between 100% and 200% with the exception of Market neutral and Long/short equity, which have average aggregate exposures of about 50% Furthermore, Market Neutral and Long/short equity all have significant amounts of financial commitment transactions, most commonly in short sales, contributing to their aggregate exposure.
Figures 5.3 and 6.3 show results for index Alt Strategies funds. The average aggregate exposure for Trading-Inverse Equity is 200%, for Bear market 125%, and for Trading-leveraged Equity 123%, with aggregate exposure mostly coming from equity swaps. Figures 5.4 and 6.4 present the information for Traditional mutual funds. For all funds in this category, their average aggregate exposure is below 50%.
Figures 5.5 and 6.5 provide the results for closed-end funds. Municipal Bond, Taxable Bond, Allocation, and Sector Equity funds all use significant amounts of other senior securities, and Taxable Bond funds and Allocation funds also use financial commitment transactions. All funds, except international equity, have between 40% to 50% exposures to financial commitment transactions and other senior securities. Closed-end equity funds also hold notable amounts of written options.
For Alt Strategies ETFs, funds that are used as trading tools have the largest aggregate exposure. Inverse debt ETFs have 290% aggregate exposure, leverage debt ETFs have 210%, inverse equity ETFs have 200% and leverage equity ETFs have 190%. Most of these exposures are created through swaps. Commodities, Single currency and Market Neutral ETFs have aggregate exposures around 100%.
Division of Economic and Risk Analysis 15
For Traditional ETFs, the aggregate exposures are zero or close to zero. The exception is International ETFs, which have an average aggregate exposure of 22%, which is mostly coming from currency forwards.
7.5. Gross notional amounts by fund size
Figures 7 and 8 provide evidence on derivatives usage as a function of fund size. We group funds into quintiles based on fund size and compute the average aggregate exposures.30
Figures 7.2 and 8.2 show that non-index Alt Strategies funds in the smallest size quintile use less derivatives with aggregate exposure about half that of other size quintiles. Small funds also do not seem to use written options. Similarly, for Traditional mutual funds in Figures 7.4 and 8.4 small funds exhibit only about half the average aggregate exposure of large funds. The funds in the smallest quintile do not have financial commitment transactions. For the closed-end funds presented in Figures 7.5 and 8.5, small funds use less equity derivatives and financial commitment transactions.
7.6. Distribution of number of funds and AUM across exposures
In this subsection we examine the distribution of aggregate exposures across fund types. Figures 9 and 10 present aggregate exposures grouped by exposure bins with the vertical bars showing the percentage of funds in number and in AUM31 that fall into a given bin. Across the entire random sample, 62% (48% in AUM) of funds have zero aggregate exposure, 96% (95% in AUM) have aggregate exposures below 150%, and only 3% (3% in AUM) of the funds have aggregate exposures greater than 300%.
Few of the Alt Strategies funds and Alt Strategies ETFs have zero aggregate exposure. The majority of exposure among Alt Strategies funds is below 150%, but 27% and 11% of the funds have exposures larger than 150% and 300%, respectively. Among Alt Strategies ETFs, 45% of funds have exposures larger than 150% but no fund has exposure above 300%.
This contrasts with aggregate exposures of the Traditional mutual funds and Traditional ETFs where 69% and 84% respectively have zero exposure and 99% in both categories have exposures below 150%. No Traditional mutual fund and only 1% of Traditional ETFs have aggregate exposure above 300%.
For the closed-end funds, 14% (5% in AUM) have zero aggregate exposure and none has exposure above 150%. For the business development companies, 20% (8% in AUM) have zero aggregate exposure and for all, the aggregate exposure is below 150%.
30 Quantile 0 consists of funds with the smallest size and quantile 4 consists of funds with the largest size. 31 Figure 10 gives us the distribution of exposures across AUMs. We sum the AUMs of funds whose exposure falls within certain ranges. This gives us an estimate of the total dollar amount of exposures instead of the number of funds. It can also be seen as size weighted distribution, while in figure 9 small and large funds receive equal weights.
Division of Economic and Risk Analysis 16
7.7. Distribution of gross notional of derivatives across fund types
Lastly, we examine the distribution of gross notional of derivatives across fund types in Figures 11 and 12. For our entire random sample, 68% (53% in AUM) of funds in the random sample have zero derivatives and 89% (90% in AUM) have derivatives below 50%.
For Alt Strategies funds, 27% (15% in AUM) have no derivatives and 48% (29% in AUM) have derivatives below 50%. For Alt Strategies ETFs, 5% (0% in AUM) have zero derivatives and only 15% (2% in AUM) have derivatives below 50%.
This contrasts with Traditional mutual funds and Traditional ETFs. Of the former, 71% (53% in AUM) have no derivatives and 94% (92% in AUM) have derivatives below 50%, and among the latter, 84% (66% in AUM) have zero derivatives and 95% (93% in AUM) have derivatives below 50%. Among closed-end funds, 54% (37% in AUM) have zero derivatives and 91% (87% in AUM) have derivatives below 50%. None of the business development companies has derivatives.
8. Summary and discussion
The paper presents information on the US registered fund industry use of derivatives. Because existing aggregated data sources do not provide sufficient details, we hand collected data on the derivative holdings, financial commitment transactions and other senior securities for a sample of 1,188 funds that represents 10% of the universe of funds in Morningstar. We examine the frequency and magnitude of derivatives usage across different fund categories, derivatives risk exposures and instruments. We document that Alternative funds, Nontraditional Bond funds and Commodity funds use greater amounts of derivatives than Traditional mutual funds. We further present evidence that some funds in the random sampling have gross notional exposures ranging up to approximately 950% of NAV.
9. Appendix
A. Form N-SAR question 70
Form N-SAR requires funds to provide information on various fund investment policies and practices. In particular, Form N-SAR requires funds to disclose if certain investment practices are allowed under their policies, and if so, were they engaged in during the reporting period. The list of practices included on Form N-SAR is shown below.
70A: Writing or investing in repurchase agreements.
70B: Writing or investing in options on equities.
70C: Writing or investing in options on debt securities.
70D: Writing or investing in options on stock indices.
70E: Writing or investing in interest rate futures.
70F: Writing or investing in stock index futures.

Division of Economic and Risk Analysis 17
70G: Writing or investing in options on futures.
70H: Writing or investing in options on stock index futures.
70I: Writing or investing in other commodity futures.
70J: Investments in restricted securities.
70K: Investments in shares of other investment companies.
70L: Investments in securities of foreign issuers.
70M: Currency exchange transactions.
70N: Loaning portfolio securities.
70O: Borrowing of money.
70P: Purchase/sales by certain exempted affiliated persons.
70Q: Margin purchases.
70R: Short selling.
B. Morningstar U.S. fund category groups.
Morningstar does not explicitly define its category groups beyond the names of the category groups themselves. They note that they assign portfolios to category groups based on average holdings over the prior three years or where they believe a fund will end up if it has existed for less than three years. We interpret Morningstar’s fund category groups as follows.
US Equity: A group of similar funds that invests in US equities based on market capitalization and growth.
Sector Equity: A group of similar funds that invests in US equities of specific sectors.
International Equity: A group of similar funds that invests in non-US equities based on market capitalization and growth or specific geographic area or country.
Allocation: A group of similar funds that invest to maintain a target mix of assets over time. The target mix may remained fixed, or vary over time.
Taxable Bond: A group of similar funds that invest in debt securities whose returns are taxable at the local, state, or federal level.32
32 Nontraditional Bond category contains funds that pursue strategies divergent in one or more ways from

Division of Economic and Risk Analysis 18
Municipal Bond: A group of similar funds that all invest in municipal bond securities. These funds may invest nationally, or they may invest primarily in one single state.
Alternative: A group of funds that invest into one or more of the following three investment types: 1) Nontraditional asset classes, 2) Nontraditional strategies, and 3) less liquid assets.
Commodities: A group of similar funds that have either direct, or indirect exposures to commodity prices.
Money Market: A group of funds that invest in short-term securities that mature in less than one year, and are low risk enough to be considered cash equivalents.
10. References
Adam, Tim, and Andre Guettler, 2015, Pitfalls and perils of financial innovation: The use of CDS by corporate bond funds, Journal of Banking & Finance 55, 204–214.
Cao, Charles, Eric Ghysels, and Frank Hatheway, 2011, Derivatives do affect mutual fund returns: Evidence from the financial crisis of 1998, Journal of Futures Markets 31, 629–658.
Cici, Gjergji, and Luis-Felipe Palacios, 2015, On the use of options by mutual funds: Do they know what they are doing?, Journal of Banking & Finance 50, 157–168.
Deli, Daniel N., and Raj Varma, 2002, Contracting in the investment management industry: evidence from mutual funds, Journal of Financial Economics 63, 79–98.
Frino, Alex, Andrew Lepone, and Brad Wong, 2009, Derivative use, fund flows and investment manager performance, Journal of Banking & Finance 33, 925–933.
conventional practice in the broader bond-fund universe. Many funds in this group describe themselves as "absolute return" portfolios, which seek to avoid losses and produce returns uncorrelated with the overall bond market; they employ a variety of methods to achieve those aims. Another large subset are self-described "unconstrained" portfolios that have more flexibility to invest tactically across a wide swath of individual sectors, including high-yield and foreign debt, and typically with very large allocations. Funds in the latter group typically have broad freedom to manage interest-rate sensitivity, but attempt to tactically manage those exposures in order to minimize volatility. The category is also home to a subset of portfolios that attempt to minimize volatility by maintaining short or ultra-short duration portfolios, but explicitly court significant credit and foreign bond market risk in order to generate high returns. Funds within this category often will use credit default swaps and other fixed income derivatives to a significant level within their portfolios.

Division of Economic and Risk Analysis 19
Galkiewicz, Dominika Paula, 2014, Similarities and differences between US and German regulation of the use of derivatives and leverage by mutual funds: What can regulators learn from each other?, SFB 649 Discussion Paper.
International Swaps and Derivatives Association, ISDA Product Descriptions and FAQs, .
Jiang, Wei, and Zhongyan Zhu, 2015, Mutual Fund Holdings of Credit Default Swaps: Liquidity Management and Risk Taking. SSRN Scholarly Paper, Social Science Research Network, Rochester, NY.
Koski, Jennifer Lynch, and Jeffrey Pontiff, 1999, How Are Derivatives Used? Evidence from the Mutual Fund Industry, The Journal of Finance 54, 791–816.

Division of Economic and Risk Analysis 20
Table 1: An overview of the registered fund industry (as of June, 2015)
Panel A: Invesment Companies
Number of
FundsAUM
Median AUM
Number of
FundsAUM
Median AUM
Number of
FundsAUM
Median AUM
Number of
FundsAUM
Median AUM
% of Industry
Total All 9,707 15,854,383 252 560 250,357 287 1,706 1,818,034 84 11,973 17,922,774 225 100%US Equity 3,037 6,100,200 330 40 25,455 371 284 762,137 224 3,361 6,887,792 322 38.43%Sector Equity 536 529,654 209 66 43,099 506 301 286,588 164 903 859,341 217 4.79%International Equity 1,422 2,326,626 235 58 20,133 170 397 390,144 57 1,877 2,736,903 188 15.27%Allocation 1,835 3,038,436 193 47 20,707 248 32 8,079 64 1,914 3,067,222 192 17.11%Municipal Bond 578 572,616 270 183 62,326 246 32 16,073 101 793 651,016 248 3.63%Taxable Bond 1,693 3,075,031 312 160 75,639 303 220 253,819 136 2,073 3,404,488 295 19.00%—Nontraditional Bond 139 154,944 101 1 697 697 17 1,048 11 157 156,688 71 0.87%Alternative 561 180,421 49 1 154 154 332 45,303 24 894 225,878 38 1.26%Commodities 45 31,399 109 5 2,844 301 108 55,891 18 158 90,134 35 0.50%Alternative & Nontraditional 700 335,365 53 2 851 425 349 46,351 24 1,051 382,566 41 2.13%Alt Strategies 745 366,764 55 7 3,695 301 457 102,242 21 1,209 472,701 40 2.64%Panel B: Business Development Companies (BDC)
Number of
FundsAUM
Median AUM
All 88 52,294 216
Panel A presents all managed investments in the United States that provided AUM in Morningstar, including Open-Ended Funds, Closed-End funds and Exchange-Traded Funds. Insurance Product Funds are included and Money Market Funds are excluded. Alt Strategies funds include Morningstar category Alternative, Nontraditional Bond funds and commodity funds. See Appedix for the definition of Morningstar US fund categories. Panel B shows business development companies based on EDGAR fi l ings 10-Ks and 10-Qs.
Open-end Closed-end ETF Total

Division of Economic and Risk Analysis 21
Table 2: Growth in assets under management in registered funds by investment category
Number of fund
AUM% of
Industry AUM
Net Flows
Number of fund
AUM% of
Industry AUM
Net Flows
Growth in
number
Annual AUM
Growth Rate
Change in % of
Industry AUM
Annual net flow
Annual net
flow as % AUM
Annual net flow as % of
Industry
All 8,577 10,908,529 100% 553,012 11,573 17,341,434 100% 575,125 2,996 12.29% 0% 513,043 4.05% 100%US Equity 2,756 4,053,996 37.16% -43,758 3,291 6,806,198 39.25% 73,188 535 13.83% 2.08% 8,789 -0.03% 1.71%Sector Equity 696 431,701 3.96% 27,189 883 833,265 4.81% 76,446 187 17.87% 0.85% 51,870 9.59% 10.11%International Equity 1,199 1,739,078 15.94% 94,730 1,764 2,453,046 14.15% 155,867 565 8.98% -1.80% 109,428 5.68% 21.33%Allocation 1,235 1,657,860 15.20% 141,288 1,857 2,978,522 17.18% 109,538 622 15.77% 1.98% 138,841 6.97% 27.06%Municipal Bond 721 513,992 4.71% 12,591 780 645,674 3.72% 32,198 59 5.87% -0.99% 5,995 1.41% 1.17%Taxable Bond 1,418 2,249,571 20.62% 269,983 2,011 3,316,353 19.12% 108,111 593 10.19% -1.50% 171,513 6.72% 33.43%—Nontraditional Bond 39 58,074 0.53% 30,834 138 160,973 0.93% 24,005 99 29.03% 0.40% 24,527 29.18% 4.78%Alternative 455 113,952 1.04% 25,905 831 218,147 1.26% 22,991 376 17.63% 0.21% 30,359 21.49% 5.92%Commodities 97 148,379 1.36% 25,084 156 90,229 0.52% -3,214 59 -11.69% -0.84% -3,750 -2.04% -0.73%Alternative & Nontraditional 494 172,026 1.58% 56,739 969 379,120 2.19% 46,996 475 21.84% 0.61% 54,886 27.80% 10.70%Alt Strategies 591 320,405 2.94% 81,823 1,125 469,349 2.71% 43,782 534 10.01% -0.23% 51,136 13.57% 9.97%
This table shows the growth of different fund categories from the end of 2010 to the end of 2014. The sample includes all managed investments in the United States that provided AUM in Morningstar, including Open-Ended Funds, Closed-End funds and Exchange-Traded Funds. Insurance Product Funds are included and Money Market Funds are excluded. Alt Strategies funds include Morningstar category Alternative, Nontraditional Bond funds and commodity funds.
2010 2014 2010-2014
Division of Economic and Risk Analysis 22
Number of fund / Missing Answer 12,360 2.20% 613 0.65% 11,747 2.28%QuestioPermitted Engaged Permitted Engaged Permitted Engaged Permitted Engaged
Repurchase agreements 70A 91.92% 22.20% 97.89% 32.95% 91.61% 21.63% 6.28% (4.179) 11.32% (1.202)Options on equities 70B 77.33% 5.45% 97.24% 19.16% 76.29% 4.74% 20.95% (10.778) 14.42% (17.033)Options on debt securities 70C 77.07% 1.88% 85.06% 2.76% 76.65% 1.84% 8.42% (2.819) 0.92% (1.569)Options on stock indexes 70D 76.80% 3.98% 96.59% 28.08% 75.76% 2.72% 20.83% (10.563) 25.36% (19.869)Interest rate futures 70E 76.29% 11.80% 88.15% 15.10% 75.67% 11.63% 12.48% (5.238) 3.47% (3.492)Stock index futures 70F 76.27% 12.86% 96.43% 30.68% 75.21% 11.93% 21.22% (10.712) 18.75% (12.54)Options on futures 70G 81.13% 2.48% 96.75% 4.55% 80.31% 2.37% 16.44% (8.881) 2.17% (4.048)Options on index futures 70H 74.63% 0.86% 95.62% 5.03% 73.54% 0.65% 22.08% (10.821) 4.39% (12.47)Other commodity futures 70I 50.72% 1.66% 70.62% 9.58% 49.67% 1.24% 20.94% (7.335) 8.34% (17.187)Restricted securities 70J 90.96% 23.97% 95.45% 12.34% 90.72% 24.58% 4.73% (2.231) -12.24% (-5.851)Inv in otr inv comp shr 70K 94.74% 66.64% 99.19% 58.77% 94.51% 67.06% 4.68% (4.032) -8.29% (-1.215)Securities of foreign issuers 70L 85.09% 56.95% 96.59% 39.77% 84.49% 57.85% 12.10% (7.100) -18.07% (-6.322)Currency exchange transactions 70M 76.54% 34.30% 88.47% 30.52% 75.92% 34.50% 12.56% (5.339) -3.98% (-0.179)Loaning portfolio securities 70N 83.95% 24.43% 94.16% 8.28% 83.42% 25.27% 10.74% (5.611) -17.00% (-8.551)Borrowing money 70O 85.89% 8.40% 93.02% 9.42% 85.52% 8.34% 7.50% (3.413) 1.07% (1.689)Purc/sales by exempted affi l iates 70P 79.64% 17.20% 80.19% 5.03% 79.62% 17.84% 0.58% (-1.628) -12.81% (-7.343)Margin purchases 70Q 27.52% 0.69% 49.03% 4.22% 26.39% 0.51% 22.64% (8.149) 3.71% (0.189)Short sell ing 70R 64.13% 5.25% 93.99% 37.82% 62.56% 3.55% 31.43% (14.125) 34.28% (42.718)
Table 3: Self-reported use of derivatives in form N-SARThis table presents the percent response to questions 70A through 70R of the year ending 2014 N-SAR form for all funds. The question contains information on whether funds are permitted and engaged in certain investment practices with responses being either “yes”, “no”, or no response (missing). Panel A is segmented into All funds, Alternative funds, and Traditional funds. Alternative and Traditional funds are determined based on Morningstar’s classification of Alternative and the fund’s investment strategy (See footnote 18). The last two columns are the difference between the Alternative funds responses and the Traditional funds responses. The value in parenthesis represents the t-test of difference assuming equal variance. Panel B presetns equity funds segmented into investment objective which is determined by the response funds give to question 66 based on whether the fund invests in equity instruments. The six investment objectives are aggressive capital appreciation, capital appreciation, growth, growth and income, income, and total return. Funds that do not invest in equity instruments are not included in this table because the investment objective is conditional on investing in equity instruments. Panel A: All funds, alternative vs. traditional
All funds Alternative Traditional Alternative - Traditional

Division of Economic and Risk Analysis 23
Investment objectiveNumber of fund / Missing Answer 206 0.00% 3,492 0.72% 1,542 0.98% 872 0.70% 307 0.65% 1,817 0.40%
Question Permitted Engaged Permitted Engaged Permitted Engaged Permitted Engaged Permitted Engaged Permitted EngagedRepurchase agreements 70A 99.51% 62.62% 96.39% 21.62% 95.07% 23.09% 87.06% 15.58% 88.27% 13.36% 91.58% 13.15%Options on equities 70B 95.63% 1.94% 90.32% 6.70% 91.63% 5.90% 82.93% 9.74% 74.27% 9.45% 89.54% 8.70%Options on debt securities 70C 68.93% 0% 79.73% 0.60% 84.18% 0.19% 75.49% 0.34% 67.43% 2.28% 81.12% 1.16%Options on stock indexes 70D 96.12% 0.49% 89.52% 3.49% 89.88% 1.75% 81.67% 2.29% 73.62% 7.82% 89.16% 7.04%Interest rate futures 70E 68.45% 0.49% 77.18% 2.26% 77.89% 1.49% 74.00% 5.27% 70.36% 11.07% 84.42% 10.95%Stock index futures 70F 91.75% 29.13% 87.71% 14.26% 89.04% 17.44% 79.50% 16.04% 75.24% 9.77% 88.83% 20.03%Options on futures 70G 90.29% 0% 85.65% 0.92% 87.87% 0.45% 78.12% 0.57% 73.62% 1.30% 87.29% 2.04%Options on index futures 70H 89.81% 0% 85.08% 0.86% 88.07% 0.45% 77.66% 0.46% 73.62% 0.33% 87.84% 1.65%Other commodity futures 70I 43.69% 0.97% 57.93% 1.17% 53.18% 0.52% 49.71% 0.57% 49.19% 0.33% 65.66% 4.68%Restricted securities 70J 96.60% 9.71% 95.25% 14.98% 92.22% 21.60% 85.91% 15.69% 83.71% 23.78% 90.53% 17.06%Inv in otr inv comp shares 70K 97.57% 42.23% 97.37% 72.22% 97.92% 71.98% 96.91% 76.98% 98.70% 80.78% 99.12% 81.29%Securities of foreign issuers 70L 96.60% 42.23% 95.36% 67.64% 95.14% 75.55% 86.14% 57.50% 84.04% 54.72% 90.20% 52.23%Currency exchange transactions 70M 72.82% 30.10% 86.37% 40.23% 88.72% 45.53% 78.01% 33.68% 77.52% 36.16% 88.17% 36.43%Loaning portfolio securities 70N 93.69% 29.13% 90.92% 36.51% 88.78% 32.94% 82.59% 27.38% 77.85% 16.61% 86.52% 24.93%Borrowing money 70O 92.72% 15.53% 89.60% 9.91% 82.36% 6.42% 86.03% 7.67% 80.78% 13.68% 88.88% 8.20%Purc/sales by exempted affi l iates 70P 84.95% 15.53% 79.52% 19.79% 84.57% 17.83% 76.75% 18.33% 73.62% 11.73% 74.74% 9.36%Margin purchases 70Q 7.28% 0% 32.36% 0.92% 30.87% 1.04% 33.68% 0.46% 22.80% 0.33% 27.68% 1.10%Short sell ing 70R 82.04% 9.71% 71.31% 6.07% 71.66% 2.92% 58.19% 1.83% 61.24% 2.61% 70.72% 8.75%
Panel B: Equity funds, by investment objectivesAggressive capital
appreciationCapital
appreciation GrowthGrowth and
income Income Total Return
Division of Economic and Risk Analysis 24
Table 4: Self-reported market value of derivatives in form N-SAR
Question Non-zero
Cond. Average % NAV
Uncond. average as % NAV Non-zero
Cond. Average % NAV
Uncond. average as % NAV Non-zero
Cond. Average % NAV
Uncond. average as % NAV
Cond. Average % NAV
Uncond. average as % NAV
Cash 74A 54.2% 2.2% 1.26% 60.7% 15.7% 11.63% 53.8% 1.5% 0.82% 14.25% (34.33) 10.82% (38.9)Repurchase Agreements 74B 17.5% 8.5% 1.57% 28.7% 28.6% 6.49% 16.9% 7.5% 1.36% 21.08% (13.77) 5.12% (14.29)Other Short Term Debt 74C 30.7% 17.9% 5.87% 29.7% 31.4% 9.59% 30.8% 17.3% 5.72% 14.05% (5.39) 3.87% (4.2)Long Term Debt 74D 30.3% 68.8% 22.29% 18.3% 25.5% 6.10% 30.9% 70.1% 22.96% -44.66% (-13.65) -16.86% (-9.38)Preferred Stock 74E 16.2% 3.9% 0.69% 9.6% 1.6% 0.21% 16.6% 4.0% 0.71% -2.40% (-1.53) -0.50% (-2.01)Common Stock 74F 56.7% 80.5% 48.23% 49.8% 52.8% 30.57% 57.1% 81.6% 48.98% -28.86% (-16.44) -18.42% (-8.62)Options On Equities 74G 3.1% 1.1% 0.04% 16.2% 1.7% 0.37% 2.4% 0.9% 0.02% 0.81% (0.99) 0.35% (5.61)Options On All Futures 74H 1.3% 0.5% 0.01% 2.6% 1.2% 0.04% 1.2% 0.4% 0.01% 0.81% (1.55) 0.04% (3.24)Other Investments 74I 63.8% 27.4% 18.51% 57.3% 33.6% 24.24% 64.1% 27.1% 18.26% 6.51% (2.99) 5.97% (3.66)Portfolio Instruments 74J 52.9% 1.8% 0.98% 38.3% 3.6% 1.69% 53.7% 1.7% 0.95% 1.94% (5.56) 0.74% (4.03)Receivable from Affi l iate 74K 22.8% 0.3% 0.08% 21.8% 0.6% 0.14% 22.9% 0.3% 0.08% 0.27% (0.82) 0.06% (0.78)Other Receivables 74L 91.0% 0.9% 0.85% 80.8% 4.3% 3.89% 91.5% 0.8% 0.72% 3.56% (20.02) 3.17% (19.13)All Other Assets 74M 65.7% 0.9% 0.62% 76.3% 7.7% 6.34% 65.2% 0.5% 0.37% 7.12% (29.96) 5.96% (32.93)Total Assets 74N 95.6% 100.0% 100.0% 90.1% 100.0% 100.00% 95.8% 100.0% 100.0% 0.01% (0.36) 0.01% (0.36)Payables for Portfolio Purchases 74O 57.2% 2.3% 1.39% 40.6% 4.0% 1.92% 58.0% 2.3% 1.37% 1.70% (4.7) 0.55% (2.69)Amounts Owed Affi l iate 74P 87.6% 0.1% 0.12% 78.9% 0.1% 0.11% 88.0% 0.1% 0.12% 0.00% (-0.03) 0.00% (-0.04)Senior Long Term Debt 74Q 1.1% 21.5% 0.25% 0.0% 0.0% 0.00% 1.1% 21.5% 0.26% 0.0% -0.26% (-2.14)Other l iabil ities 74R 92.8% 3.4% 3.31% 89.0% 13.2% 13.08% 93.0% 3.0% 2.90% 10.21% (28.57) 10.18% (28.91)Reverse Repurchase Agreement 74R1 1.3% 11.5% 0.16% 0.6% 2.9% 0.03% 1.3% 11.8% 0.17% -8.81% (-1.35) -0.14% (-1.43)Short Sales 74R2 3.5% 13.6% 0.51% 28.2% 22.4% 8.24% 2.2% 7.7% 0.18% 14.72% (13.3) 8.06% (51.77)Written Options 74R3 6.1% 0.6% 0.04% 20.0% 1.2% 0.33% 5.3% 0.5% 0.03% 0.79% (3.86) 0.31% (11.62)All Other Liabil ities 74R4 92.7% 2.7% 2.61% 88.3% 4.6% 4.55% 92.9% 2.6% 2.53% 2.04% (6.77) 2.02% (6.85)Senior Equity 74S 1.2% 21.9% 0.29% 0.2% 18.8% 0.04% 1.2% 22.0% 0.30% -3.13% -0.26%Net Assets Shareholders 74T 95.5% 94.7% 94.68% 90.1% 85.0% 84.98% 95.8% 95.2% 95.09% -10.18% (-23.15) -10.12% (-22.31)Value Segregated Accounts 74Y 25.4% 22.3% 6.01% 60.7% 29.6% 19.04% 23.5% 21.5% 5.45% 8.05% (0.88) 13.59% (3.68)
This table contains information on the condensed balance sheet of funds based on the responses to questions 74A through 74Y of the year ending 2014 N-SAR form for all funds. The Non-zero represents the percentage of funds that provided a value greater than zero. The “average as % NAV” is conditional on funds having a value greater than zero. Finally, the “unconditional average as a % of NAV” includes funds who gave a value of zero but excludes funds that didn’t provide a value (missing). Due to textual size l imits, funds cannot enter any values greater than 99999999 and will therefore default to 99999999. To correct these errors, the actual values were inputted from the annual reports prior to the N-SAR submission. Also, extreme outliers were compared to the annual statements to ensure the integrity of the data and were corrected when values were significantly different. The last two columns are the difference between the Alternative funds and the Traditional funds with the value in parenthesis representing the t-test of difference assuming equal variance. Panel A is segmented into All funds, Alternative funds, and Traditional funds. Alternative and Traditional funds are determined based on Morningstar’s classification of Alternative and the fund’s investment strategy (See footnote 18). Panel B presents equity funds segmented into investment objective which is determined by the response funds give to question 66 based on whether the fund invests in equity instruments. The six investment objectives are aggressive capital appreciation, capital appreciation, growth, growth and income, income, and total return. Funds that do not invest in equity instruments are not included in this table because the investment objective is conditional Panel A: All funds, Nontraditional vs. traditional
All Alternative Traditional Alternative - Traditional

Division of Economic and Risk Analysis 25
QuestionNon-zero
Cond. Average % NAV
Uncond. average as % NAV
Non-zero
Cond. Average % NAV
Uncond. average as % NAV
Non-zero
Cond. Average % NAV
Uncond. average as % NAV
Non-zero
Cond. Average % NAV
Uncond. average as % NAV
Non-zero
Cond. Average % NAV
Uncond. average as % NAV
Non-zero
Cond. Average % NAV
Uncond. average as % NAV
Cash 74A 50.0% 5.2% 3.17% 49.2% 2.3% 1.19% 50.4% 1.0% 0.51% 47.9% 0.8% 0.40% 53.7% 1.4% 0.80% 52.6% 4.7% 2.59%Repurchase Agreements 74B 36.4% 31.0% 14.25% 17.0% 4.5% 0.82% 17.3% 3.2% 0.57% 10.9% 2.3% 0.28% 11.1% 2.3% 0.26% 9.9% 3.4% 0.36%Other Short Term Debt 74C 13.6% 12.5% 2.11% 20.8% 5.6% 1.25% 29.2% 4.4% 1.32% 29.2% 4.3% 1.35% 23.5% 18.9% 4.67% 26.5% 10.1% 2.86%Long Term Debt 74D 1.9% 7.9% 0.19% 6.6% 13.0% 0.90% 7.5% 12.6% 0.98% 17.4% 22.6% 4.12% 35.8% 32.2% 11.98% 20.9% 27.1% 6.03%Preferred Stock 74E 11.2% 2.4% 0.34% 16.6% 2.4% 0.42% 18.9% 1.8% 0.36% 16.6% 8.2% 1.45% 32.6% 19.1% 6.48% 15.9% 4.8% 0.82%Common Stock 74F 69.4% 78.7% 67.02% 84.9% 89.4% 78.88% 87.0% 92.3% 82.21% 78.9% 86.3% 69.74% 55.4% 63.7% 36.35% 56.2% 76.5% 45.11%Options On Equities 74G 1.0% 0.4% 0.00% 3.6% 2.3% 0.09% 2.2% 0.5% 0.01% 1.9% 0.2% 0.00% 5.2% 0.3% 0.02% 5.9% 0.7% 0.04%Options On All Futures 74H 0.5% 0.4% 0.00% 0.3% 1.4% 0.00% 0.3% 0.2% 0.00% 0.1% 0.0% 0.00% 0.0% 0.0% 0.00% 1.8% 0.7% 0.01%Other Investments 74I 46.1% 16.2% 9.14% 70.8% 20.0% 14.72% 64.3% 19.6% 13.04% 64.4% 33.1% 22.19% 72.3% 51.0% 37.99% 80.6% 47.2% 39.94%Portfolio Instruments 74J 41.7% 2.1% 1.07% 57.4% 1.8% 1.05% 61.6% 0.9% 0.58% 52.5% 0.8% 0.46% 53.1% 1.2% 0.64% 48.9% 1.7% 0.86%Receivalbe from Affi l iate 74K 5.8% 0.1% 0.00% 22.9% 0.4% 0.11% 23.2% 0.4% 0.09% 25.3% 0.4% 0.11% 25.4% 0.2% 0.05% 23.8% 0.2% 0.04%Other Receivables 74L 80.1% 2.8% 2.79% 92.0% 0.6% 0.57% 95.3% 0.5% 0.48% 94.4% 0.4% 0.41% 85.3% 1.2% 1.01% 88.8% 1.2% 1.13%All Other Assets 74M 50.0% 0.6% 0.38% 69.2% 0.9% 0.65% 70.0% 0.5% 0.36% 62.0% 0.2% 0.15% 63.2% 0.5% 0.33% 56.4% 1.8% 1.09%Total Assets 74N 81.6% 100.0% 100.00% 96.7% 100.0% 100.00% 97.9% 100.0% 100.0% 97.7% 100.0% 100.0% 97.4% 100.0% 100.00% 96.0% 100.0% 100.00%Payables for Portfolio Purchases 74O 41.3% 2.0% 1.00% 58.0% 1.4% 0.87% 65.8% 0.9% 0.64% 59.9% 1.0% 0.62% 51.8% 2.1% 1.10% 56.6% 2.1% 1.24%Amounts Owed Affi l iate 74P 78.2% 0.1% 0.09% 88.7% 0.1% 0.13% 94.1% 0.1% 0.07% 91.9% 0.2% 0.16% 86.0% 0.1% 0.06% 83.5% 0.1% 0.09%Senior Long Term Debt 74Q 0.0% 0.0% 0.00% 0.0% 15.3% 0.00% 0.2% 2.1% 0.00% 0.9% 20.2% 0.20% 5.2% 25.4% 1.39% 1.3% 19.8% 0.28%Other l iabil ities 74R 77.2% 4.0% 3.94% 91.4% 3.6% 3.52% 92.6% 2.4% 2.31% 92.3% 1.9% 1.89% 87.9% 3.4% 3.19% 89.0% 4.3% 4.07%Reverse Repurchase Agreement 74R1 0.0% 0.0% 0.00% 0.1% 2.3% 0.00% 0.0% 0.0% 0.00% 0.2% 25.7% 0.06% 0.7% 16.3% 0.11% 0.7% 9.7% 0.07%Short Sales 74R2 1.5% 9.1% 0.17% 4.7% 19.3% 0.97% 2.2% 19.3% 0.45% 0.8% 9.8% 0.08% 2.6% 10.9% 0.29% 5.4% 12.0% 0.69%Written Options 74R3 1.0% 0.3% 0.00% 3.9% 1.2% 0.05% 4.0% 0.3% 0.01% 7.8% 0.9% 0.07% 11.7% 0.8% 0.10% 8.6% 0.7% 0.06%All Other Liabil ities 74R4 81.1% 3.9% 3.91% 94.6% 2.6% 2.50% 95.3% 2.0% 1.91% 94.3% 1.7% 1.66% 89.6% 3.0% 2.74% 91.1% 3.4% 3.26%Senior Equity 74S 0.0% 0.0% 0.00% 0.1% 11.2% 0.01% 0.2% 15.8% 0.03% 0.7% 8.2% 0.06% 1.3% 11.2% 0.15% 0.8% 13.8% 0.11%Net Assets Shareholders 74T 81.6% 94.8% 94.83% 96.6% 95.6% 95.50% 97.8% 97.0% 96.92% 97.7% 97.0% 97.01% 97.4% 94.1% 94.10% 96.0% 94.2% 94.24%Value Segregated Accounts 74Y 39.8% 11.9% 5.81% 16.1% 14.9% 2.54% 19.6% 23.3% 4.79% 22.6% 17.9% 4.22% 23.1% 29.3% 7.07% 27.1% 25.4% 7.32%
Panel B: Equity funds, by investment objectivesAggressive capital appreciation Capital appreciation Growth Growth and income Income Total Return

Division of Economic and R
Table 5: Summary of derivatives holdings
Notional of Derivatives (as % of NAV) % non-zero mean std mean std min q1 median q3 maxNAV (M) (Number of funds: 1,188) 100% 1,390 4,964 1,390 4,964 0 54 231 978 96,793 Currency Futures 1.01% 0.56 8.81 55.85 70.76 0.10 6.46 25.49 87.56 200.18Interest Rate Futures 10.69% 4.05 27.24 37.88 75.50 0.05 4.66 15.30 39.56 528.85Equity Futures 11.87% 1.88 10.94 15.85 28.13 0.01 1.23 4.15 18.92 199.78Commodity Futures 1.26% 0.74 8.95 58.32 56.53 1.37 14.58 28.76 105.91 186.70Currency Swaps 0.34% 0.25 8.16 73.48 138.36 0.79 1.53 6.10 145.43 280.93Interest rate swaps (Cleared/exch-trd ) 4.38% 1.43 11.19 32.77 43.23 0.11 3.81 16.83 39.09 197.98Interest rate swaps (OTC) 4.04% 1.52 15.17 37.61 66.54 0.08 2.18 8.18 43.19 293.87CDS (Cleared) 3.11% 0.41 4.66 13.31 23.23 0.06 0.75 4.76 9.86 93.63CDS (OTC) 4.04% 0.36 3.66 8.81 16.21 0.02 0.70 2.90 8.60 75.39Equity swaps 4.88% 3.40 23.41 69.61 81.99 0.00 2.61 32.00 112.55 283.12Commodity swaps 0.34% 0.07 1.43 21.72 13.37 10.17 11.15 18.92 32.30 38.89Currency forwards 12.96% 3.33 20.16 25.67 50.74 0.00 1.84 9.71 24.51 356.36Written Currency Option 1.52% 0.13 3.10 8.85 24.25 0.01 0.35 2.11 5.70 104.92Written interest rate option (Cleared/exch-trd ) 1.60% 0.22 2.50 13.50 14.95 0.56 4.21 10.75 15.26 60.78Written interest rate option (OTC) 2.10% 0.30 2.83 14.35 13.66 0.05 4.55 11.09 16.92 52.16Written CDS option (Cleared) 0.08% 0.01 0.22 7.42 7.42 7.42 7.42 7.42 7.42Written CDS option (OTC) 0.76% 0.09 2.17 12.03 23.15 0.29 2.46 3.54 9.80 73.00Written equity option 4.71% 1.39 10.99 29.40 42.04 0.00 1.75 12.86 43.71 204.79Written Commodity option 0.17% 0.01 0.43 7.57 10.39 0.23 0.23 7.57 14.92 14.92Purchased Currency option 1.09% 0.15 2.14 14.01 15.58 0.53 5.19 8.13 19.74 52.96Purchased interest rate option (Cleared/exch-trd ) 1.35% 0.28 3.80 21.05 26.03 2.76 5.51 9.46 21.90 82.31Purchased interest rate option (OTC) 0.51% 0.07 1.18 14.42 9.10 0.14 9.40 15.89 21.68 23.54Purchased CDS option (Cleared) 0.08% 0.26 8.81 303.54 303.54 303.54 303.54 303.54 303.54Purchased CDS option (OTC) 0.08% 0.03 1.12 38.49 38.49 38.49 38.49 38.49 38.49Purchased equity option 2.78% 0.80 7.55 28.95 35.68 0.05 3.59 11.51 48.22 143.44Purchased Commodity option 0.17% 0.09 2.37 52.12 35.05 27.34 27.34 52.12 76.90 76.90Purchased Currency swaption 0.00% 0.00 0.00Purchased interest rate swaption (Cleared/exch-trd) 0.59% 0.06 1.14 10.89 10.96 0.93 1.61 7.10 19.32 29.89Purchased interest rate swaption (OTC) 1.52% 0.28 3.80 18.67 25.40 0.02 1.64 5.65 28.03 84.62Purchased CDS swaption (Cleared) 0.08% 0.00 0.14 4.90 4.90 4.90 4.90 4.90 4.90Purchased CDS swaption (OTC) 0.17% 0.01 0.38 7.86 7.11 2.83 2.83 7.86 12.89 12.89Purchased equity swaption 0.00% 0.00 0.00Purchased Commodity swaption 0.00% 0.00 0.00Reverse repo 1.60% 0.22 2.60 13.88 15.64 0.01 2.10 7.86 23.79 46.95Short sale 4.71% 0.96 6.81 20.42 24.41 0.00 1.26 7.10 33.62 95.34Commitment agreements 0.34% 0.02 0.53 4.78 9.01 0.13 0.24 0.35 9.33 18.30Unfunded commitments 1.35% 0.08 1.57 6.22 12.43 0.00 0.15 1.56 6.60 49.47When issued securities 1.68% 0.11 2.29 6.25 16.91 0.02 0.36 1.18 4.45 76.79TBA 0.93% 0.11 2.40 11.88 22.96 0.00 0.01 0.90 10.56 66.11Other financing 0.51% 0.06 1.28 12.27 14.46 0.73 3.76 4.25 24.92 35.75Bank borrowings 4.21% 0.71 5.30 16.91 20.00 0.00 0.03 4.96 35.25 70.02Margin loans 0.00% 0.00 0.00Senior debt issuances 1.43% 0.32 3.88 22.69 24.03 0.07 4.98 18.80 26.93 72.95Preferred shares 1.18% 0.53 4.96 44.93 10.08 21.80 41.62 48.23 50.71 57.53Securities lending collateral 21.21% 1.77 9.14 8.33 18.44 0.00 1.07 3.28 8.94 196.11
Unconditional Conditional
This table shows the summary statistics on the notional value of derivatives (as percentages of NAV) held by registered funds. The sample consists of 1,188 funds, 10% random sample of the universe of all open-end funds, closed-end funds, ETFs and BDCs registered under the 1940 Act as of April 2015. We exclude money marke funds from our sample. We collected their usage of derivatives, financing transactions and other senior securities from their latest N-CSRs at EDGAR. Notional amount of long and short positions are summed unless noted otherwise. Exact offsetting positons are netted out.

Division of Economic and Risk Analysis 27
Table 6: Derivatives holdings by underlying assets and instruments
Panel A: All funds
Notional of Derivatives (as % of NAV) % non-zero mean std mean std min q1 median q3 maxNAV (M) (Number of funds: 1,188) 100% 1,390 4,964 1,390 4,964 0 54 231 978 96,793 Currency 13.89% 4.27 24.15 30.76 58.33 0.00 1.84 10.24 28.07 356.36Interest rate 13.47% 7.52 37.32 55.84 87.65 0.05 5.87 20.44 74.06 528.85 Interest rate (Cleared/exch-trd ) 12.12% 5.70 32.06 47.02 81.08 0.05 5.40 18.70 56.12 528.85 Interest rate (OTC) 4.88% 1.82 15.61 37.31 61.04 0.08 3.17 12.83 42.59 293.87CDS 5.39% 0.87 6.66 16.12 24.21 0.02 0.90 5.05 20.83 93.63 CDS (Cleared) 3.11% 0.42 4.67 13.51 23.16 0.06 0.75 5.03 9.86 93.63 CDS (OTC) 4.04% 0.45 4.56 11.07 20.11 0.02 0.71 3.79 9.75 85.19Equity 17.76% 6.67 29.12 37.53 60.25 0.00 1.44 8.30 44.46 283.12Commodity 1.43% 0.82 9.23 57.46 53.49 0.23 14.80 54.47 98.91 186.70Futures 20.54% 7.23 39.82 35.21 82.21 0.01 2.78 11.57 32.79 859.31Swaps 12.12% 7.44 33.02 61.41 75.58 0.00 4.65 30.76 91.26 293.87Forwards 12.96% 3.33 20.16 25.67 50.74 0.00 1.84 9.71 24.51 356.36Written option 7.32% 2.15 14.25 29.33 44.69 0.00 2.91 14.62 41.77 320.46Purchased option 5.22% 1.69 12.71 32.37 46.21 0.05 6.02 15.65 38.49 303.54Purchased swaption 2.19% 0.36 4.01 16.66 21.94 0.02 1.64 6.24 20.95 84.62Gross notional of derivatives 32.24% 20.15 67.80 62.50 107.84 0.00 3.56 20.13 79.35 961.98Financing 9.93% 1.56 8.33 15.72 21.89 0.00 0.90 4.18 24.21 95.34Senior security 5.47% 1.57 8.76 28.62 25.24 0.00 0.12 31.34 52.17 80.77Aggregate exposure incl. financing 36.36% 21.71 68.50 59.71 103.19 0.00 3.11 20.51 75.16 961.98Aggregate exposure incl. financing & Senior Sec 37.96% 23.28 68.81 61.32 100.76 0.00 3.59 27.16 76.67 961.98
This table shows the notional value of derivatives (as percentages of NAV) held by mutual funds. The notional values are aggregated by derivative references and instrument types. The sample consists of 10% random sample of the universe of all open-end funds, closed-end funds, ETFs and BDCs registered under the 1940 Act as of April 2015. We exclude money marke funds from our sample. We group Morningstar category "Alternative", "Nontraditional bond" and "Commodities" as Alt Strategies funds. We further group them into non-index and index funds. Those funds that do not fall within the Alt Strategies funds are called Traditional funds. Gross notional of derivatives is the sum of notional amount of derivatives that create potential future obligations, i .e. excluding purchased options.
Unconditional Conditional
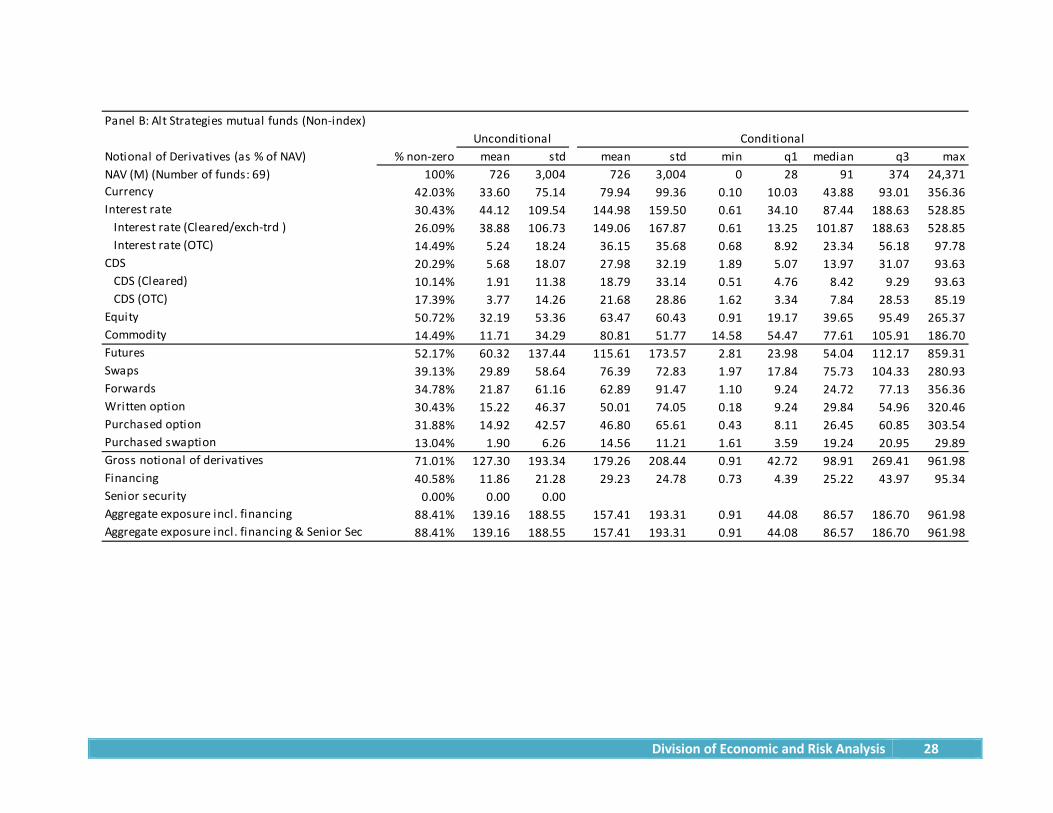
Division of Economic and Risk Analysis 28
Panel B: Alt Strategies mutual funds (Non-index)
Notional of Derivatives (as % of NAV) % non-zero mean std mean std min q1 median q3 maxNAV (M) (Number of funds: 69) 100% 726 3,004 726 3,004 0 28 91 374 24,371 Currency 42.03% 33.60 75.14 79.94 99.36 0.10 10.03 43.88 93.01 356.36Interest rate 30.43% 44.12 109.54 144.98 159.50 0.61 34.10 87.44 188.63 528.85 Interest rate (Cleared/exch-trd ) 26.09% 38.88 106.73 149.06 167.87 0.61 13.25 101.87 188.63 528.85 Interest rate (OTC) 14.49% 5.24 18.24 36.15 35.68 0.68 8.92 23.34 56.18 97.78CDS 20.29% 5.68 18.07 27.98 32.19 1.89 5.07 13.97 31.07 93.63 CDS (Cleared) 10.14% 1.91 11.38 18.79 33.14 0.51 4.76 8.42 9.29 93.63 CDS (OTC) 17.39% 3.77 14.26 21.68 28.86 1.62 3.34 7.84 28.53 85.19Equity 50.72% 32.19 53.36 63.47 60.43 0.91 19.17 39.65 95.49 265.37Commodity 14.49% 11.71 34.29 80.81 51.77 14.58 54.47 77.61 105.91 186.70Futures 52.17% 60.32 137.44 115.61 173.57 2.81 23.98 54.04 112.17 859.31Swaps 39.13% 29.89 58.64 76.39 72.83 1.97 17.84 75.73 104.33 280.93Forwards 34.78% 21.87 61.16 62.89 91.47 1.10 9.24 24.72 77.13 356.36Written option 30.43% 15.22 46.37 50.01 74.05 0.18 9.24 29.84 54.96 320.46Purchased option 31.88% 14.92 42.57 46.80 65.61 0.43 8.11 26.45 60.85 303.54Purchased swaption 13.04% 1.90 6.26 14.56 11.21 1.61 3.59 19.24 20.95 29.89Gross notional of derivatives 71.01% 127.30 193.34 179.26 208.44 0.91 42.72 98.91 269.41 961.98Financing 40.58% 11.86 21.28 29.23 24.78 0.73 4.39 25.22 43.97 95.34Senior security 0.00% 0.00 0.00Aggregate exposure incl. financing 88.41% 139.16 188.55 157.41 193.31 0.91 44.08 86.57 186.70 961.98Aggregate exposure incl. financing & Senior Sec 88.41% 139.16 188.55 157.41 193.31 0.91 44.08 86.57 186.70 961.98
Unconditional Conditional

Division of Economic and Risk Analysis 29
Panel C: Alt Strategies mutual funds (Index)
Notional of Derivatives (as % of NAV) % non-zero mean std mean std min q1 median q3 maxNAV (M) (Number of funds: 12) 100% 26 22 26 22 0 6 26 39 64 Currency 8.33% 2.81 9.73 33.70 33.70 33.70 33.70 33.70 33.70Interest rate 8.33% 2.65 9.19 31.84 31.84 31.84 31.84 31.84 31.84 Interest rate (Cleared/exch-trd ) 8.33% 2.65 9.19 31.84 31.84 31.84 31.84 31.84 31.84 Interest rate (OTC) 0.00% 0.00 0.00CDS 0.00% 0.00 0.00 CDS (Cleared) 0.00% 0.00 0.00 CDS (OTC) 0.00% 0.00 0.00Equity 58.33% 81.35 84.62 139.46 60.62 70.34 70.63 136.06 199.83 200.16Commodity 8.33% 1.23 4.27 14.80 14.80 14.80 14.80 14.80 14.80Futures 41.67% 8.64 11.40 20.74 6.61 14.80 17.43 18.44 21.20 31.84Swaps 58.33% 76.59 81.17 131.30 60.82 70.34 70.63 114.85 199.83 200.16Forwards 8.33% 2.81 9.73 33.70 33.70 33.70 33.70 33.70 33.70Written option 0.00% 0.00 0.00Purchased option 0.00% 0.00 0.00Purchased swaption 0.00% 0.00 0.00Gross notional of derivatives 83.33% 88.04 78.35 105.65 73.73 14.80 33.70 85.14 199.52 200.16Financing 8.33% 4.76 16.48 57.08 57.08 57.08 57.08 57.08 57.08Senior security 8.33% 0.00 0.00 0.00 0.00 0.00 0.00 0.00 0.00Aggregate exposure incl. financing 83.33% 92.80 76.34 111.36 69.47 14.80 70.34 94.28 199.52 200.16Aggregate exposure incl. financing & Senior Sec 83.33% 92.80 76.34 111.36 69.47 14.80 70.34 94.28 199.52 200.16
Unconditional Conditional

Division of Economic and Risk Analysis 30
Panel D: Alt Strategies mutual funds (All)
Notional of Derivatives (as % of NAV) % non-zero mean std mean std min q1 median q3 maxNAV (M) (Number of funds: 81) 100% 623 2,781 623 2,781 0 25 61 275 24,371 Currency 37.04% 29.04 70.23 78.40 98.00 0.10 10.03 43.18 93.01 356.36Interest rate 27.16% 37.98 102.13 139.83 157.52 0.61 31.84 87.32 188.63 528.85 Interest rate (Cleared/exch-trd ) 23.46% 33.52 99.31 142.89 165.34 0.61 13.25 87.21 188.63 528.85 Interest rate (OTC) 12.35% 4.46 16.92 36.15 35.68 0.68 8.92 23.34 56.18 97.78CDS 17.28% 4.84 16.78 27.98 32.19 1.89 5.07 13.97 31.07 93.63 CDS (Cleared) 8.64% 1.62 10.52 18.79 33.14 0.51 4.76 8.42 9.29 93.63 CDS (OTC) 14.81% 3.21 13.21 21.68 28.86 1.62 3.34 7.84 28.53 85.19Equity 51.85% 39.48 60.94 76.13 66.24 0.91 23.98 59.71 99.65 265.37Commodity 13.58% 10.16 31.87 74.81 52.99 14.58 14.92 60.06 105.91 186.70Futures 50.62% 52.66 128.13 104.04 165.39 2.81 22.43 39.59 104.74 859.31Swaps 41.98% 36.81 64.09 87.70 73.21 1.97 29.98 81.40 116.54 280.93Forwards 30.86% 19.05 56.91 61.72 89.73 1.10 10.45 26.97 74.05 356.36Written option 25.93% 12.96 43.09 50.01 74.05 0.18 9.24 29.84 54.96 320.46Purchased option 27.16% 12.71 39.61 46.80 65.61 0.43 8.11 26.45 60.85 303.54Purchased swaption 11.11% 1.62 5.81 14.56 11.21 1.61 3.59 19.24 20.95 29.89Gross notional of derivatives 72.84% 121.49 181.15 166.79 193.84 0.91 40.76 98.91 227.94 961.98Financing 35.80% 10.81 20.70 30.19 24.88 0.73 4.45 25.40 44.08 95.34Senior security 1.23% 0.00 0.00 0.00 0.00 0.00 0.00 0.00 0.00Aggregate exposure incl. financing 87.65% 132.29 176.90 150.93 181.42 0.91 44.08 88.92 199.52 961.98Aggregate exposure incl. financing & Senior Sec 87.65% 132.29 176.90 150.93 181.42 0.91 44.08 88.92 199.52 961.98
Unconditional Conditional

Division of Economic and Risk Analysis 31
Panel E: Traditional mutual funds
Notional of Derivatives (as % of NAV) % non-zero mean std mean std min q1 median q3 maxNAV (M) (Number of funds: 899) 100% 1,537 5,361 1,537 5,361 0 67 271 1,205 96,793 Currency 12.57% 2.09 10.90 16.60 26.64 0.00 1.51 7.82 21.41 200.18Interest rate 13.68% 5.34 24.26 39.00 54.85 0.05 4.98 18.68 56.29 330.19 Interest rate (Cleared/exch-trd ) 12.57% 4.32 19.97 34.38 46.42 0.05 4.69 17.02 51.76 288.42 Interest rate (OTC) 4.78% 1.01 8.17 21.22 31.44 0.08 2.76 9.13 32.13 147.27CDS 5.23% 0.70 5.65 13.47 21.15 0.02 0.62 4.73 20.64 83.80 CDS (Cleared) 3.23% 0.41 4.33 12.58 21.04 0.06 0.74 2.81 13.56 83.80 CDS (OTC) 3.78% 0.30 3.34 7.89 15.54 0.02 0.39 2.44 8.61 80.90Equity 14.57% 1.98 12.30 13.56 29.77 0.00 0.88 3.02 11.97 199.78Commodity 0.56% 0.05 1.05 9.56 11.65 0.23 1.37 2.15 18.62 25.42Futures 19.58% 4.39 20.19 22.40 41.05 0.05 2.19 6.75 28.14 399.96Swaps 9.34% 3.08 17.51 32.94 48.17 0.00 2.11 13.93 43.24 217.05Forwards 11.90% 1.74 8.42 14.59 20.27 0.00 1.51 7.31 20.28 112.62Written option 5.67% 0.96 7.33 16.86 26.28 0.00 2.15 7.42 19.23 141.09Purchased option 4.23% 1.05 7.82 24.78 29.66 0.05 5.19 12.05 32.42 143.44Purchased swaption 1.78% 0.30 4.13 16.97 26.83 0.02 1.15 3.89 17.78 84.62Gross notional of derivatives 28.59% 10.15 35.87 35.52 60.07 0.00 2.59 10.21 39.01 399.96Financing 6.56% 0.53 4.37 8.05 15.31 0.00 0.48 1.80 9.49 76.79Senior security 2.00% 0.00 0.01 0.06 0.08 0.00 0.01 0.03 0.10 0.32Aggregate exposure incl. financing 30.48% 10.68 36.53 35.05 59.43 0.00 1.99 10.18 38.43 399.96Aggregate exposure incl. financing & Senior Sec 31.37% 10.68 36.53 34.06 58.87 0.00 1.69 8.99 36.14 399.96
Unconditional Conditional

Division of Economic and Risk Analysis 32
Panel F: Open-end funds (All)
Notional of Derivatives (as % of NAV) % non-zero mean std mean std min q1 median q3 maxNAV (M) (Number of funds: 980) 100% 1,462 5,202 1,462 5,202 0 58 241 1,081 96,793 Currency 14.59% 4.31 23.82 29.56 56.20 0.00 1.84 10.31 28.07 356.36Interest rate 14.80% 8.03 38.38 54.30 86.52 0.05 5.87 22.25 71.51 528.85 Interest rate (Cleared/exch-trd ) 13.47% 6.73 35.16 50.00 84.03 0.05 5.40 19.88 57.68 528.85 Interest rate (OTC) 5.41% 1.30 9.25 24.04 32.46 0.08 2.91 10.24 36.47 147.27CDS 6.22% 1.05 7.32 16.80 24.60 0.02 0.75 6.83 21.02 93.63 CDS (Cleared) 3.67% 0.51 5.13 13.79 23.43 0.06 0.74 5.69 11.71 93.63 CDS (OTC) 4.69% 0.54 5.01 11.49 20.45 0.02 0.70 4.12 10.70 85.19Equity 17.65% 5.08 23.43 28.75 49.39 0.00 1.38 5.20 32.42 265.37Commodity 1.63% 0.89 9.58 54.42 53.70 0.23 14.69 39.95 97.03 186.70Futures 22.14% 8.38 43.50 37.82 86.35 0.05 2.98 13.01 36.14 859.31Swaps 12.04% 5.87 26.52 48.71 61.47 0.00 4.01 28.69 72.77 280.93Forwards 13.47% 3.17 18.77 23.51 46.38 0.00 1.92 9.52 24.46 356.36Written option 7.35% 1.95 14.56 26.53 47.55 0.00 2.55 10.42 30.09 320.46Purchased option 6.12% 2.01 13.95 32.85 46.89 0.05 5.62 15.65 43.36 303.54Purchased swaption 2.55% 0.41 4.31 16.10 22.21 0.02 1.64 5.38 19.41 84.62Gross notional of derivatives 32.24% 19.36 69.30 60.03 111.70 0.00 3.37 17.87 65.98 961.98Financing 8.98% 1.38 7.78 15.34 21.56 0.00 0.89 4.14 24.62 95.34Senior security 1.94% 0.00 0.01 0.06 0.08 0.00 0.01 0.02 0.10 0.32Aggregate exposure incl. financing 35.20% 20.73 70.03 58.90 108.17 0.00 3.25 18.68 70.34 961.98Aggregate exposure incl. financing & Senior Sec 36.02% 20.74 70.03 57.57 107.30 0.00 2.85 17.22 67.63 961.98
Unconditional Conditional

Division of Economic and Risk Analysis 33
Panel G: Closed-end funds
Notional of Derivatives (as % of NAV) % non-zero mean std mean std min q1 median q3 maxNAV (M) (Number of funds: 58) 100% 430 524 430 524 5 137 261 456 3,198 Currency 18.97% 1.53 3.92 8.07 5.44 0.43 3.27 9.88 10.36 18.86Interest rate 17.24% 3.54 11.65 20.55 21.71 4.97 9.15 14.65 20.49 79.00 Interest rate (Cleared/exch-trd ) 17.24% 2.83 7.45 16.39 10.21 4.97 9.15 14.65 20.49 37.41 Interest rate (OTC) 1.72% 0.72 5.46 41.59 41.59 41.59 41.59 41.59 41.59CDS 5.17% 0.11 0.54 2.17 1.26 1.27 1.27 1.63 3.61 3.61 CDS (Cleared) 1.72% 0.06 0.47 3.61 3.61 3.61 3.61 3.61 3.61 CDS (OTC) 3.45% 0.05 0.27 1.45 0.25 1.27 1.27 1.45 1.63 1.63Equity 22.41% 8.96 20.86 39.97 26.91 1.78 25.59 42.01 48.66 91.22Commodity 0.00% 0.00 0.00Futures 15.52% 1.64 4.41 10.59 5.65 2.02 5.61 12.15 14.00 19.74Swaps 12.07% 1.56 5.55 12.92 11.01 0.95 1.27 16.00 20.49 28.85Forwards 18.97% 1.53 3.92 8.07 5.44 0.43 3.27 9.88 10.36 18.86Written option 22.41% 9.41 21.18 41.99 25.46 0.83 25.83 42.01 48.66 91.22Purchased option 1.72% 0.19 1.45 11.03 11.03 11.03 11.03 11.03 11.03Purchased swaption 1.72% 0.53 4.01 30.52 30.52 30.52 30.52 30.52 30.52Gross notional of derivatives 46.55% 14.15 23.26 30.39 25.95 0.43 9.90 22.03 46.92 91.22Financing 34.48% 4.18 11.52 12.11 17.24 0.07 0.22 1.65 23.16 46.95Senior security 65.52% 24.74 24.07 37.76 19.69 0.02 24.22 41.12 53.28 66.42Aggregate exposure incl. financing 67.24% 18.32 26.69 27.25 28.62 0.07 2.02 21.07 45.30 124.78Aggregate exposure incl. financing & Senior Sec 86.21% 43.06 28.59 49.95 24.48 0.20 41.43 52.17 63.46 124.78
Unconditional Conditional

Division of Economic and Risk Analysis 34
Panel H: Alt Strategies ETFs
Notional of Derivatives (as % of NAV) % non-zero mean std mean std min q1 median q3 maxNAV (M) (Number of funds: 22) 100% 197 369 197 369 3 7 55 176 1,626 Currency 9.09% 6.04 22.21 66.39 48.44 32.13 32.13 66.39 100.64 100.64Interest rate 18.18% 38.70 90.97 212.84 92.23 132.90 132.97 212.29 292.71 293.87 Interest rate (Cleared/exch-trd ) 4.55% 0.13 0.60 2.82 2.82 2.82 2.82 2.82 2.82 Interest rate (OTC) 18.18% 38.57 90.83 212.13 93.05 130.08 131.56 212.29 292.71 293.87CDS 0.00% 0.00 0.00 CDS (Cleared) 0.00% 0.00 0.00 CDS (OTC) 0.00% 0.00 0.00Equity 68.18% 103.10 102.53 151.22 89.29 15.99 53.12 199.88 200.49 283.12Commodity 4.55% 4.83 22.64 106.18 106.18 106.18 106.18 106.18 106.18Futures 36.36% 8.11 22.65 22.30 34.32 2.82 5.93 12.45 16.31 106.18Swaps 81.82% 136.11 104.25 166.35 89.98 15.99 106.45 191.60 207.32 293.87Forwards 9.09% 6.04 22.21 66.39 48.44 32.13 32.13 66.39 100.64 100.64Written option 4.55% 2.41 11.32 53.12 53.12 53.12 53.12 53.12 53.12Purchased option 4.55% 1.13 5.31 24.91 24.91 24.91 24.91 24.91 24.91Purchased swaption 0.00% 0.00 0.00Gross notional of derivatives 95.45% 152.66 90.91 159.93 86.35 15.99 106.18 133.04 200.49 293.87Financing 4.55% 4.04 18.96 88.94 88.94 88.94 88.94 88.94 88.94Senior security 0.00% 0.00 0.00Aggregate exposure incl. financing 95.45% 156.71 86.67 164.17 81.25 15.99 110.35 133.04 200.49 293.87Aggregate exposure incl. financing & Senior Sec 95.45% 156.71 86.67 164.17 81.25 15.99 110.35 133.04 200.49 293.87
Unconditional Conditional
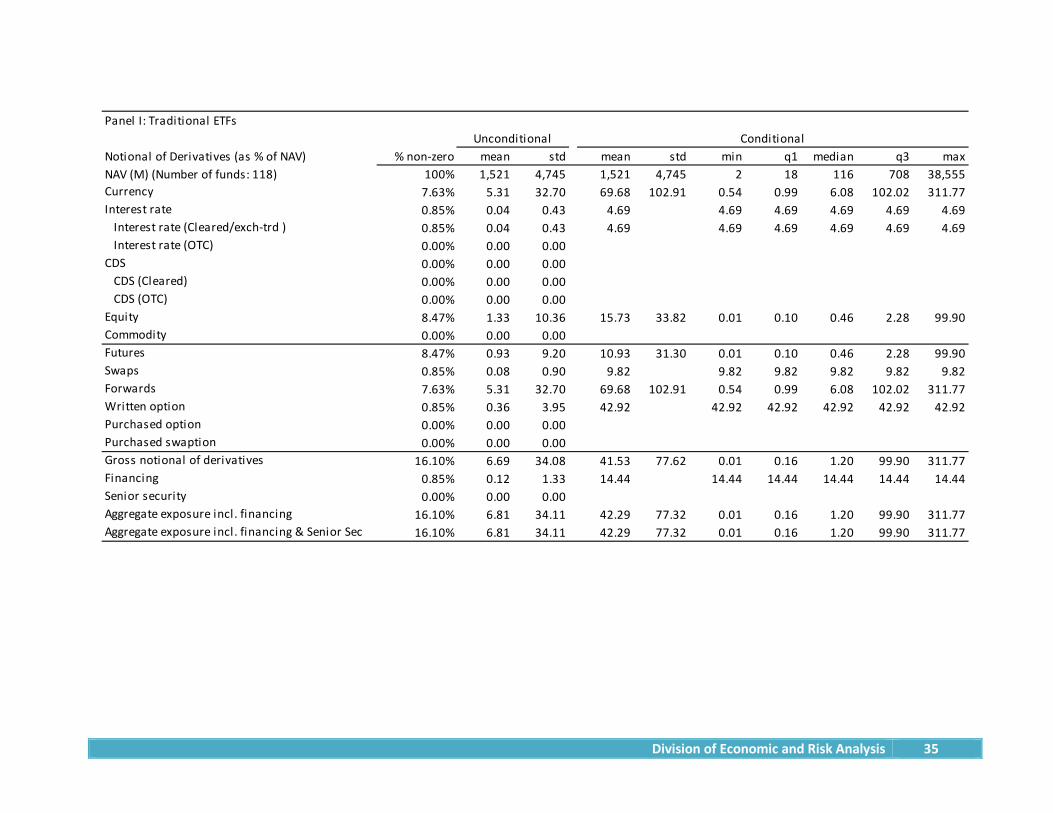
Division of Economic and Risk Analysis 35
Panel I: Traditional ETFs
Notional of Derivatives (as % of NAV) % non-zero mean std mean std min q1 median q3 maxNAV (M) (Number of funds: 118) 100% 1,521 4,745 1,521 4,745 2 18 116 708 38,555 Currency 7.63% 5.31 32.70 69.68 102.91 0.54 0.99 6.08 102.02 311.77Interest rate 0.85% 0.04 0.43 4.69 4.69 4.69 4.69 4.69 4.69 Interest rate (Cleared/exch-trd ) 0.85% 0.04 0.43 4.69 4.69 4.69 4.69 4.69 4.69 Interest rate (OTC) 0.00% 0.00 0.00CDS 0.00% 0.00 0.00 CDS (Cleared) 0.00% 0.00 0.00 CDS (OTC) 0.00% 0.00 0.00Equity 8.47% 1.33 10.36 15.73 33.82 0.01 0.10 0.46 2.28 99.90Commodity 0.00% 0.00 0.00Futures 8.47% 0.93 9.20 10.93 31.30 0.01 0.10 0.46 2.28 99.90Swaps 0.85% 0.08 0.90 9.82 9.82 9.82 9.82 9.82 9.82Forwards 7.63% 5.31 32.70 69.68 102.91 0.54 0.99 6.08 102.02 311.77Written option 0.85% 0.36 3.95 42.92 42.92 42.92 42.92 42.92 42.92Purchased option 0.00% 0.00 0.00Purchased swaption 0.00% 0.00 0.00Gross notional of derivatives 16.10% 6.69 34.08 41.53 77.62 0.01 0.16 1.20 99.90 311.77Financing 0.85% 0.12 1.33 14.44 14.44 14.44 14.44 14.44 14.44Senior security 0.00% 0.00 0.00Aggregate exposure incl. financing 16.10% 6.81 34.11 42.29 77.32 0.01 0.16 1.20 99.90 311.77Aggregate exposure incl. financing & Senior Sec 16.10% 6.81 34.11 42.29 77.32 0.01 0.16 1.20 99.90 311.77
Unconditional Conditional

Division of Economic and Risk Analysis 36
Panel J: ETFs (All)
Notional of Derivatives (as % of NAV) % non-zero mean std mean std min q1 median q3 maxNAV (M) (Number of funds: 140) 100% 1,313 4,382 1,313 4,382 2 17 103 585 38,555 Currency 7.86% 5.43 31.22 69.08 93.32 0.54 0.99 32.13 102.02 311.77Interest rate 3.57% 6.11 38.07 171.21 122.65 4.69 132.90 133.04 291.54 293.87 Interest rate (Cleared/exch-trd ) 1.43% 0.05 0.46 3.76 1.33 2.82 2.82 3.76 4.69 4.69 Interest rate (OTC) 2.86% 6.06 38.01 212.13 93.05 130.08 131.56 212.29 292.71 293.87CDS 0.00% 0.00 0.00 CDS (Cleared) 0.00% 0.00 0.00 CDS (OTC) 0.00% 0.00 0.00Equity 17.86% 17.33 55.32 97.02 98.33 0.01 1.20 53.12 200.00 283.12Commodity 0.71% 0.76 8.97 106.18 106.18 106.18 106.18 106.18 106.18Futures 12.86% 2.05 12.48 15.98 32.21 0.01 0.16 2.95 13.73 106.18Swaps 13.57% 21.46 64.11 158.11 94.53 9.82 98.18 186.28 207.32 293.87Forwards 7.86% 5.43 31.22 69.08 93.32 0.54 0.99 32.13 102.02 311.77Written option 1.43% 0.69 5.75 48.02 7.21 42.92 42.92 48.02 53.12 53.12Purchased option 0.71% 0.18 2.11 24.91 24.91 24.91 24.91 24.91 24.91Purchased swaption 0.00% 0.00 0.00Gross notional of derivatives 28.57% 29.63 71.20 103.69 100.95 0.01 2.01 101.12 199.94 311.77Financing 1.43% 0.74 7.61 51.69 52.68 14.44 14.44 51.69 88.94 88.94Senior security 0.00% 0.00 0.00Aggregate exposure incl. financing 28.57% 30.36 71.50 106.28 99.72 0.01 2.01 101.81 199.94 311.77Aggregate exposure incl. financing & Senior Sec 28.57% 30.36 71.50 106.28 99.72 0.01 2.01 101.81 199.94 311.77
Unconditional Conditional
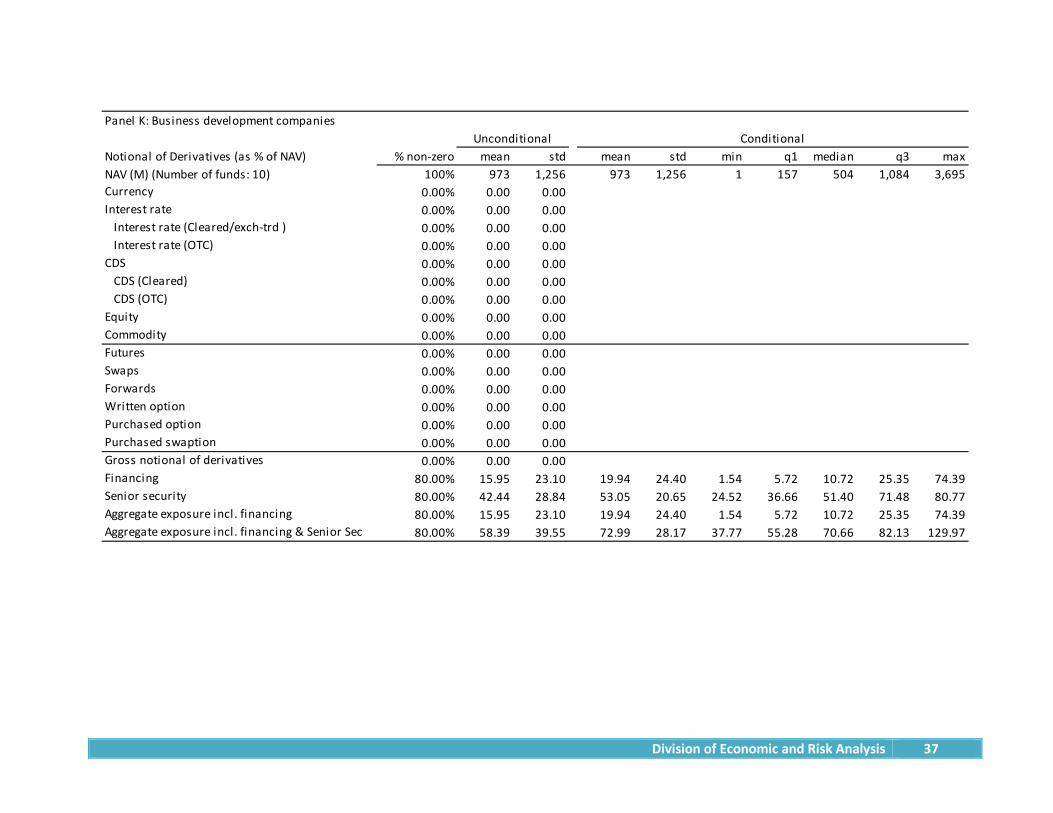
Division of Economic and Risk Analysis 37
Panel K: Business development companies
Notional of Derivatives (as % of NAV) % non-zero mean std mean std min q1 median q3 maxNAV (M) (Number of funds: 10) 100% 973 1,256 973 1,256 1 157 504 1,084 3,695 Currency 0.00% 0.00 0.00Interest rate 0.00% 0.00 0.00 Interest rate (Cleared/exch-trd ) 0.00% 0.00 0.00 Interest rate (OTC) 0.00% 0.00 0.00CDS 0.00% 0.00 0.00 CDS (Cleared) 0.00% 0.00 0.00 CDS (OTC) 0.00% 0.00 0.00Equity 0.00% 0.00 0.00Commodity 0.00% 0.00 0.00Futures 0.00% 0.00 0.00Swaps 0.00% 0.00 0.00Forwards 0.00% 0.00 0.00Written option 0.00% 0.00 0.00Purchased option 0.00% 0.00 0.00Purchased swaption 0.00% 0.00 0.00Gross notional of derivatives 0.00% 0.00 0.00Financing 80.00% 15.95 23.10 19.94 24.40 1.54 5.72 10.72 25.35 74.39Senior security 80.00% 42.44 28.84 53.05 20.65 24.52 36.66 51.40 71.48 80.77Aggregate exposure incl. financing 80.00% 15.95 23.10 19.94 24.40 1.54 5.72 10.72 25.35 74.39Aggregate exposure incl. financing & Senior Sec 80.00% 58.39 39.55 72.99 28.17 37.77 55.28 70.66 82.13 129.97
Unconditional Conditional

Division of Economic and Risk Analysis 38
Figure 1: Cumulative growth of registered funds by investment category groups (2011-2014)

Division of Economic and Risk Analysis 39

Division of Economic and Risk Analysis 40

Division of Economic and Risk Analysis 41
Figure 2: Growth of Alt Strategies funds by Morningstar categories

Division of Economic and Risk Analysis 42
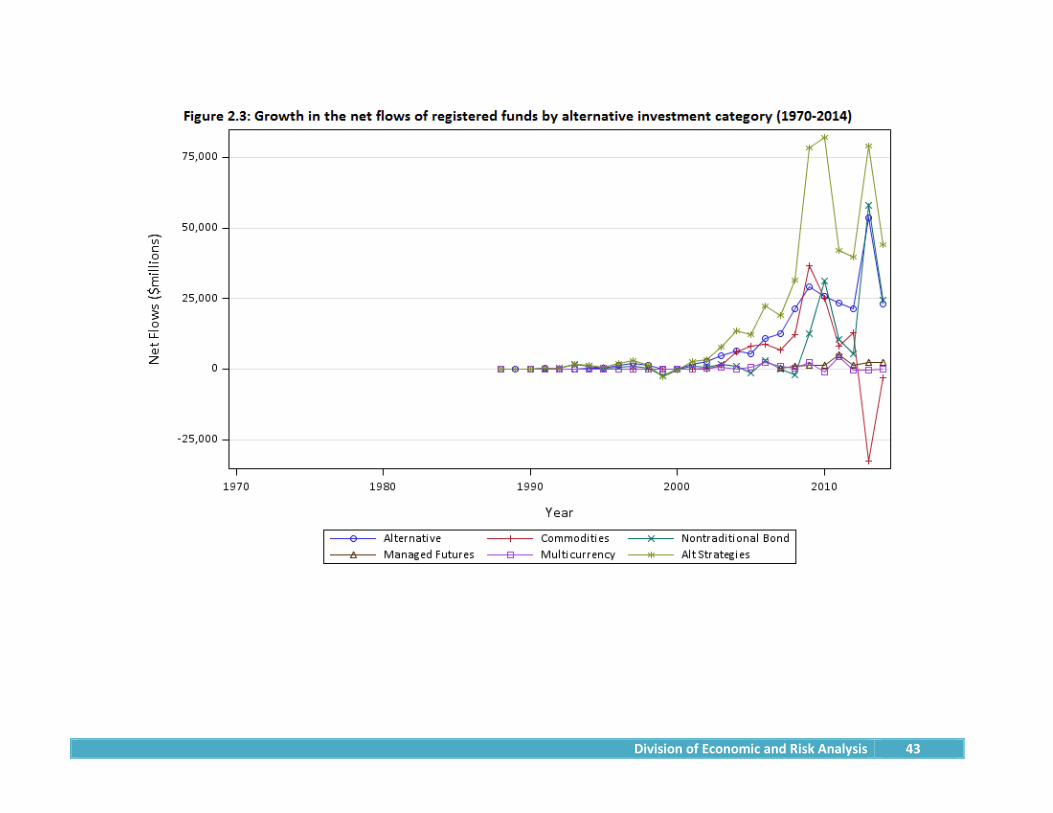
Division of Economic and Risk Analysis 43

Division of Economic and Risk Analysis 44
Figure 3: Gross Notional Exposure by Derivative Reference: Individual funds
F3.1 Alt Strategies mutual funds (Non-index)
CDS Commodity Currency EquityFinancing Interest rate Senior security
69 Long/Short Equity68 Managed Futures67 Multialternative66 Multialternative65 Nontraditional Bond64 Nontraditional Bond63 Multialternative62 Long/Short Equity61 Long/Short Equity60 Market Neutral59 Multialternative58 Long/Short Equity57 Long/Short Equity56 Multialternative55 Long/Short Equity54 Long/Short Equity53 Multialternative52 Long/Short Equity51 Multialternative50 Multialternative49 Nontraditional Bond48 Long/Short Equity47 Market Neutral46 Long/Short Equity45 Nontraditional Bond44 Market Neutral43 Long/Short Equity42 Multicurrency41 Multialternative40 Bear Market39 Multialternative38 Nontraditional Bond37 Nontraditional Bond36 Nontraditional Bond35 Long/Short Equity34 Market Neutral33 Market Neutral32 Bear Market31 Long/Short Equity30 Nontraditional Bond29 Commodities Precious Metals28 Market Neutral27 Long/Short Equity26 Managed Futures25 Commodities Precious Metals24 Commodities Broad Basket23 Commodities Broad Basket22 Multialternative21 Commodities Broad Basket20 Multicurrency19 Long/Short Equity18 Multialternative17 Trading-Inverse Debt16 Commodities Broad Basket15 Multialternative14 Managed Futures13 Bear Market12 Multialternative11 Nontraditional Bond10 Nontraditional Bond9 Multialternative8 Nontraditional Bond7 Nontraditional Bond6 Nontraditional Bond5 Multicurrency4 Managed Futures3 Multialternative2 Managed Futures1 Managed Futures
Aggregate Exposure as percentage of NAV
0 50 100 150 200 250 300 350 400 450 500 550 600 650 700 750 800 850 900 950 1000

Division of Economic and Risk Analysis 45
F3.2 Alt Strategies mutual funds (Index)
CDS Commodity Currency EquityFinancing Interest rate Senior security
12 Commodities Broad Basket
11 Long/Short Equity
10 Commodities Broad Basket
9 Multicurrency
8 Trading-Leveraged Equity
7 Trading-Leveraged Equity
6 Bear Market
5 Bear Market
4 Trading-Leveraged Equity
3 Trading-Inverse Equity
2 Bear Market
1 Trading-Leveraged Equity
Aggregate Exposure as percentage of NAV
0 50 100 150 200 250

Division of Economic and Risk Analysis 46
F3.3 Traditional mutual funds (Top 60)
CDS Commodity Currency EquityFinancing Interest rate Senior security
60 Moderate Allocation59 Multisector Bond58 Tactical Allocation57 Ultrashort Bond56 Muni National Interm55 Large Blend54 Intermediate-Term Bond53 Tactical Allocation52 Inflation-Protected Bond51 Corporate Bond50 Short-Term Bond49 World Allocation48 Muni National Short47 World Bond46 World Allocation45 Short-Term Bond44 Multisector Bond43 Multisector Bond42 Conservative Allocation41 Large Blend40 Intermediate Government39 Intermediate Government38 Intermediate Government37 Moderate Allocation36 Emerging Markets Bond35 Short-Term Bond34 Inflation-Protected Bond33 High Yield Bond32 Emerging Markets Bond31 Inflation-Protected Bond30 World Bond29 World Bond28 Muni National Interm27 High Yield Bond26 Technology25 Intermediate Government24 Intermediate-Term Bond23 Inflation-Protected Bond22 Tactical Allocation21 Tactical Allocation20 Tactical Allocation19 World Allocation18 Tactical Allocation17 Corporate Bond16 Intermediate-Term Bond15 Large Blend14 High Yield Bond13 Inflation-Protected Bond12 Emerging Markets Bond11 Intermediate-Term Bond10 Large Blend9 World Bond8 Convertibles7 Inflation-Protected Bond6 Short-Term Bond5 Intermediate-Term Bond4 Long-Term Bond3 Intermediate-Term Bond2 World Bond1 Japan Stock
Aggregate Exposure as percentage of NAV
0 50 100 150 200 250 300 350 400 450

Division of Economic and Risk Analysis 47
F3.4 Closed-end funds
CDS Commodity Currency EquityFinancing Interest rate Senior security
58 Long-Term Bond57 Miscellaneous Region56 Muni California Long55 Corporate Bond54 China Region53 China Region52 Convertibles51 Miscellaneous Region50 Miscellaneous Region49 Diversified Emerging Mkts48 Real Estate47 Large Blend46 Large Value45 Muni New York Intermediate44 Energy Limited Partnership43 Technology42 World Stock41 Energy Limited Partnership40 Bank Loan39 High Yield Bond38 High Yield Bond37 Foreign Large Blend36 Multisector Bond35 Bank Loan34 High Yield Bond33 World Stock32 High Yield Bond31 Emerging Markets Bond30 Large Value29 Muni California Long28 High Yield Bond27 World Bond26 High Yield Bond25 Muni National Long24 Bank Loan23 Muni Ohio22 High Yield Bond21 Muni Single State Long20 High Yield Muni19 Large Value18 Muni National Long17 High Yield Bond16 Muni National Long15 Real Estate14 Multisector Bond13 Muni New York Long12 Bank Loan11 Muni New York Long10 Technology9 Preferred Stock8 High Yield Muni7 Muni New York Long6 Large Growth5 Muni National Long4 Energy Limited Partnership3 World Stock2 Tactical Allocation1 Corporate Bond
Aggregate Exposure as percentage of NAV
0 50 100 150
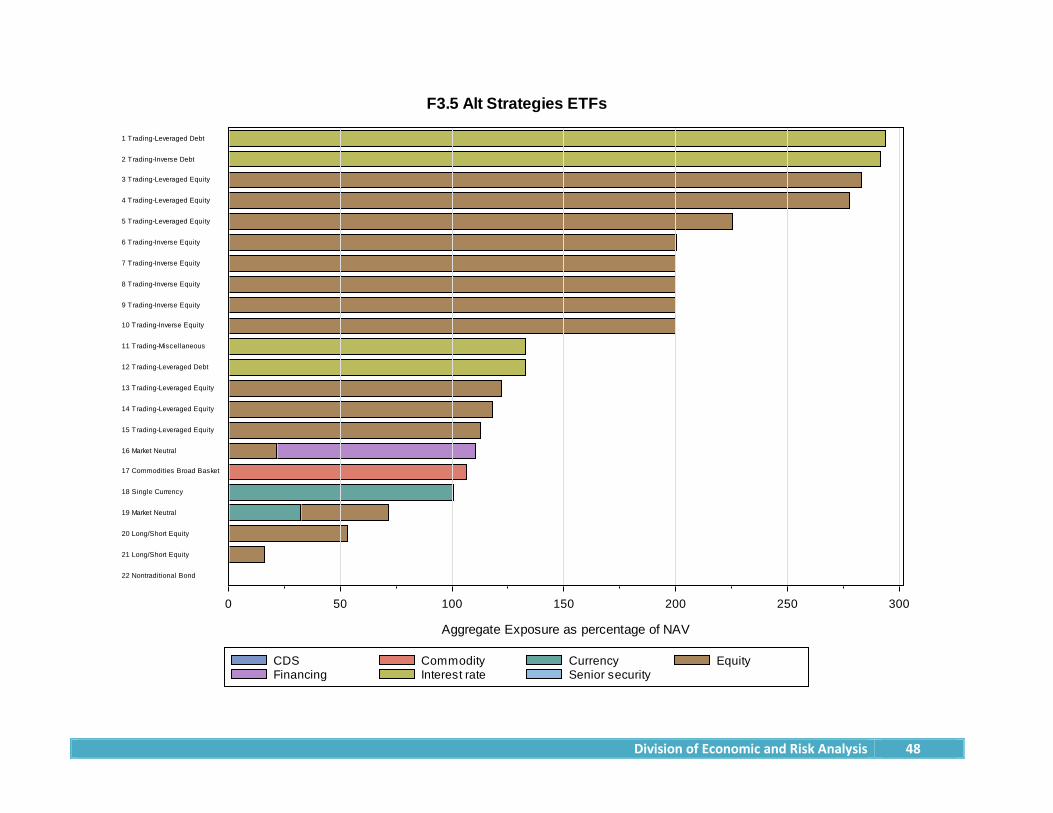
Division of Economic and Risk Analysis 48
F3.5 Alt Strategies ETFs
CDS Commodity Currency EquityFinancing Interest rate Senior security
22 Nontraditional Bond
21 Long/Short Equity
20 Long/Short Equity
19 Market Neutral
18 Single Currency
17 Commodities Broad Basket
16 Market Neutral
15 Trading-Leveraged Equity
14 Trading-Leveraged Equity
13 Trading-Leveraged Equity
12 Trading-Leveraged Debt
11 Trading-Miscellaneous
10 Trading-Inverse Equity
9 Trading-Inverse Equity
8 Trading-Inverse Equity
7 Trading-Inverse Equity
6 Trading-Inverse Equity
5 Trading-Leveraged Equity
4 Trading-Leveraged Equity
3 Trading-Leveraged Equity
2 Trading-Inverse Debt
1 Trading-Leveraged Debt
Aggregate Exposure as percentage of NAV
0 50 100 150 200 250 300

Division of Economic and Risk Analysis 49
F3.6 Traditional ETFs (Top 20)
CDS Commodity Currency EquityFinancing Interest rate Senior security
20 Japan Stock
19 Large Blend
18 Mid-Cap Growth
17 Large Blend
16 Large Growth
15 Small Growth
14 Large Value
13 World Bond
12 Global Real Estate
11 Diversified Emerging Mkt
10 Miscellaneous Region
9 Foreign Large Value
8 Ultrashort Bond
7 Short-Term Bond
6 Miscellaneous Sector
5 China Region
4 Latin America Stock
3 Europe Stock
2 Miscellaneous Region
1 Japan Stock
Aggregate Exposure as percentage of NAV
0 50 100 150 200 250 300 350

Division of Economic and Risk Analysis 50
F3.7 Business development company
CDS Commodity Currency EquityFinancing Interest rate Senior security
9
10
8
7
6
5
4
3
2
1
Aggregate Exposure as percentage of NAV
0 50 100 150

Division of Economic and Risk Analysis 51
Figure 4: Gross Notional Exposure by Derivative instrument: Individual funds
F4.1 Alt Strategies mutual funds (Non-index)
Financing Forward FutureSenior security Swap Written option
69 Long/Short Equity68 Managed Futures67 Multialternative66 Multialternative65 Nontraditional Bond64 Nontraditional Bond63 Multialternative62 Long/Short Equity61 Long/Short Equity60 Market Neutral59 Multialternative58 Long/Short Equity57 Long/Short Equity56 Multialternative55 Long/Short Equity54 Long/Short Equity53 Multialternative52 Long/Short Equity51 Multialternative50 Multialternative49 Nontraditional Bond48 Long/Short Equity47 Market Neutral46 Long/Short Equity45 Nontraditional Bond44 Market Neutral43 Long/Short Equity42 Multicurrency41 Multialternative40 Bear Market39 Multialternative38 Nontraditional Bond37 Nontraditional Bond36 Nontraditional Bond35 Long/Short Equity34 Market Neutral33 Market Neutral32 Bear Market31 Long/Short Equity30 Nontraditional Bond29 Commodities Precious Metals28 Market Neutral27 Long/Short Equity26 Managed Futures25 Commodities Precious Metals24 Commodities Broad Basket23 Commodities Broad Basket22 Multialternative21 Commodities Broad Basket20 Multicurrency19 Long/Short Equity18 Multialternative17 Trading-Inverse Debt16 Commodities Broad Basket15 Multialternative14 Managed Futures13 Bear Market12 Multialternative11 Nontraditional Bond10 Nontraditional Bond9 Multialternative8 Nontraditional Bond7 Nontraditional Bond6 Nontraditional Bond5 Multicurrency4 Managed Futures3 Multialternative2 Managed Futures1 Managed Futures
Aggregate Exposure as percentage of NAV
0 50 100 150 200 250 300 350 400 450 500 550 600 650 700 750 800 850 900 950 1000
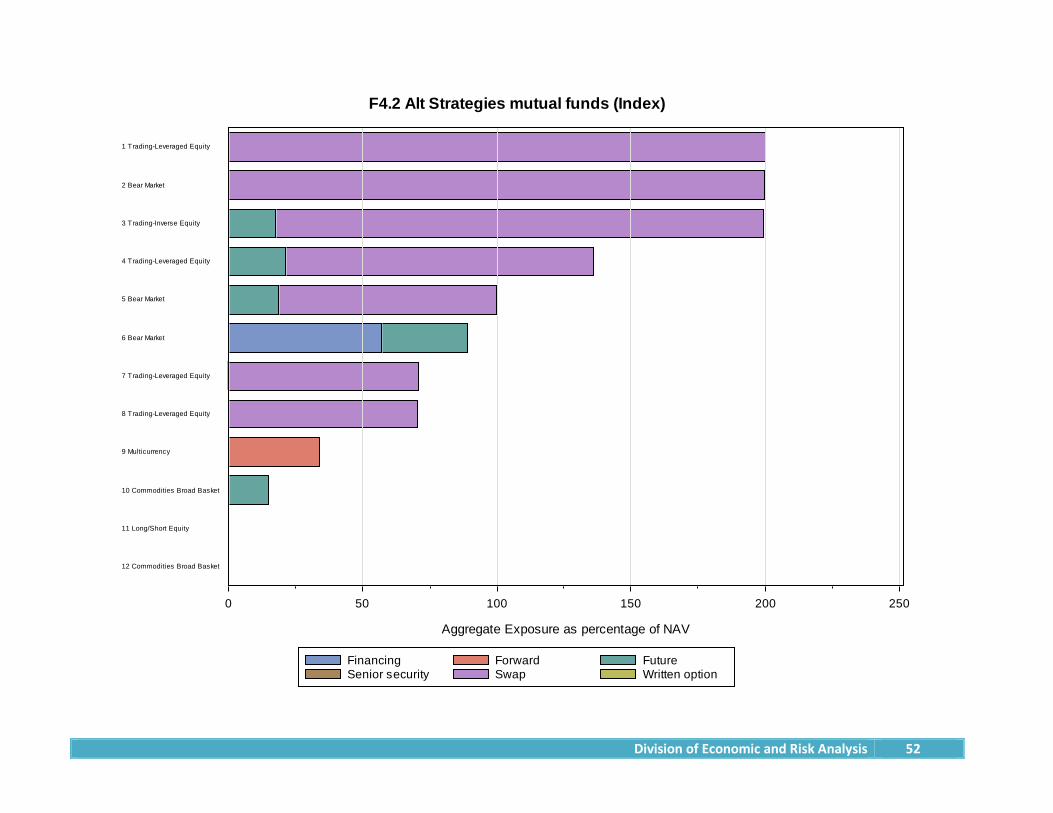
Division of Economic and Risk Analysis 52
F4.2 Alt Strategies mutual funds (Index)
Financing Forward FutureSenior security Swap Written option
12 Commodities Broad Basket
11 Long/Short Equity
10 Commodities Broad Basket
9 Multicurrency
8 Trading-Leveraged Equity
7 Trading-Leveraged Equity
6 Bear Market
5 Bear Market
4 Trading-Leveraged Equity
3 Trading-Inverse Equity
2 Bear Market
1 Trading-Leveraged Equity
Aggregate Exposure as percentage of NAV
0 50 100 150 200 250

Division of Economic and Risk Analysis 53
F4.3 Traditional mutual funds (Top 60)
Financing Forward FutureSenior security Swap Written option
60 Moderate Allocation59 Multisector Bond58 Tactical Allocation57 Ultrashort Bond56 Muni National Interm55 Large Blend54 Intermediate-Term Bond53 Tactical Allocation52 Inflation-Protected Bond51 Corporate Bond50 Short-Term Bond49 World Allocation48 Muni National Short47 World Bond46 World Allocation45 Short-Term Bond44 Multisector Bond43 Multisector Bond42 Conservative Allocation41 Large Blend40 Intermediate Government39 Intermediate Government38 Intermediate Government37 Moderate Allocation36 Emerging Markets Bond35 Short-Term Bond34 Inflation-Protected Bond33 High Yield Bond32 Emerging Markets Bond31 Inflation-Protected Bond30 World Bond29 World Bond28 Muni National Interm27 High Yield Bond26 Technology25 Intermediate Government24 Intermediate-Term Bond23 Inflation-Protected Bond22 Tactical Allocation21 Tactical Allocation20 Tactical Allocation19 World Allocation18 Tactical Allocation17 Corporate Bond16 Intermediate-Term Bond15 Large Blend14 High Yield Bond13 Inflation-Protected Bond12 Emerging Markets Bond11 Intermediate-Term Bond10 Large Blend9 World Bond8 Convertibles7 Inflation-Protected Bond6 Short-Term Bond5 Intermediate-Term Bond4 Long-Term Bond3 Intermediate-Term Bond2 World Bond1 Japan Stock
Aggregate Exposure as percentage of NAV
0 50 100 150 200 250 300 350 400 450
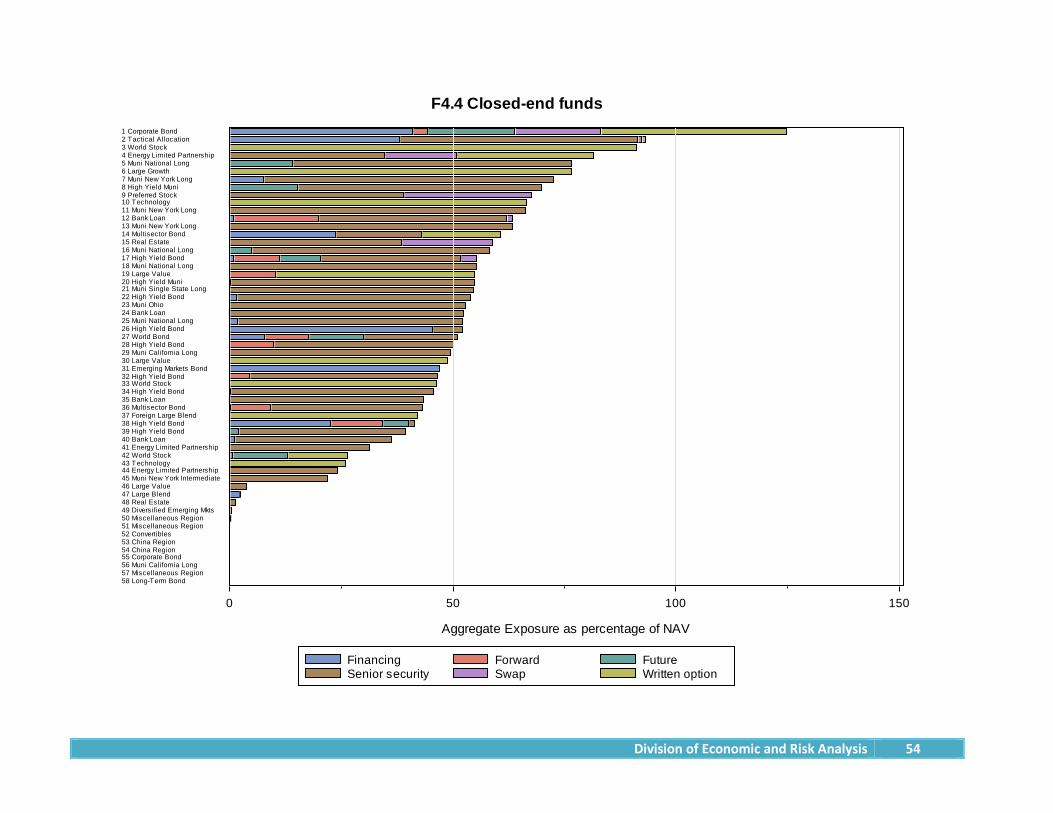
Division of Economic and Risk Analysis 54
F4.4 Closed-end funds
Financing Forward FutureSenior security Swap Written option
58 Long-Term Bond57 Miscellaneous Region56 Muni California Long55 Corporate Bond54 China Region53 China Region52 Convertibles51 Miscellaneous Region50 Miscellaneous Region49 Diversified Emerging Mkts48 Real Estate47 Large Blend46 Large Value45 Muni New York Intermediate44 Energy Limited Partnership43 Technology42 World Stock41 Energy Limited Partnership40 Bank Loan39 High Yield Bond38 High Yield Bond37 Foreign Large Blend36 Multisector Bond35 Bank Loan34 High Yield Bond33 World Stock32 High Yield Bond31 Emerging Markets Bond30 Large Value29 Muni California Long28 High Yield Bond27 World Bond26 High Yield Bond25 Muni National Long24 Bank Loan23 Muni Ohio22 High Yield Bond21 Muni Single State Long20 High Yield Muni19 Large Value18 Muni National Long17 High Yield Bond16 Muni National Long15 Real Estate14 Multisector Bond13 Muni New York Long12 Bank Loan11 Muni New York Long10 Technology9 Preferred Stock8 High Yield Muni7 Muni New York Long6 Large Growth5 Muni National Long4 Energy Limited Partnership3 World Stock2 Tactical Allocation1 Corporate Bond
Aggregate Exposure as percentage of NAV
0 50 100 150

Division of Economic and Risk Analysis 55
F4.5 Alt Strategies ETFs
Financing Forward FutureSenior security Swap Written option
22 Nontraditional Bond
21 Long/Short Equity
20 Long/Short Equity
19 Market Neutral
18 Single Currency
17 Commodities Broad Basket
16 Market Neutral
15 Trading-Leveraged Equity
14 Trading-Leveraged Equity
13 Trading-Leveraged Equity
12 Trading-Leveraged Debt
11 Trading-Miscellaneous
10 Trading-Inverse Equity
9 Trading-Inverse Equity
8 Trading-Inverse Equity
7 Trading-Inverse Equity
6 Trading-Inverse Equity
5 Trading-Leveraged Equity
4 Trading-Leveraged Equity
3 Trading-Leveraged Equity
2 Trading-Inverse Debt
1 Trading-Leveraged Debt
Aggregate Exposure as percentage of NAV
0 50 100 150 200 250 300

Division of Economic and Risk Analysis 56
F4.6 Traditional ETFs (Top 20)
Financing Forward FutureSenior security Swap Written option
20 Japan Stock
19 Large Blend
18 Mid-Cap Growth
17 Large Blend
16 Large Growth
15 Small Growth
14 Large Value
13 World Bond
12 Global Real Estate
11 Diversified Emerging Mkt
10 Miscellaneous Region
9 Foreign Large Value
8 Ultrashort Bond
7 Short-Term Bond
6 Miscellaneous Sector
5 China Region
4 Latin America Stock
3 Europe Stock
2 Miscellaneous Region
1 Japan Stock
Aggregate Exposure as percentage of NAV
0 50 100 150 200 250 300 350

Division of Economic and Risk Analysis 57
F4.7 Business development company
Financing Forward FutureSenior security Swap Written option
9
10
8
7
6
5
4
3
2
1
Aggregate Exposure as percentage of NAV
0 50 100 150
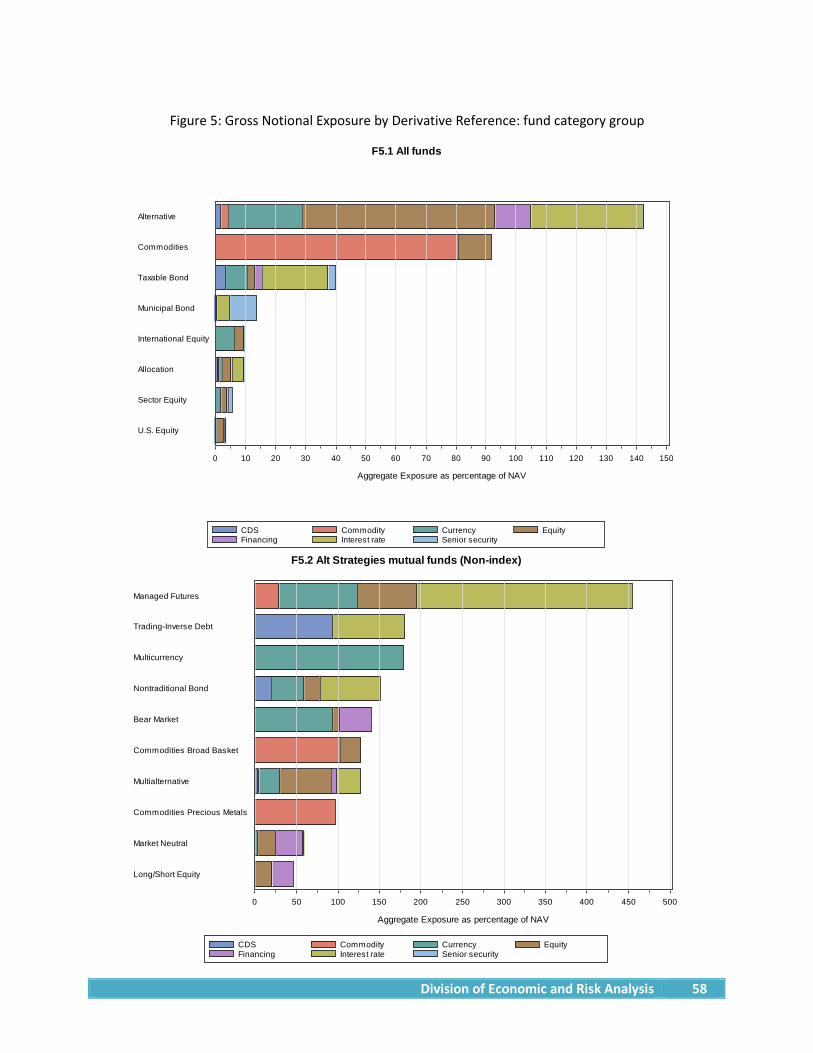
Division of Economic and Risk Analysis 58
Figure 5: Gross Notional Exposure by Derivative Reference: fund category group
F5.1 All funds
CDS Commodity Currency EquityFinancing Interest rate Senior security
U.S. Equity
Sector Equity
Allocation
International Equity
Municipal Bond
Taxable Bond
Commodities
Alternative
Aggregate Exposure as percentage of NAV
0 10 20 30 40 50 60 70 80 90 100 110 120 130 140 150
F5.2 Alt Strategies mutual funds (Non-index)
CDS Commodity Currency EquityFinancing Interest rate Senior security
Long/Short Equity
Market Neutral
Commodities Precious Metals
Multialternative
Commodities Broad Basket
Bear Market
Nontraditional Bond
Multicurrency
Trading-Inverse Debt
Managed Futures
Aggregate Exposure as percentage of NAV
0 50 100 150 200 250 300 350 400 450 500

Division of Economic and Risk Analysis 59
F5.3 Alt Strategies mutual funds (Index)
CDS Commodity Currency EquityFinancing Interest rate Senior security
Long/Short Equity
Commodities Broad Basket
Multicurrency
Trading-Leveraged Equity
Bear Market
Trading-Inverse Equity
Aggregate Exposure as percentage of NAV
0 50 100 150 200 250
F5.4 Traditional mutual funds
CDS Commodity Currency EquityFinancing Interest rate Senior security
Sector Equity
U.S. Equity
Municipal Bond
International Equity
Allocation
Taxable Bond
Aggregate Exposure as percentage of NAV
0 10 20 30 40
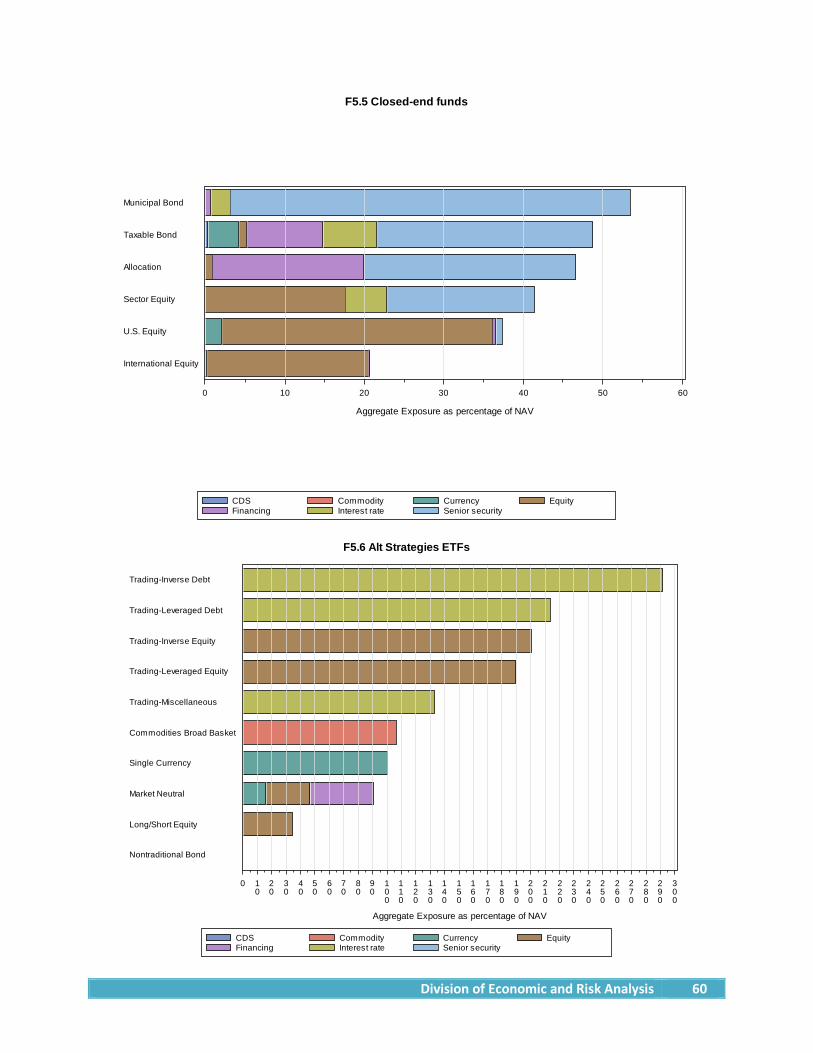
Division of Economic and Risk Analysis 60
F5.5 Closed-end funds
CDS Commodity Currency EquityFinancing Interest rate Senior security
International Equity
U.S. Equity
Sector Equity
Allocation
Taxable Bond
Municipal Bond
Aggregate Exposure as percentage of NAV
0 10 20 30 40 50 60
F5.6 Alt Strategies ETFs
CDS Commodity Currency EquityFinancing Interest rate Senior security
Nontraditional Bond
Long/Short Equity
Market Neutral
Single Currency
Commodities Broad Basket
Trading-Miscellaneous
Trading-Leveraged Equity
Trading-Inverse Equity
Trading-Leveraged Debt
Trading-Inverse Debt
Aggregate Exposure as percentage of NAV
0 10
20
30
40
50
60
70
80
90
100
110
120
130
140
150
160
170
180
190
200
210
220
230
240
250
260
270
280
290
300
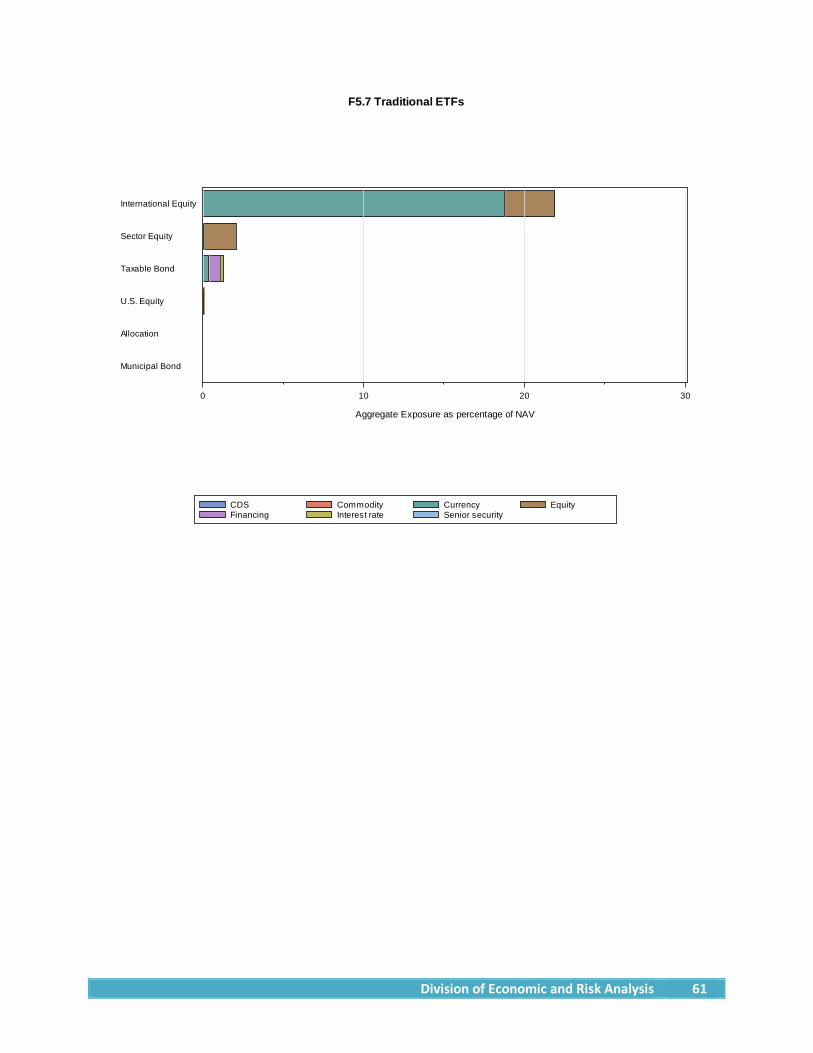
Division of Economic and Risk Analysis 61
F5.7 Traditional ETFs
CDS Commodity Currency EquityFinancing Interest rate Senior security
Municipal Bond
Allocation
U.S. Equity
Taxable Bond
Sector Equity
International Equity
Aggregate Exposure as percentage of NAV
0 10 20 30

Division of Economic and Risk Analysis 62
Figure 6: Gross Notional Exposure by Derivative Instrument: fund category group
F6.1 All funds
Financing Forward FutureSenior security Swap Written option
U.S. Equity
Sector Equity
Allocation
International Equity
Municipal Bond
Taxable Bond
Commodities
Alternative
Aggregate Exposure as percentage of NAV
0 10 20 30 40 50 60 70 80 90 100 110 120 130 140 150
F6.2 Alt Strategies mutual funds (Non-index)
Financing Forward FutureSenior security Swap Written option
Long/Short Equity
Market Neutral
Commodities Precious Metals
Multialternative
Commodities Broad Basket
Bear Market
Nontraditional Bond
Multicurrency
Trading-Inverse Debt
Managed Futures
Aggregate Exposure as percentage of NAV
0 50 100 150 200 250 300 350 400 450 500

Division of Economic and Risk Analysis 63
F6.3 Alt Strategies mutual funds (Index)
Financing Forward FutureSenior security Swap Written option
Long/Short Equity
Commodities Broad Basket
Multicurrency
Trading-Leveraged Equity
Bear Market
Trading-Inverse Equity
Aggregate Exposure as percentage of NAV
0 50 100 150 200 250
F6.4 Traditional mutual funds
Financing Forward FutureSenior security Swap Written option
Sector Equity
U.S. Equity
Municipal Bond
International Equity
Allocation
Taxable Bond
Aggregate Exposure as percentage of NAV
0 10 20 30 40

Division of Economic and Risk Analysis 64
F6.5 Closed-end funds
Financing Forward FutureSenior security Swap Written option
International Equity
U.S. Equity
Sector Equity
Allocation
Taxable Bond
Municipal Bond
Aggregate Exposure as percentage of NAV
0 10 20 30 40 50 60
F6.6 Alt Strategies ETFs
Financing Forward FutureSenior security Swap Written option
Nontraditional Bond
Long/Short Equity
Market Neutral
Single Currency
Commodities Broad Basket
Trading-Miscellaneous
Trading-Leveraged Equity
Trading-Inverse Equity
Trading-Leveraged Debt
Trading-Inverse Debt
Aggregate Exposure as percentage of NAV
0 10
20
30
40
50
60
70
80
90
100
110
120
130
140
150
160
170
180
190
200
210
220
230
240
250
260
270
280
290
300

Division of Economic and Risk Analysis 65
F6.7 Traditional ETFs
Financing Forward FutureSenior security Swap Written option
Municipal Bond
Allocation
U.S. Equity
Taxable Bond
Sector Equity
International Equity
Aggregate Exposure as percentage of NAV
0 10 20 30
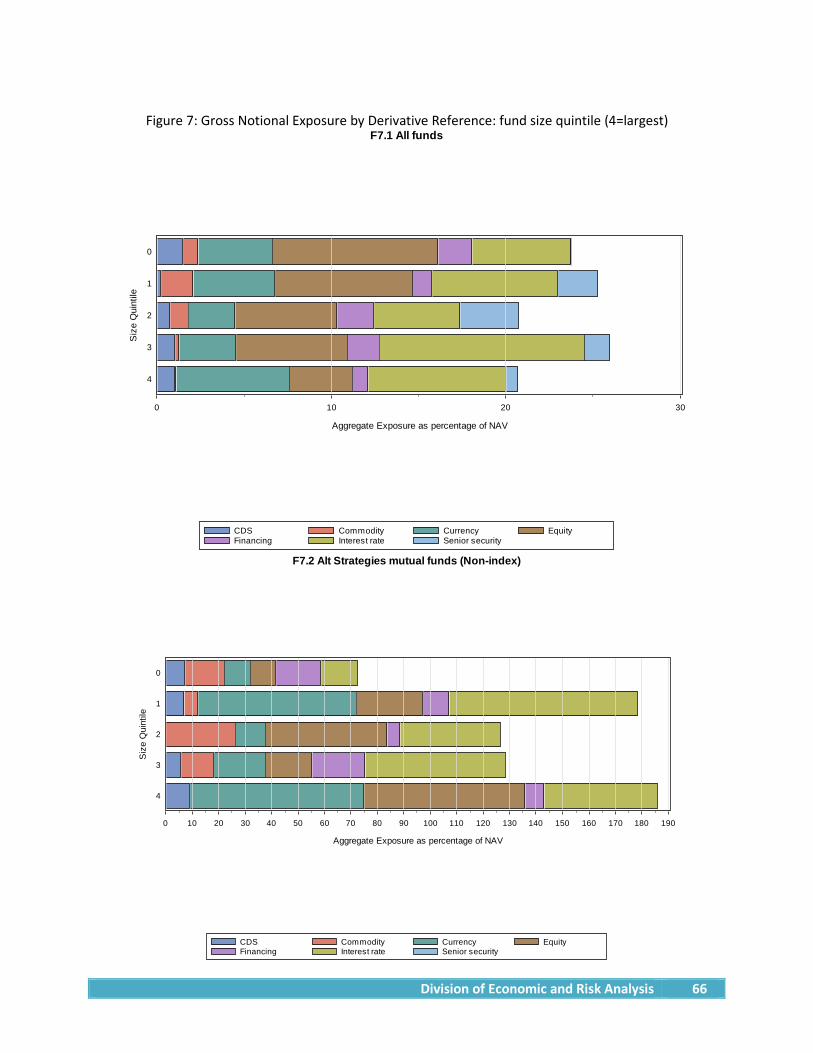
Division of Economic and Risk Analysis 66
Figure 7: Gross Notional Exposure by Derivative Reference: fund size quintile (4=largest)
F7.1 All funds
CDS Commodity Currency EquityFinancing Interest rate Senior security
Siz
e Q
uint
ile
4
3
2
1
0
Aggregate Exposure as percentage of NAV
0 10 20 30
F7.2 Alt Strategies mutual funds (Non-index)
CDS Commodity Currency EquityFinancing Interest rate Senior security
Siz
e Q
uint
ile
4
3
2
1
0
Aggregate Exposure as percentage of NAV
0 10 20 30 40 50 60 70 80 90 100 110 120 130 140 150 160 170 180 190

Division of Economic and Risk Analysis 67
F7.3 Alt Strategies mutual funds (Index)
CDS Commodity Currency EquityFinancing Interest rate Senior security
Siz
e Q
uint
ile
4
3
2
1
0
Aggregate Exposure as percentage of NAV
0 10 20 30 40 50 60 70 80 90 100 110 120 130 140 150 160 170
F7.4 Traditional mutual funds
CDS Commodity Currency EquityFinancing Interest rate Senior security
Siz
e Q
uint
ile
4
3
2
1
0
Aggregate Exposure as percentage of NAV
0 1 2 3 4 5 6 7 8 9 10 11 12 13 14 15

Division of Economic and Risk Analysis 68
F7.5 Closed-end funds
CDS Commodity Currency EquityFinancing Interest rate Senior security
Siz
e Q
uint
ile
4
3
2
1
0
Aggregate Exposure as percentage of NAV
0 10 20 30 40 50 60
F7.6 Alt Strategies ETFs
CDS Commodity Currency EquityFinancing Interest rate Senior security
Siz
e Q
uint
ile
4
3
2
1
0
Aggregate Exposure as percentage of NAV
0 10 20 30 40 50 60 70 80 90 100 110 120 130 140 150 160 170 180 190

Division of Economic and Risk Analysis 69
F7.7 Traditional ETFs
CDS Commodity Currency EquityFinancing Interest rate Senior security
Siz
e Q
uint
ile
4
3
2
1
0
Aggregate Exposure as percentage of NAV
0 1 2 3 4 5 6 7 8 9 10 11 12 13 14
F7.8 Business development companies
CDS Commodity Currency EquityFinancing Interest rate Senior security
Siz
e Q
uint
ile
4
3
2
1
0
Aggregate Exposure as percentage of NAV
0 10 20 30 40 50 60 70 80 90 100 110

Division of Economic and Risk Analysis 70
Figure 8: Gross Notional Exposure by Derivative Instrument: fund size quintile (4=largest)
F8.1 All funds
Financing Forward FutureSenior security Swap Written option
Siz
e Q
uint
ile
4
3
2
1
0
Aggregate Exposure as percentage of NAV
0 10 20 30
F8.2 Alt Strategies mutual funds (Non-index)
Financing Forward FutureSenior security Swap Written option
Siz
e Q
uint
ile
4
3
2
1
0
Aggregate Exposure as percentage of NAV
0 10 20 30 40 50 60 70 80 90 100 110 120 130 140 150 160 170 180 190
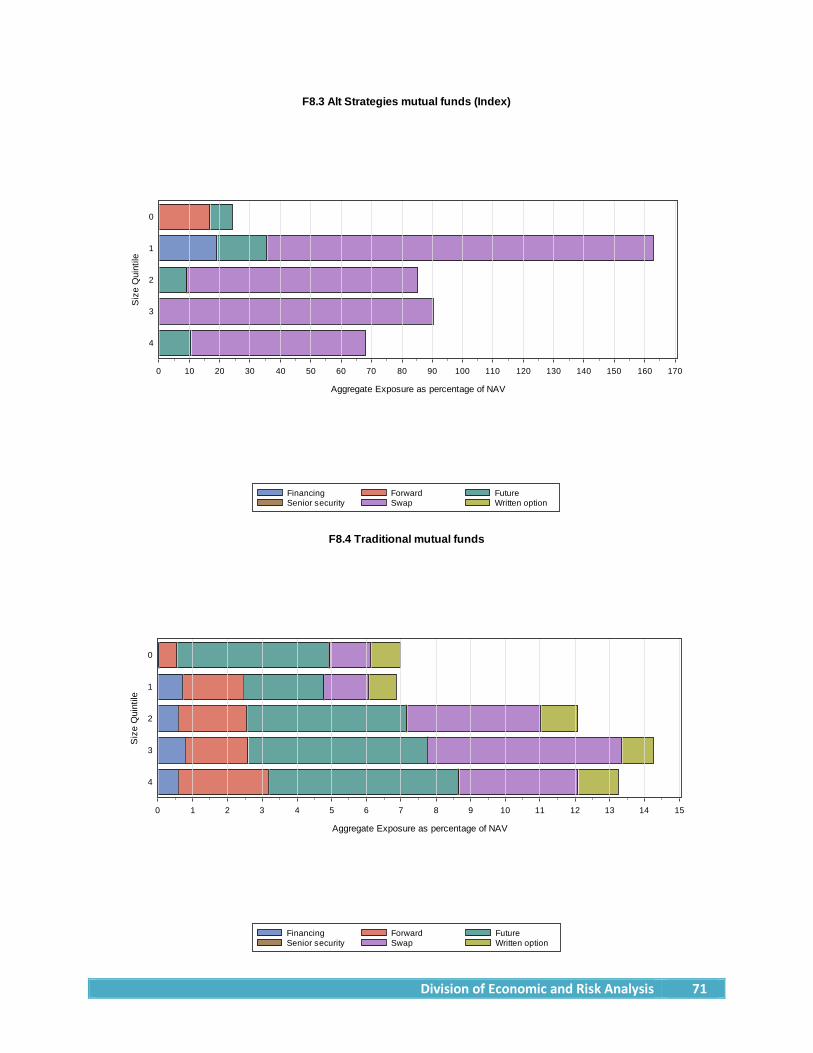
Division of Economic and Risk Analysis 71
F8.3 Alt Strategies mutual funds (Index)
Financing Forward FutureSenior security Swap Written option
Siz
e Q
uint
ile
4
3
2
1
0
Aggregate Exposure as percentage of NAV
0 10 20 30 40 50 60 70 80 90 100 110 120 130 140 150 160 170
F8.4 Traditional mutual funds
Financing Forward FutureSenior security Swap Written option
Siz
e Q
uint
ile
4
3
2
1
0
Aggregate Exposure as percentage of NAV
0 1 2 3 4 5 6 7 8 9 10 11 12 13 14 15
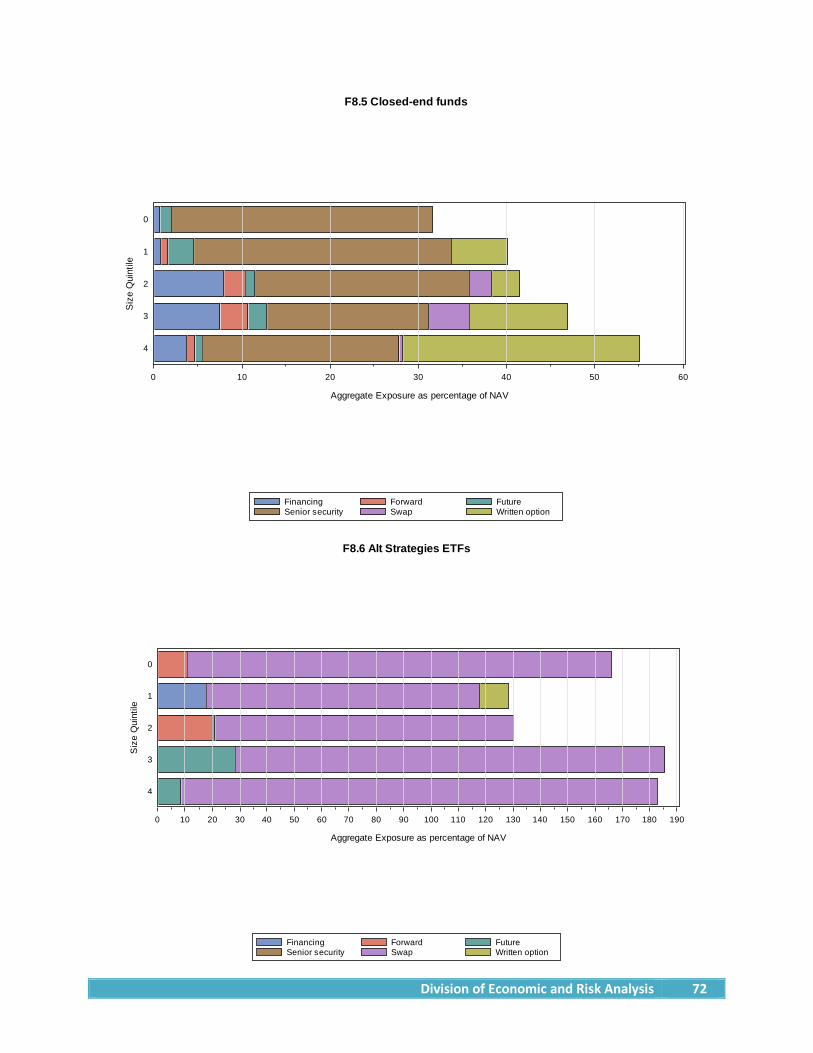
Division of Economic and Risk Analysis 72
F8.5 Closed-end funds
Financing Forward FutureSenior security Swap Written option
Siz
e Q
uint
ile
4
3
2
1
0
Aggregate Exposure as percentage of NAV
0 10 20 30 40 50 60
F8.6 Alt Strategies ETFs
Financing Forward FutureSenior security Swap Written option
Siz
e Q
uint
ile
4
3
2
1
0
Aggregate Exposure as percentage of NAV
0 10 20 30 40 50 60 70 80 90 100 110 120 130 140 150 160 170 180 190

Division of Economic and Risk Analysis 73
F8.7 Traditional ETFs
Financing Forward FutureSenior security Swap Written option
Siz
e Q
uint
ile
4
3
2
1
0
Aggregate Exposure as percentage of NAV
0 1 2 3 4 5 6 7 8 9 10 11 12 13 14
F8.8 Business development companies
Financing Forward FutureSenior security Swap Written option
Siz
e Q
uint
ile
4
3
2
1
0
Aggregate Exposure as percentage of NAV
0 10 20 30 40 50 60 70 80 90 100 110
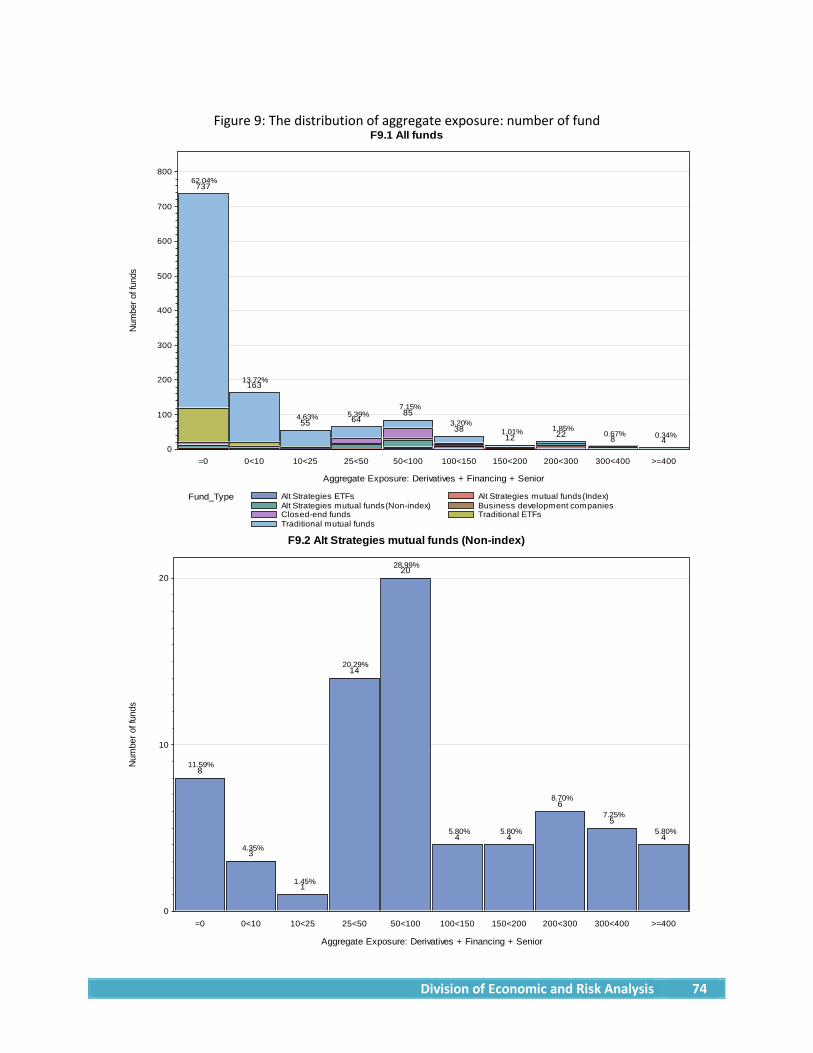
Division of Economic and Risk Analysis 74
Figure 9: The distribution of aggregate exposure: number of fund
F9.1 All funds
Fund_Type Alt Strategies ETFs Alt Strategies mutual funds(Index)Alt Strategies mutual funds(Non-index) Business development companiesClosed-end funds Traditional ETFsTraditional mutual funds
737
163
55 6485
3812 22 8 4
Num
ber o
f fun
ds
0
100
200
300
400
500
600
700
800
Aggregate Exposure: Derivatives + Financing + Senior
=0 0<10 10<25 25<50 50<100 100<150 150<200 200<300 300<400 >=400
62.04%
13.72%
4.63% 5.39% 7.15%
3.20% 1.01% 1.85%
0.67% 0.34%
F9.2 Alt Strategies mutual funds (Non-index)
8
3
1
14
20
4 4
6
5
4
Num
ber o
f fun
ds
0
10
20
Aggregate Exposure: Derivatives + Financing + Senior
=0 0<10 10<25 25<50 50<100 100<150 150<200 200<300 300<400 >=400
11.59%
4.35%
1.45%
20.29%
28.99%
5.80% 5.80%
8.70%
7.25%
5.80%
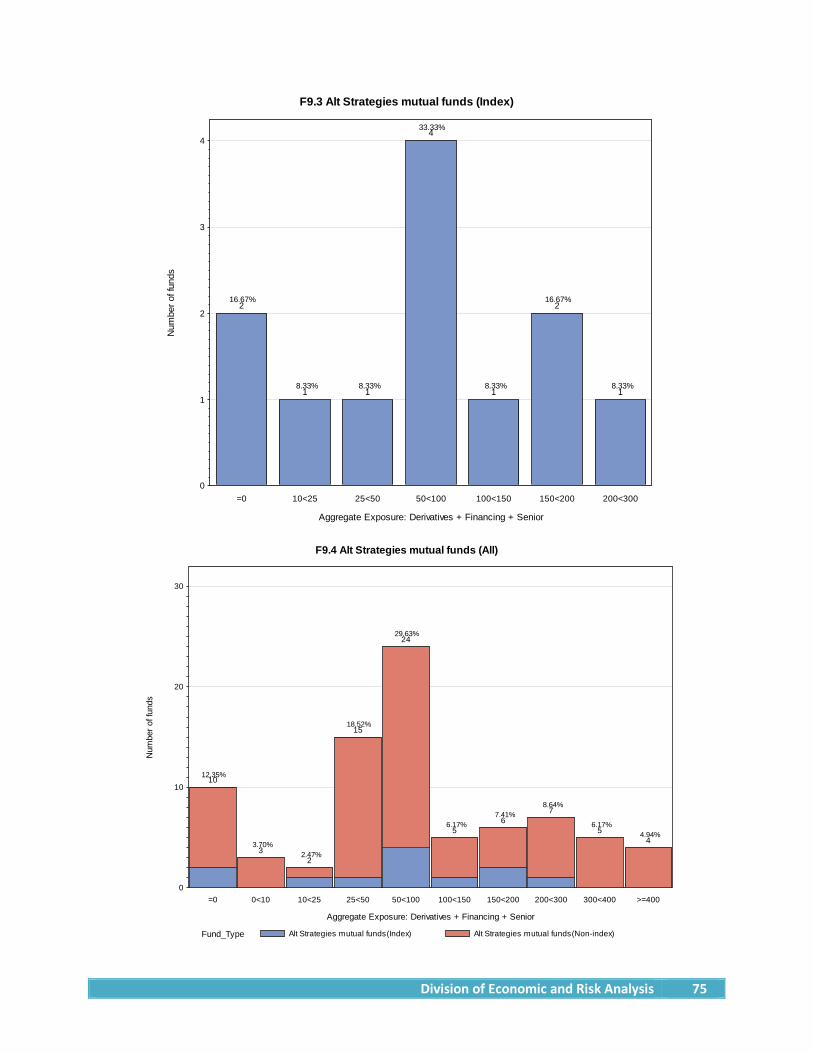
Division of Economic and Risk Analysis 75
F9.3 Alt Strategies mutual funds (Index)
2
1 1
4
1
2
1
Num
ber o
f fun
ds
0
1
2
3
4
Aggregate Exposure: Derivatives + Financing + Senior
=0 10<25 25<50 50<100 100<150 150<200 200<300
16.67%
8.33% 8.33%
33.33%
8.33%
16.67%
8.33%
F9.4 Alt Strategies mutual funds (All)
Fund_Type Alt Strategies mutual funds(Index) Alt Strategies mutual funds(Non-index)
10
32
15
24
56
7
54
Num
ber o
f fun
ds
0
10
20
30
Aggregate Exposure: Derivatives + Financing + Senior
=0 0<10 10<25 25<50 50<100 100<150 150<200 200<300 300<400 >=400
12.35%
3.70% 2.47%
18.52%
29.63%
6.17% 7.41%
8.64%
6.17% 4.94%
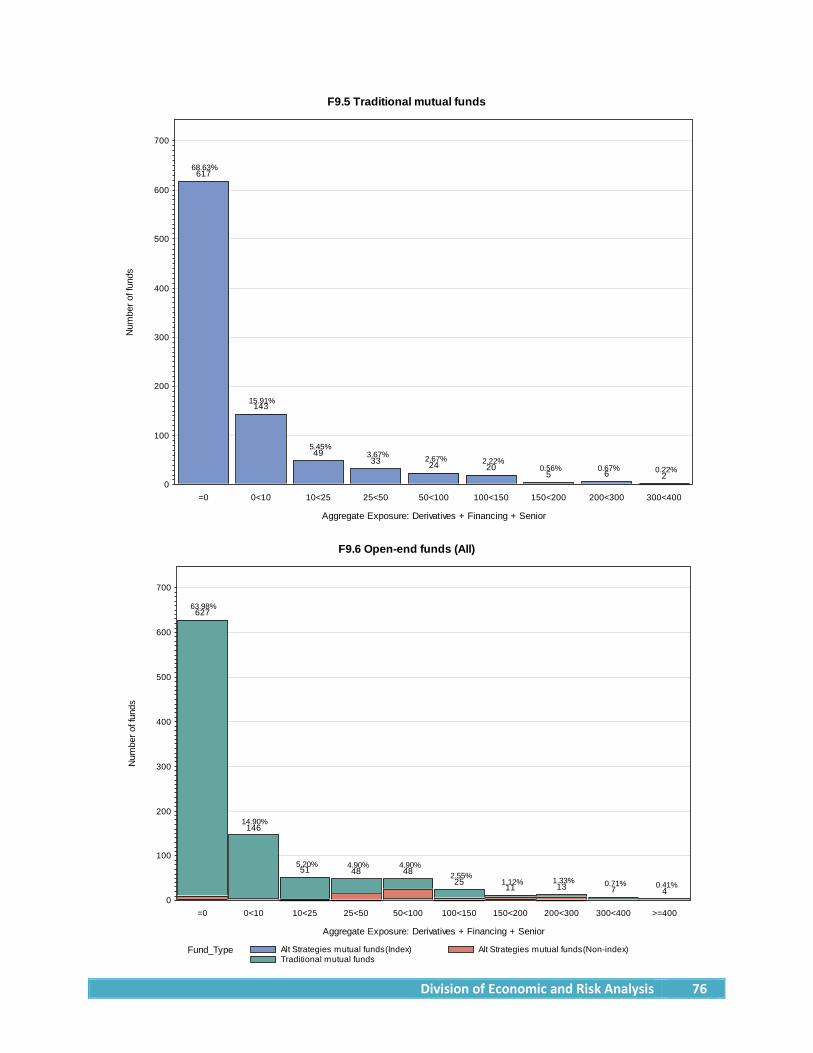
Division of Economic and Risk Analysis 76
F9.5 Traditional mutual funds
617
143
4933 24 20
5 6 2
Num
ber o
f fun
ds
0
100
200
300
400
500
600
700
Aggregate Exposure: Derivatives + Financing + Senior
=0 0<10 10<25 25<50 50<100 100<150 150<200 200<300 300<400
68.63%
15.91%
5.45% 3.67% 2.67% 2.22%
0.56% 0.67% 0.22%
F9.6 Open-end funds (All)
Fund_Type Alt Strategies mutual funds(Index) Alt Strategies mutual funds(Non-index)Traditional mutual funds
627
146
51 48 4825
11 13 7 4
Num
ber o
f fun
ds
0
100
200
300
400
500
600
700
Aggregate Exposure: Derivatives + Financing + Senior
=0 0<10 10<25 25<50 50<100 100<150 150<200 200<300 300<400 >=400
63.98%
14.90%
5.20% 4.90% 4.90% 2.55%
1.12% 1.33% 0.71% 0.41%

Division of Economic and Risk Analysis 77
F9.7 Closed-end funds
8
5
2
15
27
1
Num
ber o
f fun
ds
0
10
20
30
Aggregate Exposure: Derivatives + Financing + Senior
=0 0<10 10<25 25<50 50<100 100<150
13.79%
8.62%
3.45%
25.86%
46.55%
1.72%
F9.8 Alt Strategies ETFs
1 1
2
8
1
9
Num
ber o
f fun
ds
0
1
2
3
4
5
6
7
8
9
Aggregate Exposure: Derivatives + Financing + Senior
=0 10<25 50<100 100<150 150<200 200<300
4.55% 4.55%
9.09%
36.36%
4.55%
40.91%

Division of Economic and Risk Analysis 78
F9.9 Traditional ETFs
99
12
1 2 31
Num
ber o
f fun
ds
0
10
20
30
40
50
60
70
80
90
100
Aggregate Exposure: Derivatives + Financing + Senior
=0 0<10 10<25 50<100 100<150 300<400
83.90%
10.17%
0.85% 1.69% 2.54% 0.85%
F9.10 ETFs (All)
Fund_Type Alt Strategies ETFs Traditional ETFs
100
12
24
11
1
9
1
Num
ber o
f fun
ds
0
10
20
30
40
50
60
70
80
90
100
Aggregate Exposure: Derivatives + Financing + Senior
=0 0<10 10<25 50<100 100<150 150<200 200<300 300<400
71.43%
8.57%
1.43% 2.86%
7.86%
0.71%
6.43%
0.71%

Division of Economic and Risk Analysis 79
F9.11 Business development companies
2
1
6
1
Num
ber o
f fun
ds
0
1
2
3
4
5
6
Aggregate Exposure: Derivatives + Financing + Senior
=0 25<50 50<100 100<150
20.00%
10.00%
60.00%
10.00%

Division of Economic and Risk Analysis 80
Figure 10: The distribution of aggregate exposure: AUM
F10.1 All funds
Fund_Type Alt Strategies ETFs Alt Strategies mutual funds(Index)Alt Strategies mutual funds(Non-index) Business development companiesClosed-end funds Traditional ETFsTraditional mutual funds
794,223
540,413
52,88879,034 73,070
26,7709,649
32,400 41,252
1,247
AUM(M)
0
100,000
200,000
300,000
400,000
500,000
600,000
700,000
800,000
Aggregate Exposure: Derivatives + Financing + Senior
=0 0<10 10<25 25<50 50<100 100<150 150<200 200<300 300<400 >=400
48.11%
32.73%
3.20% 4.79% 4.43%
1.62% 0.58%
1.96% 2.50%
0.08%
F10.2 Alt Strategies mutual funds (Non-index)
6,548
324 5
5,7084,512
454 248
1,829
29,252
1,247
AUM(M)
0
10,000
20,000
30,000
Aggregate Exposure: Derivatives + Financing + Senior
=0 0<10 10<25 25<50 50<100 100<150 150<200 200<300 300<400 >=400
13.06%
0.65% 0.01%
11.39%
9.00%
0.90% 0.49%
3.65%
58.36%
2.49%

Division of Economic and Risk Analysis 81
F10.3 Alt Strategies mutual funds (Index)
107
0
6
86
64
18
32
AUM(M)
0
10
20
30
40
50
60
70
80
90
100
110
Aggregate Exposure: Derivatives + Financing + Senior
=0 10<25 25<50 50<100 100<150 150<200 200<300
34.20%
0.02%
1.79%
27.29%
20.54%
5.85%
10.31%
F10.4 Alt Strategies mutual funds (All)
Fund_Type Alt Strategies mutual funds(Index) Alt Strategies mutual funds(Non-index)
6,655
324 5
5,7134,598
518 266
1,862
29,252
1,247
AUM(M)
0
10,000
20,000
30,000
Aggregate Exposure: Derivatives + Financing + Senior
=0 0<10 10<25 25<50 50<100 100<150 150<200 200<300 300<400 >=400
13.19%
0.64% 0.01%
11.33% 9.12%
1.03% 0.53%
3.69%
57.99%
2.47%

Division of Economic and Risk Analysis 82
F10.5 Traditional mutual funds
667,543
489,651
51,370 60,577 51,71023,590
9,36127,730
558
AUM(M)
0
100,000
200,000
300,000
400,000
500,000
600,000
700,000
Aggregate Exposure: Derivatives + Financing + Senior
=0 0<10 10<25 25<50 50<100 100<150 150<200 200<300 300<400
48.30%
35.43%
3.72% 4.38% 3.74%
1.71% 0.68%
2.01% 0.04%
F10.6 Open-end funds (All)
Fund_Type Alt Strategies mutual funds(Index) Alt Strategies mutual funds(Non-index)Traditional mutual funds
674,198
489,975
51,37566,291 56,308
24,1089,627
29,592 29,8101,247
AUM(M)
0
100,000
200,000
300,000
400,000
500,000
600,000
700,000
Aggregate Exposure: Derivatives + Financing + Senior
=0 0<10 10<25 25<50 50<100 100<150 150<200 200<300 300<400 >=400
47.06%
34.20%
3.59% 4.63% 3.93%
1.68% 0.67%
2.07% 2.08% 0.09%

Division of Economic and Risk Analysis 83
F10.7 Closed-end funds
1,244 1,252 1,298
9,997
10,718
412
AUM(M)
0
1,000
2,000
3,000
4,000
5,000
6,000
7,000
8,000
9,000
10,000
11,000
Aggregate Exposure: Derivatives + Financing + Senior
=0 0<10 10<25 25<50 50<100 100<150
4.99% 5.03% 5.21%
40.11%
43.01%
1.65%
F10.8 Alt Strategies ETFs
575
7
1,425
22
2,808
AUM(M)
0
1,000
2,000
3,000
Aggregate Exposure: Derivatives + Financing + Senior
=0 10<25 50<100 100<150 150<200 200<300
0.11% 1.73%
0.16%
32.83%
0.51%
64.67%

Division of Economic and Risk Analysis 84
F10.9 Traditional ETFs
118,008
49,185
140 586 62
11,442
AUM(M)
0
10,000
20,000
30,000
40,000
50,000
60,000
70,000
80,000
90,000
100,000
110,000
120,000
Aggregate Exposure: Derivatives + Financing + Senior
=0 0<10 10<25 50<100 100<150 300<400
65.77%
27.41%
0.08% 0.33% 0.03%
6.38%
F10.10 ETFs (All)
Fund_Type Alt Strategies ETFs Traditional ETFs
118,013
49,185
215 593 1,487 222,808
11,442
AUM(M)
0
10,000
20,000
30,000
40,000
50,000
60,000
70,000
80,000
90,000
100,000
110,000
120,000
Aggregate Exposure: Derivatives + Financing + Senior
=0 0<10 10<25 50<100 100<150 150<200 200<300 300<400
64.22%
26.77%
0.12% 0.32% 0.81% 0.01% 1.53%
6.23%

Division of Economic and Risk Analysis 85
F10.11 Business development companies
768
2,746
5,451
763
AUM(M)
0
1,000
2,000
3,000
4,000
5,000
6,000
Aggregate Exposure: Derivatives + Financing + Senior
=0 25<50 50<100 100<150
7.89%
28.23%
56.03%
7.85%
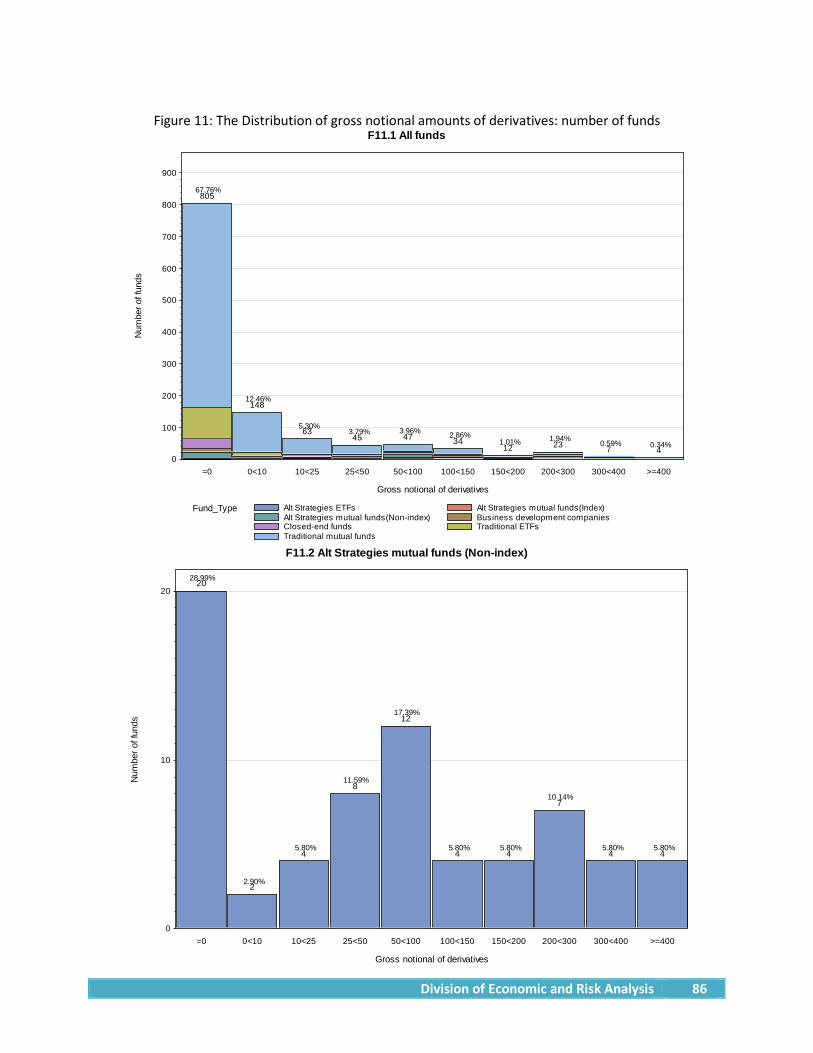
Division of Economic and Risk Analysis 86
Figure 11: The Distribution of gross notional amounts of derivatives: number of funds
F11.1 All funds
Fund_Type Alt Strategies ETFs Alt Strategies mutual funds(Index)Alt Strategies mutual funds(Non-index) Business development companiesClosed-end funds Traditional ETFsTraditional mutual funds
805
148
6345 47 34
12 23 7 4
Num
ber o
f fun
ds
0
100
200
300
400
500
600
700
800
900
Gross notional of derivatives
=0 0<10 10<25 25<50 50<100 100<150 150<200 200<300 300<400 >=400
67.76%
12.46%
5.30% 3.79% 3.96% 2.86%
1.01% 1.94% 0.59% 0.34%
F11.2 Alt Strategies mutual funds (Non-index)
20
2
4
8
12
4 4
7
4 4
Num
ber o
f fun
ds
0
10
20
Gross notional of derivatives
=0 0<10 10<25 25<50 50<100 100<150 150<200 200<300 300<400 >=400
28.99%
2.90%
5.80%
11.59%
17.39%
5.80% 5.80%
10.14%
5.80% 5.80%
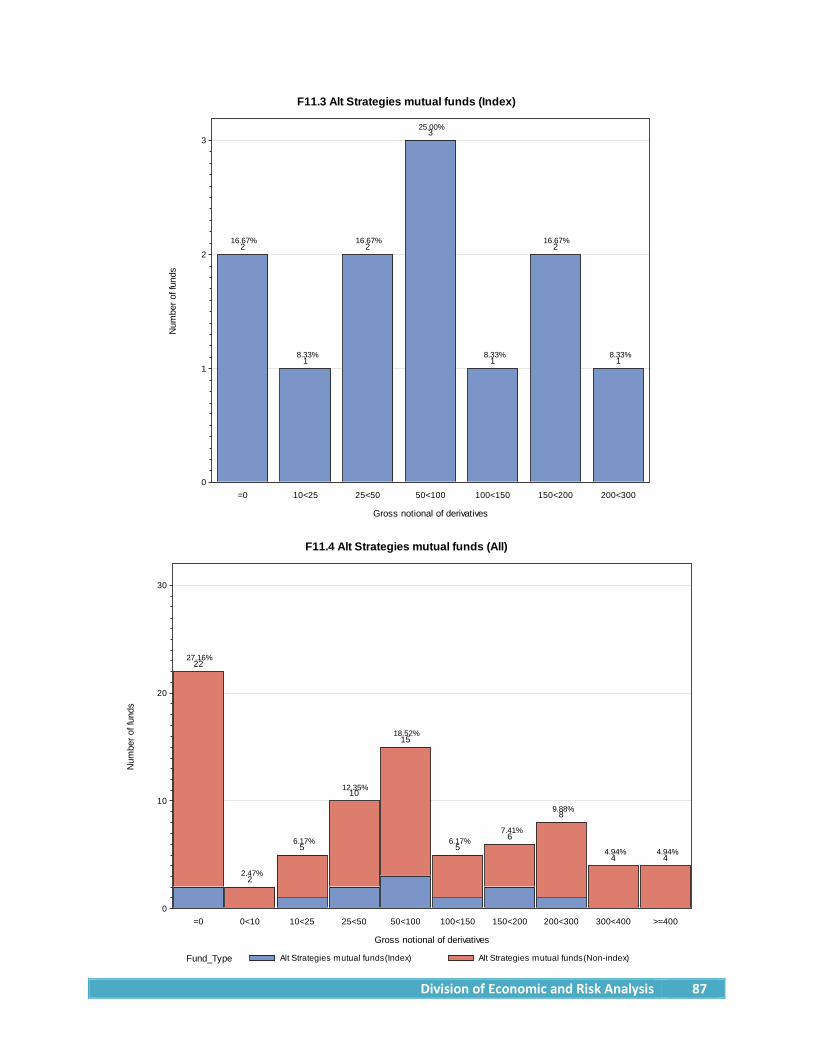
Division of Economic and Risk Analysis 87
F11.3 Alt Strategies mutual funds (Index)
2
1
2
3
1
2
1
Num
ber o
f fun
ds
0
1
2
3
Gross notional of derivatives
=0 10<25 25<50 50<100 100<150 150<200 200<300
16.67%
8.33%
16.67%
25.00%
8.33%
16.67%
8.33%
F11.4 Alt Strategies mutual funds (All)
Fund_Type Alt Strategies mutual funds(Index) Alt Strategies mutual funds(Non-index)
22
2
5
10
15
56
8
4 4
Num
ber o
f fun
ds
0
10
20
30
Gross notional of derivatives
=0 0<10 10<25 25<50 50<100 100<150 150<200 200<300 300<400 >=400
27.16%
2.47%
6.17%
12.35%
18.52%
6.17% 7.41%
9.88%
4.94% 4.94%

Division of Economic and Risk Analysis 88
F11.5 Traditional mutual funds
642
126
4828 23 19
5 6 2
Num
ber o
f fun
ds
0
100
200
300
400
500
600
700
Gross notional of derivatives
=0 0<10 10<25 25<50 50<100 100<150 150<200 200<300 300<400
71.41%
14.02%
5.34% 3.11% 2.56% 2.11%
0.56% 0.67% 0.22%
F11.6 Open-end funds (All)
Fund_Type Alt Strategies mutual funds(Index) Alt Strategies mutual funds(Non-index)Traditional mutual funds
664
128
5338 38
2411 14 6 4
Num
ber o
f fun
ds
0
100
200
300
400
500
600
700
Gross notional of derivatives
=0 0<10 10<25 25<50 50<100 100<150 150<200 200<300 300<400 >=400
67.76%
13.06%
5.41% 3.88% 3.88%
2.45% 1.12% 1.43% 0.61% 0.41%

Division of Economic and Risk Analysis 89
F11.7 Closed-end funds
31
78
7
5
Num
ber o
f fun
ds
0
10
20
30
40
Gross notional of derivatives
=0 0<10 10<25 25<50 50<100
53.45%
12.07% 13.79%
12.07%
8.62%
F11.8 Alt Strategies ETFs
1
2 2
7
1
9
Num
ber o
f fun
ds
0
1
2
3
4
5
6
7
8
9
Gross notional of derivatives
=0 10<25 50<100 100<150 150<200 200<300
4.55%
9.09% 9.09%
31.82%
4.55%
40.91%

Division of Economic and Risk Analysis 90
F11.9 Traditional ETFs
99
13
2 31
Num
ber o
f fun
ds
0
10
20
30
40
50
60
70
80
90
100
Gross notional of derivatives
=0 0<10 50<100 100<150 300<400
83.90%
11.02%
1.69% 2.54% 0.85%
F11.10 ETFs (All)
Fund_Type Alt Strategies ETFs Traditional ETFs
100
13
24
10
1
9
1
Num
ber o
f fun
ds
0
10
20
30
40
50
60
70
80
90
100
Gross notional of derivatives
=0 0<10 10<25 50<100 100<150 150<200 200<300 300<400
71.43%
9.29%
1.43% 2.86%
7.14%
0.71%
6.43%
0.71%

Division of Economic and Risk Analysis 91
F11.11 Business development companies
10
Num
ber o
f fun
ds
0
1
2
3
4
5
6
7
8
9
10
Gross notional of derivatives
=0
100.00%
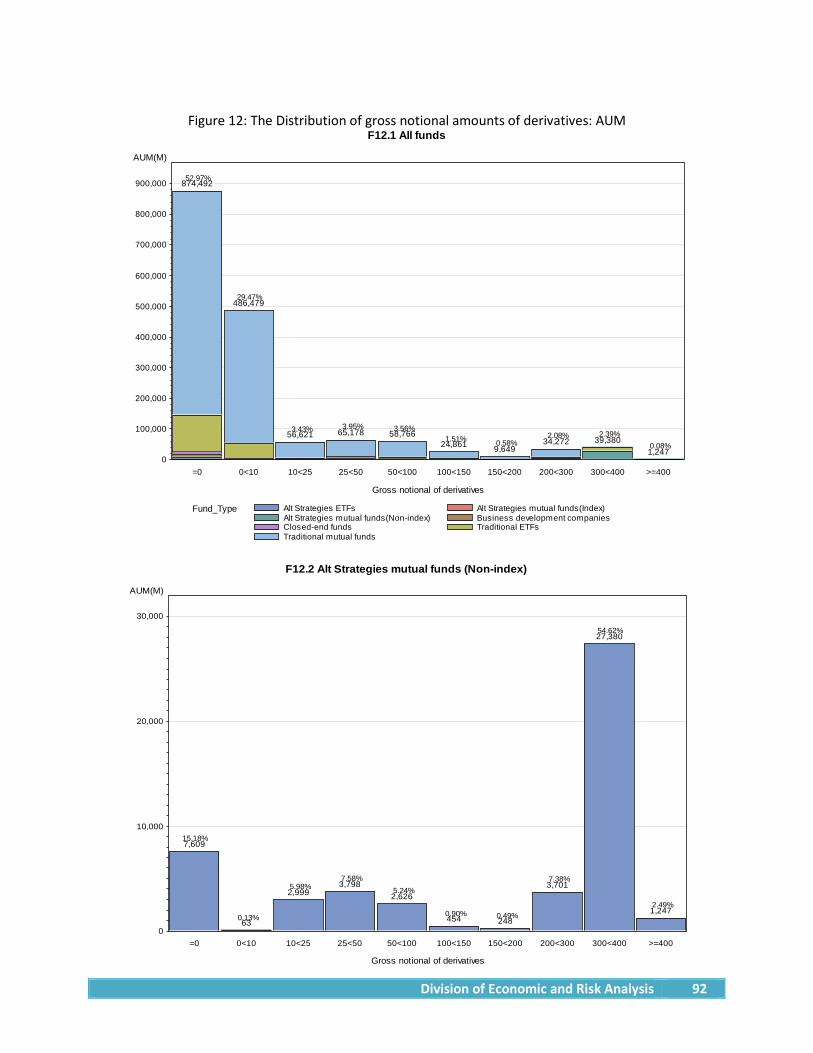
Division of Economic and Risk Analysis 92
Figure 12: The Distribution of gross notional amounts of derivatives: AUM
F12.1 All funds
Fund_Type Alt Strategies ETFs Alt Strategies mutual funds(Index)Alt Strategies mutual funds(Non-index) Business development companiesClosed-end funds Traditional ETFsTraditional mutual funds
874,492
486,479
56,621 65,178 58,76624,861 9,649
34,272 39,3801,247
AUM(M)
0
100,000
200,000
300,000
400,000
500,000
600,000
700,000
800,000
900,000
Gross notional of derivatives
=0 0<10 10<25 25<50 50<100 100<150 150<200 200<300 300<400 >=400
52.97%
29.47%
3.43% 3.95% 3.56% 1.51% 0.58%
2.08% 2.39% 0.08%
F12.2 Alt Strategies mutual funds (Non-index)
7,609
63
2,9993,798
2,626
454 248
3,701
27,380
1,247
AUM(M)
0
10,000
20,000
30,000
Gross notional of derivatives
=0 0<10 10<25 25<50 50<100 100<150 150<200 200<300 300<400 >=400
15.18%
0.13%
5.98% 7.58%
5.24%
0.90% 0.49%
7.38%
54.62%
2.49%

Division of Economic and Risk Analysis 93
F12.3 Alt Strategies mutual funds (Index)
107
0
12
79
64
18
32
AUM(M)
0
10
20
30
40
50
60
70
80
90
100
110
Gross notional of derivatives
=0 10<25 25<50 50<100 100<150 150<200 200<300
34.20%
0.02%
3.89%
25.19%
20.54%
5.85%
10.31%
F12.4 Alt Strategies mutual funds (All)
Fund_Type Alt Strategies mutual funds(Index) Alt Strategies mutual funds(Non-index)
7,717
63
2,9993,810
2,705
518 266
3,734
27,380
1,247
AUM(M)
0
10,000
20,000
30,000
Gross notional of derivatives
=0 0<10 10<25 25<50 50<100 100<150 150<200 200<300 300<400 >=400
15.30%
0.13%
5.95% 7.55%
5.36%
1.03% 0.53%
7.40%
54.28%
2.47%

Division of Economic and Risk Analysis 94
F12.5 Traditional mutual funds
729,830
434,523
50,692 54,381 52,15122,863
9,36127,730
558
AUM(M)
0
100,000
200,000
300,000
400,000
500,000
600,000
700,000
800,000
Gross notional of derivatives
=0 0<10 10<25 25<50 50<100 100<150 150<200 200<300 300<400
52.81%
31.44%
3.67% 3.93% 3.77% 1.65%
0.68% 2.01%
0.04%
F12.6 Open-end funds (All)
Fund_Type Alt Strategies mutual funds(Index) Alt Strategies mutual funds(Non-index)Traditional mutual funds
737,547
434,587
53,692 58,191 54,85623,381 9,627
31,464 27,9381,247
AUM(M)
0
100,000
200,000
300,000
400,000
500,000
600,000
700,000
800,000
Gross notional of derivatives
=0 0<10 10<25 25<50 50<100 100<150 150<200 200<300 300<400 >=400
51.49%
30.34%
3.75% 4.06% 3.83% 1.63% 0.67%
2.20% 1.95% 0.09%
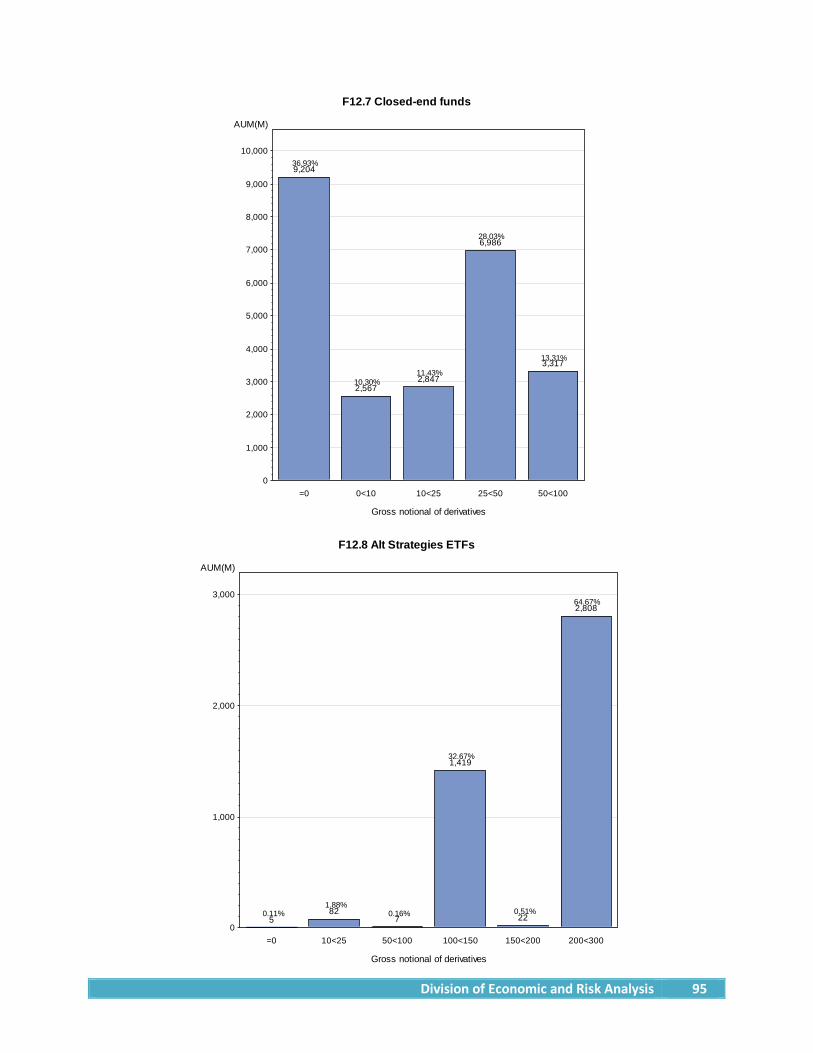
Division of Economic and Risk Analysis 95
F12.7 Closed-end funds
9,204
2,5672,847
6,986
3,317
AUM(M)
0
1,000
2,000
3,000
4,000
5,000
6,000
7,000
8,000
9,000
10,000
Gross notional of derivatives
=0 0<10 10<25 25<50 50<100
36.93%
10.30% 11.43%
28.03%
13.31%
F12.8 Alt Strategies ETFs
582
7
1,419
22
2,808
AUM(M)
0
1,000
2,000
3,000
Gross notional of derivatives
=0 10<25 50<100 100<150 150<200 200<300
0.11% 1.88%
0.16%
32.67%
0.51%
64.67%

Division of Economic and Risk Analysis 96
F12.9 Traditional ETFs
118,008
49,325
586 62
11,442
AUM(M)
0
10,000
20,000
30,000
40,000
50,000
60,000
70,000
80,000
90,000
100,000
110,000
120,000
Gross notional of derivatives
=0 0<10 50<100 100<150 300<400
65.77%
27.49%
0.33% 0.03%
6.38%
F12.10 ETFs (All)
Fund_Type Alt Strategies ETFs Traditional ETFs
118,013
49,325
82 593 1,480 222,808
11,442
AUM(M)
0
10,000
20,000
30,000
40,000
50,000
60,000
70,000
80,000
90,000
100,000
110,000
120,000
Gross notional of derivatives
=0 0<10 10<25 50<100 100<150 150<200 200<300 300<400
64.22%
26.84%
0.04% 0.32% 0.81% 0.01% 1.53%
6.23%

Division of Economic and Risk Analysis 97
F12.11 Business development companies
9,729
AUM(M)
0
1,000
2,000
3,000
4,000
5,000
6,000
7,000
8,000
9,000
10,000
Gross notional of derivatives
=0
100.00%
![Companies Act 2017...4 No. of 2017] Companies 28. Registered office and change of registered office 29. Publicationofnameofcompany 30. Records kept at company’s registered office](https://static.fdocuments.us/doc/165x107/5e4d12f2b8df3e556a0d6b32/companies-act-4-no-of-2017-companies-28-registered-office-and-change-of-registered.jpg)