NATURAL CLIMATIC FORCING - LTRR Climatic Forcing... · NATURAL CLIMATIC FORCING ... …

Use of climatic data for improving epidemiological surveillance
Centre For Public Health Intervention TechnologyNational Institute Health Research And Development

Global warming and Climate change
1. Introduction

The increasing greenhouse gasses: CO2: 31% CH4: 51% N2O: 17%
Earth mean surface temperature: Increase 0,2-0,4 ºC / decade
Sea level: Predicted to rise 15-95 cm at
2100
Source:IPCC

Source : WHO; climate change and human health 2003

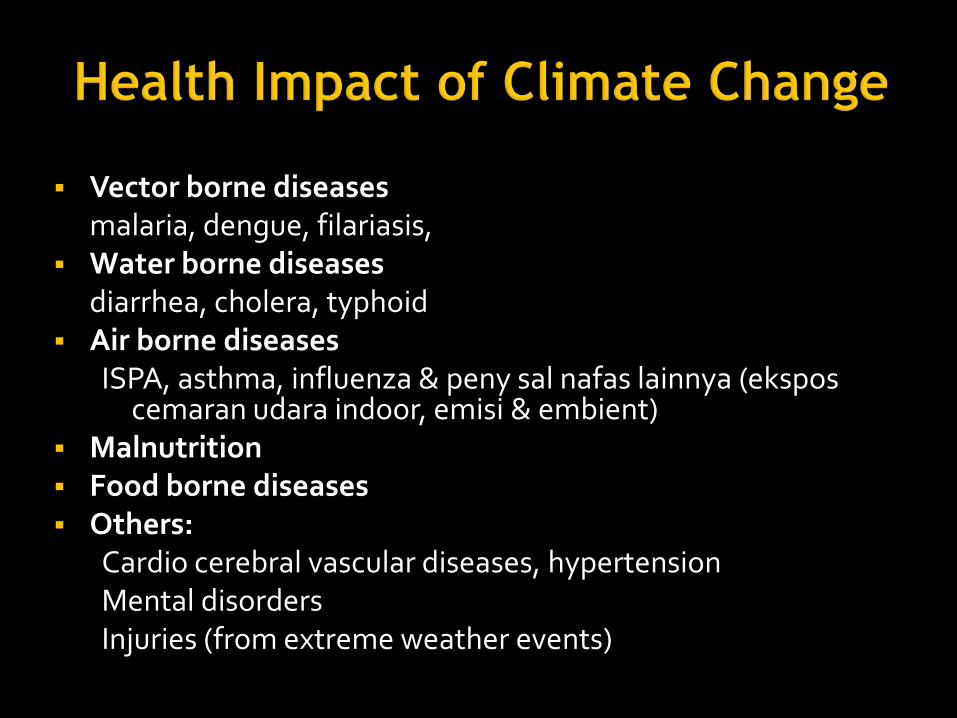
Vector borne diseasesmalaria, dengue, filariasis,
Water borne diseasesdiarrhea, cholera, typhoid
Air borne diseasesISPA, asthma, influenza & peny sal nafas lainnya (ekspos
cemaran udara indoor, emisi & embient) Malnutrition Food borne diseases Others:
Cardio cerebral vascular diseases, hypertensionMental disordersInjuries (from extreme weather events)

● Malaria● Hemorrhagic fever● Cholera/diarrhea
Every year:● Undernutrition kills 2,7 million people● Diarrhea kills 1,8 million people● Malaria kills 1,1 million people

Source : WHO, 2007


1) How much is the health impact of climate change in Indonesia?
2) What efforts have been made in climate change adaptation for the health sector?
3) What is the appropriate system/model that needed in adaptation against climate change impact on health?

MODEL DEVELOPMENT
MODELAPPLICATION
Identifikasi Risiko
Early survey in several provinces• Climate• Air quality• Water quality and
quantity• Vector borne
disease• Digestive tract• Respiratory tract• Nutritional
problem
DATABASELINE • Surveillance
• Adaptation• Health service• Environmental
health efforts• IVM• Fast response• Emergency
responseetc.
• Surveillance• Adaptation• Health service• Environmental
health efforts• IVM• Fast response• Emergency
responseetc.
• Effort• Impactetc.
EVALUATION

Step 1 : Data baseline survey in “kabupaten” and city in 6 provinces
Objective : Get the disease patterns due to climate change in Indonesia
Result : Availability and completion of demography, climate, and
disease data for 5-12 years Routine data of risk factors, such as air quality, water
quality, and vector (no routine data, collected in just few spots so it can’t represent overall area condition)
The recording of many disease case based on varies characteristic and age group cause some difficulties in analysis

Information about Climate Change Result NotesKnowledge about CC and its impact to health
40% Vector borne disease
Participation in CC socialization 15%
Socialization done by Health Department
15%
Participation in CC adaptation action 15% Socialization, promkes
Availability of CC adaptation in planning
15%
Identification of CC-related disease 30%
Availability of special unit dealingwith health impact of CC
15%

Climate data Availability of climate data varies in every subdistrict
and city, but could be completed from province and national level
Available up to daily data
Demography data Availability of demography data couldn’t reach 15 years
period (average: 7-10 years) Variation in age grouping data Annual Total Fertility Rate data is not always available

Air pollution data Every sub district and city doesn’t have any
regular data spot check Not available in some years Data spreads in many agencies: Regional
Development Planning Agency , Ministry of Environment , Regional Health office , university, etc
Data available only in certain area Data is not recorded in the PROFILE or
regional statistics

Clean water data No regular data sample test Type of data varies between districts / cities:
coverage, type of facilities, improve/unimprove
Data spreads in many agencies: Regional Development Planning Agency , Ministry of Environment , Regional Health office , university, etc

The data vector borne diseases (malaria, dengue, chikungunya, Ispa, etc.):
Not available in some areas, depending on the number of cases / endemicity
Available between 7-10 years Some data are only available yearly (not monthly), eg.
API Greatly depending on whether or not the recording
system of reporting Data msebar disease in bebara agencies Variations in the age grouping

SURVEILANS TEMUAN LAPANGAN
Data source Poli, Pustu, Posyandu
Diagnosis Clinical (malaria: LAB)
Data collectingRecapitulation of report
Data processing and analysisCompilation, deskriptif
ReportingMonthly, weekly
Human resources Concurrent tasks, program officer
Training That not all been trained
Supporting laboratoryNot all districts / cities have supporting laboratory
Ability for the diagnosis Partly constraints diagnosis

0.48 0.67 0.60
2.33
0.66
0.48
0.69
415
162
272
433 447
798
110
0
100
200
300
400
500
600
700
800
900
(0.50)
-
0.50
1.00
1.50
2.00
2.50
1 3 5 7 9 11 1 3 5 7 9 11 1 3 5 7 9 11 1 3 5 7 9 11 1 3 5 7 9 11
2005 2006 2007 2008 2009
C.hujan
Insiden
malaria
Tahun/Bulan
Insiden malaria C.hujan Linear (Insiden malaria) Linear (C.hujan)

0.48
0.72 0.93
2.33
0.86 0.69
0.35
28.5 28.2 28.4
28.1 27.227.5
29.3
15
17
19
21
23
25
27
29
31
(0.50)
-
0.50
1.00
1.50
2.00
2.50
1 3 5 7 9 11 1 3 5 7 9 11 1 3 5 7 9 11 1 3 5 7 9 11 1 3 5 7 9 11
2005 2006 2007 2008 2009
Suhu
Insiden
malaria
Tahun/Bulan
Insiden malaria Suhu Linear (Insiden malaria) Linear (Suhu)

5.1
8.8
23.2
14.9698
475368
525
306
874
473
0
100
200
300
400
500
600
700
800
900
1000
-5.0
0.0
5.0
10.0
15.0
20.0
25.0
1 3 5 7 9 11 1 3 5 7 9 11 1 3 5 7 9 11 1 3 5 7 9 11 1 3 5 7 9 11 1 3 5 7 9 11 1 3 5 7 9 11
2003 2004 2005 2006 2007 2008 2009
Curah
hujan
IR
DBD
Tahun/Bulan
IR DBD Curah hujan Linear (IR DBD) Linear (Curah hujan)

26.9
25.9
27.9
23.5
24.0
24.5
25.0
25.5
26.0
26.5
27.0
27.5
28.0
28.5
-0.5
0.0
0.5
1.0
1.5
2.0
2.5
3.0
3.5
1 3 5 7 9 11 1 3 5 7 9 11 1 3 5 7 9 11 1 3 5 7 9 11 1 3 5 7 9 11 1 3 5 7 9 11 1 3 5 7 9 11
2003 2004 2005 2006 2007 2008 2009
Suhu
Insidens
DBD
Bulan/Tahun
Insidens DBD Suhu rata-rata Linear (Insidens DBD) Linear (Suhu rata-rata)

• Availability and completeness of demographic data, climate and disease ranged from 5-12 years
• Unavailability of air quality regular data in each district /city
• No available vector data • Existing data have not been processed and
analyzed in an optimal • From the available data (limited), the trend of
climate variability in the incidence of disease is not 'consistent'

Objective: Obtain a model of health impacts of climate change surveillance
Specific objective1. To determine the variables needed in the surveillance
system on the health impacts of climate change.2. To identify the stakeholders who play a role in the
development of surveillance systems.3. To obtain a model of health impacts of climate change
surveillance.

F
E
E
D
B
A
C
K
FOLLOW UP
ANALYSIS & DATA INTERPRETATIONweekly
DATA MANAGEMENTweekly
REPORTING
DATA SOURCESRecording and reporting
( weekly)
DATA COLLECTIONweekly,
•Deseases1 Malaria2 Dengue3 Diarhea4 Pneumonia5 ILI
6 PTM
•Fakt. Risiko7. Curah hujan8. Suhu9. Kelembaban
• Fakt. Risiko1. Malnutrisi2. Vektor3. Kenaikan muka air laut4. Disaster
Result1 Graphic2 Distribution3 Trend4 Mapping (GIS)
•SubditSurveillance•BMKG•Community Health Centre•Health Distrct Office•Subdit Surv.eillance•Loka BTKL•BMKG Station•Miniistry of Env.

1) Rapid asessment (identification
surveillance)
2) Surveillance Model Formulation
3) Surveillance software development

Climate DateRainfall, Temp
(BMKG*)
Overlay Deseases Vs climate
(District level)
DeseasesDataSurveillance
(Center)
Data Import Deseases
climate(NIHRD)
Overlay Deseases Vs climate
(Province level)
Overlay Deseases Vs climate
(National level)
Data Processing and Analysis
GraphicGIS
Early WarningAdaptation Strategy
12. Alur

1) The regions of endemic diseases and specific health problems2) Regional 'vulnerable' (National board of climate change)
2) Areas where the EWARS program has been running

1) Trial of surveillance systems on the health
impacts of climate change
2) Development of Modelling Prediction
Dengue Incidence In Indonesia