Use of Canvas LMS Student and Item Analysis Reports to ...
12
2019 Proceedings of the EDSIG Conference ISSN: 2473-4901 Cleveland Ohio v5 n4971 2019 ISCAP (Information Systems and Academic Professionals) Page 1 http://iscap.info; http://proc.iscap.info Use of Canvas LMS Student and Item Analysis Reports to Assess Question Quality and Instrument Reliability in an Introductory Information Systems Course Michael Smith [email protected] Georgia Institute of Technology Atlanta GA Abstract This paper describes how standard student and item response data produced by a learning management system can be automated using unexceptional spreadsheet techniques to perform item analysis and calculate instrument reliability as part of assessment of learning. Using the results of an analysis of real test results, we show how simple guidelines can be used to suggest questions within learning groups to the dropped or modified. We demonstrate how the reliability of item subgroups based on learning objectives can be automated. Having quick access to Keywords: Assessment of learning, item analysis 1. INTRODUCTION Assessment of learning (AOL) requires time- consuming calculations. Fortunately, automated testing tools can perform some calculations automatically and provide data for others. This offers the possibility of making assessment of learning an ongoing process from which students can benefit throughout the term rather than something done at the end of the term to fulfill reporting requirements. Necessary to assessment of learning is the administration of reliable and valid assessment instruments, for example, tests. An instrument is reliable to the extent that it measures consistently and is valid to the extent that it measures what it is designed to measure. (National Council for Measurement in Education, 2018) Reliability is fundamental because an instrument cannot be valid unless it is reliable. Since reliability is a property of the scores on a test from a specific group of test-takers, it should be calculated each time the test is administered. Designers of assessments must also deal with practical limits on the length of tests. Each question should add to our ability to assess the level of mastery of the material and to discriminate between students who have mastered the material and those who have not. Automating the process of estimating reliability and for measuring the discriminating ability of each question would make the work of creating reliable and efficient instruments easier. This paper describes the use of reports provided by a common learning management system (LMS), along with spreadsheets, to automate item analysis for the purpose of improving the quality of questions and the reliability of tests. The analysis was done using data from two sections of a single course after the 2019 spring term. This was the first time an item level analysis had been done for the course. Using recommendations based on common interpretations of item metrics, the results indicated that roughly half the questions used on
Transcript of Use of Canvas LMS Student and Item Analysis Reports to ...

2019 Proceedings of the EDSIG Conference ISSN: 2473-4901
Cleveland Ohio v5 n4971
2019 ISCAP (Information Systems and Academic Professionals) Page 1 http://iscap.info; http://proc.iscap.info
Use of Canvas LMS Student and Item Analysis Reports to Assess Question Quality
and Instrument Reliability in an Introductory Information Systems Course
Michael Smith
[email protected] Georgia Institute of Technology
Atlanta GA
Abstract This paper describes how standard student and item response data produced by a learning management system can be automated using unexceptional spreadsheet techniques to perform item analysis and calculate instrument reliability as part of assessment of learning. Using the results of an analysis of real test results, we show how simple guidelines can be used to suggest questions within learning groups to the dropped or modified. We demonstrate how the reliability of item subgroups based on learning objectives can be automated. Having quick access to
Keywords: Assessment of learning, item analysis
1. INTRODUCTION Assessment of learning (AOL) requires time-
consuming calculations. Fortunately, automated testing tools can perform some calculations automatically and provide data for others. This offers the possibility of making assessment of learning an ongoing process from which students can benefit throughout the term rather than
something done at the end of the term to fulfill reporting requirements. Necessary to assessment of learning is the administration of reliable and valid assessment instruments, for example, tests. An instrument is reliable to the extent that it measures
consistently and is valid to the extent that it measures what it is designed to measure. (National Council for Measurement in Education, 2018) Reliability is fundamental because an instrument cannot be valid unless it is reliable. Since
reliability is a property of the scores on a test from a specific group of test-takers, it should be calculated each time the test is administered.
Designers of assessments must also deal with practical limits on the length of tests. Each
question should add to our ability to assess the level of mastery of the material and to discriminate between students who have mastered the material and those who have not. Automating the process of estimating reliability
and for measuring the discriminating ability of each question would make the work of creating reliable and efficient instruments easier. This paper describes the use of reports provided by a common learning management system (LMS), along with spreadsheets, to automate
item analysis for the purpose of improving the quality of questions and the reliability of tests. The analysis was done using data from two sections of a single course after the 2019 spring term. This was the first time an item level analysis had been done for the course.
Using recommendations based on common interpretations of item metrics, the results indicated that roughly half the questions used on

2019 Proceedings of the EDSIG Conference ISSN: 2473-4901
Cleveland Ohio v5 n4971
2019 ISCAP (Information Systems and Academic Professionals) Page 2 http://iscap.info; http://proc.iscap.info
tests in the course should be improved and that
the measurement of student performance against learning objectives was deficient.
The next sections describe the course, the tests that were administered, and the analyses that were done. The results of the analyses are then discussed. Finally, conclusions, limitations, and next steps are presented.
2. THE COURSE
The course is the introduction to information technology at the business college of a major research university in the United States of America. Material covered emphasizes the nature of information and how innovative companies use
it to gain competitive advantage. The course is a requirement for the BSBA degree and is listed as a requirement or elective in other programs. The course is updated every term to include new information on featured companies as well as instances of currently emerging technologies such
as block chain, machine learning, and the Internet of Things. The course also has an important hands-on component including differentiating Excel features, writing SQL queries using aggregation and joins, association rules and decision tree analysis using R, and simple social graph analysis using Gephi. Most students have
Excel with Microsoft Office but they can also access it through Office365, for which the
university has a site license. For Structured Query Language (SQL), MySQL through phpMyAdmin is used, which is available for free as part of XAMPP. R, RStudio (an IDE for R), and Gephi are also
available for free. The learning objectives of the course are that students demonstrate: 1. understanding of fundamental IT and IS
concepts 2. understanding of the strategic role of IS in the
modern business enterprise. 3. awareness of current IS management issues
and trends. 4. a base level of skill with several data
management, visualization, and analysis concepts / methods / tools (Excel, R, SQL, Gephi)
Assessments were done after the 2019 spring term. There were two sections. The combined enrollment was 62, which is considered low compared to 186, 180, 140, and 158 in the previous 4 fall and spring terms. The next section
describes the tests.
3. THE TESTS
Three tests were given during the term with the third given close to the last allowable testing day.
Combined, the tests included all material students were responsible for. Final exam results were not used because students were not required to take the final if they were satisfied with their results on the midterms. Each test included 35 multiple choice questions.
Each question on each test was assigned to a learning objective using these criteria: 1. Understanding of fundamental IT and IS
concepts Questions related to data, information, and
systems, management, specific technologies, or their use. Also some questions about fundamental business concepts e.g. Porter’s 5 Forces, disruption, 1 and 2-sided markets, and creation/appropriation of value.
2. Understanding of the strategic role of IS in the modern business enterprise.
Questions related to strategic use of IS use by firms featured in the coursework such as Netflix, Facebook, Google, Walmart, Inditex, Zara, etc. and any theory underlying their actions. Also questions related to strategic vs. tactical IS and “real-time” business.
3. Awareness of current IS management issues
and trends Questions related to disruptive and emerging
technologies, the sharing economy, data mining, sustainability, open source software, cloud computing, mobile commerce, security, privacy, ethics, net neutrality and search
(including abuses.) 4. A base level of skill with several data
management, visualization, and analysis concepts / methods / tools (Excel, R, SQL, Gephi) Questions related specifically to a tool that was used (Excel, SQL), the theory upon which
the tool or its used was based (relational theory for SQL, R, Gephi), or on the interpretation of results obtained from the use of the tool (Excel, SQL.)
Tests were given in a single-proctor environment in a classroom. All tests were closed-book,
closed-notes. Students took the tests on their own laptops through the quiz feature of the Canvas learning management system. To ensure that students could not access other resources through their laptops, tests could only be accessed through the Respondus Lockdown
Browser (LDB). Appendix A contains details of how tests were administered in Canvas and the

2019 Proceedings of the EDSIG Conference ISSN: 2473-4901
Cleveland Ohio v5 n4971
2019 ISCAP (Information Systems and Academic Professionals) Page 3 http://iscap.info; http://proc.iscap.info
measures used to prepare students to use the
Lockdown Browser. The next section describes how items were analyzed.
4. ANALYSES Canvas’s Quiz Statistics feature produces a student analysis report in CSV format that indicates for each student and each question whether the student responded correctly. Canvas also produces an item analysis report in CSV
format that includes, for each question, the percentage of students who responded correctly, and the point biserials of each response to each question. The item analysis report divides students into three groups: high (top scoring 27%), medium (middle 46%), and low scoring
(lowest 27%), and, for each question, indicates the number of students in each group who answered correctly The three item analysis reports were pasted into and Excel workbook and combined. A column indicating the learning objective for each question
was added and populated by hand and unneeded columns were deleted. An excerpt from the combined item analysis report is presented in Appendix B. Using the item analysis report, for each question on each test, the item difficulty, or p-value, was
calculated.i Difficulty is the percentage of students who attempted the question and
answered it correctly. It is not a measure of the intrinsic difficulty of a question but of the relative frequency with which those taking the test choose the correct response. (Thorndike, 1991)
Using the item analysis report, for each question, a discrimination index was calculated by subtracting the p-value of the lowest scoring 27% of students from that of the highest scoring 27%. (Kline, 1999) This produces a value in the range -1 to 1 with 1 indicating that all of the high scoring
group answered correctly while none of the low scoring group did. A 0 indicates no difference in the performance of the groups and therefore uselessness as a discriminator. A negative
discrimination index indicates that the students in the high scoring group scored worse on the question, as a percentage, than the students in
the low scoring group. The three student analysis reports were pasted into separate Excel workbooks. Unneeded columns were deleted. Within each workbook, a worksheet for each learning objective was
created and response data for each question was copied to the appropriate worksheet. An excerpt
from a student analysis report prepared and used
for analysis is presented in Appendix C. Using the student analysis report for each test,
Cronbach’s alpha (Cronbach, 1951) was calculated to measure the internal consistency of item subgroups consisting of questions associated with each of the learning objectives.ii Alpha ranges from 0 to 1. An alpha close to 1 indicates that the items have shared covariance and probably measure the same underlying concept.
(Goforth, 2015) For each question on each test, alpha-if-dropped was also calculated. Alpha was not considered useful for entire tests because each contained questions on several unrelated concepts. (Nunnally J, 1994) (Cohen R, 2010) The next section describes the results of the
analyses and the interpretation and use of them.
5. RESULTS Item Difficulty and Discrimination Analysis began with an overview of item difficulty. Since most questions on tests in the course have
four responses, .74 was considered the ideal difficulty. (Lord, 1952). Table 1 displays a summarization of difficulty by test and learning objective that was created from the combined item analysis report using the pivot table feature of Excel.
Test Learning Objective T1 T2 T3 Total
LO 1 0.63 0.77 0.95 0.70
LO 2 0.69 0.89 n.a. 0.74
LO 3 0.86 0.72 0.82 0.78
LO 4 0.66 0.82 0.73 0.73
All 0.66 0.78 0.78 0.74
Table 1. Average item difficulty by test and
learning objective
These results look acceptable at first. Low student performance on the first test (.66) can be explained by the usual adjustments to the
requirements of the course. On the second and third tests, the scores exceed the ideal difficulty but not by much. Considering difficulty by learning objective points to LO 1 questions being a little more difficult than desired and those for LO 3 being less difficult. However, a histogram plot of item difficulty indicates a problem hidden
in the use of averages.

2019 Proceedings of the EDSIG Conference ISSN: 2473-4901
Cleveland Ohio v5 n4971
2019 ISCAP (Information Systems and Academic Professionals) Page 4 http://iscap.info; http://proc.iscap.info
Figure 1 shows that there were many questions
of low difficulty on the tests. The acceptable averages were therefore due to the presence of a number of exceptionally difficult questions that
moderated the effects of the numerous “easy” questions.
Figure 1. Histogram plot of frequency by item difficulty range
As well, item difficulty and discrimination should be negatively correlated. This could not be tested, however, since the results for difficulty were moderately skewed (-0.62), as is clear in the histogram plotiii, and this could not be corrected by a log transformation. Nevertheless, a
scatterplot of discrimination index by item difficulty, shown in Figure 2, does point out
problems.
Figure 2. Scatterplot of Item Discrimination Index by Difficulty
There is a group of relatively difficult questions
that were not useful discriminators located below the trend line on the left half of the plot. There is also a large group of questions on the “easy” end of difficulty. So, despite question averages being acceptable,
a cursory look at item difficulties and
discrimination indices reveals the presence of
problematic questions. The next step is to identify them and decide what to do with each of them.
Table 2Error! Reference source not found. displays guidelines (Ronco, 2013) that were sued to suggest an action for each question based on its difficulty and discrimination index. The guidelines place each question into 1 of 5 groups.
Difficulty Discrim Index Indication
< .35
(“hard”)
<.2 (1) Poor item. Remove or revise
>=.2 (2) Retain but use sparingly
.35 - .85 <.2 (3) Remove or revise
to be more useful as a discriminator
>=.2 (4) Ideal
> .85 (“easy”)
Does not
matter
(5) “Easy”. Retain only if the item measures essential material that everyone must know.
Table 2. Indications based on item difficulty and discrimination
Group 1 includes questions that few students
answered correctly with students in the high scoring group doing little better, as a percentage, than students in the low scoring group. This could be due to poor question wording. It could also be
an indication that that the topic was not well covered in the course or that students did not expect to be asked about the topic.
Group 2 includes questions that were hard but were useful as discriminators. These may be used sparingly, for example, to “separate the As from the Bs”. We consider it desirable to have some of these questions on tests.
Group 3 includes questions of acceptable difficulty that, nevertheless, don’t discriminate well. Since discrimination should increase with difficulty, these questions could be made more difficult although care should be taken not to move them into Group 2.
Group 4 consists of “ideal” questions—those of acceptable difficulty that are useful as discriminators. Group 5 includes questions that were too “easy” to serve as useful discriminators. Given the
limited amount of time for questions on a test, these should not be used unless they measure knowledge of essential material. However, they could be modified.

2019 Proceedings of the EDSIG Conference ISSN: 2473-4901
Cleveland Ohio v5 n4971
2019 ISCAP (Information Systems and Academic Professionals) Page 5 http://iscap.info; http://proc.iscap.info
Table 3 displays an overview of recommendations
for questions under each learning objective created from the combined item analysis report using the pivot table feature of Excel.
Learning Objective
Indication 1 2 3 4 Tot.
(1) Poor item. Remove or revise 2 0 1 0 3
(2) Retain but use sparingly 1 1 0 1 3
(3) Remove or
revise to be more useful as a discriminator 2 0 2 3 7
(4) Ideal 15 7 13 19 54
(5) “Easy”. Retain
only if the item measures essential material that everyone must know. 6 7 15 10 38
Total 26 15 31 33 105
Table 3. Recommendations based on (Ronco, 2013)
Under categories (1), (3), and (5) there are 48 questions to be reviewed. Since this data is in an
Excel pivot table, the questions ids can be accessed by clicking to “drill down” in each cell.
The wording of these questions can be reviewed as can the coverage of the associated topic and notification that it will be included in the test. As well, the content knowledge tested on each
question can be reviewed since a question may not discriminate well if it measures many content areas and cognitive skills. (Mehrens & Lehmann, 1973) For guidance in revising responses, the point
biserial correlations of incorrect responses, or distractors, from the item analysis report can be consulted. According to the combined item analysis report, there are 123 responses with point biserials between -.05 and .05, a range that
indicates “non-functioning distractors”. (Tarrant M, 2009) Missing or weak negative correlations
indicate distractors that aren’t differentiating between high and low performers on the test. These distractors should be replaced or even eliminated. There is evidence that 2 or 3 distractors may serve as well as 4 or 5 to discriminate (Haladyna, 1993) so this would be easily accomplished with questions in this course.
Internal Consistency of Item Sets
The following tables present the alphas calculated for each learning objective’s questions on each test as well as improvements to alpha that could
be made by removing one or more items from each item set. An alpha of >=.7 was used to indicate “good” internal consistency. (Kline, 1999)
Item Set
α No.
items
No. of items whose
removal improves α
α with items
removed
LO 1 0.56 14 1 0.61
LO 2 0.47 11 1 0.55
LO 3 n.a. 1 n.a. n.a.
LO 4 0.63 8 2 0.66 Table 4. Internal Consistency of Learning Objective Items Sets in Test 1
Item Set α
No. items
No. of items whose
removal improves α
α with items
removed
LO 1 0.55 10 3 0.67
LO 2 0.44 4 2 0.68
LO 3 0.62 12 3 0.72
LO 4 0.62 9 2 0.73 Table 5. Internal Consistency of Learning Objective Items Sets in Test 2
Item Set α
No. items
No. of items whose
removal improves α
α with items
removed
LO 1 n.a. 1 n.a. n.a.
LO 2 n.a. 0 n.a. n.a.
LO 3 0.68 18 1 0.69
LO 4 0.63 16 4 0.69 Table 6. Internal Consistency of Learning
Objective Items Sets in Test 3
Even with items removed from each set to improve alpha, the desired alpha was obtained for only 2 item sets on a single test. It was expected that item sets pertaining to learning objective 4
(base level of skills) would have good alphas since questions under that objective on a given test usually concerned only one tool. However, an acceptable alpha could only be reached for the questions for that learning objective on one test.

2019 Proceedings of the EDSIG Conference ISSN: 2473-4901
Cleveland Ohio v5 n4971
2019 ISCAP (Information Systems and Academic Professionals) Page 6 http://iscap.info; http://proc.iscap.info
If correlations among items in a set are low or a
blend of high and low values, alpha can be reduced. (Tavakol & Dennick, 2011) Correlation analyses of all item sets revealed few correlations
outside the range of “weak” (-.3 < x < .3). This suggests that merely dividing existing items sets into smaller groups would not produce item sets with acceptable alphas. It appears that question creation was driven more by the desire to be comprehensive in coverage than to measure performance against specific
learning objectives. 6. CONCLUSIONS, LIMITATIONS, AND NEXT
STEPS Using Canvas’s student and item analysis reports
along with simple spreadsheeting techniques made item analysis of 105 items and the calculation of alphas for 4 learning objectives easy and quick. However, the results were eye-opening and humbling. The results pointed out deficiencies in many
questions. While it has long been easy to calculate item difficulty, consulting the point biserials and learning which carefully crafted distractors are not fooling anybody was distressing. And learning which questions the best students were getting wrong more often than the lower performing students is humbling for someone who is proud of
crafting clearly worded questions. Finally, the lack of internal consistency among questions grouped
under each learning objective and the lack of correlations among items in each set suggest that, while the tests do classify students into groups for the purpose of assigning grades and
those groups do, on the surface, appear to correspond with behaviors such as attendance, turning in homework, and showing up for office hours, the tests do not appear to be good measurements of performance against the course’s learning objectives.
These results, gathered in spring 2019, are being used in the fall 2019 term to guide revision of questions and of the course’s learning objectives with the intent to align them.
The spreadsheet processes developed during this analysis are also being used during fall 2019 to
examine item and student analysis data from another course given in spring 2019 with the same intent.
7. REFERENCES
Cohen R, S. M. (2010). Psychological testing and
assessment. Boston: McGraw-Hill Higher
Education. Cronbach, L. (1951). Coefficient alpha and the
internal structure of tests. Psychomerika, 297-334.
Goforth, C. (2015, 11 16). Using and Interpreting
Cronbach’s Alpha. Retrieved 07 31, 2019, from University of Virginia:
https://data.library.virginia.edu/using-and-interpreting-cronbachs-alpha/
Haladyna, T. D. (1993, 12 1). How Many Options
is Enough for a Multiple-Choice Test Item? Retrieved from Educational and Psychological Measurement:
https://journals.sagepub.com/doi/10.1177/0013164493053004013
Hinkle DE, W. W. (2003). Applied Statistics for the
Behavioral Sciences, 5th ed. Boston: Houghton Mifflin.
Kline, P. (1999). The handbook of psychological
testing (2nd ed.). London, UK: Routledge.
Lord, F. M. (1952). The relation of the reliability
of multiple-choice tests to the distribution of
item difficulties. Psychometrika, 18, 181-194.
Mehrens, W. A., & Lehmann, I. J. (1973).
Measurement and Evaluation in Education and Psychology. New York: Hold, Rinehart and Winston.
National Council for Measurement in Education.
(2018). Assessment Glossary. Retrieved from National Council for Measurement in Education: http://www.ncme.org/resources/glossary
Nunnally J, B. L. (1994). Psychometric theory.
New York: McGraw-Hill Higher Education.
Ronco, S. (2013, Feb.). WORKSHOP MATERIALS.
Retrieved from Office of the Provost : Assessment at Marquette: https://www.marquette.edu/assessment/workshop-materials.shtml
Sijtsma, K. (2009, March). On the use, the
misuse, and the very limited usefulness of

2019 Proceedings of the EDSIG Conference ISSN: 2473-4901
Cleveland Ohio v5 n4971
2019 ISCAP (Information Systems and Academic Professionals) Page 7 http://iscap.info; http://proc.iscap.info
Cronbach's alpha. Psychmetrika, 74(1), 107-
120. doi:10.1007/s11336-008-9101-0
Tarrant M, W. J. (2009). An assessment of
functioning and non-functioning distracters in
multiple-choice questions: a descriptive analysis. BMC Medical Education, 9-40.
Tavakol, M., & Dennick, R. (2011). Making sense
of Cronbach's alpha. International Journal of Medical Education(2), 53-55. doi:10.5116/ijme.4dfb.8dfd
Thorndike, R. C. (1991). Measurement and
evaluation in psycohology and education (5th ed.). New York: MacMillan.
.

2019 Proceedings of the EDSIG Conference ISSN: 2473-4901
Cleveland Ohio v5 n4971
2019 ISCAP (Information Systems and Academic Professionals) Page 8 http://iscap.info; http://proc.iscap.info
Appendix A: Preparing Students to Use the Lockdown Browser Software Support for Assessment Tests were created and presented using the quiz feature of the Canvas learning management system (LMS). This was done to help reduce the work of testing, including preparing multiple versions of tests by scrambling question and answers, copying tests, grading multiple versions of tests, and compiling item level data for required reporting and for improving questions, tests, and teaching materials and activities.
The quiz feature allows the instructor to randomize the order of questions and the order of responses for each question. In effect, each student will receive an individual quiz, which reduces the benefits of “wandering eyes”. The tradeoff is that answers such as “A and C” must be rewritten and tables and figures that could be referenced by several questions must be duplicated for each question or provided to students on a paper handout.
The quiz feature also allows the teacher to set both a maximum time allowed for the test as well as a
window during which the test is available. For this course, each test lasted for 50 minutes from the moment a student started or until the testing time window ran out—whichever came first. The testing window was set from 5 minutes before normal class staring time to 5 minutes after in order to give students and the instructor some time to work through technical difficulties without inconveniencing students arriving for other classes. The quiz feature also allows the instructor to require a “password”
for test access. This feature was also used to ensure that the instructor was aware when the first students could start the test. Students access the tests on-line through Respondus Lockdown Browser (LDB). The LDB is software that students must download and install on their laptops. The university has a site license that automatically loads its own Canvas site when the LDB is opened. Using the LDB enables the instructor to ensure that students do not access other resources on their laptop or through the Internet during the
test. The LDB also includes a calculator, which eliminates the need to allow calculators or mobiles to be used as calculators. The only use of mobiles allowed is to respond to a multi-factor authentication query from the university’s Single Sign-on On (SSO) system to gain access to Canvas.
Two groups of students did not take the test through the quiz feature and the LDB--those who had problems that could not be addressed quickly during the tests, and those who took the tests in facilities provided by the Office of Disability Services.
Preparing Students to Use the Lockdown Browser Some students had taken tests on-line before. However, this was the first use of the Respondus Lockdown Browser in the university. To reduce the number of problems likely to occur on the day of the first test, two not-for-credit business/technology/campus (fun) trivia quizzes were created in Canvas and were set up to be accessible only through the LDB. On two days, a few minutes were set aside at
the beginning of class to allow students to practice arriving, plugging in their laptops, opening the LDB and proceeding to the quiz to await the password. After, both quizzes were made available on-line so that students could take them anytime as many times as they wanted. Students were sent several messages reminding them to practice. Before the beginning of the term, the instructor worked with facilities personnel to ensure that all outlets in the classroom worked. Students were then given with the responsibility to ensure their laptops were
charged or to bring a power cord and plug into an outlet when they arrived. Nevertheless, on the day of the first test, several students had still not installed the LDB or practiced. They were given paper tests to complete. By the end of the term, all students except for those with disability accommodations took the tests through the LDB.
2019 Proceedings of the EDSIG Conference ISSN: 2473-4901
Cleveland Ohio v5 n4971
2019 ISCAP (Information Systems and Academic Professionals) Page 9 http://iscap.info; http://proc.iscap.info
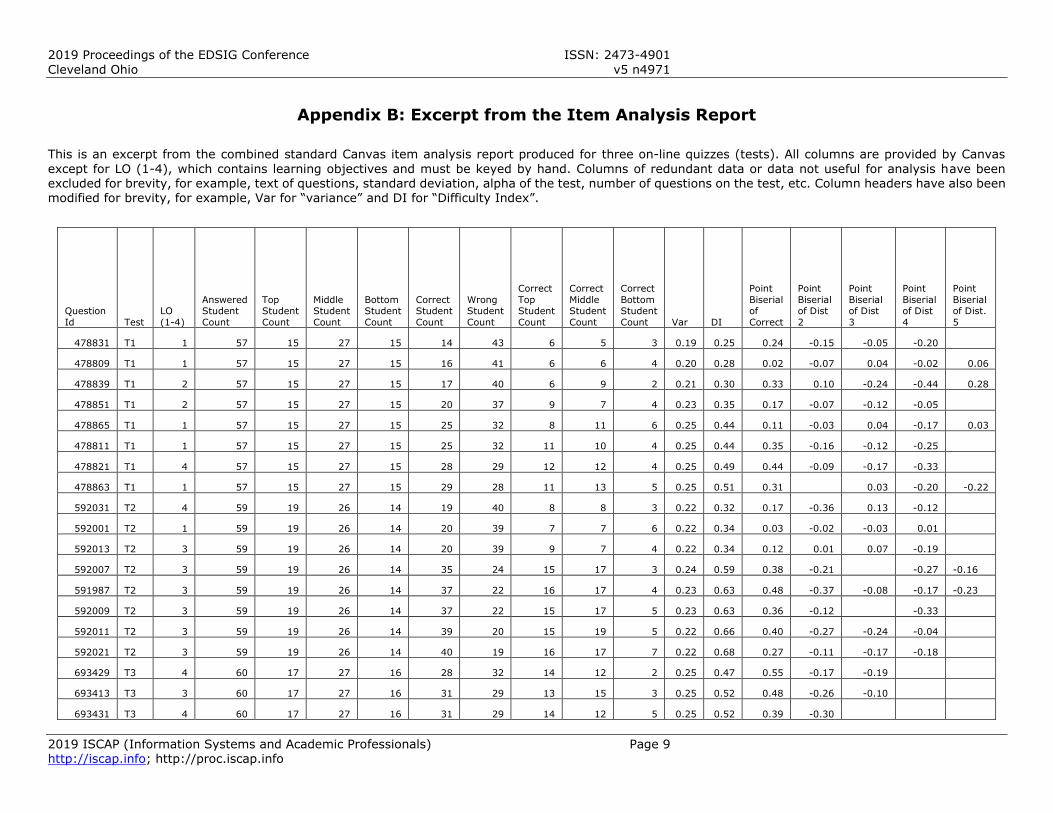
Appendix B: Excerpt from the Item Analysis Report
This is an excerpt from the combined standard Canvas item analysis report produced for three on-line quizzes (tests). All columns are provided by Canvas
except for LO (1-4), which contains learning objectives and must be keyed by hand. Columns of redundant data or data not useful for analysis have been excluded for brevity, for example, text of questions, standard deviation, alpha of the test, number of questions on the test, etc. Column headers have also been modified for brevity, for example, Var for “variance” and DI for “Difficulty Index”.
Question
Id Test
LO
(1-4)
Answered Student
Count
Top Student
Count
Middle Student
Count
Bottom Student
Count
Correct Student
Count
Wrong Student
Count
Correct
Top Student
Count
Correct
Middle Student
Count
Correct
Bottom Student
Count Var DI
Point
Biserial of
Correct
Point
Biserial of Dist
2
Point
Biserial of Dist
3
Point
Biserial of Dist
4
Point
Biserial of Dist.
5
478831 T1 1 57 15 27 15 14 43 6 5 3 0.19 0.25 0.24 -0.15 -0.05 -0.20
478809 T1 1 57 15 27 15 16 41 6 6 4 0.20 0.28 0.02 -0.07 0.04 -0.02 0.06
478839 T1 2 57 15 27 15 17 40 6 9 2 0.21 0.30 0.33 0.10 -0.24 -0.44 0.28
478851 T1 2 57 15 27 15 20 37 9 7 4 0.23 0.35 0.17 -0.07 -0.12 -0.05
478865 T1 1 57 15 27 15 25 32 8 11 6 0.25 0.44 0.11 -0.03 0.04 -0.17 0.03
478811 T1 1 57 15 27 15 25 32 11 10 4 0.25 0.44 0.35 -0.16 -0.12 -0.25
478821 T1 4 57 15 27 15 28 29 12 12 4 0.25 0.49 0.44 -0.09 -0.17 -0.33
478863 T1 1 57 15 27 15 29 28 11 13 5 0.25 0.51 0.31 0.03 -0.20 -0.22
592031 T2 4 59 19 26 14 19 40 8 8 3 0.22 0.32 0.17 -0.36 0.13 -0.12
592001 T2 1 59 19 26 14 20 39 7 7 6 0.22 0.34 0.03 -0.02 -0.03 0.01
592013 T2 3 59 19 26 14 20 39 9 7 4 0.22 0.34 0.12 0.01 0.07 -0.19
592007 T2 3 59 19 26 14 35 24 15 17 3 0.24 0.59 0.38 -0.21 -0.27 -0.16
591987 T2 3 59 19 26 14 37 22 16 17 4 0.23 0.63 0.48 -0.37 -0.08 -0.17 -0.23
592009 T2 3 59 19 26 14 37 22 15 17 5 0.23 0.63 0.36 -0.12 -0.33
592011 T2 3 59 19 26 14 39 20 15 19 5 0.22 0.66 0.40 -0.27 -0.24 -0.04
592021 T2 3 59 19 26 14 40 19 16 17 7 0.22 0.68 0.27 -0.11 -0.17 -0.18
693429 T3 4 60 17 27 16 28 32 14 12 2 0.25 0.47 0.55 -0.17 -0.19
693413 T3 3 60 17 27 16 31 29 13 15 3 0.25 0.52 0.48 -0.26 -0.10
693431 T3 4 60 17 27 16 31 29 14 12 5 0.25 0.52 0.39 -0.30

2019 Proceedings of the EDSIG Conference ISSN: 2473-4901
Cleveland Ohio v5 n4971
2019 ISCAP (Information Systems and Academic Professionals) Page 10 http://iscap.info; http://proc.iscap.info
693425 T3 4 60 17 27 16 34 26 13 14 7 0.25 0.57 0.25 -0.29 0.02
693471 T3 3 60 17 27 16 35 25 7 17 11 0.24 0.58 -0.24 0.27
693449 T3 3 60 17 27 16 37 23 17 15 5 0.24 0.62 0.53 -0.26 -0.02

2019 Proceedings of the EDSIG Conference ISSN: 2473-4901
Cleveland Ohio v5 n4971
2019 ISCAP (Information Systems and Academic Professionals) Page 11 http://iscap.info; http://proc.iscap.info
Appendix C: Excerpt from a Worksheet Used to Calculate Alpha for Questions Associated with a
Given Learning Objective This is an excerpt (first 19 rows) from a worksheet used to calculate alpha for the questions associated with a given learning objective on a test. All columns are provided by Canvas through a student analysis report except for Total. For each student, an indication of the correctness (1 or 0) of their response to each question is provided. Columns of redundant data or data not useful for analysis have been excluded for brevity, for example, student name and id, response text, number correct, and number incorrect. Rows have been modified to replace student
ID numbers with serial numbers. The row LO above the 6-digit item identifiers is the learning objective (1-4) associated with each question. Variance is the population variance of responses to the question. “Alpha if deleted” for each item is the alpha for the group if scores for that item are excluded from the calculation. On the right, alpha is Cronbach’s alpha for the items on the page.

2019 Proceedings of the EDSIG Conference ISSN: 2473-4901
Cleveland Ohio v5 n4971
2019 ISCAP (Information Systems and Academic Professionals) Page 12 http://iscap.info; http://proc.iscap.info
Notes
i Item “difficulty” is the percentage of respondents who answered an item correctly. A better name for this would be “facility”. ii Two methods for estimating Cronbach’s alpha were used and the results compared. “Calculating Cronbach’s Alpha in Microsoft Excel Compared to SPSS” by Dr. Todd L. Grande, available on YouTube (https://youtu.be/uXKnn0T6Cyw?t=137) shows how to calculate alpha using Excel’s optional Data Analysis feature. “Cronbach’s Alpha – Excel” by Jalayer Academy, available on YouTube (https://youtu.be/ANxZRi_achQ) shows how to calculate Alpha in Excel from variances and sums directly. iii The distribution of discrimination index was close to symmetric (Pearson’s coefficient of skewness =
-.10).