Use of AHRQ’s Preventable Hospitalization Costs and Mapping Tool Brooks Daverman...
15
Use of AHRQ’s Preventable Hospitalization Costs and Mapping Tool Brooks Daverman [email protected] Tennessee Division of Health Planning
-
Upload
cullen-weyman -
Category
Documents
-
view
216 -
download
0
Transcript of Use of AHRQ’s Preventable Hospitalization Costs and Mapping Tool Brooks Daverman...
Use of AHRQ’s
Preventable Hospitalization Costs
and Mapping Tool Brooks Daverman
Tennessee Division of Health Planning

2
State Healthcare Report Card
Version 2 coming soonDiabetes, hypertension and…
asthmaCounty-level maps

3
Purpose of Report
Motivated by high levels of chronic disease in Tennessee.
Pulls together all available data. Presents at as local a level as
possible.First step toward all-payer claims
database.
DHHS
Reformatted as bullet list.

4
Report Combines 3 Types of Data
BRFSS survey data.HEDIS measures voluntarily
submitted by TN health plans and TennCare (TN Medicaid).
AHRQ mapping tool using hospital discharge data.

5
BRFSS
Have you ever been told by a doctor that you have diabetes? (2008)
8.3 – 8.9%
9.0 – 10.5%
10.6 – 10.9%
11.0 – 12.0%
12.1 – 14.0%

6
Screening Measures
HbA1c testing rates – diabetes 71.31-91.41%
LDL-C screening rates – diabetes 64.72-87.55%
LDL-C screening rates – cardiovascular conditions 60.26-87.20%

7
HEDIS Measure Example
HbA1c Testing Rates Among Patients With Diabetes
77.74 – 82.73%
82.74 – 84.15%
84.16 – 85.46%
85.47 – 86.97%
86.98 – 89.08%
8
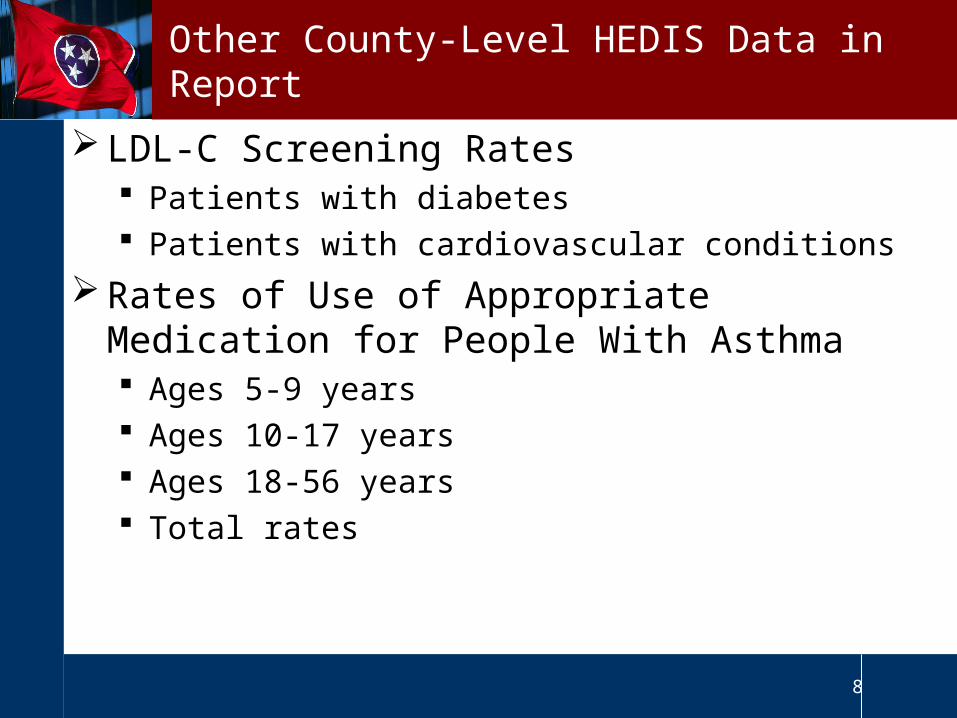
Other County-Level HEDIS Data in Report
LDL-C Screening Rates Patients with diabetes Patients with cardiovascular conditions
Rates of Use of Appropriate Medication for People With Asthma Ages 5-9 years Ages 10-17 years Ages 18-56 years Total rates

9
Statewide HEDIS Data in Report
HEDIS 2009 TN Health Plan Average vs. HEDIS 2009 National Averages
Commercial HMO Medicaid HMO
HEDIS 2009TN
HEDIS 2009National
HEDIS 2009TN
HEDIS 2009National
HbA1c Poor Control (>9.0%) - Patients With Diabetes* 26.0% 28.4% 47.3% 44.8%
LDL-C Control (<100 mg/dL) - Patients With Diabetes 40.8% 45.5% 26.0% 33.8%
Blood Pressure Control (<130/80 mm Hg) - Patients With Diabetes 29.7% 33.4% 31.2% 30.7%
Blood Pressure Control (<140/90 mm Hg) - Patients With Diabetes 67.2% 65.6% 56.7% 56.9%
Blood Pressure Control (<140/90 mm Hg) - Patients With Hypertension 61.3% 63.4% 52.8% 55.8%
LDL-C Control (<100 mg/dL) - Patients With Cardiovascular Conditions 56.2% 59.7% 42.8% 40.1%

10
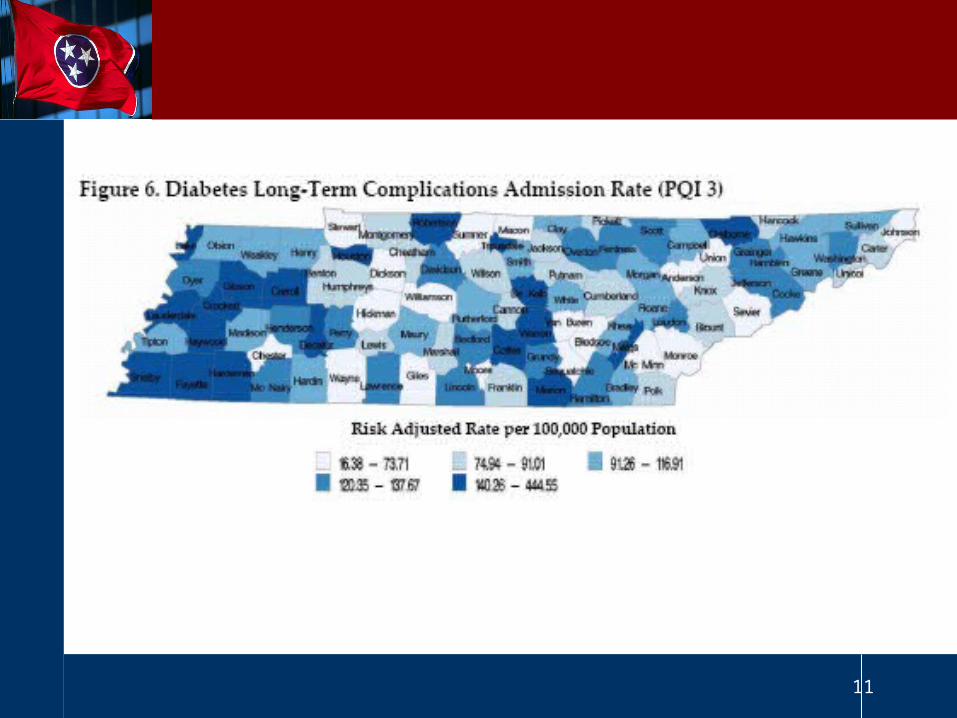
11

12

13
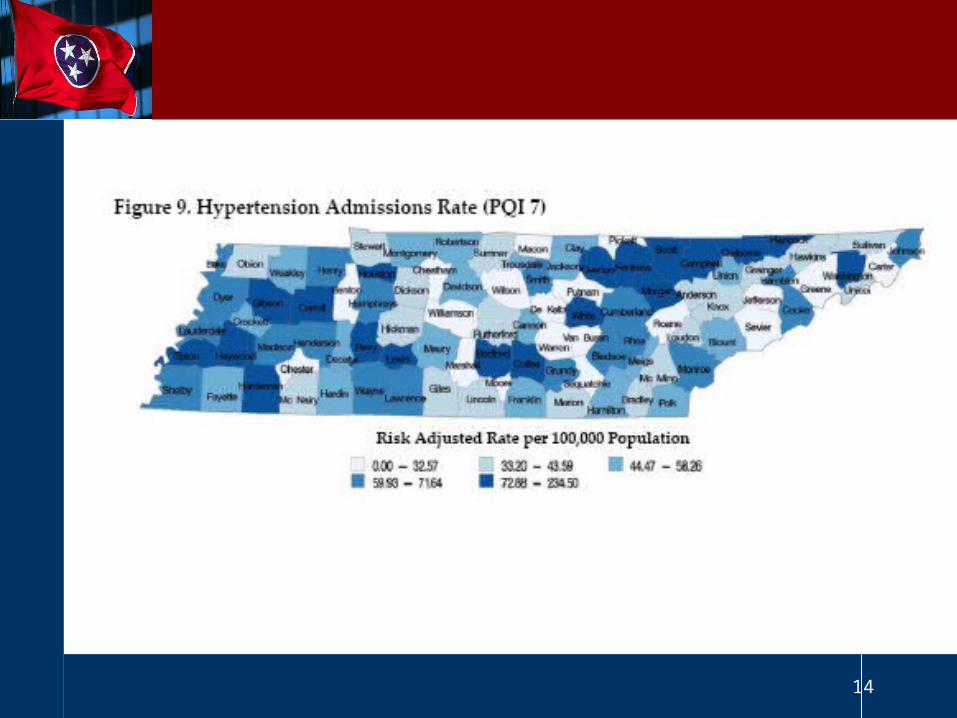
14

15