USE AND IMPACT OF ICT Francis Odhuno ON SMES IN PNG: AN ...
40
November 2018 USE AND IMPACT OF ICT ON SMES IN PNG: AN EMPIRICAL ANALYSIS AND IMPLICATIONS FOR POLICY Francis Odhuno www.pngnri.org No. 162 Dianah Ngui
Transcript of USE AND IMPACT OF ICT Francis Odhuno ON SMES IN PNG: AN ...
November 2018
USE AND IMPACT OF ICT ON SMES IN PNG: AN EMPIRICAL ANALYSIS AND IMPLICATIONS FOR POLICY
Francis Odhuno
www.pngnri.org
No. 162
Dianah Ngui

This page is intentionally left blank
DISCUSSION PAPER
No.162 November 2018
USE AND IMPACT OF ICT ON SMES IN PNG: AN EMPIRICAL ANALYSIS AND IMPLICATIONS FOR POLICY
Francis Odhuno
Dianah Ngui
First published in November 2018All rights reserved. No part of this publication may be reproduced, stored in a retrieval system or transmitted in any form or by any means, electronic, mechanical, photocopying or otherwise, without the prior permission of the publisher.
Copyright © 2018 The National Research Institute.
Direct any inquiries regarding this publication to: The Editorial Unit LeaderNational Research InstituteP.O. Box 5854Boroko, NCD 111 Papua New Guinea
Tel: +675 326 0300/326 0061; Fax: +675 326 0213Email: [email protected]: www.pngnri.org
The National Research Institute (NRI) is an independent statutory authority established by an Act of Parlia-ment in 1988 and confirmed by the IASER (Amendment) Act 1993.
NRI is mandated by legislation to carry out independent research and analysis on development issues affecting PNG. The legislation states that the functions of the NRI are:(a) the promotion of research into Papua New Guinea society and the economy (b) the undertaking of research into social, political and economic problems of Papua New Guinea in order
to enable practical solutions to such problems to be formulated.
ISBN 9980 75 254 8National Library Service of Papua New Guinea
ABCDE 202221201918
The opinions expressed in this report are those of the authors and not necessarily the views of the National Research Institute.
Cover designed by PNG NRI Digital Media Unit
Table of ContentsAbstract v
Background and significance of the study 1
Literature review 3
SME performance measures 3
ICT impact on performance measures 4
Conceptual framework 5
Data and methodology 7
Data 7
Empirical specification 7
Data analysis and discussion 9
Exploring data relationships 9
Econometric results 14
Summary and policy recommendations 19
References 21
Appendices 25
i
List of Figures
Figure 1: Conceptual Framework 5
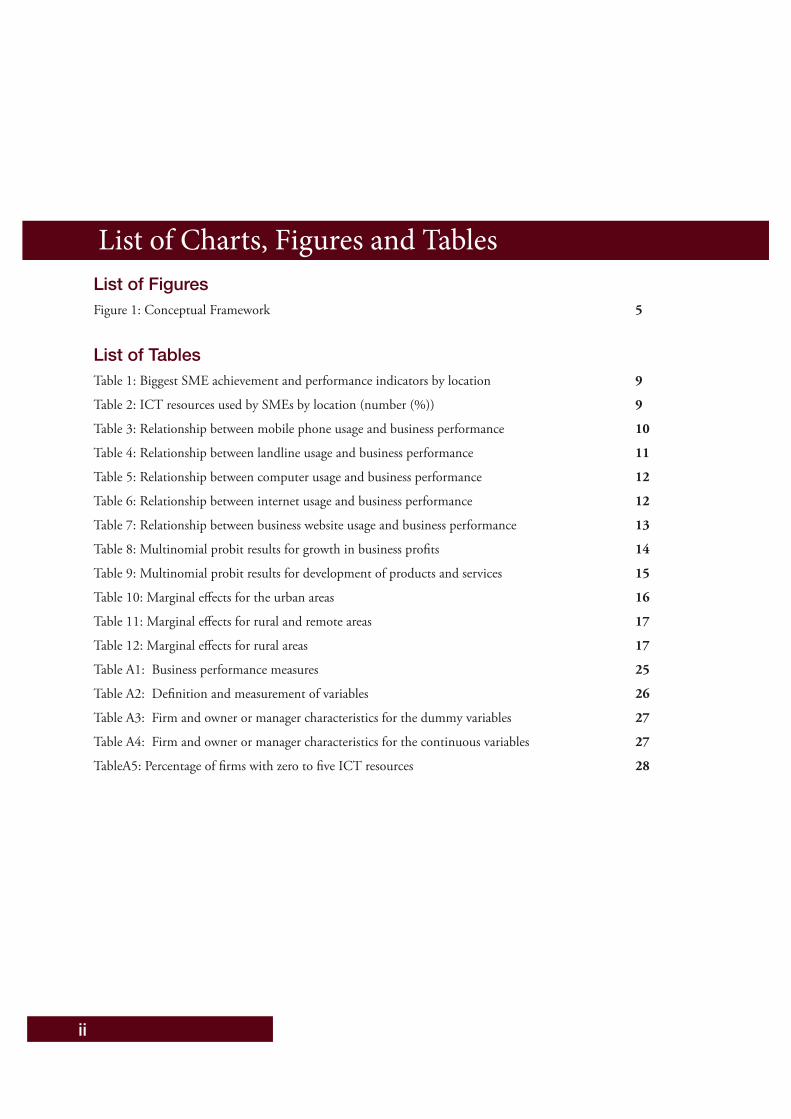
List of Tables
Table 1: Biggest SME achievement and performance indicators by location 9
Table 2: ICT resources used by SMEs by location (number (%)) 9
Table 3: Relationship between mobile phone usage and business performance 10
Table 4: Relationship between landline usage and business performance 11
Table 5: Relationship between computer usage and business performance 12
Table 6: Relationship between internet usage and business performance 12
Table 7: Relationship between business website usage and business performance 13
Table 8: Multinomial probit results for growth in business profits 14
Table 9: Multinomial probit results for development of products and services 15
Table 10: Marginal effects for the urban areas 16
Table 11: Marginal effects for rural and remote areas 17
Table 12: Marginal effects for rural areas 17
Table A1: Business performance measures 25
Table A2: Definition and measurement of variables 26
Table A3: Firm and owner or manager characteristics for the dummy variables 27
Table A4: Firm and owner or manager characteristics for the continuous variables 27
TableA5: Percentage of firms with zero to five ICT resources 28
ii
List of Charts, Figures and Tables
iii
AcknowledgementsThis paper was prepared as part of a research project supported by funds provided to PNG NRI by the Australian Department for Foreign Affairs and Trade. Neither of these institutions should be taken as endorsing the views presented here. We thank Russell Smyth for helpful comments on an earlier version of this paper.
About the AuthorsFrancis Odhuno is a Senior Research Fellow, Economic Policy Research Program at the PNG National Research Institute, Port Moresby, Papua New Guinea.
Dianah Ngui is a Senior Lecturer, Department of Econometrics and Statistics, Kenyatta University, Nairobi, Kenya.
iv
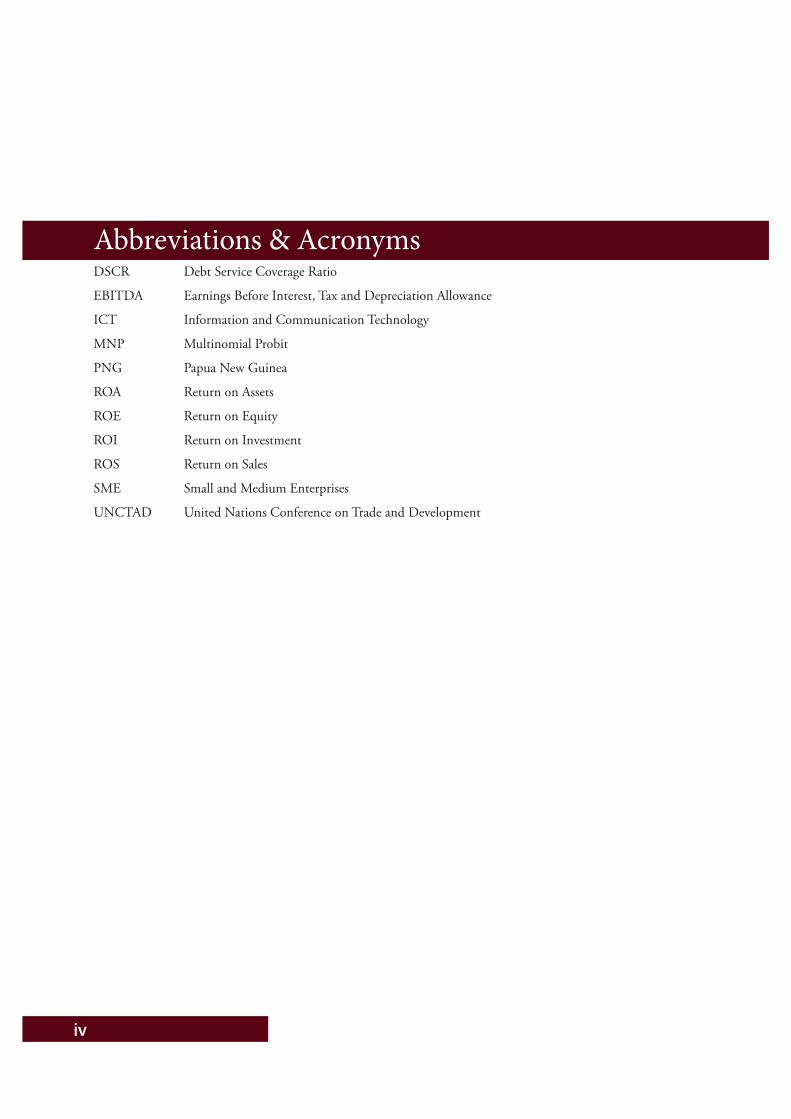
Abbreviations & AcronymsDSCR Debt Service Coverage Ratio
EBITDA Earnings Before Interest, Tax and Depreciation Allowance
ICT Information and Communication Technology
MNP Multinomial Probit
PNG Papua New Guinea
ROA Return on Assets
ROE Return on Equity
ROI Return on Investment
ROS Return on Sales
SME Small and Medium Enterprises
UNCTAD United Nations Conference on Trade and Development
v
Abstract Today many organisations of all types and sizes in Papua New Guinea (PNG) are utilising some form of Information and Communication Technology (ICT), including computers, mobile phones, fixed line telephones, and the internet. Large businesses are likely to own and use nearly all these types of ICT. The situation for the country’s Small and Medium Enterprises (SMEs) is the opposite to that of large business houses. Since ICT has become a critical input that could help SMEs overcome market imperfections, the Government of PNG is planning to establish ICT support systems and tools for SME business development and growth. In this paper, we use data from a survey of SME owners or managers in remote, rural, and urban areas of PNG to provide evidence on the potential impact of such an ICT support strategy. Using multinomial probit models, we find that, in urban areas, SMEs using mobile phones are more likely to have growth in business profits or develop new products or services than those not using mobile phones. In both remote and rural areas, SMEs using landline telephones and websites are more likely to develop new products or services. On the other hand those using computers are more likely to have their business profits grow. Those using website and internet are, however, less likely to increase product sales and develop new products or services. In general, the number of SMEs using various ICT resources other than mobile phones is very low in rural and remote places across the country. This is symptomatic of limited access to ICT resources. Investing in ICT infrastructure and targeted entrepreneurial training are, therefore, critical factors that could lead to more PNG SMEs accessing, and understanding the benefits of, and employing, ICT resources in their businesses. Moreover, innovative SMEs – those likely to introduce new products or services as a result of using ICT resources – need a supportive policy environment to protect their intellectual property.

vi
In 2016, Papua New Guinea (PNG) adopted a new Small and Medium Enterprise (SME) Policy and accompanying SME Master Plan 2016–2030 to deliver specific SME sector targets of PNG Vision 2050 and the PNG Development Strategic Plan 2010–2030 (Ministry of Trade, Commerce & Industry, 2016a; Ministry of Trade, Commerce & Industry, 2016b). The targets are to increase, by 2050: the number of SMEs to 500,000, the level of SME employment to 2 million jobs, and the share of SME’s contribution to 50 percent of GDP. To achieve these targets, and since SMEs are an important factor in the PNG economy, especially with respect to production and employment, the Government is planning to establish several key interventions, including information and communication technology (ICT) support systems and tools for SME business development and growth (Ministry of Trade, Commerce & Industry, 2016a).
In particular, the PNG Government is planning to: (i) subcontract established ICT service providers to assist SMEs with the necessary support that will enhance their operating capability and (ii) facilitate the establishment, and use, of ICT information hub or portals where SMEs can access information on markets (Ministry of Trade, Commerce & Industry, 2016a). It is believed that access to ICT services could help SMEs overcome market imperfections. It also enables them to operate more competitively with greater efficiency in both domestic and global markets (UNCTAD Secretariat, 2005). Different elements of ICT can play important roles in the country’s digital economy. The overall understanding of the subject in PNG SMEs is limited. There is no evidence on whether the adoption and use of ICT resources have any impact on several dimensions of SME growth and performance indicators. Yet sound policies and effective ICT-related business development assistance programmes can only be developed if policy makers have a good knowledge and understanding of whether the use of ICT resources is a factor contributing to the success of SMEs in PNG. The use of ICT may increase competitiveness of SMEs. They have to either become more productive and grow or to close down. The objective of this study is to examine the use and impact of ICT resources on the performance of a sample of PNG SMEs.
The next section contains a review of the literature on SME performance measures and examines selected studies that relate ICT usage to SME performance. The data, methodology, and hypotheses are introduced in Section 3. The data analysis presented in Section 4 first qualitatively explores the relationship between ICT usage and selected performance indicators for a sample of SMEs in urban, rural, and remote locations in PNG. Disaggregating the analysis by location is important because: (i) in PNG, SMEs underpin a large grassroots economy – where local low-income people start and strive to grow their own businesses in the informal sector1, (ii) nearly 85 percent of the country’s population live in rural and remote areas, and (iii) even though the ICT space in PNG has improved significantly in recent years, the country’s digital divide is exacerbated by PNG’s rugged geography, with rural and remote locations having little or no access to ICT (Department of Information & Communication, 2008, 2009).2 The magnitude and direction of the effect of various ICT resources on different dimensions of SME performance are then estimated to enhance understanding of whether ICT is a key constraint to or enabler of small scale entrepreneurship in urban PNG, compared to rural and remote places in the country. Section 5 concludes with policy recommendations for targeting ICT support systems and tools for SME business development and growth in PNG.
1 The situation of PNG SME sector is discussed in Mishra & Smyth (2016), and Mishra, Odhuno, & Smyth (2017). We only provide, in Section 4, a brief overview of the SME sector in relation to ICT possession and usage based on Tebbutt Research (2014) survey data. See Section 3 on Tebbutt Research (2014) survey data. 2 There is, however, some ray of hope. The World Bank is funding a Rural Communications Project that aims to modernise and improve the country’s ICT sector and its accessibility in rural areas; the ultimate goal is to improve standards of living, and empower SME growth (Department of Treasury, 2017).
1
Background and significance of the study

2
3
Literature review SME performance measuresPerformance is a measure of how reasonably a process achieves its objective. Various studies have defined performance differently. According to Hasan and Almubarak (2016) SME’s performance is defined according to business output and growth. Moullin (2002, p.188) explains an organisation’s performance as “how well the organization is managed and the value the organization delivers for customers and other stakeholders.” Amaratunga and Baldry’s (2002, p.218) definition illustrate the role and process of performance measurement from different aspects. Thus, “measurement provides the basis for an organisation to assess how well it is progressing towards its predetermined objectives, helps to identify areas of strength and weaknesses, and decides on future initiatives, with the goal of improving organisational performance.” Performance measurement may refer to the returns to the owners on the effort that they invest in running the firm (Nneka, 2015).
The performance measures of SMEs broadly differ. Murphy, Trailer & Hill (1996) reviewed the performance dimensions and measures used in literature and found significant differences in performance recommendations. Wu (2009) found growth and profitability to be the two performance dimensions often utilised in empirical research. Growth is measured using, among others, growth in sales, change in employees, growth in market share, market development, assets growth, profitability growth, and new product or process development. Profit, on the other hand, is measured using net profit, return on sales, net profit margin, stock market returns, and profitability relative to competitors.
Consoli (2012) recognises four groups of variables that are influential in an SME: growth, expansion, new products, and performance. Each of the group consists of multiple dimensions: growth consists of productivity growth, strategic, and sales led growth; expansion consists of organisation expansion, improvement in supply chain and international communication; new products consist of new products or services, product quality, and customer satisfaction. Performance consists of efficiency, effectiveness, competitiveness, innovativeness in business and intangible benefits. According to Adams et al. (2002) effectiveness refers to the extent to which stakeholder requirements are met. Efficiency, on the other hand, is a measure of how the firm’s resources are utilised when providing a given level of stakeholder satisfaction. Wu (2009) finds efficiency is frequently measured using return on investment and return on assets.
Dalrymple (2004), lists profitability, financial management, productivity, investment, growth, customer service, supplier management, innovation, people management, and customer satisfaction as some of performance measures of an SME. Liang, You & Liu (2010) and Santos and Brito (2012) note that a company or enterprise has two types of performance: financial performance and strategic or operational performance. The financial performance aspects include efficiency, effectiveness, profitability, growth, and market value (see also Consoli, 2012 and Santos and Brito, 2012). The strategic performance aspects include customer satisfaction, employees’ satisfaction, environmental, and social performance (Santos and Brito, 2012).
Kotane (2015), points out a number of financial and non-financial indicators that measure business performance (see also Neely, 1999; Moorthy et al., 2012). Based on the research, net turnover, cash flow report, current ratio, asset turnover, accounts receivable turnover, inventory turnover, payable turnover, total debt ratio, debt-to-equity ratio, gross profitability, return on assets (ROA), return on equity (ROE), return on sale (ROS), return on investment (ROI), EBITDA profitability, and the debt service coverage ratio (DSCR) constitute the financial indicators. On the other hand, level of consumer satisfaction, increase in number of consumers, consumer’s loyalty, quality of product and services, motivated employees, loyal employees, the level of employee’s satisfaction, development of new product and services, training of new employees, company reputation, and market share constitutes the non-financial indicators.
Generally, business performance implies the achievement of the business in addition to business development. Performance measurement assists the organisation to keep track and regulate the company’s performance and
4
ensure whether the company is meeting the organisation’s goals. For the purposes of this research, performance is related to the single biggest achievement a business has experienced over the previous 12 months prior to the Tebbutt Research (2014) survey. These include both financial and strategic or operational indicators. The financial indicators consist of market value and growth, and the operational indicators consist of customers’ satisfaction.
ICT impact on performance measuresStudies show that ICT performance effects depend on the type of technology being used and the extent of its adoption. Depending on the type of ICT the immediate impact is not always evident (see Bayo-Moriones, Billon & Lera-Lopez, 2013). There is, however, general consensus that network technologies, particularly communication and ICT systems, have a positive effect on firm performance. They help, in part, to produce spillover effects and to spread ICT impact (see Bayo-Moriones et al., 2013). Particularly, computer networks are related, with spillover effects since they let a firm subcontract certain activities, to work closer with customers and suppliers, and to better integrate activities throughout the value chain (Atrostic and Gates, 2001; Criscuolo and Waldron, 2003).
In general, studies in Malaysia and Indonesia indicated that usage of ICT had a positive relationship with business performance. (See for instance Ong et al., 2016; Setiawan, Indiastuti, and Destevanie, 2015; Zaremohzzabieh et al., 2015; Chen, 2015). Rahayu and Day (2017) found that Indonesian SMEs adopting e-commerce expanded their market reach, improved sales, enhanced external communication, company image, speed of data processing, and employee output. Thus, the benefits realized by SMEs tend to be increased by the increase in the level of e-commerce adoption. In PNG, Watson (2015) found that using mobile phones strategically could assist service distribution and socioeconomic objectives in rural areas.
Studies in the United States find that plants utilising ICT services experience on average a higher labour productivity (Atrostic and Nguyen, 2002; Pilat, 2004). In Japan, firms with open networks such as the internet have a larger share of white-collar workers and to outsource more production activities (Motohashi, 2001; Atrostic et al., 2002). Studies in Germany (Bertschek and Fryges, 2002) also confirm the importance of networks in the adoption of business to business (B2B) systems. In the United Kingdom, Criscuolo and Waldron, (2003) find that the use of networks has an important impact on productivity growth, but primarily through electronic purchasing, not through selling.
Some studies demonstrate that investments in ICT substantially affect the productivity of the labour force and economic growth (see e.g. Manochehri et al., (2012); Sabbagh et al., (2012)). Tarute and Gatautis (2014) observe that aligning ICT investments with internal capabilities and organisational processes is important for the greatest performance. The induced social and economic achievements are more important than technology itself (see also Akomea-Bonsu and Sampong, 2012). Manochehri et al., (2012) observe that to achieve best results from ICT adoption, certain infrastructure, skilled ICT personnel and budget to invest in ICT should be considered (see also Ollo-Lopez & Aramendia-Muneta, 2012). Brynjolfsson and Hitt (2000) emphasise the significance of complementary aspects such as reorganisation of the enterprise and enhancing the skill level of the personnel to get productivity growth as a result of investment in ICT. Boothby et al. (2010) find that combinations of technologies and kinds of training normally assumed by firms, presumably as part of their tactics to efficiently use the embraced technologies and to enhance their economic performance, were related with better productivity improvements.
Manochehri et al. (2012) observe that services are made more tradable and manufacturing more productive through ICT. Most of the Kumasi SMEs in the Akomea-Bonsu and Sampong (2012) study report positive performance and other benefits through the use of ICT in their businesses. A small number of SMEs, however, are aware of the benefits of ICT adoption. Mohamed (2014) found that ICT’s dimensions such as Information Technology (IT), Management Information System (MIS), Office automation (OA), Intranet and Internet, positively affect workforce productivity of industrial organisations in Alexandria – Egypt. For the Indian manufacturing SMEs (Müller-Falke (2001) establish a higher labour productivity and a higher growth rate on
5
enterprises that utilise more advanced ICT forms. Lal (1996) found higher profit margins, skill intensity, and export and import intensities in 59 electric and electronic SME businesses.
Wolf (2001) notes that ICT use could improve the competitiveness of SMEs as they allow the formation of more flexible relations with trading partners due to quicker and more dependable communication channels. Bayo-Moriones, Billon & Lera-Lopez (2013) found that the indirect channels through which ICT impacted on market share, profits and margin were operational performance and improvement of internal and external communication. This was confirmed by Tarute and Gatautis (2014) who found that ICT influenced the performance of external and internal communication. The use of e-mail, e-commerce, and social media network not only reduced the physical transportation involved in sending mail, banking, advertising and buying goods with a significant margin, but also improved service and broadened customers base (Manochehri, Al-Esmail & Ashrafi, 2012; Matthews, 2007; Nyandoro, 2016). Websites present excellent tools to reach new markets (Matthews, 2007). Matthews (2007) found that firms using email to communicate with customers grew sales 3.4 % faster than those firms that were not using emails.
Other studies reveal a positive relationship between ICT and enterprise growth (measured in terms of sales and employment growth). After controlling for other enterprise characteristics (ownership, export status, size, and age) and for unobserved country and sector characteristics, Quiang et al. (2006) found that enterprises that used ICT more intensively tended to grow faster. In particular, enterprises that used e-mail to communicate with their clients and suppliers grew 3.4 percentage points faster per year in terms of sales and 1.2 percentage points faster in terms of employment than those that did not. Extensive use of ICT can allow micro-enterprises with ideas and technologies to remain small and profitable or generate substantial global sales by exploiting their intellectual property over the Internet (Sakai, 2002; Quiang et al., 2006).
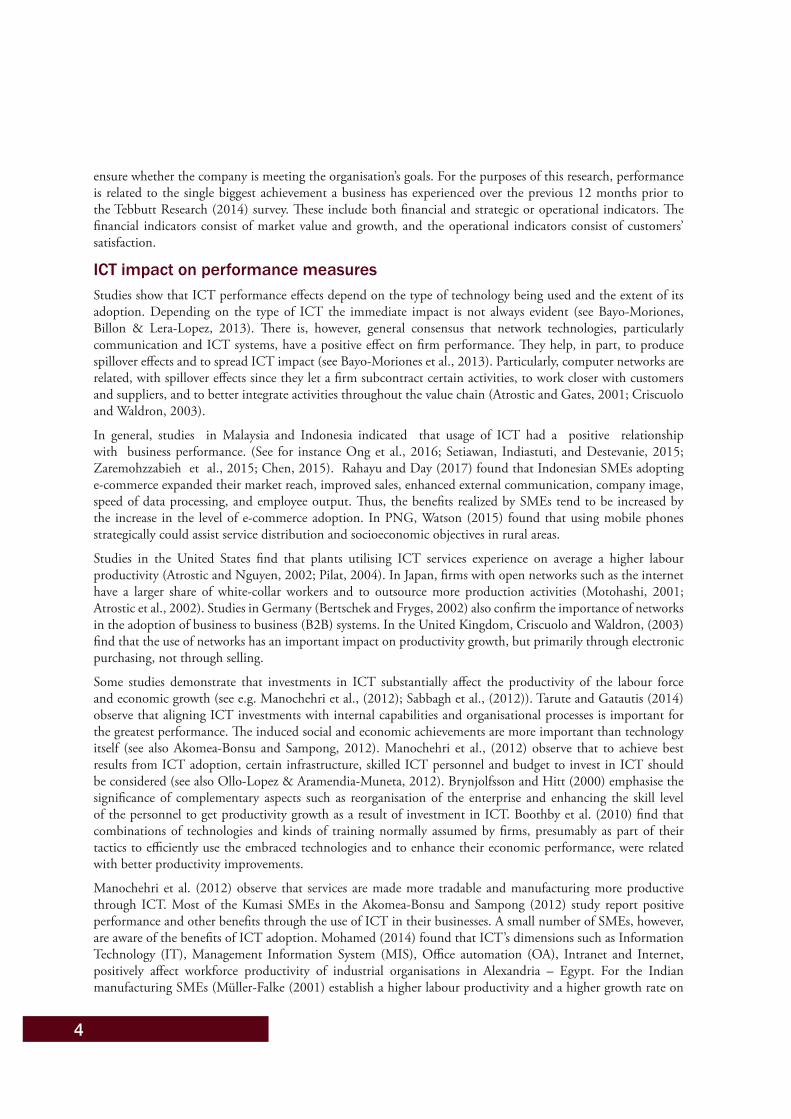
Figure 1: Conceptual Framework
Source: Authors’ conceptualisation
Conceptual frameworkThe study seeks to examine usage of ICTs and their impact on performance of PNG SMEs. Usage of ICTs refers to adoption and integration of numerous technologies that assist in production of business related information and improve communication within the business environment. ICT includes a number of devices and applications that improve efficiency in day to day undertakings. This paper will study five ICT resources, namely: landline telephone(s), mobile phone(s), computer(s), business website (hereafter website), and internet3.
3 Internet is a network connecting many computers together in which they can communicate. Business website is the SMEs information sharing tool that uses the internet.

6
These technologies can influence the business either, both positively or, and negatively. The influence refers to the overall outcome of using ICT on the system. The outcome can be defined by a number of indicators such as improvements in the goals of the enterprise. Although from the literature reviewed ICTs can influence the performance of an enterprise in multi-layered ways, this study only analyses ICT effects on the three single biggest achievements that the businesses had experienced over the last 12 months prior to the Tebbutt Research (2014) survey. From the survey, most SME managers or owners cite development of new products or services, growth in business profits, or increase in product sales as their single biggest achievement.
7
Data and methodology DataThe study uses data from the survey of SMEs, collected by Tebbutt Research (2014), to assess whether using ICT resources can boost the performance and growth of PNG SMEs. The study will glean any differences in those impacts in urban locations compared to rural and remote locations. Tebbutt Research (2014) conducted a representative face-to-face survey of 1,117 formal SME business owners and managers in all the 22 provinces in PNG.4 Interviews were undertaken between October 28 and December 14, 2013. Tebbutt Research (2014) generalised the definition and qualifying criteria for SMEs based on their data scan results: SMEs are businesses that are registered with the Investment Promotion Authority (IPA), Internal Revenue Commission (IRC) or those that have current borrowing with Bank South Pacific (BSP), the country’s dominant commercial bank. In addition to satisfying this formality requirement, only businesses that have between three (3) and 150 paid employees, have a maximum borrowing of PGK1.5 million and annual turnover between PGK100,000 and PGK15 million, qualify as SMEs.5
From a list of ten (10) options, SME owners or managers were asked to select the single biggest achievement that their businesses experienced over the past 12 months preceding the interview. SMEs that indicated nothing as an achievement (27) and those that didn’t know their biggest achievement (13) over the previous 12 months were dropped out of the performance categories. Firms that had just started operations (6) and did not indicate the biggest achievement were also dropped from the relationship analysis. Firms that indicated the biggest achievement was to pay off a loan (2) and community involvement (3) were excluded due to the small number of observations. This left 1,066 total observations. Out of the 1,066 firms, most firms cited increased product sales (28%), growth in business profits (25%) and development of new products/services (20%) as their biggest achievement. All other firms cited other indicators (less than 10%) and were dropped from the bivariate qualitative exploratory analysis. (See Table A1 in the Appendix).6
Empirical specificationTo assess the impact of ICT on the economic performance of firms, a multinomial probit (MNP) model was estimated. A MNP model is ideal for the study since it is applicable when there are several possible categories into which the dependent variable can fall. It is therefore a fitting method of multiclass classification. For the i-th firm faced with J choices, the utility of choice j is:
(1)
The term in the log-likelihood that corresponds to the choice of alternative q is:
(2)
The probability for this occurrence is:
(3)
From Equation (1), Uij is a binary latent variable equal to 1 if an enterprise i had developed new product or service or had increased product sales; or had growth in business profits over the previous 12 months during 4 While Tebbutt Research (2014) also surveyed 521 unregistered SMEs, the raw data for this subsample is not currently available for public use, hence informal SMEs will not be considered in this paper. 5 Based on these criteria, Tebbutt Research (2014) estimates that there are between 28,323 and 32,692 formal SMEs in PNG that collectively employ about 434,634 paid staff and 33,868 unpaid staff. In contrast, Government estimates suggest that there are currently about 49,500 SMEs in PNG that each employ not more than 100 people and have assets and annual turnover valued at not more than K10 million. Note. however, that Government estimate of the SME population is skewed informal (86.9%) – where formality is restricted to registration with the IPA. Consequently, the Government believes that PNG’s SME sector provide only 10 percent of formal sector jobs, a conservative estimate at 200,000 people (Ministry of Trade, Commerce & Industry, 2016a). 6 The range of other possible achievement indicators were listed covering process, technology, staffing, plant and equipment. See Appendix Table A1.
].,0[~],...,,[,,...,1, 21' 6 � NJjxU Jijjijij HHHHE
].,,...,1,Prob[]Prob[ qjJjUUqchoice jq z !
].)'(,...,)'(Prob[]Prob[ 11 EHHEHH JqqJqq xxxxqchoice �!��!�
8
the survey period. The firm owner chooses alternative k such that for j≠q. From Equation 1, is a vector of explanatory variables which includes ICT resource dummies7 (computer, landline telephone, mobile phone, website and internet), firm and owner characteristics; firm age, firm size, owners/managers education, gender of the firm owner, access to external finance, firm structure, foreign ownership present, regional dummies and economic activities dummies, is a vector of parameters to be estimated, while is the error term which is assumed to be distributed multivariate normal with mean 0, and covariance matrix ∑. Detailed definition of the variables in the model are given in Table A.2 in the Appendix.
After fitting an alternative-specific multinomial probit model, marginal effects will be computed to obtain the simulated probabilities that firms will choose each of the three alternative biggest achievements.
7 As some of these ICT resources are complementary, in addition to the dummies, a variable depicting number of ICTs resources used by each SME was also used (See Appendix Table A4).
E
ijx
9
Exploring data relationshipsTo explore the relationship between ICT usage and the SME performance disaggregated by urban, rural and remote areas, frequencies, and the contingency tables, Fisher’s exact test of variable relationships (where appropriate) and Cramer’s V were used. Contingency tables are used in analysing the relationship between two or more variables. Cramer’s V measures the association or relationship between the nominal variables. Given the overlapping use of different ICT resources, each ICT resource was analysed independently.
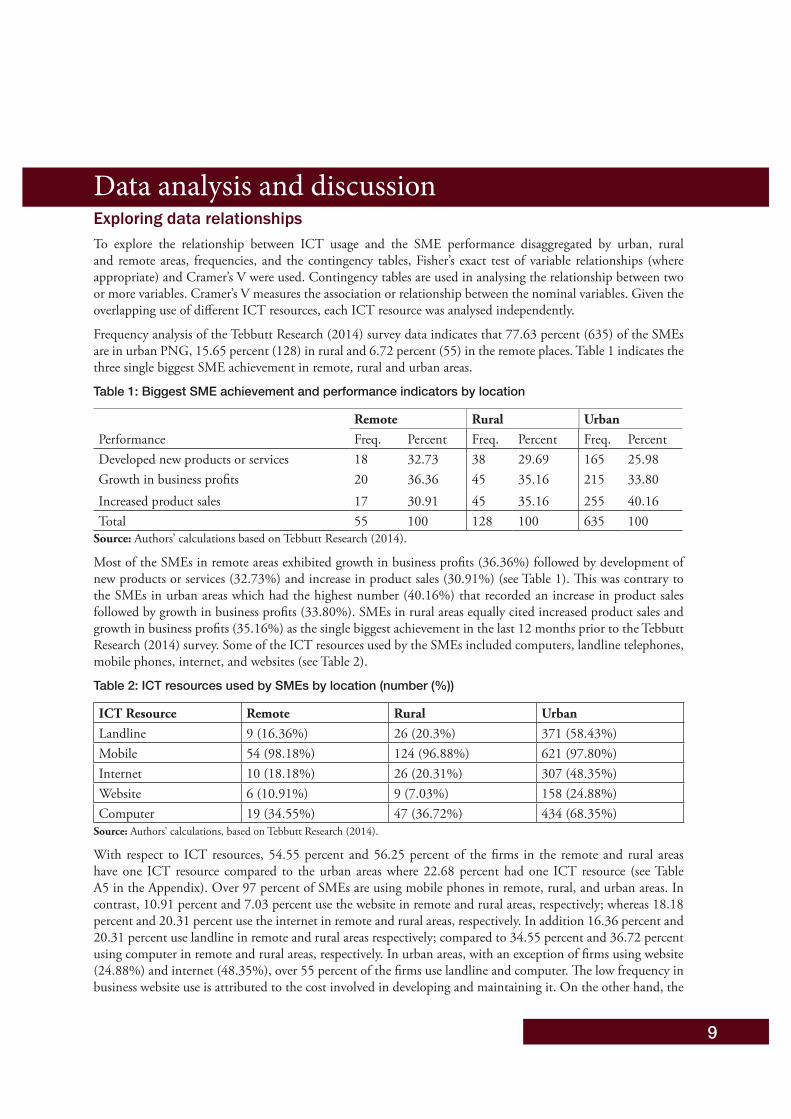
Frequency analysis of the Tebbutt Research (2014) survey data indicates that 77.63 percent (635) of the SMEs are in urban PNG, 15.65 percent (128) in rural and 6.72 percent (55) in the remote places. Table 1 indicates the three single biggest SME achievement in remote, rural and urban areas.
Table 1: Biggest SME achievement and performance indicators by location
Remote Rural UrbanPerformance Freq. Percent Freq. Percent Freq. PercentDeveloped new products or services 18 32.73 38 29.69 165 25.98Growth in business profits 20 36.36 45 35.16 215 33.80Increased product sales 17 30.91 45 35.16 255 40.16Total 55 100 128 100 635 100
Source: Authors’ calculations based on Tebbutt Research (2014).
Most of the SMEs in remote areas exhibited growth in business profits (36.36%) followed by development of new products or services (32.73%) and increase in product sales (30.91%) (see Table 1). This was contrary to the SMEs in urban areas which had the highest number (40.16%) that recorded an increase in product sales followed by growth in business profits (33.80%). SMEs in rural areas equally cited increased product sales and growth in business profits (35.16%) as the single biggest achievement in the last 12 months prior to the Tebbutt Research (2014) survey. Some of the ICT resources used by the SMEs included computers, landline telephones, mobile phones, internet, and websites (see Table 2).
Table 2: ICT resources used by SMEs by location (number (%))
ICT Resource Remote Rural UrbanLandline 9 (16.36%) 26 (20.3%) 371 (58.43%)Mobile 54 (98.18%) 124 (96.88%) 621 (97.80%)Internet 10 (18.18%) 26 (20.31%) 307 (48.35%)Website 6 (10.91%) 9 (7.03%) 158 (24.88%)Computer 19 (34.55%) 47 (36.72%) 434 (68.35%)
Source: Authors’ calculations, based on Tebbutt Research (2014).
With respect to ICT resources, 54.55 percent and 56.25 percent of the firms in the remote and rural areas have one ICT resource compared to the urban areas where 22.68 percent had one ICT resource (see Table A5 in the Appendix). Over 97 percent of SMEs are using mobile phones in remote, rural, and urban areas. In contrast, 10.91 percent and 7.03 percent use the website in remote and rural areas, respectively; whereas 18.18 percent and 20.31 percent use the internet in remote and rural areas, respectively. In addition 16.36 percent and 20.31 percent use landline in remote and rural areas respectively; compared to 34.55 percent and 36.72 percent using computer in remote and rural areas, respectively. In urban areas, with an exception of firms using website (24.88%) and internet (48.35%), over 55 percent of the firms use landline and computer. The low frequency in business website use is attributed to the cost involved in developing and maintaining it. On the other hand, the
Data analysis and discussion
10
low frequency of internet usage in the remote and rural areas and the internet prices remain above competent levels. The average PNG citizen is unable to benefit from internet access. Tohmatsu (2016) notes that the price of entry level internet packages is still considerably higher, over the ITU’s yardstick needed to hasten internet diffusion (not more than 3–5 percent of the average monthly income).
The high frequency of use of mobile phones is not surprising given that increasing numbers of people have mobile phones. In PNG, the mobile-cellular subscriptions per 100 inhabitants was 46.6 percent in 2016 with a penetration rate of approximately 50 percent in 2015.8 The frequency of use of mobile phones is attributed to their ease of operation, affordability and accessibility, and the number of services that they provide, including making calls, mobile money transfer, and internet access. Ngui Muchai and Kimuyu (2017) observe that many small companies use mobile phones for almost all their transactions or provide a service that originated from the platform itself. This is consistent with other studies (see Nyandoro, 2016) that find most SMEs use mobile phones in their daily operations.
To explore the relationship between performance and ICT resource usage, contingency tables are used. Table 3 shows the relationship between mobile phone usage and business performance disaggregated by remote, rural, and urban areas.Table 3: Relationship between mobile phone usage and business performance
Performance Remote Rural Urban
Growth in business profits
0 1 0 1 0 10 20 3 42 1 2140 100 6.67 93.33 0.47 99.530 37.04 75 33.87 7.14 34.46
Increase in product sales
1 16 1 44 12 2435.88 94.12 2.22 97.78 4.71 95.29100 29.63 25 35.48 85.71 39.13
Development of new products or services
0 18 0 38 1 1640 100 0 100 0.61 99.390 33.33 0 30.65 7.14 26.41
Total
1 54 4 124 14 6211.82 98.18 3.12 96.88 2.2 97.8100 100 100 100 100 100
Notes: 1 = Mobile usage, 0 otherwise. The first value in a cell indicates the number of observations; while the second value in a cell gives row percentages for the first variable in the cross-tab, the third value in a cell gives column percentages for the second variable in the cross-tab.
The study shows that there are no differences in performance between those using mobiles and those not using mobiles in remote and rural areas. Some relationship in the urban areas are evident. The lack of relationship in the remote and rural areas are attributed to the fact that only 2.73 percent of the SMEs are not using mobile phones. Of the SMEs in all the areas using mobile phones, over 90 percent increased product sales, had growth in profits, and developed new products. In the urban areas, out of the SMEs using mobile phones, 26.41 percent, 39.13 percent and 34.46 percent, respectively, cited development of new products or services, increase in product sales, and growth in business profits.
8 https://www.itu.int/net4/itud/icteye/CountryProfileReport.aspx? countryID=188
11
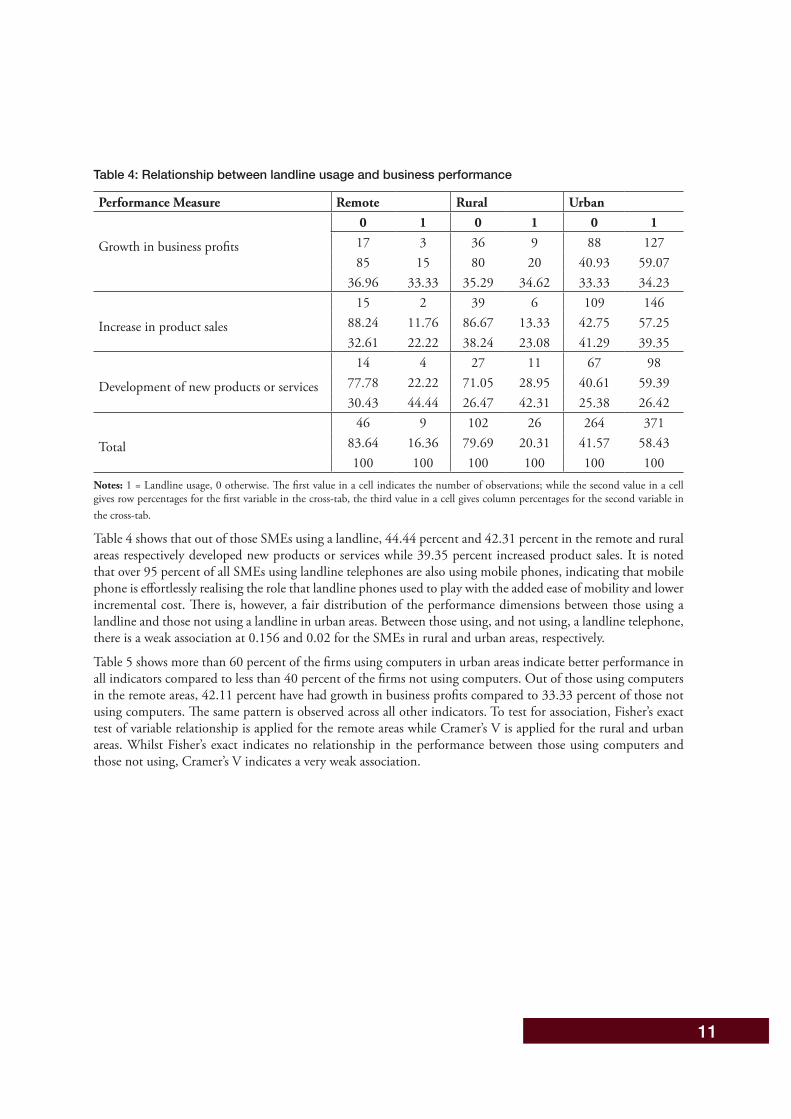
Table 4: Relationship between landline usage and business performance
Performance Measure Remote Rural Urban
Growth in business profits
0 1 0 1 0 117 3 36 9 88 12785 15 80 20 40.93 59.07
36.96 33.33 35.29 34.62 33.33 34.23
Increase in product sales
15 2 39 6 109 14688.24 11.76 86.67 13.33 42.75 57.2532.61 22.22 38.24 23.08 41.29 39.35
Development of new products or services
14 4 27 11 67 9877.78 22.22 71.05 28.95 40.61 59.3930.43 44.44 26.47 42.31 25.38 26.42
Total
46 9 102 26 264 37183.64 16.36 79.69 20.31 41.57 58.43100 100 100 100 100 100
Notes: 1 = Landline usage, 0 otherwise. The first value in a cell indicates the number of observations; while the second value in a cell gives row percentages for the first variable in the cross-tab, the third value in a cell gives column percentages for the second variable in the cross-tab.
Table 4 shows that out of those SMEs using a landline, 44.44 percent and 42.31 percent in the remote and rural areas respectively developed new products or services while 39.35 percent increased product sales. It is noted that over 95 percent of all SMEs using landline telephones are also using mobile phones, indicating that mobile phone is effortlessly realising the role that landline phones used to play with the added ease of mobility and lower incremental cost. There is, however, a fair distribution of the performance dimensions between those using a landline and those not using a landline in urban areas. Between those using, and not using, a landline telephone, there is a weak association at 0.156 and 0.02 for the SMEs in rural and urban areas, respectively.
Table 5 shows more than 60 percent of the firms using computers in urban areas indicate better performance in all indicators compared to less than 40 percent of the firms not using computers. Out of those using computers in the remote areas, 42.11 percent have had growth in business profits compared to 33.33 percent of those not using computers. The same pattern is observed across all other indicators. To test for association, Fisher’s exact test of variable relationship is applied for the remote areas while Cramer’s V is applied for the rural and urban areas. Whilst Fisher’s exact indicates no relationship in the performance between those using computers and those not using, Cramer’s V indicates a very weak association.
12
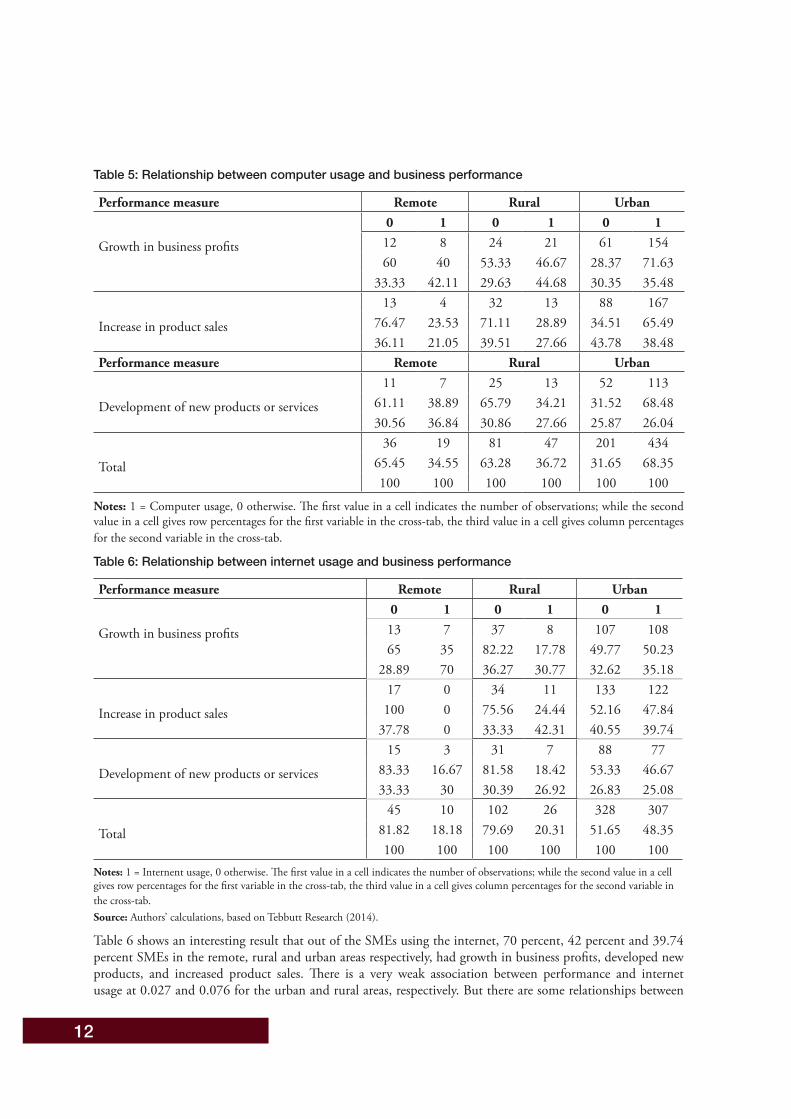
Table 5: Relationship between computer usage and business performance
Performance measure Remote Rural Urban
Growth in business profits
0 1 0 1 0 112 8 24 21 61 15460 40 53.33 46.67 28.37 71.63
33.33 42.11 29.63 44.68 30.35 35.48
Increase in product sales
13 4 32 13 88 16776.47 23.53 71.11 28.89 34.51 65.4936.11 21.05 39.51 27.66 43.78 38.48
Performance measure Remote Rural Urban
Development of new products or services
11 7 25 13 52 11361.11 38.89 65.79 34.21 31.52 68.4830.56 36.84 30.86 27.66 25.87 26.04
Total
36 19 81 47 201 43465.45 34.55 63.28 36.72 31.65 68.35100 100 100 100 100 100
Notes: 1 = Computer usage, 0 otherwise. The first value in a cell indicates the number of observations; while the second value in a cell gives row percentages for the first variable in the cross-tab, the third value in a cell gives column percentages for the second variable in the cross-tab.
Table 6: Relationship between internet usage and business performance
Performance measure Remote Rural Urban
Growth in business profits
0 1 0 1 0 113 7 37 8 107 10865 35 82.22 17.78 49.77 50.23
28.89 70 36.27 30.77 32.62 35.18
Increase in product sales
17 0 34 11 133 122100 0 75.56 24.44 52.16 47.84
37.78 0 33.33 42.31 40.55 39.74
Development of new products or services
15 3 31 7 88 7783.33 16.67 81.58 18.42 53.33 46.6733.33 30 30.39 26.92 26.83 25.08
Total
45 10 102 26 328 30781.82 18.18 79.69 20.31 51.65 48.35100 100 100 100 100 100
Notes: 1 = Internent usage, 0 otherwise. The first value in a cell indicates the number of observations; while the second value in a cell gives row percentages for the first variable in the cross-tab, the third value in a cell gives column percentages for the second variable in the cross-tab. Source: Authors’ calculations, based on Tebbutt Research (2014).
Table 6 shows an interesting result that out of the SMEs using the internet, 70 percent, 42 percent and 39.74 percent SMEs in the remote, rural and urban areas respectively, had growth in business profits, developed new products, and increased product sales. There is a very weak association between performance and internet usage at 0.027 and 0.076 for the urban and rural areas, respectively. But there are some relationships between
13
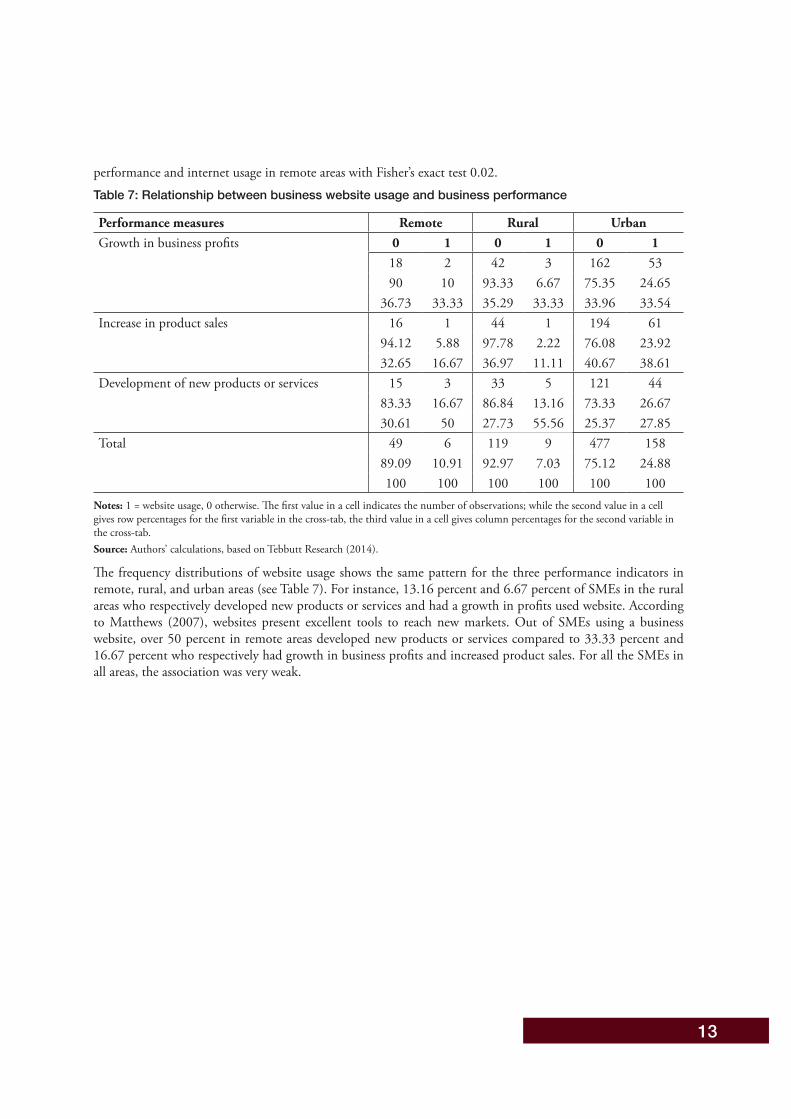
performance and internet usage in remote areas with Fisher’s exact test 0.02.Table 7: Relationship between business website usage and business performance
Performance measures Remote Rural UrbanGrowth in business profits 0 1 0 1 0 1
18 2 42 3 162 5390 10 93.33 6.67 75.35 24.65
36.73 33.33 35.29 33.33 33.96 33.54Increase in product sales
16 1 44 1 194 6194.12 5.88 97.78 2.22 76.08 23.9232.65 16.67 36.97 11.11 40.67 38.61
Development of new products or services
15 3 33 5 121 4483.33 16.67 86.84 13.16 73.33 26.6730.61 50 27.73 55.56 25.37 27.85
Total
49 6 119 9 477 15889.09 10.91 92.97 7.03 75.12 24.88100 100 100 100 100 100
Notes: 1 = website usage, 0 otherwise. The first value in a cell indicates the number of observations; while the second value in a cell gives row percentages for the first variable in the cross-tab, the third value in a cell gives column percentages for the second variable in the cross-tab. Source: Authors’ calculations, based on Tebbutt Research (2014).
The frequency distributions of website usage shows the same pattern for the three performance indicators in remote, rural, and urban areas (see Table 7). For instance, 13.16 percent and 6.67 percent of SMEs in the rural areas who respectively developed new products or services and had a growth in profits used website. According to Matthews (2007), websites present excellent tools to reach new markets. Out of SMEs using a business website, over 50 percent in remote areas developed new products or services compared to 33.33 percent and 16.67 percent who respectively had growth in business profits and increased product sales. For all the SMEs in all areas, the association was very weak.
14
Table 8: Multinomial probit results for growth in business profits
Urban Rural Rural and RemoteNo. of observations
log likelihood
Prob>chi2
635
-657.16
0.0002
128
-126.97
0.0963
183
-183.36
0.0854Variable Coef. z Coef. z Coef. zLandline telephone -0.06 -0.32 0.42 0.69 0.03 0.06Computer 0.21 0.99 1.24 2.49** 0.82 2.07**Internet -0.01 -0.03 -0.95 -1.62 -0.10 -0.2Website 0.01 0.03 0.92 0.97 0.48 0.67Mobile phone 1.79 2.42** Firm size 0.08 0.76 -0.63 -1.98** -0.26 -0.97Firm age 0.13 1.24 -0.08 -0.09 -0.12 -0.59Foreign 0.00 0.07 0.00 0.17Sole trader 0.26 0.37 Variable Coef. z Coef. z Coef. zNo formal education 0.15 0.19Primary education 0.52 1.26Technical education -0.85 -1.98**University education 0.11 0.26Islands -0.75 -3.37*** Momase -0.11 -0.45 Southern -0.57 -2.71*** Loan -0.11 -0.55 _cons -2.09 -2.57** 0.64 0.73 0.404 0.48
Key: Outcome event = increase in product sales is the base outcome; ***, **, & * denote 1%, 5% and 10% level of significance, respectively.
Econometric resultsMultinomial probit models (see Tables 8 and 9) for growth in business profit, development of new products and increment in product sales are estimated to gauge the magnitude and direction of the impact of various ICT resources on different dimensions of SME performance. To enhance understanding of whether each ICT element is a key constraint or enabler of small and medium entrepreneurship in urban PNG, compared to rural and remote places in the country, the models are separately estimated for urban and rural areas. Estimation of the model for remote areas alone did not give any meaningful results due to the limited number of observations involved; another model is therefore estimated for rural and remote areas combined.
The final multinomial probit model for each area was obtained after several diagnostic tests. The control variables varied across urban, rural and remote areas combined and for rural areas only. Insignificant variables and dummy variables having very few choices in one category in the original estimation were dropped based on a Wald test. The null hypothesis that all of the regression coefficients across the models are simultaneously equal to zero was rejected at the 10 percent level of significance.
15
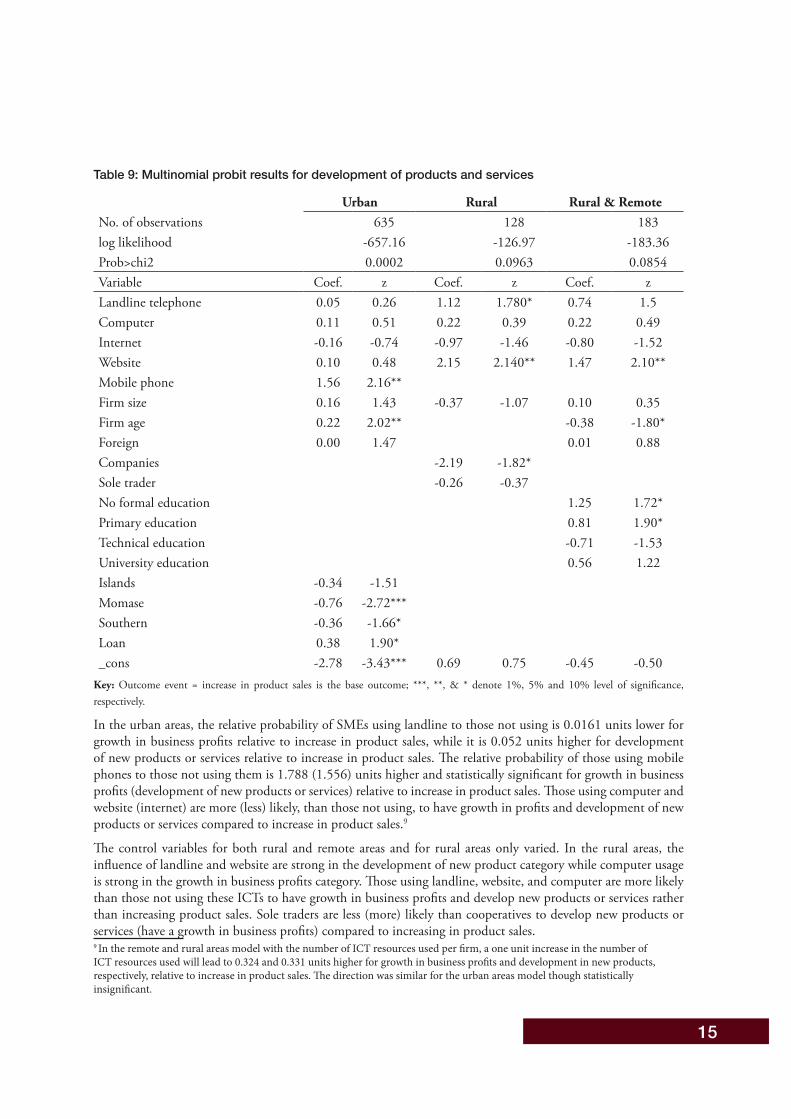
Table 9: Multinomial probit results for development of products and services
Urban Rural Rural & RemoteNo. of observations 635 128 183log likelihood -657.16 -126.97 -183.36Prob>chi2 0.0002 0.0963 0.0854Variable Coef. z Coef. z Coef. zLandline telephone 0.05 0.26 1.12 1.780* 0.74 1.5Computer 0.11 0.51 0.22 0.39 0.22 0.49Internet -0.16 -0.74 -0.97 -1.46 -0.80 -1.52Website 0.10 0.48 2.15 2.140** 1.47 2.10**Mobile phone 1.56 2.16** Firm size 0.16 1.43 -0.37 -1.07 0.10 0.35Firm age 0.22 2.02** -0.38 -1.80*Foreign 0.00 1.47 0.01 0.88Companies -2.19 -1.82* Sole trader -0.26 -0.37 No formal education 1.25 1.72*Primary education 0.81 1.90*Technical education -0.71 -1.53University education 0.56 1.22Islands -0.34 -1.51 Momase -0.76 -2.72*** Southern -0.36 -1.66* Loan 0.38 1.90* _cons -2.78 -3.43*** 0.69 0.75 -0.45 -0.50
Key: Outcome event = increase in product sales is the base outcome; ***, **, & * denote 1%, 5% and 10% level of significance, respectively.
In the urban areas, the relative probability of SMEs using landline to those not using is 0.0161 units lower for growth in business profits relative to increase in product sales, while it is 0.052 units higher for development of new products or services relative to increase in product sales. The relative probability of those using mobile phones to those not using them is 1.788 (1.556) units higher and statistically significant for growth in business profits (development of new products or services) relative to increase in product sales. Those using computer and website (internet) are more (less) likely, than those not using, to have growth in profits and development of new products or services compared to increase in product sales.9
The control variables for both rural and remote areas and for rural areas only varied. In the rural areas, the influence of landline and website are strong in the development of new product category while computer usage is strong in the growth in business profits category. Those using landline, website, and computer are more likely than those not using these ICTs to have growth in business profits and develop new products or services rather than increasing product sales. Sole traders are less (more) likely than cooperatives to develop new products or services (have a growth in business profits) compared to increasing in product sales.9 In the remote and rural areas model with the number of ICT resources used per firm, a one unit increase in the number of ICT resources used will lead to 0.324 and 0.331 units higher for growth in business profits and development in new products, respectively, relative to increase in product sales. The direction was similar for the urban areas model though statistically insignificant.
16
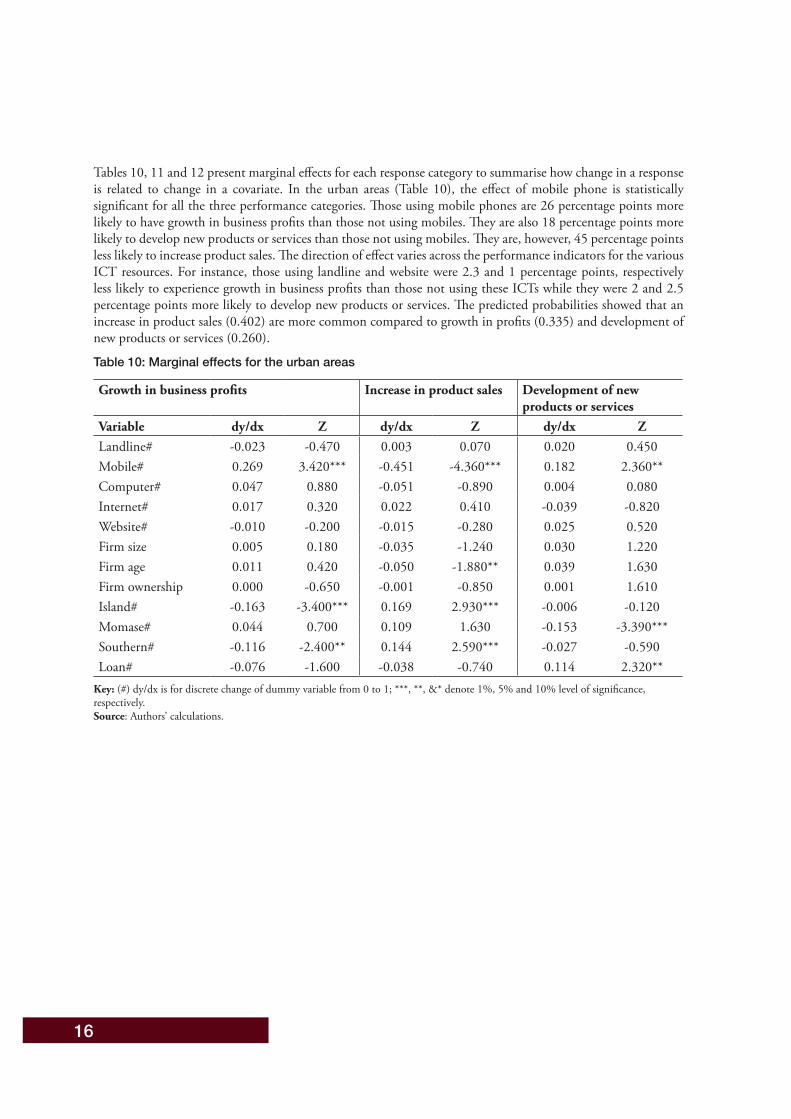
Tables 10, 11 and 12 present marginal effects for each response category to summarise how change in a response is related to change in a covariate. In the urban areas (Table 10), the effect of mobile phone is statistically significant for all the three performance categories. Those using mobile phones are 26 percentage points more likely to have growth in business profits than those not using mobiles. They are also 18 percentage points more likely to develop new products or services than those not using mobiles. They are, however, 45 percentage points less likely to increase product sales. The direction of effect varies across the performance indicators for the various ICT resources. For instance, those using landline and website were 2.3 and 1 percentage points, respectively less likely to experience growth in business profits than those not using these ICTs while they were 2 and 2.5 percentage points more likely to develop new products or services. The predicted probabilities showed that an increase in product sales (0.402) are more common compared to growth in profits (0.335) and development of new products or services (0.260).
Table 10: Marginal effects for the urban areas
Growth in business profits Increase in product sales Development of new products or services
Variable dy/dx Z dy/dx Z dy/dx ZLandline# -0.023 -0.470 0.003 0.070 0.020 0.450Mobile# 0.269 3.420*** -0.451 -4.360*** 0.182 2.360**Computer# 0.047 0.880 -0.051 -0.890 0.004 0.080Internet# 0.017 0.320 0.022 0.410 -0.039 -0.820Website# -0.010 -0.200 -0.015 -0.280 0.025 0.520Firm size 0.005 0.180 -0.035 -1.240 0.030 1.220Firm age 0.011 0.420 -0.050 -1.880** 0.039 1.630Firm ownership 0.000 -0.650 -0.001 -0.850 0.001 1.610Island# -0.163 -3.400*** 0.169 2.930*** -0.006 -0.120Momase# 0.044 0.700 0.109 1.630 -0.153 -3.390***Southern# -0.116 -2.400** 0.144 2.590*** -0.027 -0.590Loan# -0.076 -1.600 -0.038 -0.740 0.114 2.320**
Key: (#) dy/dx is for discrete change of dummy variable from 0 to 1; ***, **, &* denote 1%, 5% and 10% level of significance, respectively. Source: Authors’ calculations.
17
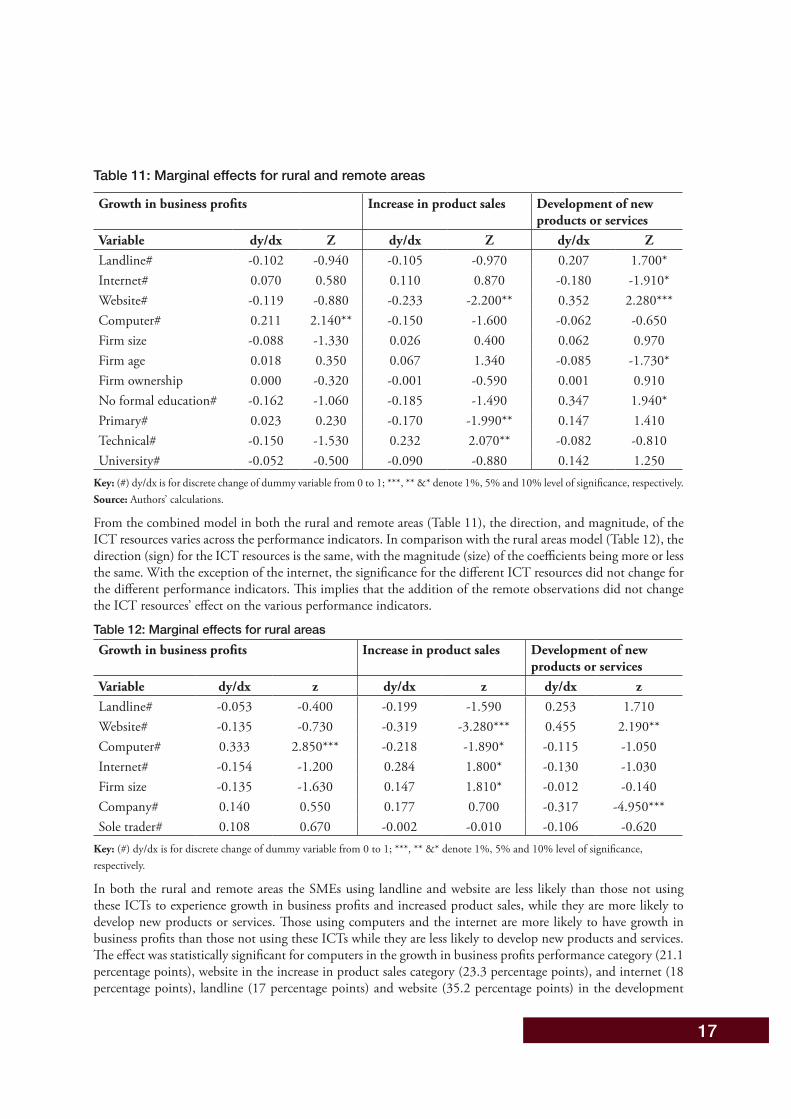
Table 11: Marginal effects for rural and remote areas
Growth in business profits Increase in product sales Development of new products or services
Variable dy/dx Z dy/dx Z dy/dx ZLandline# -0.102 -0.940 -0.105 -0.970 0.207 1.700*Internet# 0.070 0.580 0.110 0.870 -0.180 -1.910*Website# -0.119 -0.880 -0.233 -2.200** 0.352 2.280***Computer# 0.211 2.140** -0.150 -1.600 -0.062 -0.650Firm size -0.088 -1.330 0.026 0.400 0.062 0.970Firm age 0.018 0.350 0.067 1.340 -0.085 -1.730*Firm ownership 0.000 -0.320 -0.001 -0.590 0.001 0.910No formal education# -0.162 -1.060 -0.185 -1.490 0.347 1.940*Primary# 0.023 0.230 -0.170 -1.990** 0.147 1.410Technical# -0.150 -1.530 0.232 2.070** -0.082 -0.810University# -0.052 -0.500 -0.090 -0.880 0.142 1.250
Key: (#) dy/dx is for discrete change of dummy variable from 0 to 1; ***, ** &* denote 1%, 5% and 10% level of significance, respectively.Source: Authors’ calculations.
From the combined model in both the rural and remote areas (Table 11), the direction, and magnitude, of the ICT resources varies across the performance indicators. In comparison with the rural areas model (Table 12), the direction (sign) for the ICT resources is the same, with the magnitude (size) of the coefficients being more or less the same. With the exception of the internet, the significance for the different ICT resources did not change for the different performance indicators. This implies that the addition of the remote observations did not change the ICT resources’ effect on the various performance indicators.
Table 12: Marginal effects for rural areas Growth in business profits Increase in product sales Development of new
products or servicesVariable dy/dx z dy/dx z dy/dx zLandline# -0.053 -0.400 -0.199 -1.590 0.253 1.710Website# -0.135 -0.730 -0.319 -3.280*** 0.455 2.190**Computer# 0.333 2.850*** -0.218 -1.890* -0.115 -1.050Internet# -0.154 -1.200 0.284 1.800* -0.130 -1.030Firm size -0.135 -1.630 0.147 1.810* -0.012 -0.140Company# 0.140 0.550 0.177 0.700 -0.317 -4.950***Sole trader# 0.108 0.670 -0.002 -0.010 -0.106 -0.620
Key: (#) dy/dx is for discrete change of dummy variable from 0 to 1; ***, ** &* denote 1%, 5% and 10% level of significance, respectively.
In both the rural and remote areas the SMEs using landline and website are less likely than those not using these ICTs to experience growth in business profits and increased product sales, while they are more likely to develop new products or services. Those using computers and the internet are more likely to have growth in business profits than those not using these ICTs while they are less likely to develop new products and services. The effect was statistically significant for computers in the growth in business profits performance category (21.1 percentage points), website in the increase in product sales category (23.3 percentage points), and internet (18 percentage points), landline (17 percentage points) and website (35.2 percentage points) in the development
18
of new products or services performance category. According to Tebbutt (2014), most SMEs using computers (48.28%) in the rural and remote areas indicate remote location of the business, and crime and security to be the biggest obstacle to business profit growth. The predicted probabilities showed that growth in profits (0.356) was more common compared to increase in product sales (0.338) and development of new products or services (0.307).10
10 With regard to the number of ICT resources used per firm, one unit increase in the number of ICT resources used per firm is associated with growth in business profits, development of new products or services and increase in product sales being 4.8 percent (1.2%) more likely, 9 percent (1.5%) less likely and 4.4 percent (0.3%) more likely, respectively both rural and remote (urban) areas. The influence is significant in the development of new products or services at 5 percent level of significance for both the rural and remote areas model only.
19
In this paper, we have used Tebbutt Research (2014) survey data to examine the relationship between ICT resources and the performance of a sample of 1,066 SMEs in urban, rural and remote areas across 22 provinces of PNG. The ICT resources considered include mobile phones, landline telephone, computer, website and internet, while performance of SMEs was captured using three measures; namely, growth in business profits, increase in product sales, and development of new products or services.
Overall, over 95 percent of the SMEs in the sample use mobile phones in remote, rural, and urban areas. The numbers of firms using computers, websites and the internet are low in all the three locations. In remote locations,10.9 percent of SMEs used websites, 18.2 percent used the internet, while 34.6 percent used computers. In rural areas, 7.0 percent of SMEs used website, 20.31 percent used the internet, while 36.7 percent used computers. In remote and rural areas, 16.36 percent and 20.31 percent of SMEs were using landline telephone, respectively. In the urban areas, with the exception of firms using website (24.88%) and internet (48.35%), the number of firms using landline telephone and computer were relatively high at over 55 percent.
Qualitative analysis of the survey data suggests that, regardless of the ICT resource used, most SMEs in the urban areas increased product sales while those in the remote and rural areas had growth in business profits. Most SMEs in the rural areas using landline, website and internet developed new products, while most of the SMEs using computer and mobile phones respectively had growth in business profits and increased product sales. It is, however, important to note that investing in, and using ICT resources may be a necessary, but not sufficient, condition for improving enterprise performance.
We therefore run multinomial logistic regressions where we controlled for various firm and owner or manager characteristics as potential complements of ICT adoption and usage. In the urban areas, the SMEs using mobile phones are more likely to develop new products or services and have growth in business profits than those not using mobile phones. They are, however, less likely to increase product sales. In both the remote and rural areas, the regression results indicate that SMEs using landline and website are more likely to develop new products or services, while those using computer are more likely to grow their business profits. Those using website and internet are, however, less likely to increase product sales or develop new products or services.
Since the Government of PNG is planning to establish ICT systems and tools to support SME business development and growth, our findings have the following policy implications. First, the low number of SMEs using various ICT resources other than mobile phones is symptomatic of the fact that rural and remote places across the country have little or no access to ICT infrastructure. While policy makers should generally aim at improving the physical and business infrastructure systems in both remote and rural areas in PNG, investing in ICT infrastructure that is networked across the country should be a priority. Only then will SMEs in PNG be able to connect to the planned ICT support services and be able to achieve the highest ICT induced business development and growth.
Second, the SME owners or managers should align ICT investments with appropriate skills that make ICT work and adopt organisational processes that consider the role of ICT (Tarute and Gatautis, 2014). Indeed, previous studies (e.g. Mishra, Odhuno & Smyth, 2017) observe that some PNG SMEs, especially the firms with majority female ownership, do not view adopting ICT as an option for improving their business performance and growth. As a step in the right direction, the Department of Trade, Commerce and Industry (2016a) has identified entrepreneurial mindset change as a factor that could lead to increased numbers of SME using new technologies, including ICT. Targeted education and training are therefore necessary to assure SME owners and managers that ICT is critical to improving their firms’ performance.
Third, since SMEs using mobile phones, internet, and landline are more likely to innovate; that is, introduce a new product or service, the innovators should be protected from intellectual property (IP) infringement. This can be done through not only being encouraged to register with the Intellectual Property Office of Papua New Guinea (IPOPNG), but also through education about the importance of IP as an important tool in trade and
Summary and policy recommendations

20
investment, as noted by Hannet (2015). To encourage the SMEs to register their IPs, the government should reduce the bureaucratic requirements (paper work and red tape) that could be an obstacle to innovation by SMEs. Noting that PNG has one of the highest levels of ‘red tape’ in the world (Sanday, 2012), a favourable regulatory regime, which has been found to benefit the ICT sector in general (Peake, 2013), is needed to support innovative SME adopting ICT for business in the country.
21
Adams, C. and Neely, A. (2002). Prism reform. Financial Management, 5:28-31.
Akomea-Bonsu, C., & Sampong, F. (2012). The impact of information and communication technologies (ICT) on small and medium scale enterprises (SMEs) in the Kumasi Metropolis, Ghana, West Africa. European Journal of Business and Management, 4(20):152–158.
Alam, S.S., and Noor, M.K.M. (2009). ICT adoption in small and medium enterprises: An empirical evidence of service sectors in Malaysia. International Journal of Business and Management, 4(2):112–125.
Amaratunga, D., and Baldry, D. (2002). Moving from performance measurement to performance management. Facilities, 20(5/6):217–223.
Ashrafi, R., and Murtaza, M. (2008). Use and impact of ICT on SMEs in Oman. The Electronic Journal Information Systems Evaluation, 11(3):125–138.
Atrostic, B., and Gates, J. (2001). US productivity and electronic processes in manufacturing (CES WP-01–11). Washington D.C.: Center for Economic Studies.
Atrostic, B., Boegh-Nielsen, P., and Motohashi, K. (2002). IT, Productivity and growth in enterprises: Evidence from new international micro data. (Paper presented at OECD Workshop on ICT and Business Performance, December 2002).
Atrostic B.K., and Nguyen S. (2002). Computer networks and US manufacturing plant productivity: New evidence from the CNUS data. Washington D.C.: Centre for Economic Studies, US Census Bureau.
Bayo-Moriones, A., Billon, M., and Lera-Lopez, F. (2013). Perceived performance effects of ICT in manufacturing SMEs. Industrial Management & Data Systems, 113(1):117–135. Available at: http://dx.doi. org/10.1108/02635571311289700 (accessed 30 September 2017).
Bertschek, I., and Fryges, H. (2002). The adoption of business-to-business e-commerce: Empirical evidence for German companies (ZEW Discussion Paper No. 02–05). Mannheim: ZEW.
Boothby, D., Dufour, A., and Tang, J. (2010). Technology adoption, training and productivity performance. Research Policy, 39(5):650–661.
Brynjolfsson, E. and Hitt, L. (2000). Beyond computation: Information technology, organizational transformation and business performance. Journal of Economic Perspectives, 14(4):23-48.
Chen, L.Y. (2015). Exploring the quality of mobile shopping system and its link to the organizational performance. International Journal of Information Processing and Management, 6(1):19–29.
Consoli, D. (2012). Literature analysis on determinant factors and the impact of ICT in SMEs. Procedia – Social and Behavioral Sciences, Vol 62:93–97. Available at: http://dx.doi.org/10.1016/j.sbspro.2012.09.016 (accessed 29 August 2017).
Criscuolo, C., and Waldron, K., (2003). Computer network use and productivity in the United Kingdom. United Kingdom: Centre for Research into Business Activity and Office of National Statistics.
Dalrymple, J.F. (2004). Performance measurement for SME growth: A business profile benchmarking approach (Second World Conference on POM and 15th Annual POM Conference, Cancun, Mexico, April 30-May 3, 2004). Available at: https://www.pomsmeetings.org/ConfProceedings/002/POMS_CD/Browse%20This%20 CD/PAPERS/002-0164.pdf (Accessed 23 September 2017).
Das, S., Yaylacicegi, U., and Menon, N. (2011). The effect of information technology investments in healthcare: A longitudinal study of its lag, duration, and economic value. IEEE Transactions on Engineering Management, 58(1):124–138.
References
Department of Information & Communication. (2008). Papua New Guinea National ICT Policy 2008. Port Moresby: Department of Information and Communication.
Department of Information & Communication. (2009). Papua New Guinea National ICT Policy Phase 2: Final Report. Port Moresby: Department of Information and Communication.
Department of Treasury. (2017). PNG National Budget Volume 1: Economic and Development Policies. Port Moresby: Department of Treasury.
Gatautis, R. and Tarute, A. (2014). ICT impact on competitiveness: The case of private sector in Lithuania. The Macrotheme Review, 3(9): 31–39.
Gretton, P., Gali, J., and Parham, D. (2004). The effects of ICTs and complementary innovations on Australian productivity growth. In OECD (2004), The economic impact of ICT: Measurement, evidence and implications (pp.105–130). Paris: OECD.
Hannet, G. (2015, 7 July). Intellectual property rights – Galip challenges. The National. Available at: http:// www.thenational.com.pg/intellectual-property-rights-galip-challenges (accessed 25 September 2017).
Hasan, F.S.M.A. and Almubarak, M.M.S. (2016). Factors that influence women entrepreneurs’ performance in SMEs. World Journal of Entrepreneurship, Management and Sustainable Development, 12(2):82–101.
ITU ICT. (2015). Facts and figures. Available at http://www.itu.int/en/ITU-D/Statistics/ Documents/facts/ ICTFactsFigures2015.pdf (accessed 23 September 2017).
Kotane, I. (2015). Evaluating the importance of financial and non-financial indicators for the evaluation of company’s performance. Management Theory and Studies for Rural Business and Infrastructure Development, 37(1):80–94.
Lal, K. (1996). Information technology, international orientation and performance: A case study of electrical and electronic goods manufacturing firms in India. Information Economics and Policy, 8(3):269–280.
Liang, T.P., You, J.J., and Liu, C.C. (2010). A resource-based perspective on information technology and firm performance: A Meta-Analysis. Industrial Management & Data Systems, 110(8):1138–1158.
Manochehri, N.N., Al-Esmail, R., and Ashrafi, R. (2012). Examining the impact of information and communication technologies (ICT) on enterprise practices: A preliminary perspective from Qatar. The Electronic Journal on Information Systems in Developing Countries (EJISDC), 51(3):1–16.
Matthews, P. (2007). ICT assimilation and SME expansion. Journal of International Development, 19:817–827. Available at: http://dx.doi.org/10.1002/jid.1401 (accessed 25 September 2017).
Ministry of Trade, Commerce & Industry. (2016a). Papua New Guinea small and medium enterprise policy 2016. Port Moresby: Ministry of Trade, Commerce & Industry.
Ministry of Trade, Commerce & Industry. (2016b). SME master plan 2016–2030: Road map to inclusive & sustainable economic growth for a harmonious and prosperous Papua New Guinea. Port Moresby: Ministry of Trade, Commerce & Industry.
Mishra, V., Odhuno, F., and Smyth, R. (2017). How do perceived obstacles to operation and expansion relate to subjective measures of enterprise performance? Evidence from a survey of SMEs in Papua New Guinea (PNG NRI Discussion Paper 150). Port Moresby: Papua New Guinea National Research Institute.
Mishra, V. and Smyth, R. (2016). A scoping study to provide an assessment of SME policy priority areas for Papua New Guinea. (PNG NRI Discussion Paper 146). Port Moresby: Papua New Guinea National Research.
Mohamed, E. (2014). Do ICTs affect workforce productivity in Egyptian industrial organizations? Telfor
22
23
Journal, 6(1):80–84.
Moorthy, K.M., Annie T., Caroline C., Chang S.W., Jonathan T.Y.P., and Tan K.L. (2012). A study on factors affecting the performance of SMEs in Malaysia. International Journal of Academic Research in Business and Social Sciences, 2(4):224–239.
Moullin, M. (2002). Delivering excellence in health and social care. Buckingham: Open University Press.
Motohashi, K. (2001). Economic analysis of information network use: Organizational and productivity impacts on Japanese firms. Research and Statistics Department, METI, Mimeo.
Müller-Falke, D. (2001). The use of telecommunication and information technologies in small businesses — Evidence from Indian small-scale industry. (Unpublished draft).
Murphy, G.B., Trailer, J.W., and Hill, R.C. (1996). Measuring performance in entrepreneurship research. Journal of Business Research, 36(1):15–23.
Neely, A. (1999). The performance measurement revolution: Why now and what next? International Journal of Operations & Production Management, 19(2):205–228.
Ngui Muchai, D., and Kimuyu, P. (2017). Prospects for information and communication technology-enabled services in Kenya: The case of the mobile money transfer industry (WIDER Working Paper 2017/86). Helsinki: UNU-WIDER. Available at: https://www.wider.unu.edu/publication/prospects- information-and-communications-technology-enabled-services-kenya (accessed 25 September 2017).
Nyandoro, C.K. (2016). Factors influencing information communication technology (ICT) Acceptance and use in small and medium enterprises (SMEs) in Kenya (ProQuest10024096, Ph.D. Dissertation). Ann Arbor: Capella University, ProQuest LLC.
Ong, S.Y.Y., Habidin, N.F., Salleh, M. I., and. Fuzi, N.M. (2016). The relationship between ICT adoption and business performance in Malaysia and Indonesia. Malaysian Journal of Society and Space, 12(12):40-49.
Ollo-Lopez, A., and Aramendia-Muneta, M.E. (2012). ICT impact on competitiveness, innovation and environment. Telematics and informatics, 29(2):204–210.
Peake, A. (2013). Kenya’s ICT sector, mobile money and the transformation to a middle-income country. Available at: http://www.glocom.ac.jp/j/chijo/118/101-113_B_adam.pdf? (accessed 10 September 2017).
Pilat, D. (2004). The ICT productivity Ppradox: Insights from micro data (OECD Economic Studies No. 38, 2004/1). Available at: https://www.oecd.org/eco/growth/35028181.pdf (accesses 10 September 2017).
Productivity Commission. (2004). ICT use and productivity: A synthesis from studies of Australian firms (Commissioned Research Paper). Canberra: Author.
PWC. (2016). Overview and commentary — PNG SME policy. Available at www.pwc.com/pg/publications (September 2017).
Quiang, C., Clarke, G., and Halewood, N. (2006). The role of ICT in doing business. Washington D.C.: World Bank.
Rahayu, R. and Day, J. (2017). E-commerce adoption by SMEs in developing countries: Evidence from Indonesia. Eurasian Business Review, 7: 25. Available at: https://doi.org/10.1007/s40821-016-0044-6 (accessed 2 October 2017)
Rasoulinia, S., Meymand, M.M., & Maloumi, H. (2015). The impact of information and communication technology (ICT) of Tehran municipality council staff. International Journal of Review in Life Sciences, 5(8):797–803.
24
Sakai, K. (2002). Global industrial restructuring: Implications for small firms (STI Working Papers 2002/4). Paris: OECD.
Sanday, H. 2012. Supporting the growth of private enterprise: The role of sub-national governments in Papua New Guinea (Manuscript). UNSW, Canberra: School of Business.
Santos, J.B., and Brito, L.A.L. (2012). Toward a subjective measurement model for firm performance. Brazilian Administration Review (BAR), 9(6):95–117. Available at: http://dx.doi.org/ 10.1590/S1807- 76922012000500007 (accessed 10 October 2017).
Setiawan, M., Indiastuti, R., and Destevanie, P. (2015). Information technology and competitiveness: Evidence rom micro, small and medium enterprises in Cimahi District, Indonesia. International Journal of Entrepreneurship and Small Business, 25(4):475–493.
Tarute, A., and Gatautis, R. (2014). ICT impact on SMEs performance. Procedia - Social and Behavioral Sciences, Vol 110: 1218–1225.
Tebbutt Research. (2014). Report for SME baseline survey for the small and medium enterprise access to finance project. Port Moresby: PNG Department of Commerce, Trade and Industry.
Tohmatsu, D.T. (2016). Why are internet prices high in Papua New Guinea? (PNG NRI Discussion Paper 148). Port Moresby: Papua New Guinea National Research Institute. Available at https://pngnri.org/wp- content/uploads/2016/10/DP148-201610-Deloitte-Internet-Prices.pdf (accessed 30 September 2017).
UNCTAD Secretariat. (2005). Improving the competitiveness of SMEs through enhancing productive capacity. Proceedings of four expert meetings. New York and Geneva: United Nations, pp.3–24.
Watson, A.H.A. (2015). Facilitating development through the use of mobile phones. Contemporary PNG Studies: DWU Research Journal, 22:141–151.
Wolf, S. (2001). Determinants and impact of ICT use for African SMEs implications for rural South Africa, Trade and Industrial Policy Strategies, 2001 annual forum, Misty Hills, Muldersdrift. Available at: http://citeseerx.ist.psu.edu/viewdoc/download?doi=10.1.1.453.6677&rep=rep1&type=pdf (accessed 13 August 2017).
Wu, D. (2009). Measuring performance in small and medium enterprises in the information & communication technology industries (Ph.D thesis). Melbourne: RMIT University. Available at https:// researchbank. rmit.edu.au/eserv/rmit:6859/Wu.pdf (accessed 13 August 2017).
Zaremohzzabieh Z., Samah B.A., Muhammad M., Omar S.Z., Bolong J., Hassan M.S., and Shaffril, H.A.M. (2015). A test of the technology acceptance model for understanding the ICT adoption behavior of rural young entrepreneurs. International Journal of Business and Management, 10(2):158–169.
25
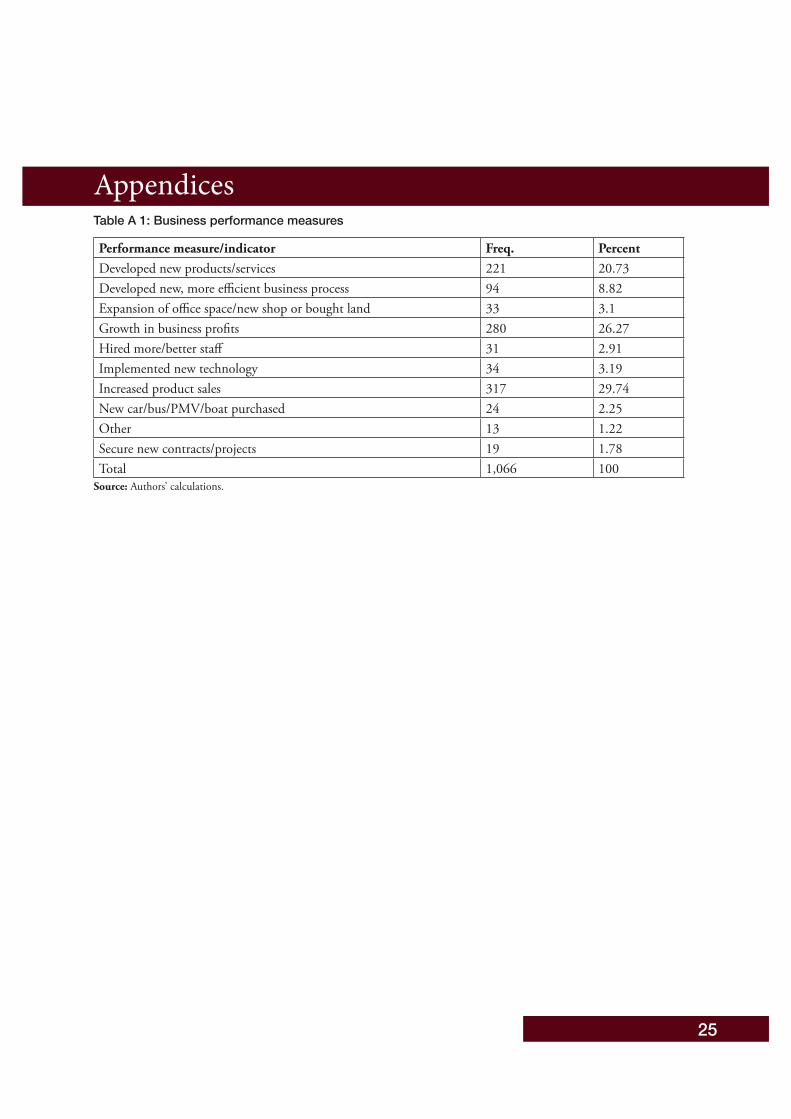
AppendicesTable A 1: Business performance measures
Performance measure/indicator Freq. PercentDeveloped new products/services 221 20.73Developed new, more efficient business process 94 8.82Expansion of office space/new shop or bought land 33 3.1Growth in business profits 280 26.27Hired more/better staff 31 2.91Implemented new technology 34 3.19Increased product sales 317 29.74New car/bus/PMV/boat purchased 24 2.25Other 13 1.22Secure new contracts/projects 19 1.78Total 1,066 100
Source: Authors’ calculations.
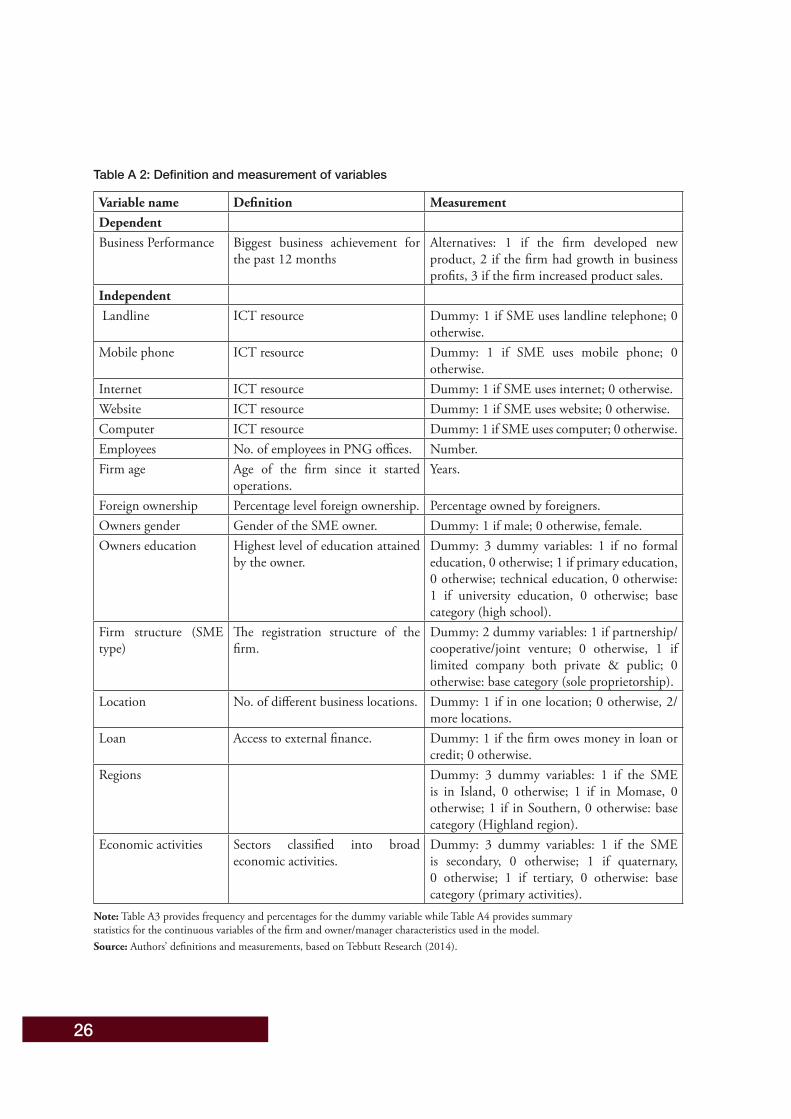
Table A 2: Definition and measurement of variables
Variable name Definition MeasurementDependentBusiness Performance Biggest business achievement for
the past 12 monthsAlternatives: 1 if the firm developed new product, 2 if the firm had growth in business profits, 3 if the firm increased product sales.
Independent Landline ICT resource Dummy: 1 if SME uses landline telephone; 0
otherwise.Mobile phone ICT resource Dummy: 1 if SME uses mobile phone; 0
otherwise.Internet ICT resource Dummy: 1 if SME uses internet; 0 otherwise.Website ICT resource Dummy: 1 if SME uses website; 0 otherwise.Computer ICT resource Dummy: 1 if SME uses computer; 0 otherwise.Employees No. of employees in PNG offices. Number.Firm age Age of the firm since it started
operations.Years.
Foreign ownership Percentage level foreign ownership. Percentage owned by foreigners.Owners gender Gender of the SME owner. Dummy: 1 if male; 0 otherwise, female.Owners education Highest level of education attained
by the owner.Dummy: 3 dummy variables: 1 if no formal education, 0 otherwise; 1 if primary education, 0 otherwise; technical education, 0 otherwise: 1 if university education, 0 otherwise; base category (high school).
Firm structure (SME type)
The registration structure of the firm.
Dummy: 2 dummy variables: 1 if partnership/cooperative/joint venture; 0 otherwise, 1 if limited company both private & public; 0 otherwise: base category (sole proprietorship).
Location No. of different business locations. Dummy: 1 if in one location; 0 otherwise, 2/more locations.
Loan Access to external finance. Dummy: 1 if the firm owes money in loan or credit; 0 otherwise.
Regions Dummy: 3 dummy variables: 1 if the SME is in Island, 0 otherwise; 1 if in Momase, 0 otherwise; 1 if in Southern, 0 otherwise: base category (Highland region).
Economic activities Sectors classified into broad economic activities.
Dummy: 3 dummy variables: 1 if the SME is secondary, 0 otherwise; 1 if quaternary, 0 otherwise; 1 if tertiary, 0 otherwise: base category (primary activities).
Note: Table A3 provides frequency and percentages for the dummy variable while Table A4 provides summary statistics for the continuous variables of the firm and owner/manager characteristics used in the model. Source: Authors’ definitions and measurements, based on Tebbutt Research (2014).
26
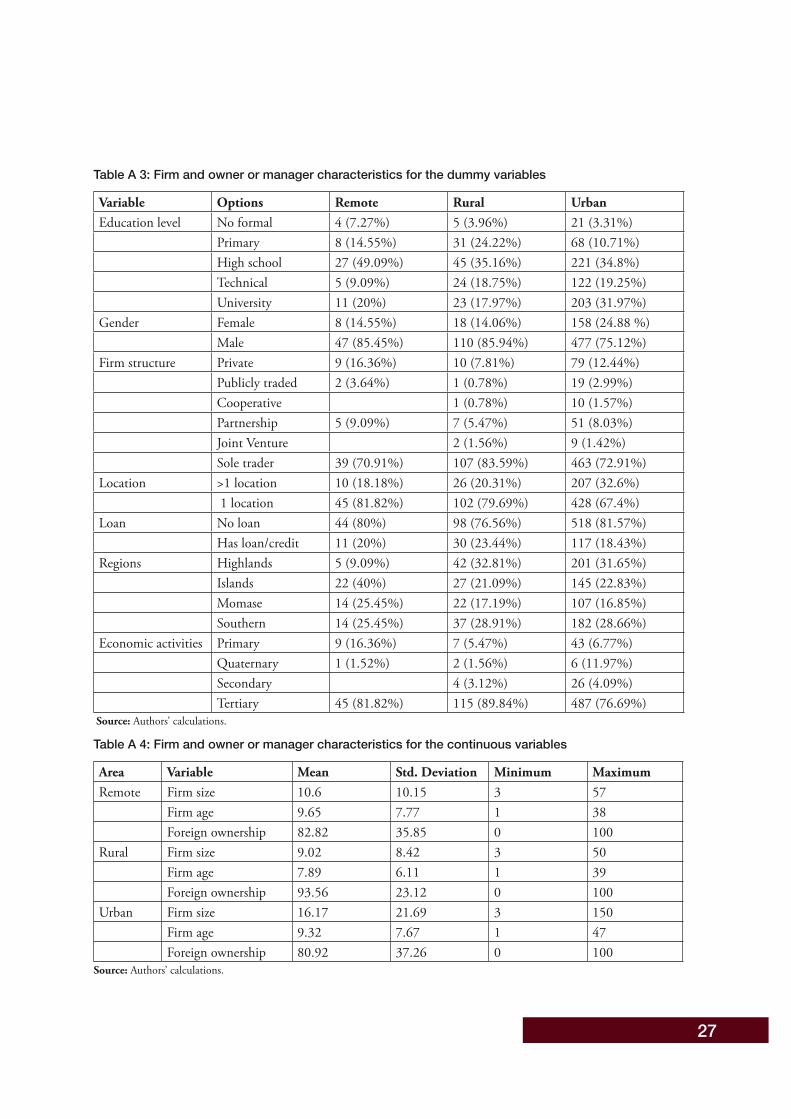
Table A 3: Firm and owner or manager characteristics for the dummy variables
Variable Options Remote Rural UrbanEducation level No formal 4 (7.27%) 5 (3.96%) 21 (3.31%)
Primary 8 (14.55%) 31 (24.22%) 68 (10.71%)High school 27 (49.09%) 45 (35.16%) 221 (34.8%)Technical 5 (9.09%) 24 (18.75%) 122 (19.25%)University 11 (20%) 23 (17.97%) 203 (31.97%)
Gender Female 8 (14.55%) 18 (14.06%) 158 (24.88 %)Male 47 (85.45%) 110 (85.94%) 477 (75.12%)
Firm structure Private 9 (16.36%) 10 (7.81%) 79 (12.44%)Publicly traded 2 (3.64%) 1 (0.78%) 19 (2.99%)Cooperative 1 (0.78%) 10 (1.57%)Partnership 5 (9.09%) 7 (5.47%) 51 (8.03%)Joint Venture 2 (1.56%) 9 (1.42%)Sole trader 39 (70.91%) 107 (83.59%) 463 (72.91%)
Location >1 location 10 (18.18%) 26 (20.31%) 207 (32.6%) 1 location 45 (81.82%) 102 (79.69%) 428 (67.4%)
Loan No loan 44 (80%) 98 (76.56%) 518 (81.57%)Has loan/credit 11 (20%) 30 (23.44%) 117 (18.43%)
Regions Highlands 5 (9.09%) 42 (32.81%) 201 (31.65%)Islands 22 (40%) 27 (21.09%) 145 (22.83%)Momase 14 (25.45%) 22 (17.19%) 107 (16.85%)Southern 14 (25.45%) 37 (28.91%) 182 (28.66%)
Economic activities Primary 9 (16.36%) 7 (5.47%) 43 (6.77%)Quaternary 1 (1.52%) 2 (1.56%) 6 (11.97%)Secondary 4 (3.12%) 26 (4.09%)Tertiary 45 (81.82%) 115 (89.84%) 487 (76.69%)
Source: Authors’ calculations.
Table A 4: Firm and owner or manager characteristics for the continuous variables
Area Variable Mean Std. Deviation Minimum MaximumRemote Firm size 10.6 10.15 3 57
Firm age 9.65 7.77 1 38Foreign ownership 82.82 35.85 0 100
Rural Firm size 9.02 8.42 3 50Firm age 7.89 6.11 1 39Foreign ownership 93.56 23.12 0 100
Urban Firm size 16.17 21.69 3 150Firm age 9.32 7.67 1 47Foreign ownership 80.92 37.26 0 100
Source: Authors’ calculations.
27
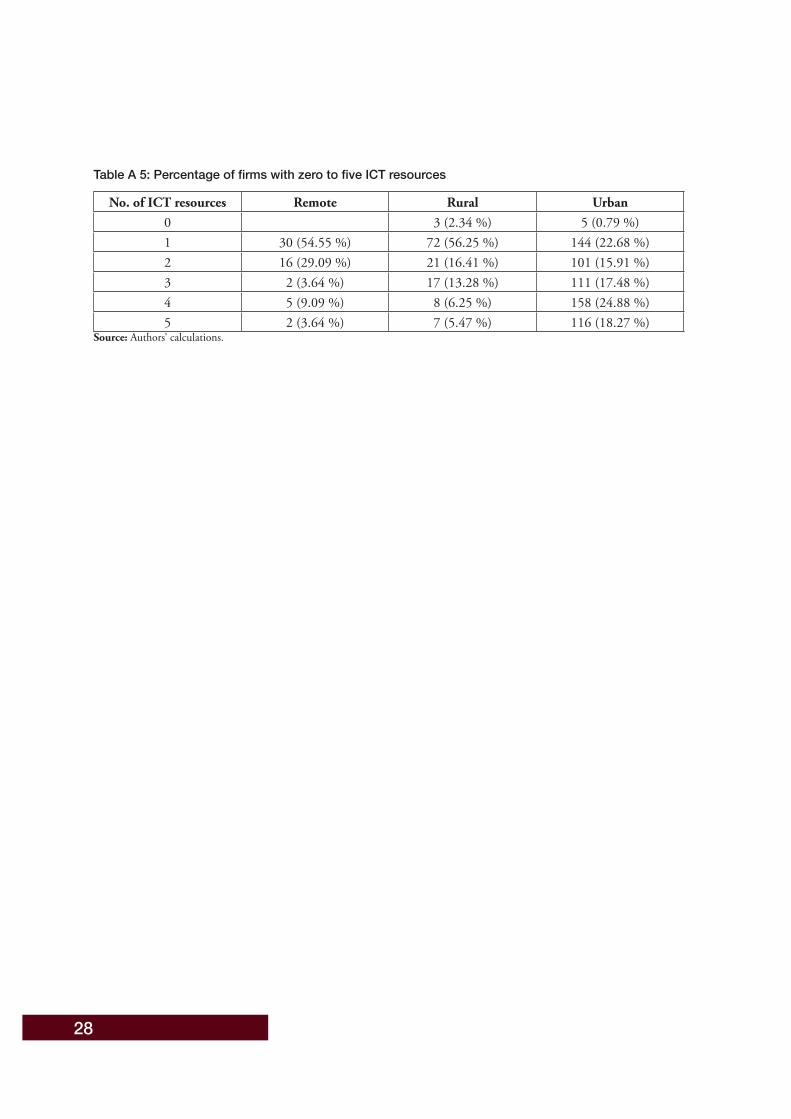
Table A 5: Percentage of firms with zero to five ICT resources
No. of ICT resources Remote Rural Urban0 3 (2.34 %) 5 (0.79 %)1 30 (54.55 %) 72 (56.25 %) 144 (22.68 %)2 16 (29.09 %) 21 (16.41 %) 101 (15.91 %)3 2 (3.64 %) 17 (13.28 %) 111 (17.48 %)4 5 (9.09 %) 8 (6.25 %) 158 (24.88 %)5 2 (3.64 %) 7 (5.47 %) 116 (18.27 %)
Source: Authors’ calculations.
28


The National Research Institute, PO Box 5854, Boroko, Port Moresby, National Capital District 111,
Papua New Guinea; Telephone +675 326 0300; Email: [email protected]
This and other NRI publications are available from www.pngnri.org.
This publication is supported by the Australian Government in partnership with the
Government of Papua New Guinea.


![Gameboy Advance: iss-de - Deutsch...Gameboy Advance: iss-de German manual [Index] [1] DSCN0949.JPG DSCN0950.png DSCN0954.png DSCN0955.png DSCN0956.png DSCN0957.png DSCN0958.png DSCN0959.png](https://static.fdocuments.us/doc/165x107/5f266ceceb0d265fef10f12f/gameboy-advance-iss-de-deutsch-gameboy-advance-iss-de-german-manual-index.jpg)