Use and Conservation of Indigenous Fruit Tree Diversity...
75
Use and Conservation of Indigenous Fruit Tree Diversity for Improved Livelihoods in Eastern Africa Uganda Country Report By Clement A. Okia Vincent I. Opolot Jude Sekatuba Balikitenda M. Katumba John F. Esegu National Forestry Resources Research Institute (NaFORRI) P. O. Box 1752, Kampala, Uganda December, 2008
Transcript of Use and Conservation of Indigenous Fruit Tree Diversity...

Use and Conservation of Indigenous Fruit Tree Diversity for Improved Livelihoods in Eastern Africa
Uganda Country Report
By
Clement A. Okia Vincent I. Opolot Jude Sekatuba
Balikitenda M. Katumba John F. Esegu
National Forestry Resources Research Institute (NaFORRI)
P. O. Box 1752, Kampala, Uganda
December, 2008
ii
Use and Conservation of Indigenous Fruit Tree Diversity for Improved Livelihoods in Eastern Africa
Uganda Country Report
By
Clement A. Okia Vincent I. Opolot Jude Sekatuba
Balikitenda M. Katumba John F. Esegu
National Forestry Resources Research Institute (NaFORRI)
P. O. Box 1752, Kampala, Uganda
December, 2008

iii
Cover pictures Priority indigenous fruit trees for Teso and Lango sub-regions, Uganda Left to right downwards 1. Vitellaria paradoxa – a tree in a fallow land in Abako, Lira district, kernnels sold and a middleman bulking kernnels in a local market in Ocorimongin, Katakwi district. 2. Tamarindus indica – a tree in fruit in fallow land in Katine, Soroti district, smallscale selling of fruits in a local market (Ocorimongin, Katakwi district), middleman selling fruits in urban market in Soroti town. 3. Vitex doniana – a tree with green fruits near a road in Katine, Soroti district, a branch with mature fruits in the wild in Bata, Dokolo district and ripe fruits (black) picked from on-farm Usuk, Katakwi district 4. Borassus aethiopum – trees on-farm in Gogonyo, Pallisa district, tree in fruit on-farm in Amac,Lira district and testing of Borassus wine made by a small scale woman entreprenuer in Soroti town. 5. Carissa edulis – not in picture, is mainly eaten causally and used for wine making in Lira district.
© All pictures by Clement A. Okia and Vincent I. Opolot

iv
Table of Contents
SUMMARY --------------------------------------------------------------------------------------------------------------------------------------- viii 1.0 INTRODUCTION ------------------------------------------------------------------------------------------------------------------------ 1 2.0 STUDY AREA AND METHODS ---------------------------------------------------------------------------------------------------- 2 2.1 Description of study area -------------------------------------------------------------------------------------------------------------- 2 2.2 Methods ----------------------------------------------------------------------------------------------------------------------------------- 4 2.2.1 Species prioritization studies --------------------------------------------------------------------------------------------------------- 4 2.2.2 Marketing of priority IFTs ------------------------------------------------------------------------------------------------------------- 6 2.2.3 Priority IFTs threats -------------------------------------------------------------------------------------------------------------------- 6 2.2.4 Priority IFTs biological characterization ------------------------------------------------------------------------------------------ 7 2.2.5 Data analysis ---------------------------------------------------------------------------------------------------------------------------- 7 3.0 RESULTS ------------------------------------------------------------------------------------------------------------------------------- 7 3.1 Species prioritization ---------------------------------------------------------------------------------------------------------------- 7 3.1.1 Socio-economic characteristics of the respondents --------------------------------------------------------------------------- 7 3.1.2 Household size and headship ------------------------------------------------------------------------------------------------------- 9 3.1.3 Priority species selection ------------------------------------------------------------------------------------------------------------- 9 3.1.4 Information on priority indigenous fruit trees for Uganda ------------------------------------------------------------------ 11 3.1.5 Household food security ------------------------------------------------------------------------------------------------------------ 12 3.1.5.1 Food crops and animals ------------------------------------------------------------------------------------------------------------ 12 3.1.5.2 Food availability and role of IFTs ------------------------------------------------------------------------------------------------- 13 3.1.5.3 Other household hunger copping strategies ---------------------------------------------------------------------------------- 14 3.1.5.4 On-farm retention and conservation of of IFTs on-farms ------------------------------------------------------------------ 15 3.1.5.5 Growing of IFTs and exotic fruits on-farms ------------------------------------------------------------------------------------ 17 3.1.5.6 Constraints and possible solutions to IFTs utilisation ----------------------------------------------------------------------- 20 3.1.6 Required improvements, pests, diseases and constraints on priority IFTs -------------------------------------------- 21 3.1.6.1 Required improvements, pests, diseases and constraints on V. paradoxa ------------------------------------------- 21 3.1.6.2 Pests and diseases for Vitellaria paradoxa ------------------------------------------------------------------------------------ 21 3.1.6.3 Constraints and possible solutions to Utilisation of V. paradoxa --------------------------------------------------------- 22 3.1.6.4 Required improvements, pests, diseases and constraints on T. indica ------------------------------------------------ 23 3.1.6.5 Major pests and disease for T. indica ------------------------------------------------------------------------------------------- 24 3.1.6.6 Constraints on Utilisation of Tamarindus indica ------------------------------------------------------------------------------ 25 3.1.6.7 Required improvements, pest, diseases and constraints on V. doniana ----------------------------------------------- 26 3.1.6.8 Constraints and possible solutions to Utilisation of V. doniana ----------------------------------------------------------- 27 3.1.6.9 Required improvements, pest, diseases and constraints on B. aethiopum ------------------------------------------- 28 3.1.6.10 Constraints associated with Utilisation of Borassus aethiopum ---------------------------------------------------------- 29 3.1.6.11 Required improvements, pest and diseases and constraints on C. edulis -------------------------------------------- 30 3.1.6.12 Constraints and possible solutions for Utilisation of Carissa -------------------------------------------------------------- 30 3.1.6.13 Required improvements, pest and diseases and constraints on S. birrea --------------------------------------------- 31 3.2 Marketing of Tamarindus indica, Vitex doniana and Sclerocarya birrea in Uganda -------------------------- 32 3.2.1 Selection of markets ------------------------------------------------------------------------------------------------------------------ 32 3.2.2 Socio-economic characteristics of respondents ------------------------------------------------------------------------------- 33 3.2.3 Marketing of priority fruits ----------------------------------------------------------------------------------------------------------- 33 3.2.4 Edible parts in T. indica, V. doniana and S. birrea fruits -------------------------------------------------------------------- 34 3.2.5 Local processing of T. indica, V. doniana and S. birrea fruits ------------------------------------------------------------- 34 3.2.6 Changes in availability of T. indica, V. doniana and S. birrea fruits ------------------------------------------------------ 35 3.2.7 Marketing destination for T. indica, V. doniana and S. birrea fruits ------------------------------------------------------ 36 3.2.8 Preferred fruits in the market and their prices --------------------------------------------------------------------------------- 37 3.2.9 Fruiting frequency for T. indica, V. doniana and S. birrea ------------------------------------------------------------------ 38
v
3.2.10 Approximate quantity of T. indica, V. doniana and S. birrea fruits sold ------------------------------------------------- 38 3.2.11 Price range (US$/kg) for different fruits ----------------------------------------------------------------------------------------- 38 3.3 Threats to priority indigenous fruit trees in Uganda ---------------------------------------------------------------------- 39 3.3.1 Socio-economic characteristics of respondents -------------------------------------------------------------------------------- 39 3.3.2 Evolution of general fruit trade in the study area ------------------------------------------------------------------------------- 40 3.3.3 Evolution of T. indica, V. doniana and S. birrea fruit trade ------------------------------------------------------------------- 40 3.3.4 Source and distance covered for priority fruits when first sold -------------------------------------------------------------- 41 3.3.5 Price range when the priority fruits where first sold ---------------------------------------------------------------------------- 41 3.3.6 Changes overtime of the source/distance travelled to collect priority IFTs ---------------------------------------------- 42 3.3.6 Changes overtime of the quantity and quality of the products -------------------------------------------------------------- 42 3.4 Biological characterisation of priority indigenous fruit trees in Uganda ------------------------------------------ 44 3.4.1 Description of ecosystems hosting target species ----------------------------------------------------------------------------- 43 3.4.3 Species associations in the study sites ------------------------------------------------------------------------------------------- 43 3.4.4 Richness and species diversity indices of the degraded and less degraded sites ------------------------------------ 44 3.4.5 Distribution of the target tree species in the study sites ---------------------------------------------------------------------- 46 3.4.6 Target species abundance ----------------------------------------------------------------------------------------------------------- 46 3.4.7 Target species density in degraded and less degraded habitat ------------------------------------------------------------ 47 3.4.8 Diameter class distribution for target species ----------------------------------------------------------------------------------- 47 4.0 DISCUSSION ---------------------------------------------------------------------------------------------------------------------------- 48 4.1 Introduction ------------------------------------------------------------------------------------------------------------------------------- 48 4.2 Selection of priority species ---------------------------------------------------------------------------------------------------------- 48 4.2.1 Use of IFTs as a coppying strategy during hunger periods ------------------------------------------------------------------ 49 4.2.2 Growing, retention and conservation of IFTs on-farms ----------------------------------------------------------------------- 50 4.2.3 Constraints in utilisation of IFTs ----------------------------------------------------------------------------------------------------- 50 4.2.4 Required improvements on IFTs ---------------------------------------------------------------------------------------------------- 51 4.3 Marketing of priority IFTs in Uganda ----------------------------------------------------------------------------------------------- 51 4.4 Threats to priority IFTs in Uganda --------------------------------------------------------------------------------------------------- 53 4.5 Species biological characterisation ------------------------------------------------------------------------------------------------- 53 5.0 CONCLUSIONS ------------------------------------------------------------------------------------------------------------------------- 54 6.0 RECOMMENDATIONS ---------------------------------------------------------------------------------------------------------------- 55
References --------------------------------------------------------------------------------------------------------------------------- 56
vi
List of Tables Table 1: GPS locations of study villages and number of paticiparting farmers in each group -------------------------------- 5 Table 2: Socio-economic characteristics of the respondents --------------------------------------------------------------------------- 8 Table 3: Househod size and headship ------------------------------------------------------------------------------------------------------- 9
Table 4: Focus group ranking of priority IFTs in Teso and Lango ------------------------------------------------------------------- 10 Table 5: Respondents familiarity with different IFTs in Teso and Lango (n=130) ----------------------------------------------- 10 Table 6: Food crops grown and animals kept in Teso and Lango sub-regions (n=130) --------------------------------------- 12 Table 7: Food availability and role of IFTs (n=130) ------------------------------------------------------------------------------------- 13 Table 8: IFTs used during hunger months (n=130) ------------------------------------------------------------------------------------ 13 Table 9: Usage of IFTs during hunger months ------------------------------------------------------------------------------------------- 14 Table 10: Coping strategies during hunger months (n=130) -------------------------------------------------------------------------- 14 Table 11: On-farm retention of IFTs (n=130) --------------------------------------------------------------------------------------------- 15 Table 12 : Reasons for retaining the five top priority IFTs on farms (n=130) ----------------------------------------------------- 15 Table 13: Options to address extinction of IFTs (n=130) ------------------------------------------------------------------------------ 16 Table 14: Planting of IFTs (n=130) --------------------------------------------------------------------------------------------------------- 17 Table 15: IFTs planting sites, planting materials and source of planting materials (n=130) ---------------------------------- 19 Table 16: Problems and possible solutions to growing of IFTs (n=130) ---------------------------------------------------------- 19 Table 17: Constraints to use of IFTs (n=130) -------------------------------------------------------------------------------------------- 20 Table 18: Possible solutions to constraints in IFTs utilization ----------------------------------------------------------------------- 20 Table 19: Required improvements on V. paradoxa fruit and tree ------------------------------------------------------------------- 21 Table 20: Major pests and diseases for V. paradoxa ----------------------------------------------------------------------------------- 22 Table 21: Constraints and possible solutions to Utilisation of V. paradoxa ------------------------------------------------------ 23
Table 22: Required improvements on T. indica fruit and tree ----------------------------------------------------------------------- 24 Table 23: Major pests and disease for T. indica ----------------------------------------------------------------------------------------- 25 Table 24: Constraints associated with Utilisation of T. indica ----------------------------------------------------------------------- 26
Table 25: Required improvements on V. doniana and pests and diseases ------------------------------------------------------ 27 Table 26: Constraints and possible solutions to Utilisation of Vitex doniana ---------------------------------------------------- 27 Table 27: Borassus aethiopium - required improvements, pests and diseases ------------------------------------------------- 28 Table 28: Constraints associated with Utilisation of B. aethiopium ---------------------------------------------------------------- 29 Table 29: Carisa edulis - required improvements, pests and diseases ----------------------------------------------------------- 30 Table 30: Constraints and possible solutions for Utilisation of Carissa edulis --------------------------------------------------- 31
Table 31: Number of markets and respondents sampled in the respective respective study districts --------------------- 32 Table 32: Socio-economic characteristics of the respondents (n=38) -------------------------------------------------------------- 33 Table 33: IFTs marketed (n=38)------------------------------------------------------------------------------------------------------------- 33 Table 35: Edible parts in T. indica, V. doniana and S. birrea fruits ------------------------------------------------------------------ 34 Table 36: Purpose of local processing of T. indica, V. doniana and S. birrea ---------------------------------------------------- 34 Table 37: Steps for local processing of T. indica, V. doniana and S. birrea ------------------------------------------------------ 35 Table 38: Processed products for T. indica, V. doniana and S. birrea ------------------------------------------------------------- 35 Table 39: Fruit shape and tastes found in market and preferred by buyers ------------------------------------------------------ 37 Table 40: Difference in price with respect to fruit shapes (between the lowest and highest) in US$ per unit ------------ 37 Table 41: Fruiting frequency for T. indica, V. doniana and S. birrea ---------------------------------------------------------------- 38 Table 42: Approximate quantity of T. indica, V. doniana and S. birrea fruits sold ----------------------------------------------- 38 Table 43: Price range (US$/kg) for fruits --------------------------------------------------------------------------------------------------- 38 Table 44: Soci-economic characteristics of the respondents ------------------------------------------------------------------------- 39 Table 45: Evolution of general fruit trade in the study area --------------------------------------------------------------------------- 40 Table 46: Location/source of fruits when first sold -------------------------------------------------------------------------------------- 40 Table 47: Evolution over time of collection of priority IFTs ---------------------------------------------------------------------------- 40 Table 48: Source and distance covered for priority fruits when first sold ---------------------------------------------------------- 41 Table 49: Price range when the priority fruits where first sold ------------------------------------------------------------------------ 41 Table 50: Evolution overtime of the source/distance travelled to collect priority IFTs ------------------------------------------ 42

vii
Table 51: Evolution over time of the quantity and quality of the products --------------------------------------------------------- 42 Table 52: Species occuring together with the target species in the study sites -------------------------------------------------- 43 Table 53: Tree Species richness, diversity and evenness in degraded sites ----------------------------------------------------- 45 Table 54: Tree Species richness, diversity and evenness in the less degraded sites ----------------------------------------- 46 Table 55: Distribution of target species in degraded and less degraded habitats ----------------------------------------------- 46 Table 56: Target species abundance ------------------------------------------------------------------------------------------------------- 47 Table 57: Target species density in degraded and less degraded habitat -------------------------------------------------------- 47
List of Figures
Fig1. Map of the study area in relation to map of Uganda ------------------------------------------------------------------------------ 3 Fig. 2: Locations of focus group discussion sites in the study sub-regions --------------------------------------------------------- 6 Fig. 3: IFTs planted on-farm ------------------------------------------------------------------------------------------------------------------- 17
Fig. 4: Exotic fruits grown on-farm ----------------------------------------------------------------------------------------------------------- 17
Fig. 5: General reasons for planting IFTs -------------------------------------------------------------------------------------------------- 18 Fig. 6: Reasons for growing various IFTs ------------------------------------------------------------------------------------------------- 18 Fig. 7: Map of the study sub-regions in Uganda showing the locations of the IFTs markets sampled --------------------- 32 Fig. 8: Changes in availability of T. indica, V. doniana and S. birrea fruits -------------------------------------------------------- 35 Fig. 9: Reasons for changes in source of T. indica, V. doniana and S. birrea --------------------------------------------------- 36 Figure 10: Magnitude of price change for T. indica, V. doniana& S. birrea with respect to change in source ----------- 36 Figure 11: Town towards which T. indica, V. doniana and S. birrea fruits are transported ----------------------------------- 37 Fig 12: Diameter class distribution in degraded habitants ----------------------------------------------------------------------------- 47 Fig 13: Diameter class distribution in less degraded habitats ------------------------------------------------------------------------ 48

viii
SUMMARY The project "Use and Conservation of Indigenous Tree Diversity for Improved Livelihoods in Eastern
Africa" was aimed at improving livelihoods and increase incomes of rural farmers through growing,
processing and marketing products from indigenous fruit trees. It was implemented by four partners
(three National Agricultural Research Institutes in East Africa and Bioversity International). In Uganda,
project activities focused in the north eastern and mid northern drylands of Teso and Lango sub-regions
respectively. Most of the areas in these two sub-regions lie in the dryland belt and are popular for
production and consumption of IFTs. Initial activities involved a prioritization exercise to select project
species for each country and later for the three participating countries (Kenya, Tanzania and Uganda).
The prioritization exercise in Uganda involved ten groups with a total of 277 farmers. This was followed
by a field a survey where 130 respondents interviewed in both sub- regions with 75% and 25% from
Teso and Lango respectively. Interviews were used to collect information on use, conservaton, threats
and marketing of priority IFTs. For the ecological study, 12 sites/plots (60 X 60 m) were located in the
two sub-regions with 5 and 7 in Lango and Teso respectively. It was noted that rural communities have
strong social and economic attachment to IFTs. They ranked Vitellaria paradoxa, Tamarindus indica,
Vitex doniana, Borassus aethiopum and Carissa edulis as the five priority indigenous fruit trees for
Uganda. A majority use IFTs as alternative or complementary food source. Fruits commonly used
during months of food shortage include; V. paradoxa, T. indica, C. edullis and V. doniana . Indigenous
fruits are mainly used as food as fresh fruits, oil, juice, local brew and spices. Among the five priority
IFTs, it is only V. paradoxa and T. indica products whose trade was reported to have begun in the
1980‟s and a kilogram of T. indica fruits fetched USD 0.66. However, the distance covered during fruit
collection and prices have continuously been increasing indicating decreasing abundance of IFTs.
Despite of this, tree species diversity and evenness was generally high. Degraded sites were dominated
by Acacia hockii, Vitex doniana while less degraded sites had Phoenix reclinata and Vitex doniana as
the most abundant species. In order to promote conservation of IFTs, bye-laws and policies on
conservation need to be enforced by local governments. There is need for increased sensitization and
mobilization of local communities aimed at promoting IFTs retention and management of farms,
deleberate growing and protection of wild old trees including the wild natural regenaration. Value
addition, proper marketing of products, improvement in processing technology and easy access to
market information are required for IFT commercialization in Uganda.

1
1.0 INTRODUCTION
The wide range of Indigenous Fruit Trees (IFTs) available in many areas across the drylands of Africa can enable farmers to meet their varied household needs for food, nutrition, medicines and general livelihood balancing. According to (NRI, 2004) tree crops play a dominant long-term role in sustaining livelihoods of many millions of smallholder producers in Sub-Saharan Africa (SSA) as well as influencing the incomes received by intermediaries, processors and governments. IFTs can provide an additional source of income for smallholder farmers, as well as providing a primary source of income to commercial farmers and traders. Their management in the wild or cultivation on farm is generally environmentally beneficial (NRI, 2004), however, many of the IFTs have not been promoted or received limited research and therefore remain underutilized. The mere fact that IFTs provide regular and fairly low-risk returns, brings in a particular attraction into understanding their use and conservation aspects and their relevance to household livelihood improvement. For the past decade, there has been a growing awareness of the importance of IFTs especially in SSA. This growing awareness is not only for the role they play in the subsistence economy, but also for their potential and real contribution to the economies of many developing countries. Frequent famine and droughts are increasing the incidences of hunger and poverty for over 70 million people who live in these vulnerable lands in eastern and central Africa (Jama et al., 2005). Food security and poverty alleviation among the rural communities in these areas can be improved by diversifying the existing farming systems through sustainable management and utilisation of indigenous fruit trees. Given the important role that these indigenous fruit trees play, concerted effort is needed to promote utilization and commercialisation of these fruits for improved livelihoods in the region (Chikamai et al 2004). In Uganda the highest consumption of indigenous wild fruits is prevalent in the semi-arid areas mainly found in the north and eastern parts of the country. It forms a reliable source of food while the herding communities are in the wild looking after animals for long hours and far away from home during most of the day. Despite their importance, limited research has been undertaken on IFTs as regards to their on- farm domestication and/or cultivation, market potential and even to determine their contribution to household food security and nutrition. Work carried out on the IFTs in Uganda (FORRI, 2004) looked at the major species according to use value and reliability in the Lango and Teso farming systems. The five priority species were identified to be Vitellaria paradoxa, Tamarindus indica, Carissa edulis, Vitex doniana and Ximenia americana respectively. The criteria used mostly looked at fruit taste (sourness or sweetness), colour attractiveness, fleshiness and marketability. Farmers also desired fruit trees that are resistant to pests and diseases, have a short gestation period and bear many fruits regularly. The study did not capture information on processing, marketing, propagation and the level of availability or conservation status of the species. Agea et al (2007) reported that diversity of IFTs was high (H’=2.164) in the traditional millet-cotton farming system in Lango although the average proportion of farmland under IFTs cover is low (22%). They also reported V. paradoxa, V. doniana, A. senegalensis and T. indica were the most preferred IFTs by the local people. A study by Musinguzi et al (2003) in south-western Uganda focusing on the utilisation of indigenous food plants revealed that wild plums (Carissa edulis) and goose berries (Physalis minima) are among the most commonly consumed fruits. There has also been some ongoing work on germplasm conservation for Carissa edulis by the Plant Genetic Resources (PGR) Programme

2
of the National Agricultural Research Organization (NARO) based at Entebbe Botanical Gardens. This is aimed at collecting the various varieties of C. edulis for gene bank conservation and ex-situ conservation, hence curbing the looming levels of genetic erosion (Mulumba et al., 2005). A study by Okullo (2005) on the utilisation and domestication potential of IFTs in the drylands of northern Uganda focused on assessing utilisation and potential of domesticating IFTs. The study recorded more than fifteen species on farms and rangelands. Higher in the order of diversity were Vitellaria paradoxa, Anona chrysophyla, Vitex doniana, Tamarindus indica, Carissa edulis, Borassus aethiopum, Ximenia americana, Sclerocarya birrea and Strychnos spinosa. The use preference of these species by the local people (from highest to lowest) was ranked as; V. paradoxa, V. doniana , A. chrysophylla, T. indica, V. apiculata, X. americana, C. edulis, B. aethiopum and S. spinosa. It was however noted that, V. paradoxa fetched twice more money than T. indica in the local markets. The study also showed that the species faced conservation threats due to charcoal burning. Studies on the conservation aspects of V. paradoxa in northern Uganda haved focused on indigenous knowledge (Okullo et al., 2004) its population (Okia et al, 2005) and reproductive biology and breeding (Okullo, 2004). The populations of V. paradoxa in Uganda are for instance reported to be characterised by a predominance of old trees and an alarming lack of regeneration which could be attributed to increased demand for cultivation land, drought, shortened fallows, continuous annual (wild and intended) bush fires, and destruction of the young trees during land preparation for farming after the fallow periods. In order to consolidate and broaden information on IFTs in Uganda and Eastern Africa, the National Forestry Resources Research Institute (NaFORRI) in collaboration with partner institutions in the region implemented a project entitled “use and conservation of indigenous fruit tree diversity for improved livelihoods in eastern Africa”. The aim of the project was to improve the livelihoods and increase incomes of rural farmers in Eastern Africa through growing, processing and marketing of indigenous fruit trees. Its three specific objectives were to; (i) carry out participatory priority setting to identify priority IFTs with market potential; (ii) gather baseline information (regarding distribution, abundance and diversity) on each of the identified IFTs; and (iii) identify potential sites for implementation of work on promoting priority IFTs in Eastern Africa (to be undertaken in phase II of the project). The project was supported by African Forest Research Network (AFORNET) and implemented by four partners (three NARS in East Africa with technical backstopping from Bioversity International). The three NARS were Kenya Forestry Research Institute (KEFRI), Tanzania Forestry Research Institute (TAFORI) and National Forestry Resources Research Institute (NaFORRI) in Uganda. This report presents the project activities in Uganda implemented over a two year project period.
2.0 STUDY AREA AND METHODS
2.1 Description of study area
The project was implemented in the Teso and Lango sub-regions of Uganda (Fig.1). Most of the areas in the two sub-regions lie in the dryland belt and are popular for production and consumption of Indigenous Fruit Trees (IFTs). Teso sub-region lies between 0055‟ – 2025‟N and 22055‟ - 34030‟E and covers the current administrative districts of Soroti, Katakwi, Amuria, Kaberamaido, Kumi and parts of Pallisa. It covers an area of 14,879.6km2 and has a population of about 1.2 million people (Fountain Publishers, 2005). Over 90% of the population is rural and depends almost entirely on agriculture. The farming system is agro-pastoral based on production of annual crops and livestock in a mixed

3
arragement at subsistence level. The sub-region receives bimodal rainfall with peaks in April to May and August to September, and with adry season from December to February. The rainfall received ranges from 850 – 1,500 mm annually and mean annual temperature is 23.80C. Altitude ranges between 1,036 – 1,219 m above sea level (Fountain Publishers, 2005). The vegetation is predominantly savanna and consists mainly of Butyrospermum (Vitellaria) savanna, dry Combretum savanna, moist Combretum savanna, bushlands, woodlands and swamps (NEMA, 1997). Much of the vegetation, however, has been highly degraded through poor agricultural practices, deforestation due to high demand for tree products, increased demand for agricultural land and increasing population. The Lango sub-region lies between 1030‟ - 20 35‟N and 32005‟ – 33035‟E covering an area of 13,741.9 km2 and has a population of approximately 1.3 million people (Fountain Publishers, 2005). It covers the districts of Lira, Apach, Dokolo and Amolatar. It is characterised by cultivation of annual crops like millet, groundnuts, simsim and maize. It is also well known for rearing of diverse livestock like cattle, goats, sheep and poultry. The rainfall in this sub-region is bimodal with peaks occuring during April - May and August – October. Annual rainfall ranges from 1,000 – 1,500 mm. A short dry spell is experienced from June – July and a longer dry period is from December to March. The average minimum and maximum temperatures are 22.50C and 25.50C, respectively. Altitude ranges from 700 – 1,140 m above sea level. Lango sub-region is mainly covered with woodland savanna. The predominant vegetation is Vitellaria savanna charaterised by Hyparrhenia spp. Large parts of the original tree-savanna have been taken over by farming and grazing (NEMA, 1997).
Usuk
Erute
Otuke
Kioga
Soroti
Moroto
Amuria
Dokolo
Serere
Kasilo
Kapelebyong
Kalaki
Kaberamaido
Lira Municipality
Soroti Municipali ty
0.0004 0 0.0004 0.0008 Miles
N
Country bnd
Water bodies
Study area
Figure 1. Map of the study area in relation to map of Uganda

4
2.2 Methods
2.2.1 Species prioritization studies
Initial activities under this project involved carrying out a prioritization exercise to select project species for each country and later for the three participating countries (Kenya, Tanzania and Uganda). In Uganda, project activities focused in the north eastern and mid northern drylands of Teso and Lango sub-regions respectively. The first exercise involved identification of stakeholders (farmers, traders and other active groups) that were involved in the collection, use and/or promotion of indigenous fruits in the target areas in Uganda. This was based on information gathered during the literature review and synthesis exercise complemented with further consultation. A meeting involving twenty stakeholders, mainly from research, civil society, academia, extension and farmers was organised at NaFORRI. A participatory priority setting exercise was carried out in this meeting to identify indigenous fruit trees with potential for domestication and commercialisation to improve income and livelihoods of rural communities, especially in the drylands of Uganda. The discussion during the meeting was mainly based on a list of ten IFTs generated by earlier studies (FORRI, 2004 and Okullo, 2005). The first field survey was then conducted in the Teso and Lango sub-regions between March - April 2007 to screen the IFTs in each region using farmers‟ criteria to obtain five priority species. The prioritization of the five species per sub-region was purposely done to allow for flexibility in selecting the overall priority three species across the two sub-regions which would then be representative of the country‟s priority list. In Teso sub-region, the survey covered two districts of Soroti and Katakwi each with two villages, while in Lango sub-region two districts; Dokolo and Lira were covered each with three villages. A total of 10 focus groups (10 villages) with 227 participants were involved in the study in Teso and Lango sub-regions (Table 1). Selection of both study villages and farmer groups was done in consultation with the respective district and sub-county technical staff, mainly forestry officials and the National Agricultural Advisory Services (NAADS) Coordinators. In each district, the research team in consultation with the district technical staff recruited six field assistants who were then briefed about the IFTs research work and trained on how to administer the individual questionnaire. The identified community groups were briefed on the purpose of field survey and requested to participate in the study. The groups comprised 15-30 persons with both men and women of different age categories. The location of meeting sites were recorded using a Geographical Positioning System (GPS - 12 x L Garnin). A total of 100 individual respondents (25 per site) were accessed in their homes and interviewed in the Teso sub-region while in the Lango, a total of 36 respondents were randomly picked from within the six groups. Group discussions in Teso involved general ranking of the ten common IFTs. The five top IFTs were then subjected to weigted scoring of 10 (highest) - one (lowest) as developed during the project inception workshop (Muok and Kweka, 2006). The attributes scored were; food value, economic value, availability and other uses or attributes. The top three IFTs were considered for detailed discussion in the areas of processing, storage, marketing, conservation status and pest and diseases.

5
In Lango, group discussions involved generating a list of the common IFTs in the village. In most cases an initial list of 10 -15 IFTs were generated which the group then reduced to 10 species by ranking as in Teso sub-region. After this exercise, the big group was sub-divided into smaller groups of 3 - 6 people based on gender and age. Much as there was variation from village to village, the following groupings were common; youth (below 25 years), adults (25-45 years) and elderly (above 45 years). These three age grouppings were further sub-divided by gender giving a total of six sub-groups per village. In one case, however, only four sub-groups were formed due to a low turn up. Each of the trained field assistants was then allocated a sub-group to work with. Each sub-group started by selecting its priority five IFTs based on food value, economic value, availability and other uses or attributes. The Field assistants then guided the sub-groups to fill detailed information on each of the priority five IFTs and this information was filled in a table. Finally, each of the six field assistants randomly selected one farmer from each sub-group to complete the individual questionnaire. The exercise generated at least six questionnaires per village (Sample questionnaire, Appendix I). The villages in the four study districts with the number of farmers who participated in the focus group discussions (FGD Guide, Appendix II) and the respective GPS locations are shown in Table 1. Table 1: GPS locations of study villages and number of paticiparting farmers in each group
District Sub-conty Village Northings Eastings No. of farmers
Dokolo Dokolo Atama 01054 679'N 033009 036'E 30
Dokolo Bata Onekocaani 01054 677'N 033009 035'E 25
Dokolo Agwata Agengi 01054 891'N 033009 035'E 30
Lira Adekogwok Awangdyang 02001 891'N 033057 673'E 15
Lira Amac Odipabung 02001 891'N 032057 673'E 30
Lira Abako Abako corner 02008 707'N 033013 453'E 20
Katakwi Magoro Ajamaka 01043 835'N 034006 240'E 15
Katakwi Usuk Amoru 02003 139'N 033059 860'E 31
Soroti Katine Ogwoolo 01051 158'N 033033 246'E 16
Soroti Gweri Abia 01044 303'N 033041 039'E 15
Total 277
6
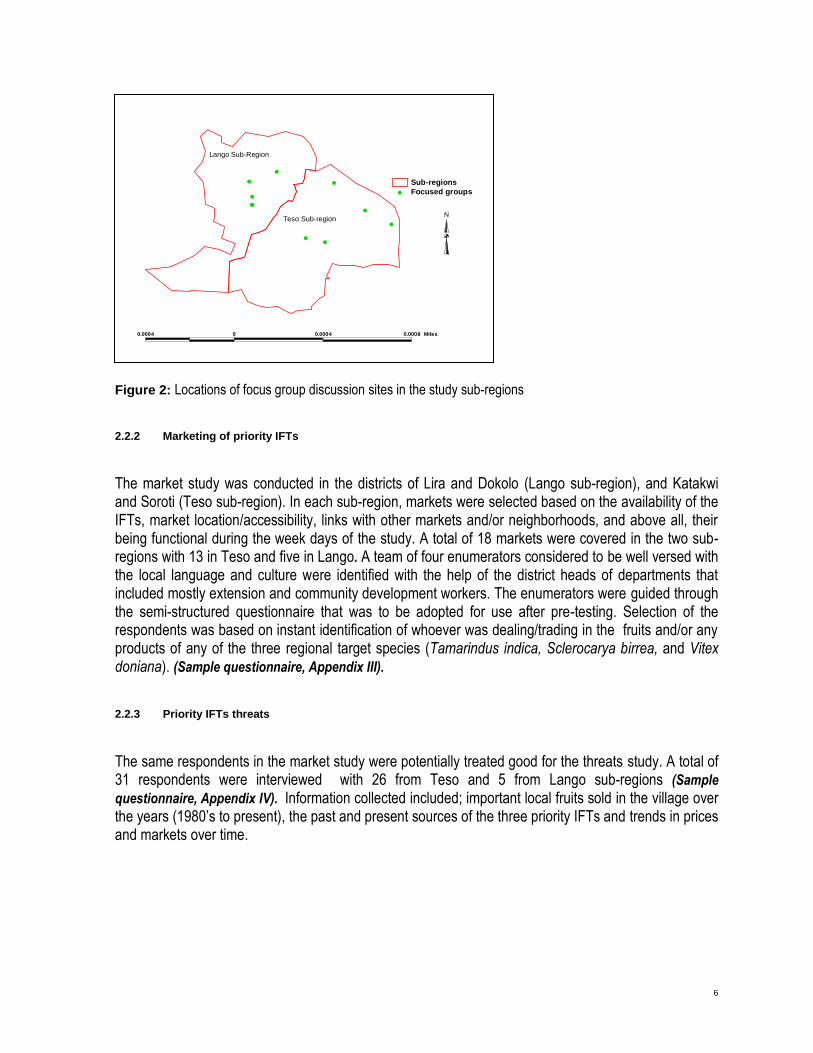
Figure 2: Locations of focus group discussion sites in the study sub-regions
2.2.2 Marketing of priority IFTs
The market study was conducted in the districts of Lira and Dokolo (Lango sub-region), and Katakwi and Soroti (Teso sub-region). In each sub-region, markets were selected based on the availability of the IFTs, market location/accessibility, links with other markets and/or neighborhoods, and above all, their being functional during the week days of the study. A total of 18 markets were covered in the two sub-regions with 13 in Teso and five in Lango. A team of four enumerators considered to be well versed with the local language and culture were identified with the help of the district heads of departments that included mostly extension and community development workers. The enumerators were guided through the semi-structured questionnaire that was to be adopted for use after pre-testing. Selection of the respondents was based on instant identification of whoever was dealing/trading in the fruits and/or any products of any of the three regional target species (Tamarindus indica, Sclerocarya birrea, and Vitex doniana). (Sample questionnaire, Appendix III).
2.2.3 Priority IFTs threats
The same respondents in the market study were potentially treated good for the threats study. A total of 31 respondents were interviewed with 26 from Teso and 5 from Lango sub-regions (Sample
questionnaire, Appendix IV). Information collected included; important local fruits sold in the village over the years (1980‟s to present), the past and present sources of the three priority IFTs and trends in prices and markets over time.
##
#
##
#
#
#
##
Lango Sub-Region
Teso Sub-region
0.0004 0 0.0004 0.0008 Miles
N
# Focused groups
Sub-regions

7
2.2.4 Priority IFTs biological characterization
The ecological study involved site and species characterization and it combined collection of information on species biophysical distribution, plant or vegetation association and classification. The study was conducted in the districts of Lira and Dokolo in Lango and Katakwi and Soroti in Teso. First, the species sites were identified and then plots of 60 X 60 m were located, followed by specific site characterisation. This was done to minimize on time wasted on randomly placing plots in species-free sites. Information collected in the plots included GPs locations taken at the centre, target species >10 cm dbh positions, target species regeneration tallies (< 10 cm dbh) and associated plant/tree species. Non-target species >10cm dbh were recorded as vegetative association in the plot. Percentage vegetation cover for the farmed area, bush/grass fallow, woodland, thicket and impeded or degraded areas of the plot were also recorded. A total of 12 sites/plots were located in the two sub-regions with 5 and 7 in Lango and Teso respectively (Sample field data sheet, Appendix V).
2.2.5 Data analysis
Species selection, market and threats data were coded and first entered into MS Excel computer spread sheet. Most of the figures and some tables were generated using Excel. Data were later transferred into SPSS software after cleaning for further analysis. Descriptive statistics using frequencies, cross tabulation and multiple responses were mainly used. Ecological data were entered and analyzed in Excel computer spread sheet. Analysis involved generation of tables, graphs and calculation of various indices. The species diversity index was computed using Shannon's equation; H’ = −(∑(ρilnρi), where ρi is the proportion of individuals or the abundance of the ith species expressed as a proportion of total number of individuals. The product of ρilnρi for each species in the sites was summed and multiplied by −1 to give H’. The relative abundance with which each species is represented in an area was calculated using Shannon's species evenness index (J’), expressed as J’ = H’/lnS, where S is the total number of species. Species dominance was obtained using the Berger-Parker Dominance Index (d); expressed as d = Nmax/N. Where Nmax is the number of individuals of the most abundant species and N is the total number of all the different species inventoried.
3.0 RESULTS
3.1 Species prioritization
3.1.1 Socio-economic characteristics of the respondents
A total of 130 respondents were interviewed in both regions with 75% and 25% from Teso and Lango respectively. Of these about 57% were male while 43% were female (Table 2). Many of the respondents were in the age bracket of 20 -35 (47%) followed by those in age bracket 35 – 55 (31%). Age brackets of >55 and <20 were less repsented with 18 % and 2% respectively. A mojority of the respondents (73%) had settled in the area for 1 – 30 years. Only about 14% had settled in the area for more than 30 years. A majority of the respondents belonged to the Iteso ethinic group (73%) and this was followed by the Langi (25%). The Kuman and Acholi were few represented by about 1% and 2% respectively. The dominant religious sect among respondents was Catholic (65%) followered by Pentecostal (15%) and Anglican (13%). The remaining percentage was constituted by other sects such as Muslim, Prespeterian, SDA and African respectively. Most of the respondents (61%) had only attained primary level of education while only 21% had attained secondary with 2% tertiary. About 17% had not attained any formal education (Table 2).

8
Table 2 Socio-economic characteristics of the respondents
Variable Percentage of respondents Teso (n=97 ) Lango (n=33 ) Total (n =130)
Sex of respondent Male 59.8 40.2 56.9 Female 48.5 51.5 43.1
Age (%) < 20 1.0 6.1 2.3 20 – 35 51.5 33.3 46.9 36 – 55 32.0 27.3 30.8 > 55 14.4 27.3 17.7 No response 1.0 6.1 2.3
Years settled in village 1 – 10 25.8 30.3 26.9 11 – 20 21.6 12.1 19.2 21 – 30 30.9 15.2 26.9 31 – 40 9.3 15.2 10.8 41 – 50 5.2 9.1 6.2 > 50 5.2 15.2 7.7 No response 2.1 3.0 2.3
Marital status Never married 8.2 0 6.2 Married 85.6 78.8 83.8 Divorced 1.0 0.0 0.8 Separated 1.0 6.1 2.3 Widowed 4.1 15.2 6.9
Ethnicity Iteso 96.9 3.0 73.1 Acholi 2.1 0.0 1.5 Langi 0.0 97.0 24.6 Kumam 1.0 0.0 0.8
Religion Catholic 70.1 51.5 65.4 Muslim 3.1 3.0 3.1 SDA 0.0 3.0 0.8 Anglican 8.2 27.3 13.1 African 1.0 0.0 0.8 Pentecostal 14.4 15.2 14.6 Prespeterian 3.1 0 2.3
Highest education level None 19.6 9.1 16.9 Primary 68.0 39.4 60.8 Secondary 12.4 45.5 20.8 Tertiary 0.0 6.1 1.5
Major occupation Farmer 97.9 78.8 93.1 Employed 1.0 6.1 2.3 Petty business 0.0 9.1 2.3 Pastoralist 1.0 6.1 2.3

9
3.1.2 Household size and headship
A bout half (51%) of the households had 6 – 10 persons while about 29% had 1 -5 persons. Only 2% of the households had 16 – 20 persons. The average household size for the two sub-regions was about 8 persons. Lango appeared to have slightly higher average household size compared to Teso. A mojority (85%) of households were male headed with the remaining percentage being female headed (Table 3). Table 3Table 3: Househod size and headship
3.1.3 Priority species selection The results for the species prioritization exercise using focus group ranking showed that the five priority species for Teso and Lango sub-regions of Uganda are; Vitellaria paradoxa, Tamarindus indica, Vitex doniana, Borassus aethiopum and Carissa edulis (Table 4). The five priority species were the same for the two sub-regions though there was interchange of their respective score positions. T. indica, for instance was priority IFT number one in Teso but in Lango it became number two being overtaken by V. paradoxa. Similarly, B. aethiopum was ranked high in Lango (position 3) but in Teso it emerged in position five being overtaken by both C. edulis (position 3) and Vitex doniana (position 4). Out of the five selected priority IFTs for the two sub-regions (Table 4), the results of the household survey revealed that a large proportion of respondents (84%) were familiar with T. indica. This was followerd by V. paradoxa (69%), C. edulis (40%), V. doniana (20%) and B. aethiopum (17%) (Table 5). Again, except for the changes in relative positions, the results closely agree with that obtained using focus group ranking. The top five priority species for the two sub-regions remained the same.
Variable Teso Lango Total
Household size 1 – 5 30 7 28.9 6 – 10 46 19 50.8 11 – 15 17 6 18.0 16 – 20 3 0 2.3 Average 7.6 8.2 7.7 Household head
Male 86.6 78.8 84.6 Female 13.4 21.2 15.4

10
Table 4: Focus group ranking of priority IFTs in Teso and Lango
Species Teso TS1 (X/40)
Lango TS1 (X/60)
Teso and Lango APS2 (X/10)
Overall species priority Rank
Vitellaria paradoxa 37 60 9.7 1*
Tamarindus indica 39 46 8.5 2*
Vitex doniana 27 44 7.1 3*
Borassus aethiopum 25 45 7.0 4*
Carissa edulis 31 33 6.4 5*
Annona seneglensis 22 31 5.3 6
Ximenia americana 15 22 3.7 7
Strychnos spinosa 11 19 3.0 8
Vangueria apiculata 8 13 2.1 9
Balanites aegyptiaca 6 1 0.7 10
TS = Total Score for a pecies obtained using focus group ranking ( 4 groups in Teso and 6 groups in Lango). Each group scored the species on scale of 10 – 1 where ‘10’ indicates most preferred and ‘1’ least preferred. APS = Average Preference Score for the species obtained using focus groups ranking across the two sub-regions in Uganda (total of 10 groups). ‘10’ indicates a rank of 1st, ‘9’ a rank of 2nd, etc. * = indicates the priority IFTs selected for Uganda.
Table 5: Respondents familiarity with different IFTs in Teso and Lango (n=130)
Species Percentage*
Tamarindus indica 83.8 Vitellaria paradoxa 69.2 Carissa edulis 40.0 Vitex doniana 20.0 Borassus aethopum 16.9 Ximenia americana 11.5 Balanites aegyptiaca 10.8 Annona senegalensis 6.2 Grewia molis 2.3 Obu (Luo) 2.3 Dioscorea bulbifera 1.5 Bridelia micrantha 1.5 Oduru (Luo) 1.5 Sclerocarya birrea 0.8 Strychnos spinosa 0.8 Diospyros mespiliformis 0.8 Vangueria apiculata 0.8
*Multiple responces were possible because a given respondent was mentioning up to three IFTs they are familiar with.
11
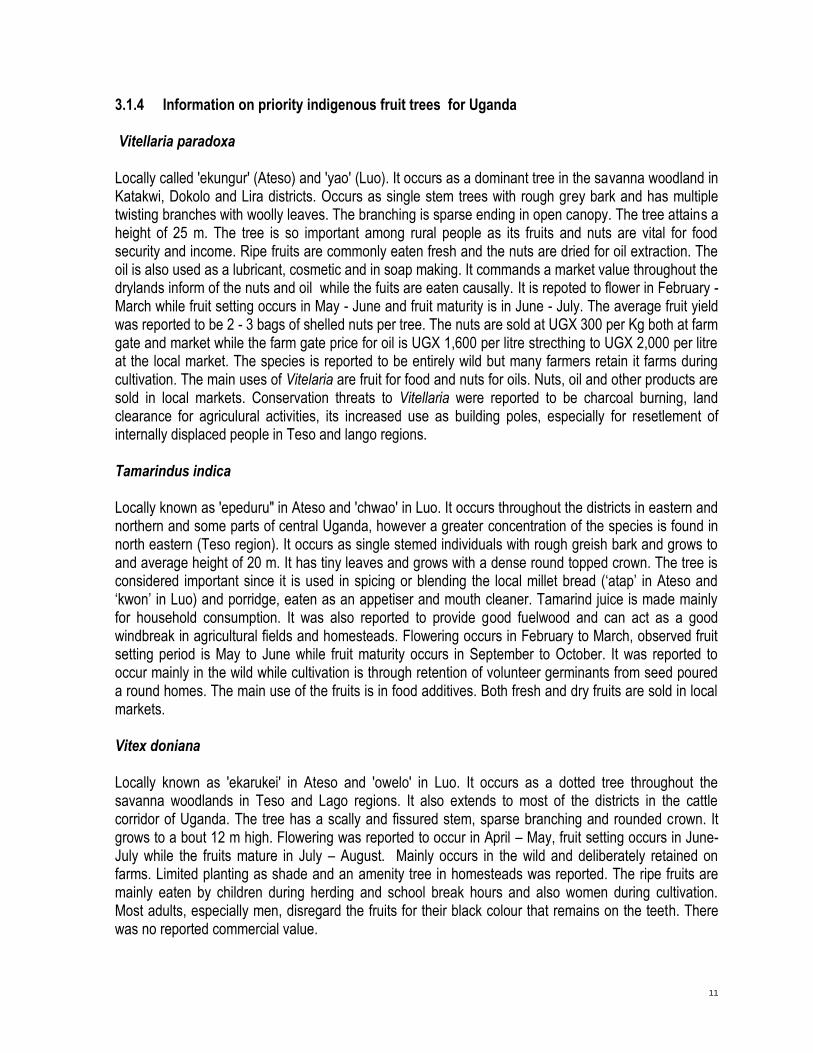
3.1.4 Information on priority indigenous fruit trees for Uganda Vitellaria paradoxa Locally called 'ekungur' (Ateso) and 'yao' (Luo). It occurs as a dominant tree in the savanna woodland in Katakwi, Dokolo and Lira districts. Occurs as single stem trees with rough grey bark and has multiple twisting branches with woolly leaves. The branching is sparse ending in open canopy. The tree attains a height of 25 m. The tree is so important among rural people as its fruits and nuts are vital for food security and income. Ripe fruits are commonly eaten fresh and the nuts are dried for oil extraction. The oil is also used as a lubricant, cosmetic and in soap making. It commands a market value throughout the drylands inform of the nuts and oil while the fuits are eaten causally. It is repoted to flower in February - March while fruit setting occurs in May - June and fruit maturity is in June - July. The average fruit yield was reported to be 2 - 3 bags of shelled nuts per tree. The nuts are sold at UGX 300 per Kg both at farm gate and market while the farm gate price for oil is UGX 1,600 per litre strecthing to UGX 2,000 per litre at the local market. The species is reported to be entirely wild but many farmers retain it farms during cultivation. The main uses of Vitelaria are fruit for food and nuts for oils. Nuts, oil and other products are sold in local markets. Conservation threats to Vitellaria were reported to be charcoal burning, land clearance for agriculural activities, its increased use as building poles, especially for resetlement of internally displaced people in Teso and lango regions. Tamarindus indica Locally known as 'epeduru" in Ateso and 'chwao' in Luo. It occurs throughout the districts in eastern and northern and some parts of central Uganda, however a greater concentration of the species is found in north eastern (Teso region). It occurs as single stemed individuals with rough greish bark and grows to and average height of 20 m. It has tiny leaves and grows with a dense round topped crown. The tree is considered important since it is used in spicing or blending the local millet bread („atap‟ in Ateso and „kwon‟ in Luo) and porridge, eaten as an appetiser and mouth cleaner. Tamarind juice is made mainly for household consumption. It was also reported to provide good fuelwood and can act as a good windbreak in agricultural fields and homesteads. Flowering occurs in February to March, observed fruit setting period is May to June while fruit maturity occurs in September to October. It was reported to occur mainly in the wild while cultivation is through retention of volunteer germinants from seed poured a round homes. The main use of the fruits is in food additives. Both fresh and dry fruits are sold in local markets. Vitex doniana Locally known as 'ekarukei' in Ateso and 'owelo' in Luo. It occurs as a dotted tree throughout the savanna woodlands in Teso and Lago regions. It also extends to most of the districts in the cattle corridor of Uganda. The tree has a scally and fissured stem, sparse branching and rounded crown. It grows to a bout 12 m high. Flowering was reported to occur in April – May, fruit setting occurs in June-July while the fruits mature in July – August. Mainly occurs in the wild and deliberately retained on farms. Limited planting as shade and an amenity tree in homesteads was reported. The ripe fruits are mainly eaten by children during herding and school break hours and also women during cultivation. Most adults, especially men, disregard the fruits for their black colour that remains on the teeth. There was no reported commercial value.

12
Borassus aethopum Refered to as „edukut‟ or „edukudukut‟ in Ateso and „tugu‟ in Luo. It was found to be more common in the Lango compared to Teso region. Other areas in Uganda where Borassus is found in aggregate distribution include; a round rivers Semiliki and Kafu, and parts of Kitgum and Pallisa districts. It has a straight tall tappering trunk growing to a height of about 20 m. The trunk is smooth and grey. Its phenology was obscure to farmers as they reported difficulty in seeing flowering and ripe fruits seem to be available during most months in a year. Borassus leaves are used for making mats, baskets, winnowers and hats. The ripe fruits are eaten fresh by both adults and children and its believed to clean the teeth. There is an attempt by a group in Soroti to make Borassus wine or sherry which is marketed in pubs a round Soroti town. However, there is a constraint on labour requirements due to the crude processing method which involves beating to soften, split open, dividing to allow water to soak inner parts and sqeezing the fruit juice which is then diluted and left to ferment for eight weeks. The Borassus sherry has a big market potential if appropriate local level processing methods are developed. 3.1.5 Household food security 3.1.5.1 Food crops and animals All the households interviewed grow agricultural crops while 85% rear livestock. The major crops grown are groundnuts, cassava, finger millet and sorghum respectively. The common livestock owned include; poultry, goats and cattle respecitively (Table 6).
Table 6: Food crops grown and animals kept in Teso and Lango sub-regions (n=130)
*Multiple responses were possible because each respondent was mentioning up to three major crops
Variable Count % of cases
Do you grow crops? Yes 130 100 No 0 0
Major food crops grown Groundnuts 90 69.2 Cassava 85 65.4 Finger millet 77 59.2 Sorghum 44 33.8 Sweet potatoes 30 23.1 Beans 28 21.5 Maize 21 16.2 Simsim (Sesame) 7 5.4 Sunflower 2 1.5
Do you keep livestock? Yes 110 84.6 No 20 15.4
Livestock kept Poultry 86 66.2 Goats 84 64.6 Cattle 78 60.0 Sheep 23 17.7 Pigs 17 13.1 Donkeys 1 0.8

13
3.1.5.2 Food availability and role of IFTs A majority (83%) of the respondents did not harvest enough food during the season preceeding the study. Of these, 72% had their food harvest lasting for a period of 4 -7 months. A bout 19% had their food stocks lasting for only 1 – 3 months. In this situation, a majority (75%) of the respondents reported having used IFTs as alternative or complementary food source (Table 7). Table 7: Food availability and role of IFTs (n=130)
Variable Percentage
Did you harvest enough food last season?
Yes 16.9
No 83.1
If no for how long did the food harvested last? (Period months)
1 - 3 18.5
4 - 7 71.5
> 8 10.0
Did IFTs play a role during hunger months?
Yes 75.4
No 16.2
The IFTs commonly used during months of food shortage include V. paradoxa (82%) T. indica (61%), C.edullis (31%) and V. doniana (30%). The other IFTs used to a lesser extent are B. aethiopum, B. aegyptiaca, A.seneglansis and Ximenia americana (Table 8). Table 8: IFTs used during hunger months (n=130)
Species % Cases*
Vitellaria paradoxa 81.6 Tamarindus indica 61.2 Carissa edulis 30.6 Vitex doniana 29.6 Borassus aethiopum 20.4 Balanites aegyptiaca 17.3 Annona senegalensis 8.2 Ximenia americana 7.1
*Multiple responses were possible because each respondent could mention more than one IFT IFTs are mainly used as food (fruit), oil extraction (kernnel), juice and local brew and spices. In some cases IFTs were also reported to be used for fuelwood and construction purposes (Table 9).
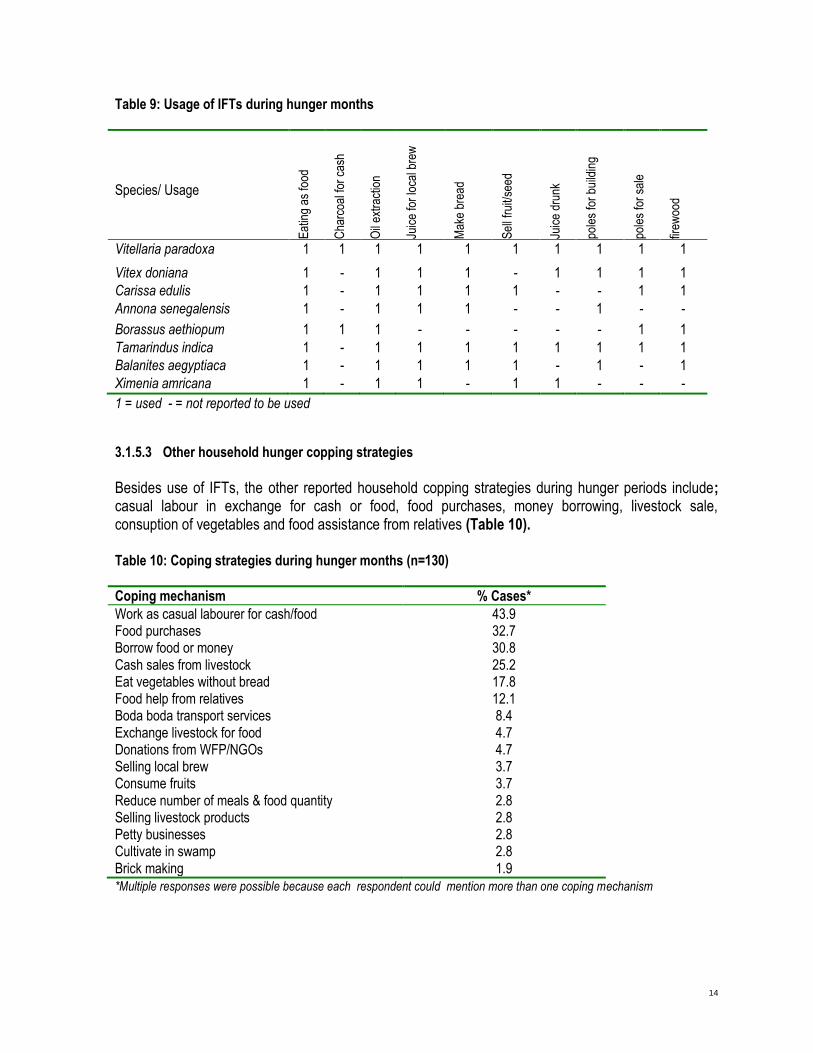
14
Table 9: Usage of IFTs during hunger months
Species/ Usage
Eat
ing
as fo
od
Cha
rcoa
l for
cas
h
Oil
extr
actio
n
Juic
e fo
r lo
cal b
rew
Mak
e br
ead
Sel
l fru
it/se
ed
Juic
e dr
unk
pole
s fo
r bu
ildin
g
pole
s fo
r sa
le
firew
ood
Vitellaria paradoxa 1 1 1 1 1 1 1 1 1 1
Vitex doniana 1 - 1 1 1 - 1 1 1 1
Carissa edulis 1 - 1 1 1 1 - - 1 1
Annona senegalensis 1 - 1 1 1 - - 1 - -
Borassus aethiopum 1 1 1 - - - - - 1 1
Tamarindus indica 1 - 1 1 1 1 1 1 1 1
Balanites aegyptiaca 1 - 1 1 1 1 - 1 - 1
Ximenia amricana 1 - 1 1 - 1 1 - - -
1 = used - = not reported to be used
3.1.5.3 Other household hunger copping strategies
Besides use of IFTs, the other reported household copping strategies during hunger periods include; casual labour in exchange for cash or food, food purchases, money borrowing, livestock sale, consuption of vegetables and food assistance from relatives (Table 10). Table 10: Coping strategies during hunger months (n=130)
Coping mechanism % Cases*
Work as casual labourer for cash/food 43.9 Food purchases 32.7 Borrow food or money 30.8 Cash sales from livestock 25.2 Eat vegetables without bread 17.8 Food help from relatives 12.1 Boda boda transport services 8.4 Exchange livestock for food 4.7 Donations from WFP/NGOs 4.7 Selling local brew 3.7 Consume fruits 3.7 Reduce number of meals & food quantity 2.8 Selling livestock products 2.8 Petty businesses 2.8 Cultivate in swamp 2.8 Brick making 1.9
*Multiple responses were possible because each respondent could mention more than one coping mechanism

15
3.1.5.4 On-farm retention and conservation of of IFTs on-farms Most respondents (78%) reported having retained IFTs on their farms with only a small proportion (22%) had not retained them. Ready availability of IFTs in the wild, lack of knowledge on benefits of the species and small land size were cited as reasons for not retaining IFTs on-farms (Table 11). Table 11: On-farm retention of IFTs (n=130)
There were varied reasons for retaining IFTs on-farms, ranging from their consumption value, sale of products and their being multipurpose. Table 12 presents reasons for retaining the five priority IFTs in Uganda. Table 12 : Reasons for retaining the five top priority IFTs on farms (n=130)
Species/Reasons for retaining % of cases
(i) Vitellaria paradoxa Eaten as casual meals and actual meals 74.7 For sale of their products 50.7 For oil extraction 26.7 Provides shade 12.0 Firewood for domestic use and cash income 8.0 Used in building 5.3 Provides timber 2.7 Acts as a windbreaker 1.3 Useful in soil conservation 1.3
(ii) Tamarindus indica Eaten as casual meals and actual meals 75.4 Acts as a windbreaker 9.2 For sale of products 7.7 Used in building 1.5 Firewood for domestic use and cash income 1.5 Juice from fruits used in spicing/souring 1.5 Rare species 1.5 Provides timber 1.5
(ii) Vitex doniana Eaten as casual meals and actual meals 68.4 Firewood for domestic use and cash income 10.5
Variable Percent
Have you retained any IFTs on farm
Yes 78.1
No 21.9
If IFTs are not retained why?
Easily available in the wild 8.5
Lack of knowledge/awareness on benefits 4.6
Small land size 3.1
Not of much value 2.3
Tree competition with crops 2.3

16
Provides shade 10.5 Acts as a windbreaker 5.3 Provides timber 5.3
(iv) Borassus aethiopum Eaten as casual meals and actual meals 73.3 Used in building 36.7 For sale of their products 16.7 Provides timber 13.3 Firewood for domestic use and cash income 10 Provides shade 6.7 Rare species 3.3 Useful in beekeeping 3.3
(v) Carissa edulis Eaten as casual meals and actual meals 100.0 For sale of their products 9.1
*Multiple responses were possible because each respondent could mention more than one reason IFTs were reported to be becoming scarce in the two study sub-regions. To address the looming extinction of most IFTs, respondents suggested a combination of restorative and preventive strategies. A majority (86%), suggested planting of more trees while 69% proposed need to institute by-laws on tree cutting (Table 13). Other suggestions included; training on tree management skills and provision of planting materials. Table 13: Options to address extinction of IFTs (n=130)
Options % of cases*
Plant more 86.0
Institute by-laws on tree cutting 68.7
Train on tree management skills 15.6
Provide planting materials 14.1
Population sensitization 9.4
Control pests and diseases 7.0
Stop charcoal burning 6.3
Introduction of fast growing species 5.5
Find good market to products 5.5
Provide alternatives for firewood 4.7
Fencing of land 3.1
Improve on the fruits 2.3
Initiate income generating activities 2.3 Control of bush fires 0.8
*Multiple responses were possible because each respondent could mention more than one option

17
3.1.5.5 Growing of IFTs and exotic fruits on-farms
Deliberate planting of IFTs is not common in the study area. Only 24% of the respondents had ever planted IFTs while a majority (68%) had never grown them on-farm. The main reasons for not planting IFTs were; they are considered to grow naturally, they can be readily found both in wild and farms, lack of planting materials, their slow growth rate and lack of knowledge and skills in their propagation (Table 14). Table 14: Planting of IFTs (n=130)
Variable Percent 9%)
Have you ever planted any indigenous fruit trees? Yes 23.8 No 67.7 No response 8.5
If IFTs not planted, why? Grow naturally 29.2 Readily found in wild and farms 8.5 Lack of planting materials 6.9 Slow germination, growth, maturity/fruiting 6.2 Lack of knowledge and skills for propagation 4.6 Small land size 4.6 Exotics are better 1.5 Lack of money to buy planting materials 1.5 Laziness 0.8 No response 36.2
Some of the IFTs reported to be commonly grown were; T. indica (19%) and V. paradoxa (13%). Borassus aethiopum, X. american and C. edulis were only planted by a few respondents. On the other hand, the commonly planted exotic fruits were Citrus spp (95%) and Mangifera indica (67%) (Fig. 3 and Fig. 4).
0
5
10
15
20
25
Tamarindus
indica
Vitellaria
paradox a
Borassus
aethiopium
Ximenia
americana
Carissa edulis
Species
%-t
age
of c
ases
0
10
20
30
40
50
60
70
80
90
100
Citrus spp M angifera
indica
Artocarpus
heterophyllus
Carica
papaya
Psidium
guajava
Persea
americana
Species
%-t
age
of c
ases
Fig. 3: IFTs planted on-farm Fig. 4: Exotic fruits grown on-farm
18
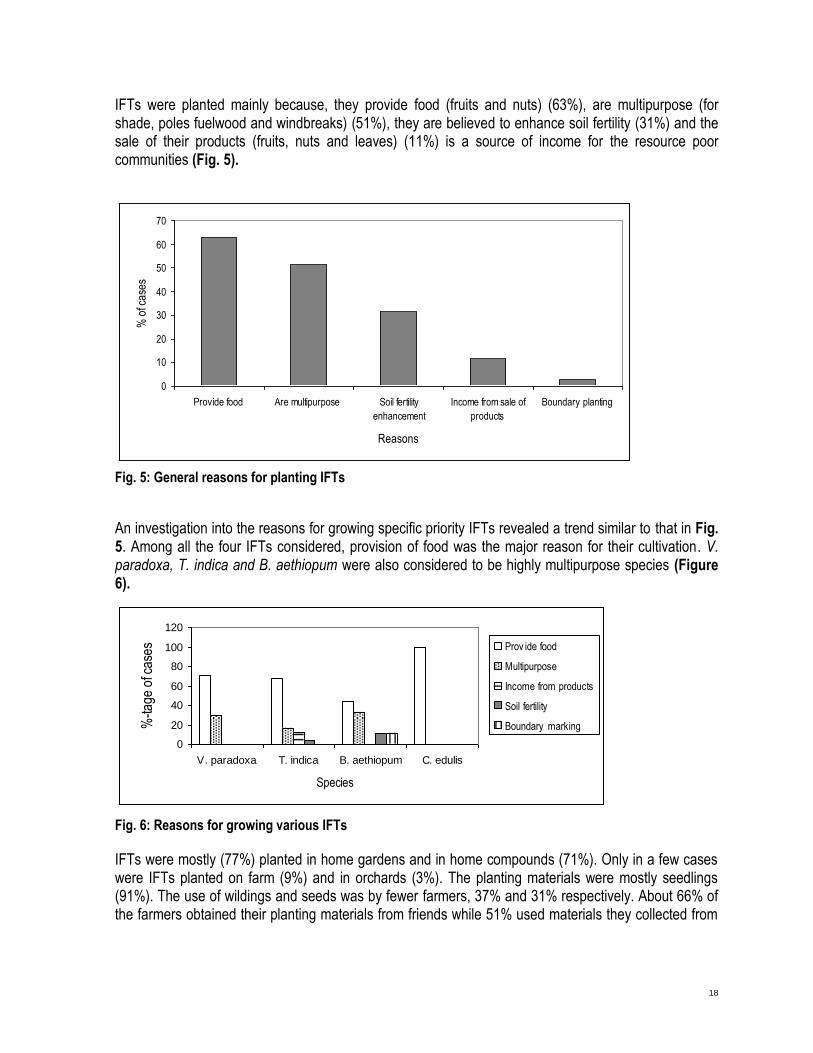
IFTs were planted mainly because, they provide food (fruits and nuts) (63%), are multipurpose (for shade, poles fuelwood and windbreaks) (51%), they are believed to enhance soil fertility (31%) and the sale of their products (fruits, nuts and leaves) (11%) is a source of income for the resource poor communities (Fig. 5).
0
10
20
30
40
50
60
70
Provide food Are multipurpose Soil fertility
enhancement
Income from sale of
products
Boundary planting
Reasons
% o
f cas
es
Fig. 5: General reasons for planting IFTs
An investigation into the reasons for growing specific priority IFTs revealed a trend similar to that in Fig. 5. Among all the four IFTs considered, provision of food was the major reason for their cultivation. V. paradoxa, T. indica and B. aethiopum were also considered to be highly multipurpose species (Figure 6).
0
20
40
60
80
100
120
V. paradoxa T. indica B. aethiopum C. edulis
Species
%-ta
ge o
f cas
es Prov ide food
Multipurpose
Income from products
Soil fertility
Boundary marking
Fig. 6: Reasons for growing various IFTs
IFTs were mostly (77%) planted in home gardens and in home compounds (71%). Only in a few cases were IFTs planted on farm (9%) and in orchards (3%). The planting materials were mostly seedlings (91%). The use of wildings and seeds was by fewer farmers, 37% and 31% respectively. About 66% of the farmers obtained their planting materials from friends while 51% used materials they collected from

19
the wild. Local tree nurseries and research stations provided a lesser proportion of the planting materials, with each contributing just 29% and 14% respectively (Table 15). Table 15: IFTs planting sites, planting materials and source of planting materials (n=130)
*Multiple responses were possible because each respondent could mention more than one site, planting material or source of planting material.
The major problems reported to be associated with growing of IFTs were; pests and diseases prevalence, their slow growth, death caused by drought and lack of knowledge and skills on their propagation. According to the respondents, these problems could be solved through spraying with both organic and inorganic chemicals, watering and weeding, fencing with locally available materials such as thorny branches and acquisition of skills on growing of IFTs (Table 16). Table 16: Problems and possible solutions to growing of IFTs (n=130)
Variable % of cases
Problems for growing IFTs Pest and diseases - worms, caterpillars 63.3 Slow growth 26.7 Drought - drying 20.0 Lack of knowledge and skills 20.0 Long fruiting period 10.0 Shading of leaves 10.0 Animal browsing 6.7 Small fruits and seeds 3.3 Small land size - Occupy a lot of land 3.3
Possible solutions to problems of growing IFTs Spraying with organic or inorganic chemicals 45.5 Watering and weeding 40.9 Fencing with thorny branches 22.7 Skills acquisition 22.7 Smoking the trees 9.1 Grafting 4.5
Variable % of cases
Planting site Home garden 77.1 Home/compound 71.4 Farm 8.6 Orchard 2.9
Planting materials Seedlings 91.4 Wildings 37.1 Seeds 31.4
Source of planting materials Friend 65.7 Wild material 51.4 Local nursery 28.6 Research station 14.3
20
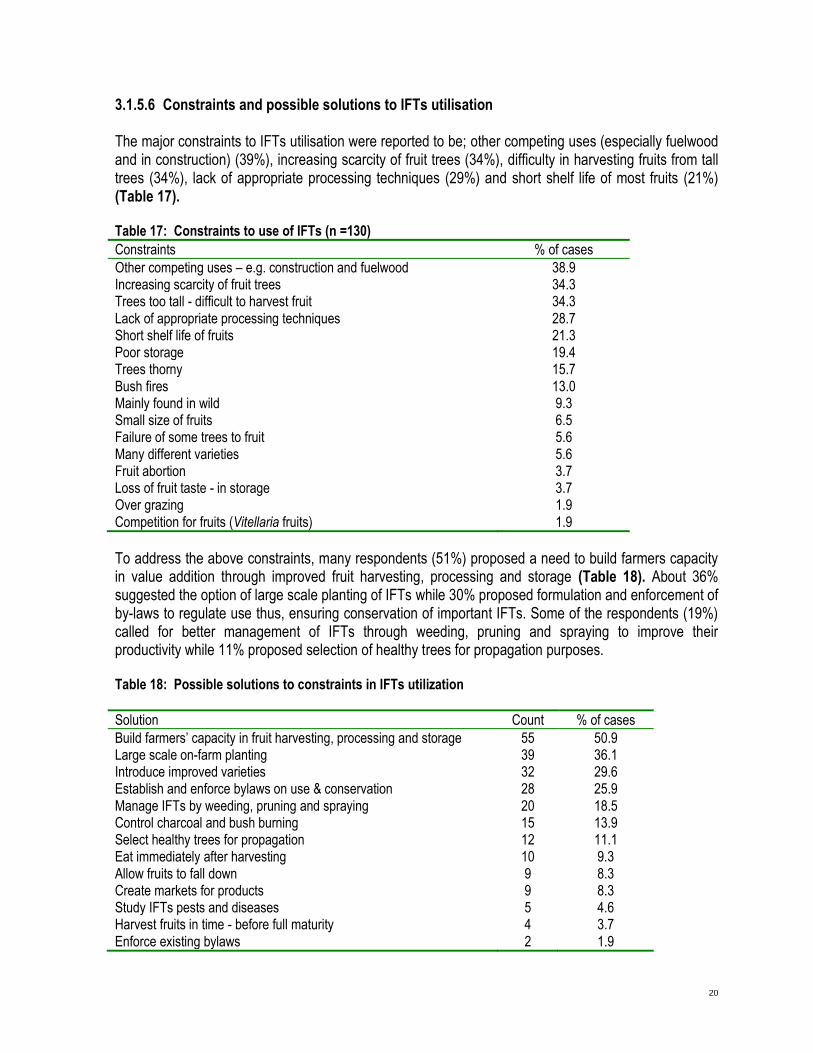
3.1.5.6 Constraints and possible solutions to IFTs utilisation The major constraints to IFTs utilisation were reported to be; other competing uses (especially fuelwood and in construction) (39%), increasing scarcity of fruit trees (34%), difficulty in harvesting fruits from tall trees (34%), lack of appropriate processing techniques (29%) and short shelf life of most fruits (21%) (Table 17). Table 17: Constraints to use of IFTs (n =130)
Constraints % of cases
Other competing uses – e.g. construction and fuelwood 38.9 Increasing scarcity of fruit trees 34.3 Trees too tall - difficult to harvest fruit 34.3 Lack of appropriate processing techniques 28.7 Short shelf life of fruits 21.3 Poor storage 19.4 Trees thorny 15.7 Bush fires 13.0 Mainly found in wild 9.3 Small size of fruits 6.5 Failure of some trees to fruit 5.6 Many different varieties 5.6 Fruit abortion 3.7 Loss of fruit taste - in storage 3.7 Over grazing 1.9 Competition for fruits (Vitellaria fruits) 1.9
To address the above constraints, many respondents (51%) proposed a need to build farmers capacity in value addition through improved fruit harvesting, processing and storage (Table 18). About 36% suggested the option of large scale planting of IFTs while 30% proposed formulation and enforcement of by-laws to regulate use thus, ensuring conservation of important IFTs. Some of the respondents (19%) called for better management of IFTs through weeding, pruning and spraying to improve their productivity while 11% proposed selection of healthy trees for propagation purposes. Table 18: Possible solutions to constraints in IFTs utilization
Solution Count % of cases
Build farmers‟ capacity in fruit harvesting, processing and storage 55 50.9 Large scale on-farm planting 39 36.1 Introduce improved varieties 32 29.6 Establish and enforce bylaws on use & conservation 28 25.9 Manage IFTs by weeding, pruning and spraying 20 18.5 Control charcoal and bush burning 15 13.9 Select healthy trees for propagation 12 11.1 Eat immediately after harvesting 10 9.3 Allow fruits to fall down 9 8.3 Create markets for products 9 8.3 Study IFTs pests and diseases 5 4.6 Harvest fruits in time - before full maturity 4 3.7 Enforce existing bylaws 2 1.9

21
3.1.6 Required improvements, pests, diseases and constraints on priority IFTs The species improvement probe was centered mostly on the tree itself, its fruit and/or fruiting attributes. These attributes are presented for the five priority IFTs for Uganda, namely; V. paradoxa, T. indica, V. doniana, B. aethiopum and C. edulis. In addition, S. birrea is included because it was selected as the third priority species at the regional level. 3.1.6.1 Required improvements, pests, diseases and constraints on V. paradoxa Many respondents gave the view of the need to increase the fruit pulp size (43%), softening the fruit (25%), reduce on tree height (40%), have fast growth (22%) and shortening time to first fruiting (16%) (Table 19).
Table 19: Required improvements on V. paradoxa fruit and tree
Variable % cases
Fruit Increase fruit/pulp size 34.3 Soften fruit 25.4 Pest and disease resistance 11.9 Shorten fruiting period 10.4 Increase oil content 9.0 Okay way it is 4.5 Increase seed size 4.5 More fruits per tree 3.0 More juicy pulp 3.0
Tree Shorten tree 39.5 Fast growing 22.4 Shorten fruiting time 15.8 Increase size of leaves 14.5 Increase pest and disease resistance 3.9 Enlarge tree 2.6 Increase fruiting frequency 2.6 Shorten fruit maturity period 2.6 *Responses with less than 2.6% have been excluded
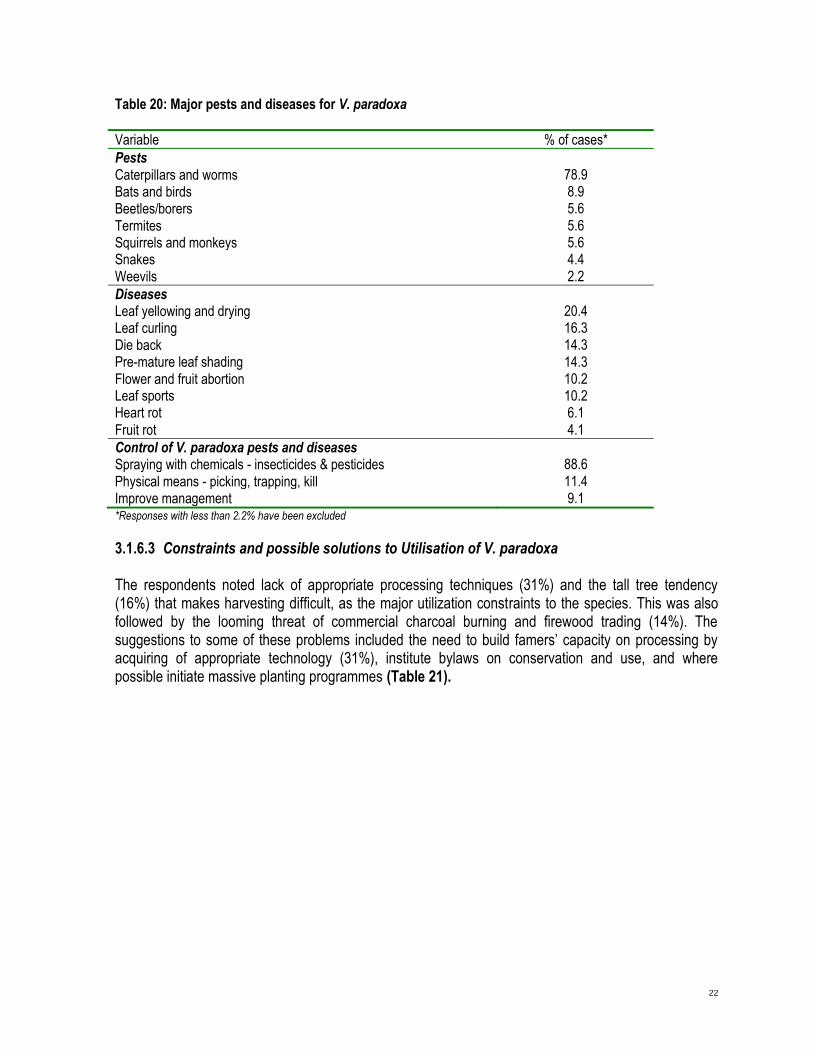
3.1.6.2 Pests and diseases for Vitellaria paradoxa The major pest for V. paradoxa was noted by most respondents (89%) to be caterpillars and worms infestation, and the control to it is by chemical spraying with insecticides/pesticides (87%) (Table 20).
22
Table 20: Major pests and diseases for V. paradoxa
Variable % of cases*
Pests Caterpillars and worms 78.9 Bats and birds 8.9 Beetles/borers 5.6
Termites 5.6 Squirrels and monkeys 5.6 Snakes 4.4 Weevils 2.2
Diseases Leaf yellowing and drying 20.4 Leaf curling 16.3 Die back 14.3 Pre-mature leaf shading 14.3 Flower and fruit abortion 10.2 Leaf sports 10.2 Heart rot 6.1
Fruit rot 4.1
Control of V. paradoxa pests and diseases Spraying with chemicals - insecticides & pesticides 88.6
Physical means - picking, trapping, kill 11.4 Improve management 9.1 *Responses with less than 2.2% have been excluded
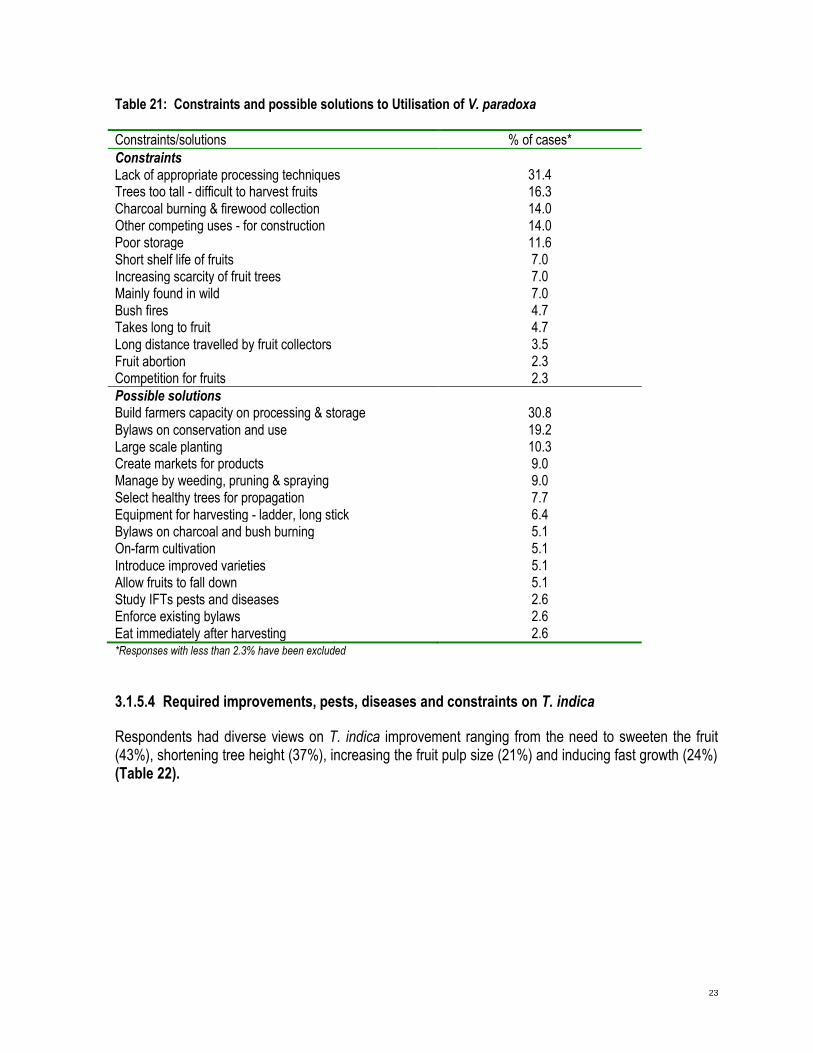
3.1.6.3 Constraints and possible solutions to Utilisation of V. paradoxa The respondents noted lack of appropriate processing techniques (31%) and the tall tree tendency (16%) that makes harvesting difficult, as the major utilization constraints to the species. This was also followed by the looming threat of commercial charcoal burning and firewood trading (14%). The suggestions to some of these problems included the need to build famers‟ capacity on processing by acquiring of appropriate technology (31%), institute bylaws on conservation and use, and where possible initiate massive planting programmes (Table 21).
23
Table 21: Constraints and possible solutions to Utilisation of V. paradoxa
Constraints/solutions % of cases*
Constraints Lack of appropriate processing techniques 31.4 Trees too tall - difficult to harvest fruits 16.3 Charcoal burning & firewood collection 14.0 Other competing uses - for construction 14.0 Poor storage 11.6 Short shelf life of fruits 7.0 Increasing scarcity of fruit trees 7.0 Mainly found in wild 7.0 Bush fires 4.7 Takes long to fruit 4.7 Long distance travelled by fruit collectors 3.5
Fruit abortion 2.3 Competition for fruits 2.3
Possible solutions Build farmers capacity on processing & storage 30.8
Bylaws on conservation and use 19.2 Large scale planting 10.3 Create markets for products 9.0 Manage by weeding, pruning & spraying 9.0 Select healthy trees for propagation 7.7 Equipment for harvesting - ladder, long stick 6.4 Bylaws on charcoal and bush burning 5.1 On-farm cultivation 5.1
Introduce improved varieties 5.1 Allow fruits to fall down 5.1 Study IFTs pests and diseases 2.6 Enforce existing bylaws 2.6
Eat immediately after harvesting 2.6 *Responses with less than 2.3% have been excluded
3.1.5.4 Required improvements, pests, diseases and constraints on T. indica
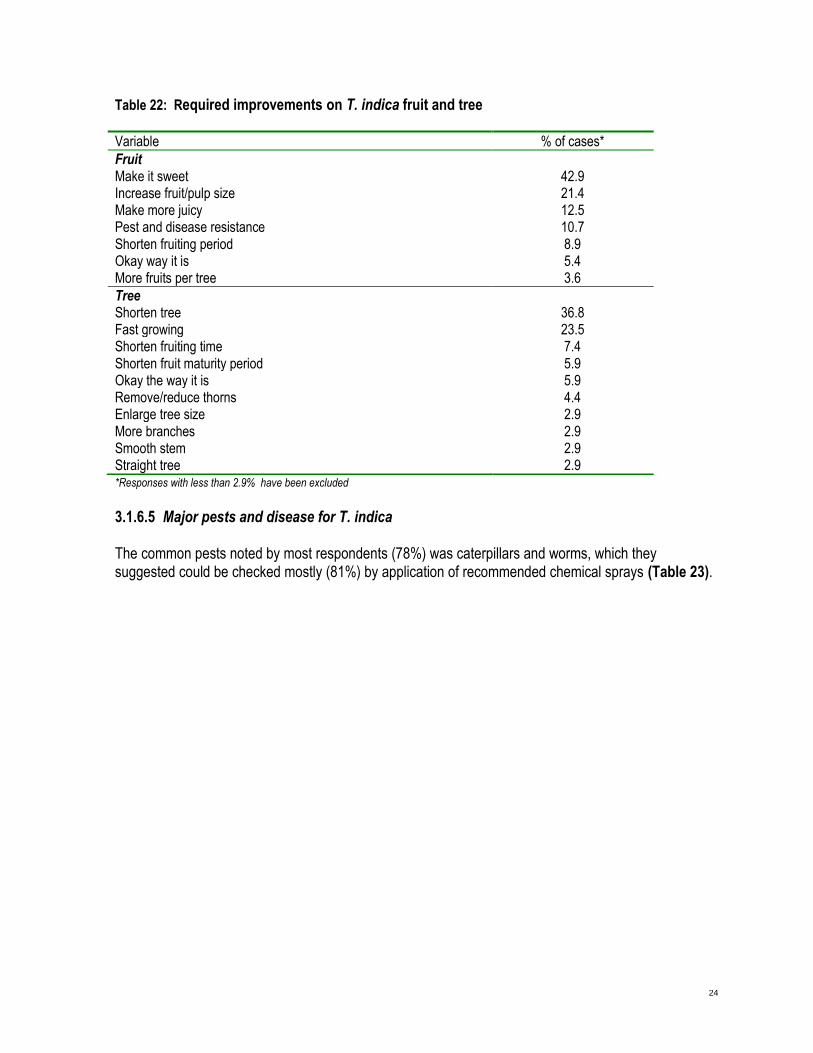
Respondents had diverse views on T. indica improvement ranging from the need to sweeten the fruit (43%), shortening tree height (37%), increasing the fruit pulp size (21%) and inducing fast growth (24%) (Table 22).
24
Table 22: Required improvements on T. indica fruit and tree
*Responses with less than 2.9% have been excluded
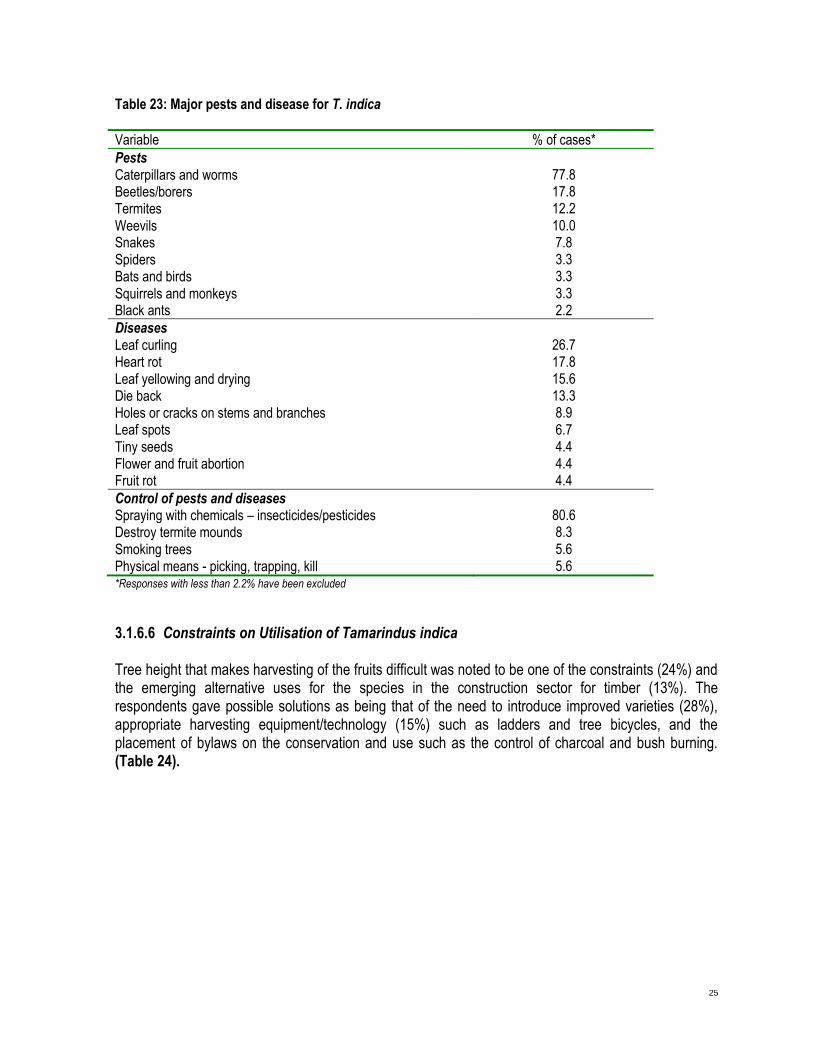
3.1.6.5 Major pests and disease for T. indica The common pests noted by most respondents (78%) was caterpillars and worms, which they suggested could be checked mostly (81%) by application of recommended chemical sprays (Table 23).
Variable % of cases*
Fruit Make it sweet 42.9 Increase fruit/pulp size 21.4 Make more juicy 12.5 Pest and disease resistance 10.7 Shorten fruiting period 8.9 Okay way it is 5.4 More fruits per tree 3.6
Tree Shorten tree 36.8 Fast growing 23.5 Shorten fruiting time 7.4 Shorten fruit maturity period 5.9 Okay the way it is 5.9 Remove/reduce thorns 4.4 Enlarge tree size 2.9 More branches 2.9 Smooth stem 2.9 Straight tree 2.9
25
Table 23: Major pests and disease for T. indica
Variable % of cases*
Pests Caterpillars and worms 77.8 Beetles/borers 17.8 Termites 12.2
Weevils 10.0 Snakes 7.8 Spiders 3.3 Bats and birds 3.3
Squirrels and monkeys 3.3 Black ants 2.2
Diseases Leaf curling 26.7 Heart rot 17.8 Leaf yellowing and drying 15.6 Die back 13.3 Holes or cracks on stems and branches 8.9 Leaf spots 6.7 Tiny seeds 4.4 Flower and fruit abortion 4.4 Fruit rot 4.4
Control of pests and diseases Spraying with chemicals – insecticides/pesticides 80.6 Destroy termite mounds 8.3
Smoking trees 5.6 Physical means - picking, trapping, kill 5.6 *Responses with less than 2.2% have been excluded
3.1.6.6 Constraints on Utilisation of Tamarindus indica Tree height that makes harvesting of the fruits difficult was noted to be one of the constraints (24%) and the emerging alternative uses for the species in the construction sector for timber (13%). The respondents gave possible solutions as being that of the need to introduce improved varieties (28%), appropriate harvesting equipment/technology (15%) such as ladders and tree bicycles, and the placement of bylaws on the conservation and use such as the control of charcoal and bush burning. (Table 24).

26
Table 24: Constraints associated with Utilisation of T. indica
Variable % of cases*
Constraints Trees too tall - difficult to harvest fr 24.3 Other competing uses - for constructors 12.9 Increasing scarcity of fruit trees 11.4 Poor storage 11.4 Takes long to fruit 8.6 Bush fires 7.1 Small size of fruits 7.1 Many different varieties 7.1 Long distance travelled by fruit collection 5.7 Lack of appropriate processing tech 5.7 Short shelf life of fruits 5.7
Failure of some trees to fruit 5.7 Loss of fruit taste - in storage 4.3 Fruit abortion 2.9 Over grazing 2.9
Possible solutions to constraints Introduce improved varieties 28.3 Equipment for harvesting - ladder, long 15.0 Bylaws on conservation and use 13.3
Bylaws on charcoal and bush burning 10.0 Large scale planting of IFTs 8.3 Eat immediately after harvesting 8.3 On-farm cultivation 6.7 Build farmers capacity on processing & s 6.7 Study IFTs pests and diseases 5.0 Allow fruits to fall down 3.3 Select healthy trees for propagation 3.3 Create markets for products 3.3 *Responses with less than 2.9% have been excluded
3.1.6.7 Required improvements, pest, diseases and constraints on V. doniana
The respondents interviewed gave the need to increase fruit/pulp size ratio (47%) and making the fruit more juicy (29%) as the required fruit improvement attributes. While the shortening of first fruiting time (38%) and the need for fast growth (27%), were some of the tree improvement attributes suggested. Caterpillars and worms (95%) were noted as major pests that defoliate the species, and premature leaf shedding (25%) was noted as one of the diseases. Chemical spraying (86%) with insecticides/pesticides was the reliable solution suggested by the respondents (Table 25).

27
Table 25: Required improvements on V. doniana and pests and diseases
Variable % of cases*
Fruit Increase fruit/pulp size 47.1 Make fruit more juicy 29.4 Make it sweet 11.8 Remove colouring of teeth 11.8
Tree Shorten fruiting time 36.7 Fast growing 26.7 Less bushy crown 20.0 Shorten tree 10.0
Major pests Caterpillars and worms - defoliators 94.7 Bats and birds 10.5
Major diseases Pre-mature leaf shading 25.0 Die back 16.7 Heart rot 16.7
Control of pests and diseases Spraying with chemicals - insecticides and pesticides 85.7 Pick fruits immediately after falling 14.3 *Responses with less than 10% have been excluded
3.1.6.8 Constraints and possible solutions to Utilisation of V. doniana Most respondents (29%) interviewed cited short shelf life for the fruits as one of the constraints coupled with the fruit scarcity (21%) due to irregular fruiting of the species. Solutions suggested by the interviewees ranged from need for on-farm cultivation of selected tree varieties (25%), building of farmer capacity on processing and storage for market (20%) and the placement of bylaws on conservation and use (20%) (Table 26). Table 26: Constraints and possible solutions to Utilisation of Vitex doniana
Variable % of cases*
Constraints Short shelf live of fruits 28.6 Increasing scarcity of fruit trees 21.4 Colouring teeth 21.4 Small size of fruits 14.3 Charcoal burning & firewood collection 14.3 Lack of market for fruits 14.3
Possible Solution On-farm cultivation 30.0 Select healthy trees for propagation 20.0 Build farmers capacity on processing & storage 20.0 Bylaws on conservation and use 20.0 Create markets for products 20.0 *Responses with less than 14.3% have been excluded

28
3.1.6.9 Required improvements, pest, diseases and constraints on B. aethiopum
The suggested improvements of the B. aethiopum fruit included softening (44%) and increasing of the fruit/pulp size (19%). On the tree attributes, tree height shortening (46%) was the main improvement with 25% of the respondents wanting the tree growth rate to be scientifically influenced. All the respondents gave caterpillars and worms as the main pest to Borassus with the common diseases of die-back (31%) and leaf spotting (23%) as the common ones (Table 27). Table 27: Borassus aethiopum - required improvements, pests and diseases
Variable % of cases
Fruit Soften fruit 44.4 Increase fruit/pulp size 18.5 Shorten fruiting period 11.1 More juicy 11.1 Make it less fibrous 8.3 Fall just before ripening 8.3
Tree Shorten tree 45.8 Fast growing 25.0 Shorten fruiting time 16.7 Taller or bigger trees 8.3 Increase trunk size 8.3 Smooth stem 8.3
Major pests
Caterpillars and worms - defoliators 100.0
Major diseases Die back 30.8 Leaf sports 23.1
Flower and fruit abortion 15.4 Fruit rot 15.4
Control of pests and diseases
Spraying with chemicals - insecticides and pesticides 57.1 Improve management 28.6 Spot weeding 28.6 *Responses with less than 8.3% have been excluded

29
3.1.6.10 Constraints associated with Utilisation of Borassus aethiopum Respondents noted tall tree height (35%) and the competing use for construction timber (24%) as the constraints to the use of Borassus as an IFT (Table 28). Table 28: Constraints associated with Utilisation of B. aethiopum
Constraints % of cases
Trees too tall - difficult to harvest fruits 35.3 competing uses - for construction 23.5 Takes long to fruit 17.6
Poor storage 11.8 Bush fires 11.8
Possible solutions to constraints
Build farmers capacity on processing & storage 47.4
Manage by weeding, pruning & spraying 21.1 Introduce improved varieties 15.8 Allow fruits to fall down 15.8
Bylaws on conservation and use 10.5 *Responses with less than 10.5% have been excluded
3.1.6.11 Required improvements, pest and diseases and constraints on C. edulis
The respondents gave the need to increase the fruit pulp size (63%) and the removal by domestication, of the thorns as the major improvement for Carissa for use as IFTs. The common diseases noted by all respondents included root rot, flower and fruit abortions and wilting. Chemical spraying with insecticide/pesticide was suggested by many respondents (69%) as the only remedy (Table 29).

30
Table 29: Carisa edulis - required improvements, pests and diseases
*Responses with less than 7.1% have been excluded
3.1.6.12 Constraints and possible solutions for Utilisation of Carissa Noted as user unfriendly situations in the species by respondents were the thorny nature (45%) and short fruit shelf life (29%), which can be improved according to them by introduction of improved cultivars (31%) cultivated on-farm (27%) (Table 30).
Variable % of cases*
Required improvement on fruit Increase fruit/pulp size 62.5 Make it sweat 12.5 More juicy 12.5 Pest and disease resistance 8.3
Required improvement on tree Remove/reduce thorns 50.0 Fast growing 19.2 Less bushy crown 19.2 Straight tree 7.7
Major pests
Caterpillars and worms - defoliators 71.4
Beetles/borers 14.3 Mosquitoes 10.7 Bats and birds 7.1
Termites 7.1
Major diseases Root rot 50 Flower and fruit abortion 50
Wilting 50 Fruit rot 50
Control of pests and diseases
Spraying with chemicals - insecticides and pesticides 69.2 Destroy termites mounds 10.5 Control bush fires 10.5

31
Table 30: Constraints and possible solutions for Utilisation of Carissa edulis
Variable Count* % of cases
Constraints Trees thorny 14 45.2 Short shelf live of fruits 9 29.0 Long distance travelled by fruit collectors 4 12.9
Increasing scarcity of fruit trees 4 12.9 Bush fires 3 9.7 Mainly found in wild 3 9.7 Many different varieties 2 7.7
Possible solutions to constraints Introduce improved varieties 8 30.8 On-farm cultivation 7 26.9 Large scale planting 4 15.4
Manage by weeding, pruning and spraying 4 15.4 Bylaws on charcoal and bush burning 3 11.5 Harvest fruits in time - before full maturity 2 7.7 Eat immediately after harvesting 2 7.7
Select healthy trees for propagation 2 7.7 *Responses with less than 7.7% have been excluded
3.1.6.13 Required improvements, pest and diseases and constraints on S. birrea
Sclerocarya birrea was included because it was selected as priority regional species. There was however, very limited information to produce meaningful results for Uganda due to the marginal status of the tree in the study area. Only one respondent in each case reported incidence of Caterpillars (defoliators) and heart rot respectively in S. birrea. All the other variables had no responses. Field observations in both Teso and Lango sub-regions showed S. birrea to suffer incidences of gummosis, an incident associated with exudate release more probably as a result of fungal attack.
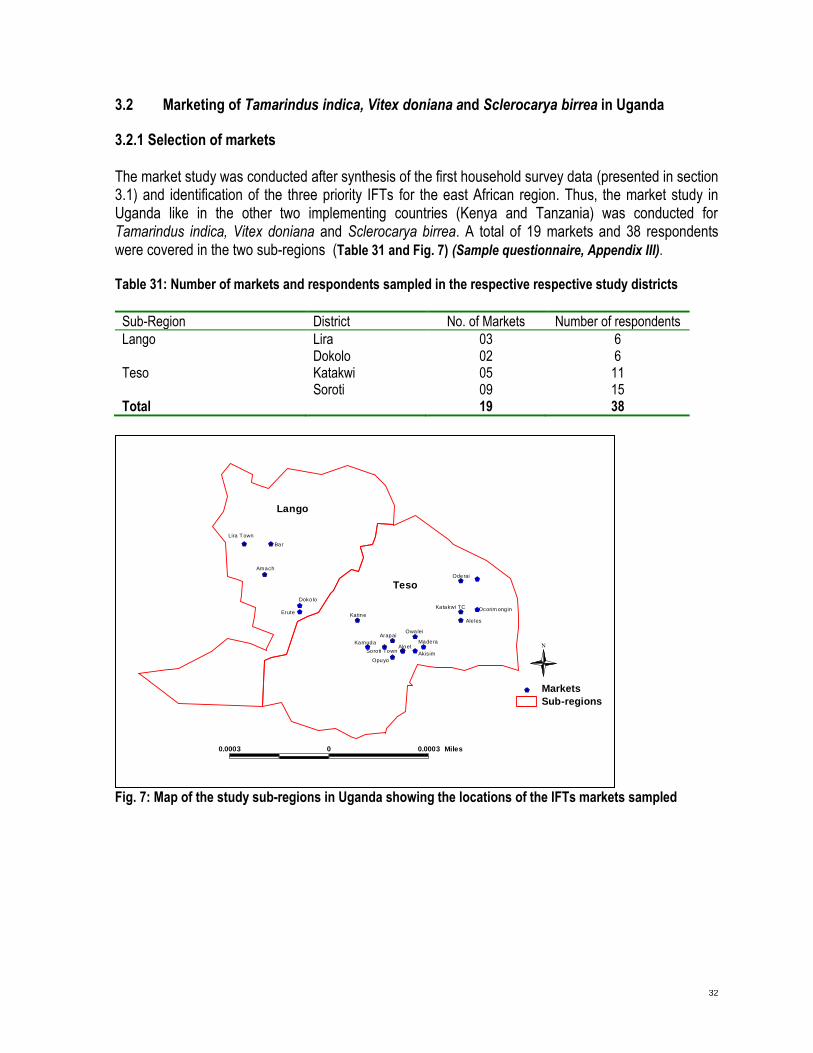
32
3.2 Marketing of Tamarindus indica, Vitex doniana and Sclerocarya birrea in Uganda
3.2.1 Selection of markets The market study was conducted after synthesis of the first household survey data (presented in section 3.1) and identification of the three priority IFTs for the east African region. Thus, the market study in Uganda like in the other two implementing countries (Kenya and Tanzania) was conducted for Tamarindus indica, Vitex doniana and Sclerocarya birrea. A total of 19 markets and 38 respondents were covered in the two sub-regions (Table 31 and Fig. 7) (Sample questionnaire, Appendix III).
Table 31: Number of markets and respondents sampled in the respective respective study districts
Sub-Region District No. of Markets Number of respondents
Lango Lira 03 6 Dokolo 02 6 Teso Katakwi 05 11 Soroti 09 15 Total 19 38
Fig. 7: Map of the study sub-regions in Uganda showing the locations of the IFTs markets sampled
&\&\
&\ &\
&\
&\
&\
&\&\
&\&\
&\
&\
&\
&\
&\ &\
&\&\
&\
Lango
Teso
Bar
Erute
Aloet
Opuyo
Akisim
Madera
Katine
Kamuda
Oderai
Katakwi TC
Arapai
Dokolo
Owalei
Amach
Lira T own
Ocorim ongin
Ale les
Soroti Town
0.0003 0 0.0003 Miles
N
Sub-regions
&\ Markets

33
3.2.2 Socio-economic characteristics of respondents A majority of the respondents (68%) were female and about 42% of these were young, aged between 20 – 25 years. Of the three ethnic groupings encountered, Iteso were the majority (58%) while the Langi and Kumam had an equal proportion (21%). About 45% of the respondents had attained primary education, 32% secondary, about 8% tertiary and 16% no foramal education. Respondents were represented by two groups; namely traders (55%) and consumers (45%) (Table 32). Table 32: Socio-economic characteristics of the respondents (n=38)
3.2.3 Marketing of priority fruits Among the three priority fruits considered in this study, only T. indica was reported to be commonly sold (Table 33). Most of the respondents (63%) reported selling T. indica as first priority. T. indica was highly marketed because it can be consumed in various forms (Table 34). Table 33: IFTs marketed (n=38)
Variable % of cases
Sex Male 31.6 Female 68.4
Age 20 - 25 42.1 26 - 55 36.8 > 55 21.1
Ethnicity Iteso 57.9 Langi 21.1 Kumam 21.1
Education level None 15.8 Primary 44.7 Secondary 31.6 Tertiary 7.9
Activity in field of IFTs Trader 55.3 Consumer 44.7
Species % of respondents marketing IFTas: 1st priority 2nd priority 3rd priority
Tamarindus indica 63.2 15.8 2.6 Vitex doniana 0.0 0.0 0.0 Sclerocarya birrea 0.0 0.0 0.0

34
Table 34: Criteria for the ranking (n=38)
Variable Percentage
Criteria for first rank Can be consumed in various forms 62.5 Used daily 12.5 source of income 16.7 readily available 8.3
Criteria for second rank Readily available 50.0 Liked by children 33.3 Liked by foreigners (whites) 16.7
Criteria for third rank More marketable 100.0
3.2.4 Edible parts in T. indica, V. doniana and S. birrea fruits For all the three priority fruits, the fruit pulp was reported to be the only edible part (Table 35). Table 35: Edible parts in T. indica, V. doniana and S. birrea fruits
Species Fruit pulp Seed kernel
Tamarindus indica 100.0 - Vitex doniana 94.4 - Sclerocarya birrea 50.0 -
3.2.5 Local processing of T. indica, V. doniana and S. birrea fruits Only T. indica and V. doniana were reported to be processed while S. birrea was not processed. A majority of repondents (76%) processed T. indica for long term storage. About 24% processed T. indica for use as a beverage. Only 26% reported to process V. doniana for long term storage (Table 36). Table 36: Purpose of local processing of T. indica, V. doniana and S. birrea
Species Purpose and percentage Long term storage (%) As beverage (%) Not processed
Tamarindus indica 76.3 23.7 0.0 Vitex doniana 26.3 0.0 73.7 Sclerocarya birrea 0.0 0.0 100.0
T. indica was reported to be mainly sun dried and shelled and later used for making juice, spicing atap (the local millet bread) and in other assorted products. On the other hand V. doniana is sun dried and packed for long term storage. A majority of respondents 71% report that there is no specific name of the processed T. indica products (Tables 37 and 38).

35
Table 37: Steps for local processing of T. indica, V. doniana and S. birrea
Species Shell, soak, boil in
water and squeeze
(%)
Shell, sack and
squeeze with sugar
(%)
Sundry, pack
(%)
Sundry, shell
(%)
No processing
involved
(%)
Tamarindus indica 2.6 28.9 2.6 65.8 0.0 Vitex doniana 0.0 0.0 13.2 0.0 0.0 Sclerocarya birrea 0.0 0.0 0.0 0.0 0.0
Table 38: Processed products for T. indica, V. doniana and S. birrea
Species Juice (%) Spice (%) No name (%)
Tamarindus indica 21.1 7.9 71.1 Vitex doniana 0.0 0.0 7.9 Sclerocarya birrea 0.0 0.0 0.0
3.2.6 Changes in availability of T. indica, V. doniana and S. birrea fruits The trend generally shows that T. indica and V. doniana fruits are now increasingly becoming more available on-farm than in woodlands and forest reserves. S. birrea is however; obtained more from the woodlands than it used to be 10 years ago while its on-farm availability is reducing (Figure 8). The change in the source of these fruits was mainly attributed to increase in agricultural land use (Figure 9). The change in the sources of T. indica and V. doniana had increased the prices per kilogram by about USD 0.49 (Figure 10)
0
10
20
30
40
50
60
70
80
90
T. indica
current
T. indica 10
yrs ago
V.doniana
current
V.doniana 10
yrs ago
S. birrea
current
S. birrea 10
yrs ago
Species/source
Per
cent
ange
(%)
Farm
Forest reserve
Woodland bushes
Fig. 8: Changes in availability of T. indica, V. doniana and S. birrea fruits

36
01020304050607080
Increased
demand for
products
Use of tree for
charcoal burning
Change of land
use to
agriculture
Planted on farm
Reason
Per
cent
age
(%)
Tamarindus indica
Vitex doniana
Sclerocarya birrea
Fig. 9: Reasons for changes in source of T. indica, V. doniana and S. birrea
0
20
40
60
80
100
120
0 0.01 – 0.50 0.51 – 1.00 0.10 – 1.90
Price change per kg (Us $)
Per
cent
age
(%)
Tamarindus indica
Vitex doniana
Sclerocarya birrea
Figure 10: Magnitude of price change for T. indica, V. doniana and S. birrea with respect to change in source
3.2.7 Marketing destination for T. indica, V. doniana and S. birrea fruits Only T. indica was reported to be transported for sale to other areas beyond villages of collection. The popular destinations are Lira, Soroti, Mbale and Kampala towns (Figure 11 ).

37
0
20
40
60
80
100
120
Soroti Lira Kampala Mbale None
Market
Pe
rce
nta
ge
(%
)
Tamarindus indica
Vitex doniana
Sclerocarya birrea
Figure 11: Town towards which T. indica, V. doniana and S. birrea fruits are transported
3.2.8 Preferred fruits in the market and their prices Most commonly sold or available fruits are ovate and sweet-sour for T. indica, rounded and sweet for both V. doniana and S. birrea. Straight and sweet-sour T. indica fruits are the most preferred by buyers while for V. doniana and S. birrea round and sweet fruits are preferred (Table 39). Table 39: Fruit shape and tastes found in market and preferred by buyers
Variable T. Indica sold preferred
V. doniana sold preferred
S. birrea sold preferred
Fruit shape Rounded 15.8 13.9 91.7 82.4 95.2 100.0 Ovate 84.2 16.7 8.3 17.6 4.8 0.0 Straight 0.0 69.4 0.0 0.0 0.0 0.0 Fruit taste Sweet 13.0 23.7 74.3 95.8 31.6 100.0 Sour 2.6 7.9 2.9 4.2 5.3 0.0 Bitter 5.3 15.8 11.4 0.0 26.3 0.0 Sweet-sour 47.4 52.6 2.9 0.0 21.1 0.0 Sweet-bitter 23.7 0.0 8.6 0.0 15.8 0.0
Many respondents (55 – 67%) reported that the prices for T. indica and V. doniana fruits were not much affected by differences in shape and taste. Slight price difference ranging from 0.01 – 1.00 (average) USD per kg was mainly reported for T. indica. The average price difference was 0.08 with standard deviation of 0.171. On the other hand, S. birrea was not used commercially (Table 40). Table 40: Difference in price with respect to fruit shapes (between the lowest and highest) in US$ per unit
Price (US $ per kg) T. indica Shape Taste
V. doniana Shape Taste
S. birrea Shape Taste
0.00 60.0 55.2 66.7 66.7 0.0 0.0 0.01 – 0.09 13.3 3.4 0.0 0.0 0.0 0.0 0.10 – 0.50 19.9 34.3 33.3 0.0 0.0 0.0 0.51 – 1.00 3.3 6.8 0.0 33.3 0.0 0.0
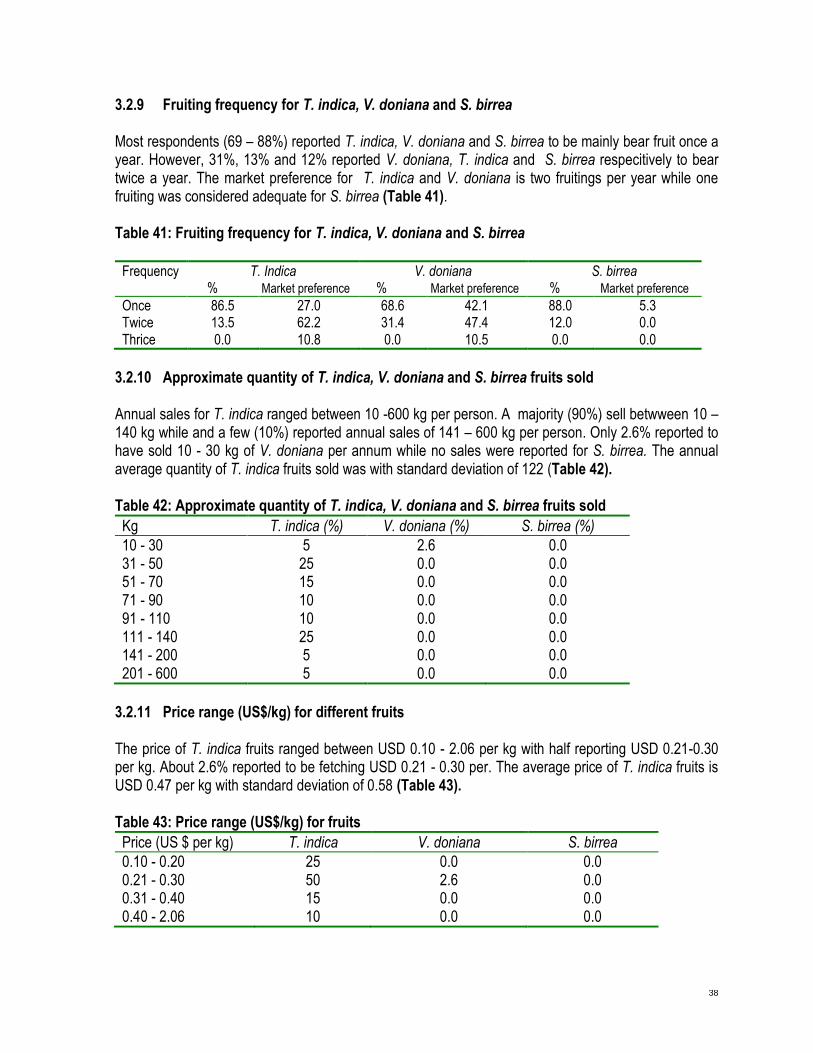
38
3.2.9 Fruiting frequency for T. indica, V. doniana and S. birrea Most respondents (69 – 88%) reported T. indica, V. doniana and S. birrea to be mainly bear fruit once a year. However, 31%, 13% and 12% reported V. doniana, T. indica and S. birrea respecitively to bear twice a year. The market preference for T. indica and V. doniana is two fruitings per year while one fruiting was considered adequate for S. birrea (Table 41). Table 41: Fruiting frequency for T. indica, V. doniana and S. birrea
Frequency T. Indica % Market preference
V. doniana % Market preference
S. birrea % Market preference
Once 86.5 27.0 68.6 42.1 88.0 5.3 Twice 13.5 62.2 31.4 47.4 12.0 0.0 Thrice 0.0 10.8 0.0 10.5 0.0 0.0
3.2.10 Approximate quantity of T. indica, V. doniana and S. birrea fruits sold Annual sales for T. indica ranged between 10 -600 kg per person. A majority (90%) sell betwween 10 – 140 kg while and a few (10%) reported annual sales of 141 – 600 kg per person. Only 2.6% reported to have sold 10 - 30 kg of V. doniana per annum while no sales were reported for S. birrea. The annual average quantity of T. indica fruits sold was with standard deviation of 122 (Table 42). Table 42: Approximate quantity of T. indica, V. doniana and S. birrea fruits sold
Kg T. indica (%) V. doniana (%) S. birrea (%)
10 - 30 5 2.6 0.0 31 - 50 25 0.0 0.0 51 - 70 15 0.0 0.0 71 - 90 10 0.0 0.0 91 - 110 10 0.0 0.0 111 - 140 25 0.0 0.0 141 - 200 5 0.0 0.0 201 - 600 5 0.0 0.0
3.2.11 Price range (US$/kg) for different fruits The price of T. indica fruits ranged between USD 0.10 - 2.06 per kg with half reporting USD 0.21-0.30 per kg. About 2.6% reported to be fetching USD 0.21 - 0.30 per. The average price of T. indica fruits is USD 0.47 per kg with standard deviation of 0.58 (Table 43). Table 43: Price range (US$/kg) for fruits
Price (US $ per kg) T. indica V. doniana S. birrea
0.10 - 0.20 25 0.0 0.0 0.21 - 0.30 50 2.6 0.0 0.31 - 0.40 15 0.0 0.0 0.40 - 2.06 10 0.0 0.0
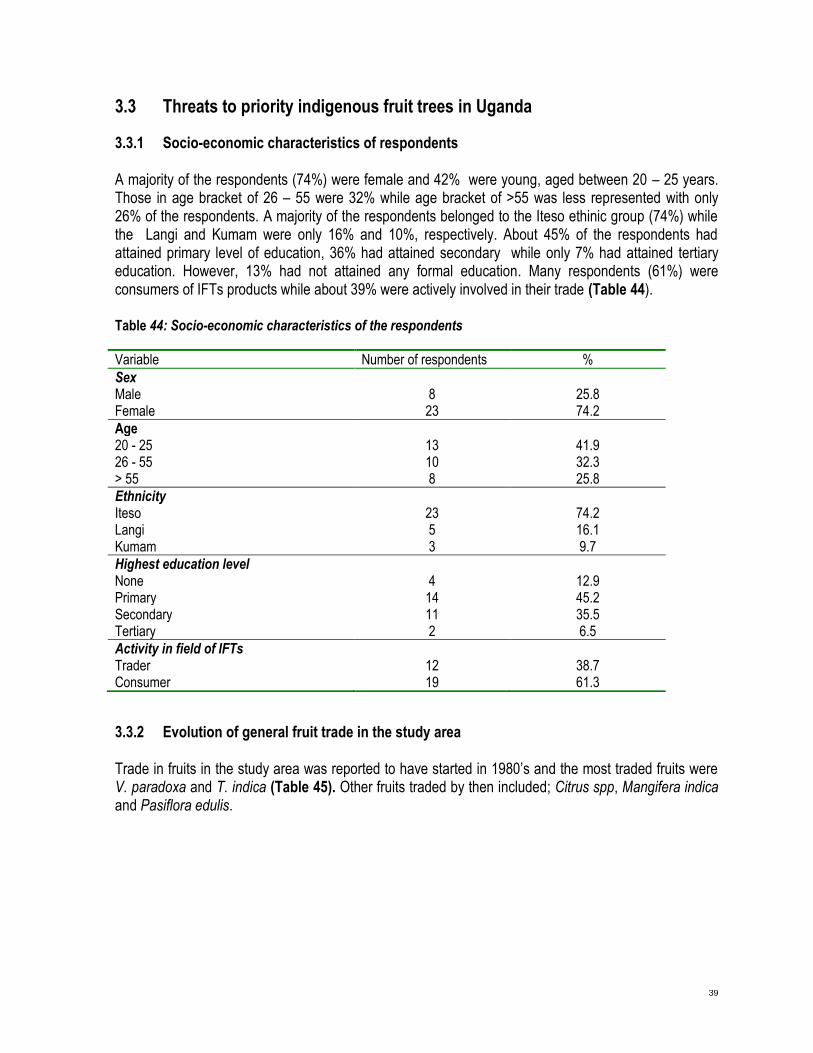
39
3.3 Threats to priority indigenous fruit trees in Uganda
3.3.1 Socio-economic characteristics of respondents A majority of the respondents (74%) were female and 42% were young, aged between 20 – 25 years. Those in age bracket of 26 – 55 were 32% while age bracket of >55 was less represented with only 26% of the respondents. A majority of the respondents belonged to the Iteso ethinic group (74%) while the Langi and Kumam were only 16% and 10%, respectively. About 45% of the respondents had attained primary level of education, 36% had attained secondary while only 7% had attained tertiary education. However, 13% had not attained any formal education. Many respondents (61%) were consumers of IFTs products while about 39% were actively involved in their trade (Table 44). Table 44: Socio-economic characteristics of the respondents
3.3.2 Evolution of general fruit trade in the study area Trade in fruits in the study area was reported to have started in 1980‟s and the most traded fruits were V. paradoxa and T. indica (Table 45). Other fruits traded by then included; Citrus spp, Mangifera indica and Pasiflora edulis.
Variable Number of respondents %
Sex Male 8 25.8 Female 23 74.2
Age 20 - 25 13 41.9 26 - 55 10 32.3 > 55 8 25.8
Ethnicity Iteso 23 74.2 Langi 5 16.1 Kumam 3 9.7
Highest education level None 4 12.9 Primary 14 45.2 Secondary 11 35.5 Tertiary 2 6.5
Activity in field of IFTs Trader 12 38.7 Consumer 19 61.3

40
Table 45: Evolution of general fruit trade in the study area
Species Year when first sold %
Vitellaria paradoxa 1980s 22.6 Termarindus indica 1980s 22.6 Citrus cinensis 1980s 6.4 Mangifera indica 1980s 3.2 Pasiflora edulis 1992 3.2 Strychnos spinosa 1980s 3.2 Agogo(Luo) 1980s 3.2 Ximenia americana 1980s 3.2 Carissa edulis 1980s 3.2
When first sold, the V. paradoxa fruits were reported to have been collected from rangelands and compounds while T. indica fruits were collected from farms and compounds (Table 46). Most of the fruits first sold were reported to have been collected mainly from rangelands and around homes. Table 46: Location/source of fruits when first sold
Species Location
Compound Rangelands/bushes Farms Forests
Vitellaria paradoxa 9.7 9.7 3.2 - Mangifera indica 3.2 - - - Termarindus indica 16.2 3.2 16.1 3.2 Citrus cinensis - - - - Pasiflora edulis 3.2 - - - Strychnos spinosa - 3.2 - 3.2 Agogo (Luo) - 3.2 - 3.2 Ximenia americana - 3.2 - - Carissa edulis - 3.2 3.2 -
3.3.3 Evolution of T. indica, V. doniana and S. birrea fruit trade Trade in the three priority species (T. indica, V. doniana and S. birrea) was reported to have started in the 1980s with T. indica leading (10%). V. doniana and S. birrea were only reported to have been traded by few people (3%) (Table 47). Table 47: Evolution over time of collection of priority IFTs
Species Year when first sold %
Termarindus indica 1980 9.7
Vitex doniana 1980 3.2 Sclerocarya birrea 1980 3.2

41
3.3.4 Source and distance covered for priority fruits when first sold
In the 1980s, the main source of T. indica fruits was farms (45%) and collectors would move for 5 – 10 km to collect its fruits. Vitex doniana was mainly found in the rangelands and bushes (39%) and collectors travelled for more that 5 km in search of its fruits while S. birrea like T. indica was reported to be more on farms at a distance of about 1-2 km (Table 48). Table 48: Source and distance covered for priority fruits when first sold
Species/location % Distance covered %
T. indica Compound Parklands/rangelands
Farms
Forests
12.9 12.9 45.2 16.1
0-2km 3-5km
6-10km >10km
32.3 22.6 16.1 6.5
V. doniana Farms
Compound
Rangelands
Forests
9.7
6.5
38.7
6.5
0-2km 3-5km
6-10km >10km
38.7
12.9
6.5
6.5 S. birrea Farms
Rangelands/bushes
Forests
29.0
19.3
6.5
0-2km
3-5km
6-10km
22.6
19.4
6.5
3.3.5 Price range when the priority fruits where first sold
The prices for T. indica when first sold ranged from USD 0.05 – 1.94 per kg. Most of repondents reported to have sold it at USD 0.66 per kg. Vitex doniana and S. birrea were largely reported not to have been sold in the 1980s. However, according to those who claimed they were sold, the price was USD 0.06 - 0.33 per kg (Table 49). Table 49: Price range when the priority fruits where first sold
Species Price (USD per kg) % T. indica 0.05
0.66
0.17
1.11
1.94
1.67
16.1
29.0
6.5
6.5
3.2
6.5
V. doniana 0.06
Not sold
3.2 25.8
S. birrea 0.33
Not sold 3.2
16.1
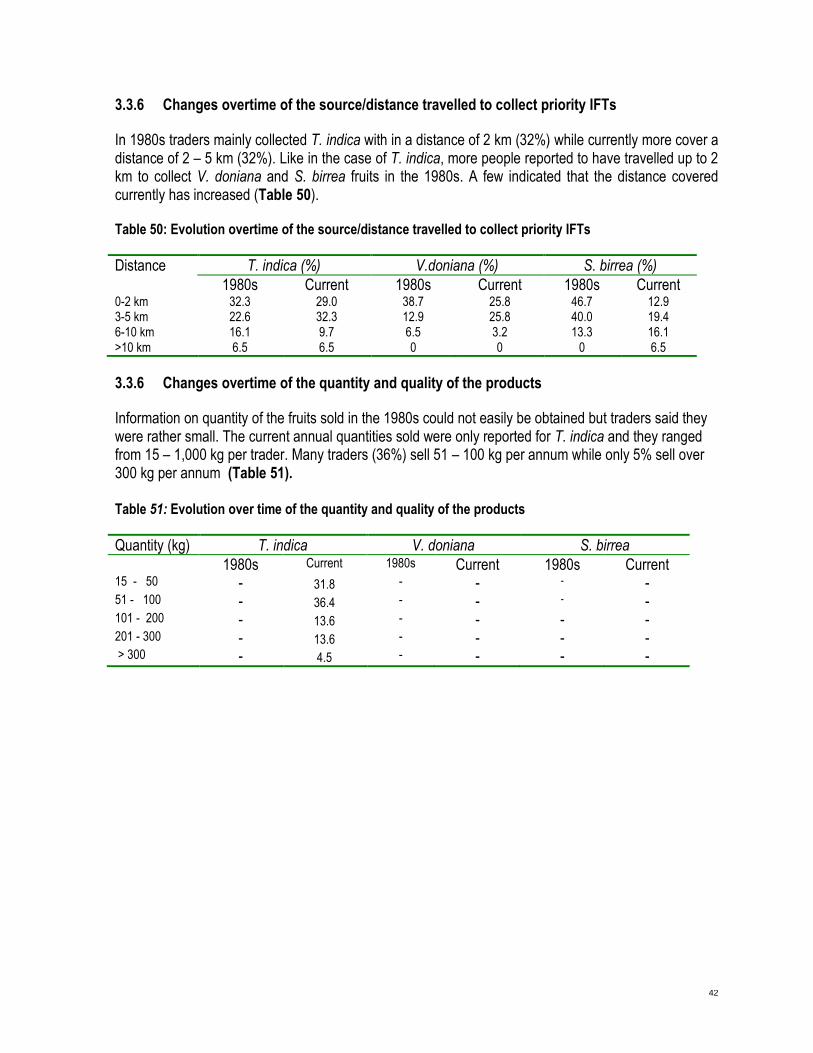
42
3.3.6 Changes overtime of the source/distance travelled to collect priority IFTs
In 1980s traders mainly collected T. indica with in a distance of 2 km (32%) while currently more cover a distance of 2 – 5 km (32%). Like in the case of T. indica, more people reported to have travelled up to 2 km to collect V. doniana and S. birrea fruits in the 1980s. A few indicated that the distance covered currently has increased (Table 50). Table 50: Evolution overtime of the source/distance travelled to collect priority IFTs
Distance T. indica (%) V.doniana (%) S. birrea (%)
1980s Current 1980s Current 1980s Current 0-2 km 32.3 29.0 38.7 25.8 46.7 12.9 3-5 km 22.6 32.3 12.9 25.8 40.0 19.4 6-10 km 16.1 9.7 6.5 3.2 13.3 16.1 >10 km 6.5 6.5 0 0 0 6.5
3.3.6 Changes overtime of the quantity and quality of the products
Information on quantity of the fruits sold in the 1980s could not easily be obtained but traders said they were rather small. The current annual quantities sold were only reported for T. indica and they ranged from 15 – 1,000 kg per trader. Many traders (36%) sell 51 – 100 kg per annum while only 5% sell over 300 kg per annum (Table 51). Table 51: Evolution over time of the quantity and quality of the products
Quantity (kg) T. indica V. doniana S. birrea
1980s Current 1980s Current 1980s Current 15 - 50 - 31.8 - - - - 51 - 100 - 36.4 - - - - 101 - 200 - 13.6 - - - - 201 - 300 - 13.6 - - - - > 300 - 4.5 - - - -
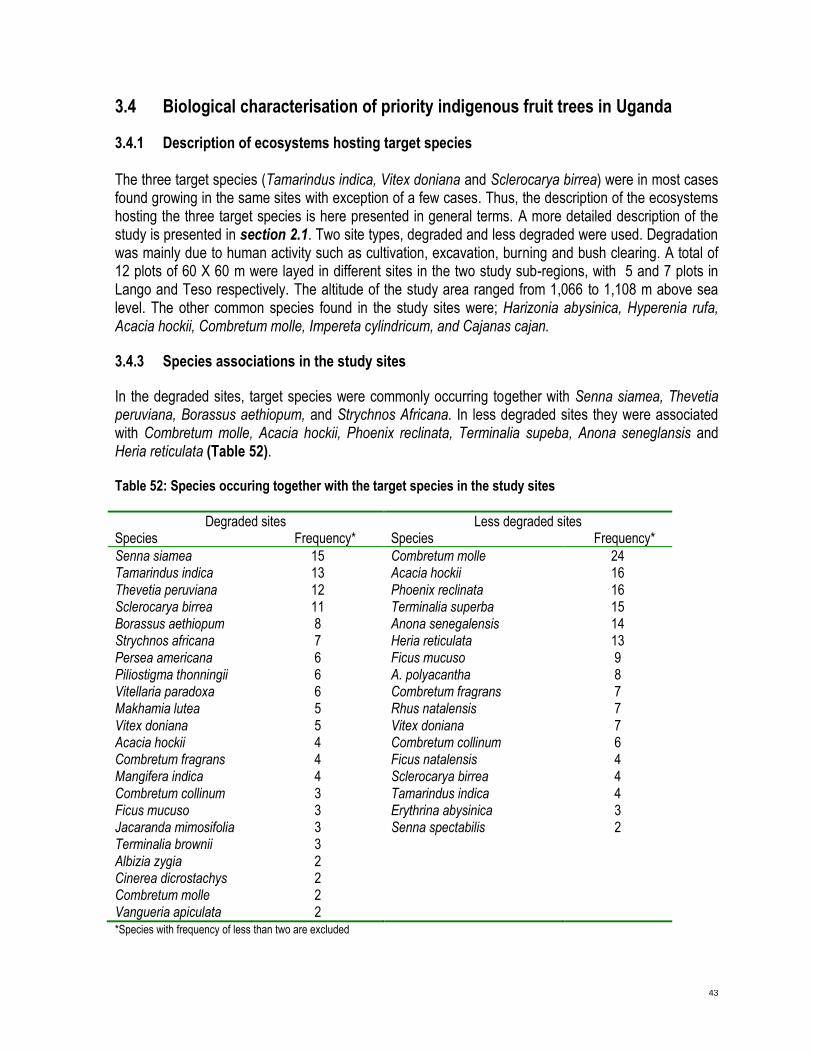
43
3.4 Biological characterisation of priority indigenous fruit trees in Uganda
3.4.1 Description of ecosystems hosting target species The three target species (Tamarindus indica, Vitex doniana and Sclerocarya birrea) were in most cases found growing in the same sites with exception of a few cases. Thus, the description of the ecosystems hosting the three target species is here presented in general terms. A more detailed description of the study is presented in section 2.1. Two site types, degraded and less degraded were used. Degradation was mainly due to human activity such as cultivation, excavation, burning and bush clearing. A total of 12 plots of 60 X 60 m were layed in different sites in the two study sub-regions, with 5 and 7 plots in Lango and Teso respectively. The altitude of the study area ranged from 1,066 to 1,108 m above sea level. The other common species found in the study sites were; Harizonia abysinica, Hyperenia rufa, Acacia hockii, Combretum molle, Impereta cylindricum, and Cajanas cajan.
3.4.3 Species associations in the study sites
In the degraded sites, target species were commonly occurring together with Senna siamea, Thevetia peruviana, Borassus aethiopum, and Strychnos Africana. In less degraded sites they were associated with Combretum molle, Acacia hockii, Phoenix reclinata, Terminalia supeba, Anona seneglansis and Heria reticulata (Table 52). Table 52: Species occuring together with the target species in the study sites
Degraded sites Species Frequency*
Less degraded sites Species Frequency*
Senna siamea 15 Combretum molle 24 Tamarindus indica 13 Acacia hockii 16 Thevetia peruviana 12 Phoenix reclinata 16 Sclerocarya birrea 11 Terminalia superba 15 Borassus aethiopum 8 Anona senegalensis 14 Strychnos africana 7 Heria reticulata 13 Persea americana 6 Ficus mucuso 9 Piliostigma thonningii 6 A. polyacantha 8 Vitellaria paradoxa 6 Combretum fragrans 7 Makhamia lutea 5 Rhus natalensis 7 Vitex doniana 5 Vitex doniana 7 Acacia hockii 4 Combretum collinum 6 Combretum fragrans 4 Ficus natalensis 4 Mangifera indica 4 Sclerocarya birrea 4 Combretum collinum 3 Tamarindus indica 4 Ficus mucuso 3 Erythrina abysinica 3 Jacaranda mimosifolia 3 Senna spectabilis 2 Terminalia brownii 3 Albizia zygia 2 Cinerea dicrostachys 2 Combretum molle 2 Vangueria apiculata 2 *Species with frequency of less than two are excluded

44
3.4.4 Richness and species diversity indices of the degraded and less degraded sites
Up to 40 different tree species were encountered in the nine degraded plots (3.24 ha) inventoried. Only 17 tree species were found in the three less degraded plots (1.08 ha). Tree species diversity was generally high in both site categories (Tables 53 and 54). However the diversity in degraded site was higher (H’ = 3.099) than that of the less degraded site (H’ = 2.472). And tree species were generally evenly distributed in both degraded and less degraded sites. Evenness, however, varied between the two sites with degraded and less degraded sites having J = 0.902 and 0.891 respectively. In degraded sites, Acacia hockii, Vitex doniana and Combretum molle were the most dominant species (d = 0.123, 0.116 and 0.073) respectively. In the less degraded sites however, Phoenix reclinata, Vitex doniana and Acacia hockii were the most abundant species (d = 0.190, 0.155 and 0.140) respectively (Tables 53 and 54).

45
Table 53: Tree Species richness, diversity and evenness in degraded sites
Species Trees (Freq)
Regeneration (Freq)
pi lnpi pi*lnpi H/lnS
Acacia hockii 4 37 0.123 -2.096 -0.258 0.075
Acacia petersiana 1 4 0.013 -4.321 -0.057 0.017
Albizia coriaria 1 0 0.000 0.000 0.000 0.000
Albizia zygia 2 4 0.013 -4.321 -0.057 0.017
Allophyllus africana 0 7 0.023 -3.761 -0.087 0.025
Annona seneglansis 0 7 0.023 -3.761 -0.087 0.025
Balanites aegyptiaca 1 0 0.000 0.000 0.000 0.000
Borassus aethiopum 8 6 0.020 -3.915 -0.078 0.023
Camiphora africana 0 2 0.007 -5.014 -0.033 0.010
Cinerea dicrostachys 2 18 0.060 -2.817 -0.168 0.049
Combretum collinum 3 1 0.003 -5.707 -0.019 0.006
Combretum fragrans 4 19 0.063 -2.763 -0.174 0.051
Combretum molle 2 22 0.073 -2.616 -0.191 0.056
Cussonia arborea 0 4 0.013 -4.321 -0.057 0.017
Ficus mucuso 3 0 0.000 0.000 0.000 0.000
Ficus natalensis 1 2 0.007 -5.014 -0.033 0.010
Grewia trichocarpa 0 2 0.007 -5.014 -0.033 0.010
Heria reticulata 0 5 0.017 -4.098 -0.068 0.020
Jacaranda mimosifolia 3 0 0.000 0.000 0.000 0.000
Makhamia lutea 5 0 0.000 0.000 0.000 0.000
Mangifera indica 4 0 0.000 0.000 0.000 0.000
Melia volkensii 1 0 0.000 0.000 0.000 0.000
Persea americana 6 18 0.060 -2.817 -0.168 0.049
Piliostigma thonningii 6 8 0.027 -3.628 -0.096 0.028
Pseudocedrela kotschyi 0 5 0.017 -4.098 -0.068 0.020
Rhus vulgaris 0 8 0.027 -3.628 -0.096 0.028
Sclerocarya birrea 11 7 0.023 -3.761 -0.087 0.025
Securinega virosa 0 4 0.013 -4.321 -0.057 0.017
Senna siamea 15 10 0.033 -3.405 -0.113 0.033
Stereospermum kunthianum 0 4 0.013 -4.321 -0.057 0.017
Strychnos africana 7 10 0.033 -3.405 -0.113 0.033
Tamarindus indica 13 5 0.017 -4.098 -0.068 0.020
Terminalia brownii 3 6 0.020 -3.915 -0.078 0.023
Terminalia macroptera 0 8 0.027 -3.628 -0.096 0.028
Thevetia peruviana 12 8 0.027 -3.628 -0.096 0.028
Vitellaria paradoxa 6 20 0.066 -2.711 -0.180 0.052
Vangueria apiculata 2 0 0.000 0.000 0.000 0.000
Vitex doniana 5 35 0.116 -2.152 -0.250 0.073
Zizyphus abysinica 0 5 0.017 -4.098 -0.068 0.020
S (trees and regenerates) = 40; S (regenerates) = 31 (used)
131 301 H‟ = −(∑(ρilnρi) = 3.099; d= Nmax/N =0.123; J’=H/lnS=0.902
* Number of regenerates was used to calculate the indices. Area sampled = 3.24 ha

46
Table 54: Tree Species richness, diversity and evenness in the less degraded sites
Species Trees (Freq)
Regeneration (Freq)
pi lnpi pi*lnpi H/lnS
Acacia hockii 16 28 0.140 -1.966 -0.275 0.099
Acacia polyacantha 8 3 0.015 -4.200 -0.063 0.023
Annona seneglansis 14 10 0.050 -2.996 -0.150 0.054
Combretum collinum 6 17 0.085 -2.465 -0.210 0.076
Combretum fragrans 7 3 0.015 -4.200 -0.063 0.023
Combretum molle 24 11 0.055 -2.900 -0.160 0.058
Erythrina abysinica 3 7 0.035 -3.352 -0.117 0.042
Ficus mucuso 9 0 0.000 0.000 0.000 0.000
Ficus natalensis 4 7 0.035 -3.352 -0.117 0.042
Heria reticulata 13 11 0.055 -2.900 -0.160 0.058
Phoenix reclinata 16 38 0.190 -1.661 -0.316 0.114
Rhus natalensis 7 11 0.055 -2.900 -0.160 0.058
Sclerocarya birrea 4 2 0.010 -4.605 -0.046 0.017
Senna spectabilis 2 6 0.030 -3.507 -0.105 0.038
Tamarindus indica 4 5 0.025 -3.689 -0.092 0.033
Terminalia spp 15 10 0.050 -2.996 -0.150 0.054
Vitex doniana 7 31 0.155 -1.864 -0.289 0.104
S (trees and regenerates) = 17; S (regenerates) = 16 (used)
159 200 H‟ = −(∑(ρilnρi) = 2.472; d = Nmax/N =0.190; J‟=H/lnS=0.891
* Number of regenerates was used to calculate the indices. Area sampled = 1.08 ha
3.4.5 Distribution of the target tree species in the study sites The evenness of the target species was generally low (Table 55). Trees were more evenly distributed in degraded than less degraded sites. Their regenerates however, were more evenly distributed in the less degraded than degraded sites. In both site categories, V. doniana was the most evenly distributed (Table 55). Table 55: Distribution of target species in degraded and less degraded habitats
Species
Evenness (J‟) in degraded sites Trees Regenerates
Evenness (J‟) in less degraded sites Trees Regenerates
Tamarindus indica 0.063 0.020 0.033 0.033
Vitex doniana 0.038 0.073 0.049 0.104
Sclerocarya birrea 0.069 0.025 0.033 0.017
3.4.6 Target species abundance
The most abundant target species was V. doniana, followed by S. birrea and T. indica. Although the regenerates of target IFTs were generally more abundant than trees in less degraded sites, the reverse trend was observed in the degraded sites (Table 56).

47
Table 56: Target species abundance
Species Abundance (d) in degraded sits Trees Regenerates
Abundance (d) in less degraded Trees Regenerates
Tamarindus indica 0.084 0.017 0.025 0.025 Vitex doniana 0.038 0.116 0.044 0.155 Sclerocarya birrea 0.099 0.023 0.025 0.010
3.4.7 Target species density in degraded and less degraded habitat
Vitex doniana had the highest number of stems per hectare in both study sites, this was followed by T. indica while S. birrea had the least. Less degraded sites had higher tree densities than the degraded ones. However, an opposite trend was observed for the regenerates (Table 57).
Table 57: Target species density in degraded and less degraded habitat
Species Density in degraded area (3.42 ha)
Trees/ha Regenerates/ha
Density in less degraded area (1.08 ha) Regenerates/ha Regenerates/ha
Density in total area (4.5 ha) Trees/ha Regenerates /ha
T. indica 3.8 1.5 3.7 4.6 3.8 2.2 V. doniana 1.5 3.2 6.5 28.7 2.7 9.3 S. birrea 3.2 1.5 3.7 1.9 3.3 1.6
3.4.8 Diameter class distribution for target species
In the degraded habitants, T. indica and S. birrea had no trees in the low diameter size clss (10 – 20 cm). Vitex doniana was represented in diameter classes of 10 -20, 21 – 30 and 41 – 50 cm but in low numbers (less than 3 trees) in all cases. Termarindus indica trees generally had bigger dbh (30 - > 50 cm) however those with dbh 41 – 50 cm dominated the degraded site. Scerocarya birrea were also bigger in diameter having more trees with dbh > 50 cm. On the other hand, V.doniana trees were rather with small diameters ranging from 10 to 50 cm (Figure 12). In the less degraded habitats however, V. doniana had only larger diameter trees (41 to > 50 cm) (Figure 13).
0
1
2
3
4
5
6
7
8
10 - 20 21 - 30 31 - 40 41 - 50 >50
Diameter class (cm)
Num
ber o
f tre
es
T. indica
V. doniana
S. birrea
Fig 12: Diameter class distribution in degraded habitants
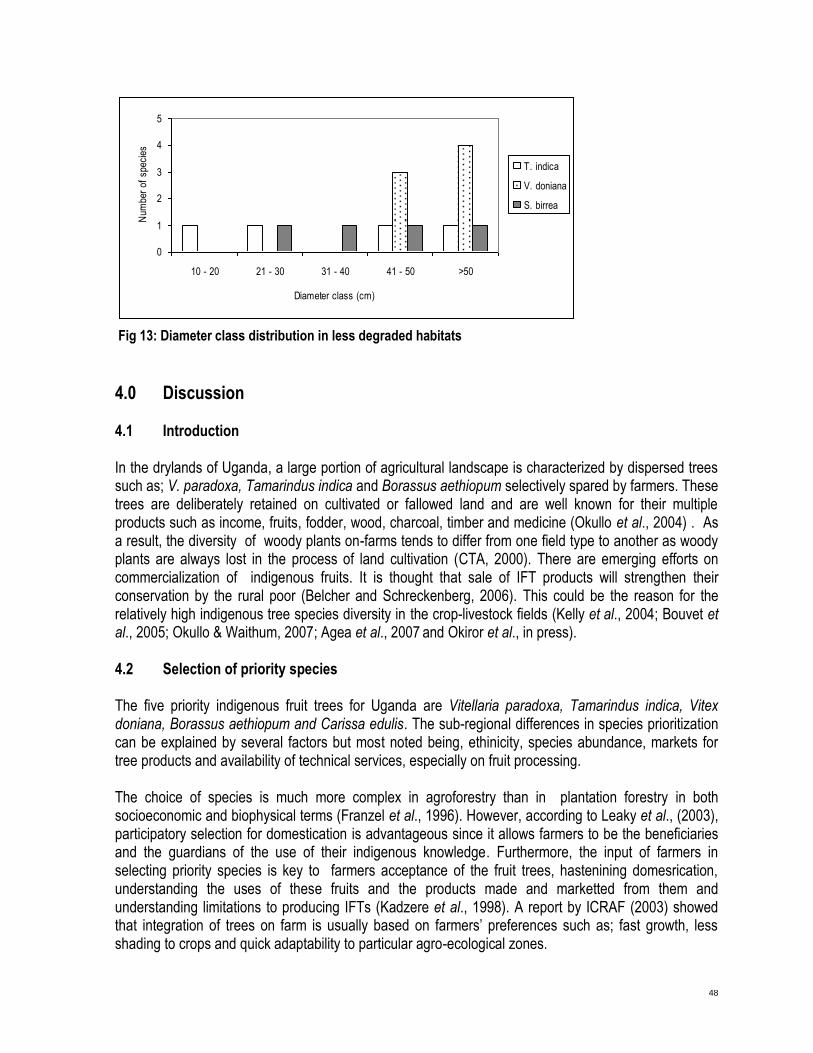
48
0
1
2
3
4
5
10 - 20 21 - 30 31 - 40 41 - 50 >50
Diameter class (cm)
Num
ber
of s
peci
es
T. indica
V. doniana
S. birrea
Fig 13: Diameter class distribution in less degraded habitats
4.0 Discussion 4.1 Introduction In the drylands of Uganda, a large portion of agricultural landscape is characterized by dispersed trees such as; V. paradoxa, Tamarindus indica and Borassus aethiopum selectively spared by farmers. These trees are deliberately retained on cultivated or fallowed land and are well known for their multiple products such as income, fruits, fodder, wood, charcoal, timber and medicine (Okullo et al., 2004) . As a result, the diversity of woody plants on-farms tends to differ from one field type to another as woody plants are always lost in the process of land cultivation (CTA, 2000). There are emerging efforts on commercialization of indigenous fruits. It is thought that sale of IFT products will strengthen their conservation by the rural poor (Belcher and Schreckenberg, 2006). This could be the reason for the relatively high indigenous tree species diversity in the crop-livestock fields (Kelly et al., 2004; Bouvet et al., 2005; Okullo & Waithum, 2007; Agea et al., 2007 and Okiror et al., in press). 4.2 Selection of priority species The five priority indigenous fruit trees for Uganda are Vitellaria paradoxa, Tamarindus indica, Vitex doniana, Borassus aethiopum and Carissa edulis. The sub-regional differences in species prioritization can be explained by several factors but most noted being, ethinicity, species abundance, markets for tree products and availability of technical services, especially on fruit processing. The choice of species is much more complex in agroforestry than in plantation forestry in both socioeconomic and biophysical terms (Franzel et al., 1996). However, according to Leaky et al., (2003), participatory selection for domestication is advantageous since it allows farmers to be the beneficiaries and the guardians of the use of their indigenous knowledge. Furthermore, the input of farmers in selecting priority species is key to farmers acceptance of the fruit trees, hastenining domesrication, understanding the uses of these fruits and the products made and marketted from them and understanding limitations to producing IFTs (Kadzere et al., 1998). A report by ICRAF (2003) showed that integration of trees on farm is usually based on farmers‟ preferences such as; fast growth, less shading to crops and quick adaptability to particular agro-ecological zones.
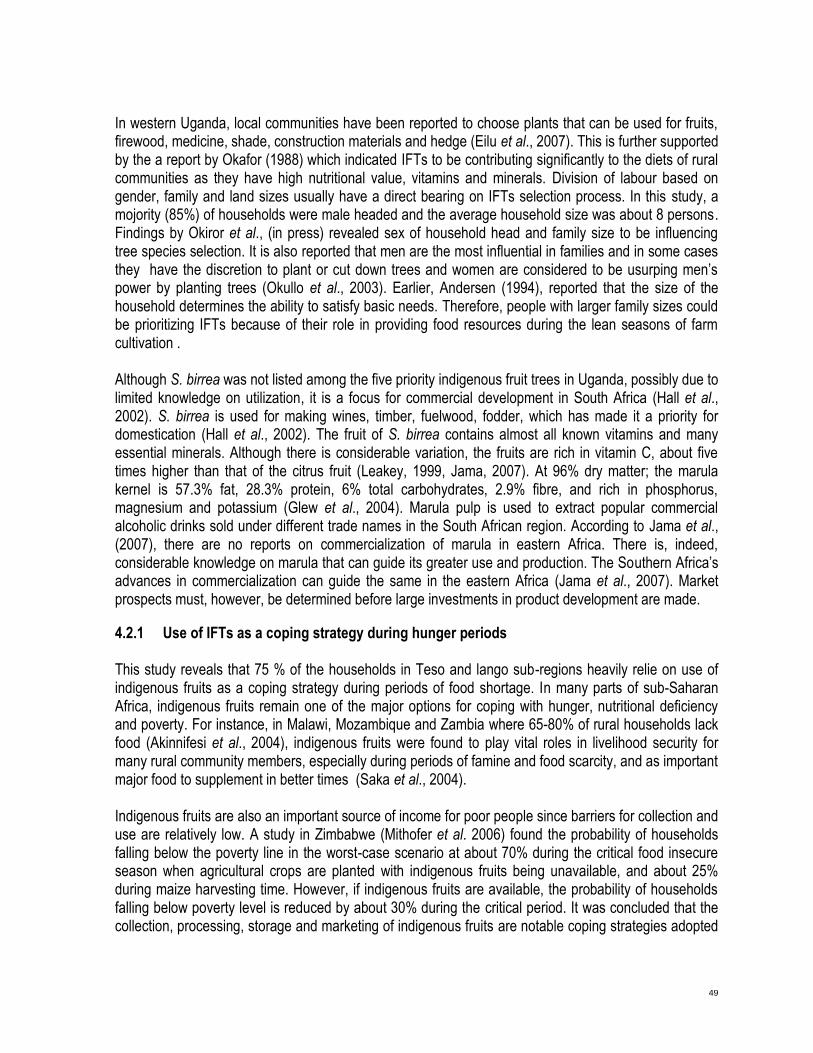
49
In western Uganda, local communities have been reported to choose plants that can be used for fruits, firewood, medicine, shade, construction materials and hedge (Eilu et al., 2007). This is further supported by the a report by Okafor (1988) which indicated IFTs to be contributing significantly to the diets of rural communities as they have high nutritional value, vitamins and minerals. Division of labour based on gender, family and land sizes usually have a direct bearing on IFTs selection process. In this study, a mojority (85%) of households were male headed and the average household size was about 8 persons. Findings by Okiror et al., (in press) revealed sex of household head and family size to be influencing tree species selection. It is also reported that men are the most influential in families and in some cases they have the discretion to plant or cut down trees and women are considered to be usurping men‟s power by planting trees (Okullo et al., 2003). Earlier, Andersen (1994), reported that the size of the household determines the ability to satisfy basic needs. Therefore, people with larger family sizes could be prioritizing IFTs because of their role in providing food resources during the lean seasons of farm cultivation . Although S. birrea was not listed among the five priority indigenous fruit trees in Uganda, possibly due to limited knowledge on utilization, it is a focus for commercial development in South Africa (Hall et al., 2002). S. birrea is used for making wines, timber, fuelwood, fodder, which has made it a priority for domestication (Hall et al., 2002). The fruit of S. birrea contains almost all known vitamins and many essential minerals. Although there is considerable variation, the fruits are rich in vitamin C, about five times higher than that of the citrus fruit (Leakey, 1999, Jama, 2007). At 96% dry matter; the marula kernel is 57.3% fat, 28.3% protein, 6% total carbohydrates, 2.9% fibre, and rich in phosphorus, magnesium and potassium (Glew et al., 2004). Marula pulp is used to extract popular commercial alcoholic drinks sold under different trade names in the South African region. According to Jama et al., (2007), there are no reports on commercialization of marula in eastern Africa. There is, indeed, considerable knowledge on marula that can guide its greater use and production. The Southern Africa‟s advances in commercialization can guide the same in the eastern Africa (Jama et al., 2007). Market prospects must, however, be determined before large investments in product development are made.
4.2.1 Use of IFTs as a coping strategy during hunger periods This study reveals that 75 % of the households in Teso and lango sub-regions heavily relie on use of indigenous fruits as a coping strategy during periods of food shortage. In many parts of sub-Saharan Africa, indigenous fruits remain one of the major options for coping with hunger, nutritional deficiency and poverty. For instance, in Malawi, Mozambique and Zambia where 65-80% of rural households lack food (Akinnifesi et al., 2004), indigenous fruits were found to play vital roles in livelihood security for many rural community members, especially during periods of famine and food scarcity, and as important major food to supplement in better times (Saka et al., 2004). Indigenous fruits are also an important source of income for poor people since barriers for collection and use are relatively low. A study in Zimbabwe (Mithofer et al. 2006) found the probability of households falling below the poverty line in the worst-case scenario at about 70% during the critical food insecure season when agricultural crops are planted with indigenous fruits being unavailable, and about 25% during maize harvesting time. However, if indigenous fruits are available, the probability of households falling below poverty level is reduced by about 30% during the critical period. It was concluded that the collection, processing, storage and marketing of indigenous fruits are notable coping strategies adopted
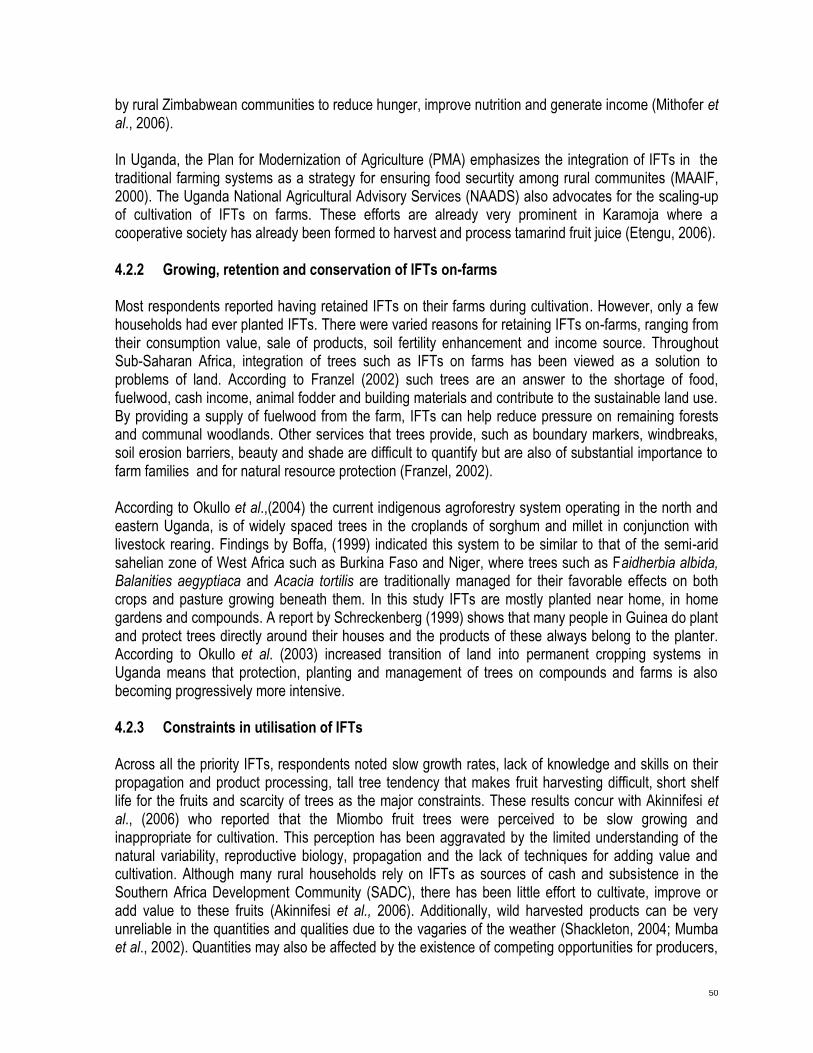
50
by rural Zimbabwean communities to reduce hunger, improve nutrition and generate income (Mithofer et al., 2006). In Uganda, the Plan for Modernization of Agriculture (PMA) emphasizes the integration of IFTs in the traditional farming systems as a strategy for ensuring food securtity among rural communites (MAAIF, 2000). The Uganda National Agricultural Advisory Services (NAADS) also advocates for the scaling-up of cultivation of IFTs on farms. These efforts are already very prominent in Karamoja where a cooperative society has already been formed to harvest and process tamarind fruit juice (Etengu, 2006). 4.2.2 Growing, retention and conservation of IFTs on-farms Most respondents reported having retained IFTs on their farms during cultivation. However, only a few households had ever planted IFTs. There were varied reasons for retaining IFTs on-farms, ranging from their consumption value, sale of products, soil fertility enhancement and income source. Throughout Sub-Saharan Africa, integration of trees such as IFTs on farms has been viewed as a solution to problems of land. According to Franzel (2002) such trees are an answer to the shortage of food, fuelwood, cash income, animal fodder and building materials and contribute to the sustainable land use. By providing a supply of fuelwood from the farm, IFTs can help reduce pressure on remaining forests and communal woodlands. Other services that trees provide, such as boundary markers, windbreaks, soil erosion barriers, beauty and shade are difficult to quantify but are also of substantial importance to farm families and for natural resource protection (Franzel, 2002). According to Okullo et al.,(2004) the current indigenous agroforestry system operating in the north and eastern Uganda, is of widely spaced trees in the croplands of sorghum and millet in conjunction with livestock rearing. Findings by Boffa, (1999) indicated this system to be similar to that of the semi-arid sahelian zone of West Africa such as Burkina Faso and Niger, where trees such as Faidherbia albida, Balanities aegyptiaca and Acacia tortilis are traditionally managed for their favorable effects on both crops and pasture growing beneath them. In this study IFTs are mostly planted near home, in home gardens and compounds. A report by Schreckenberg (1999) shows that many people in Guinea do plant and protect trees directly around their houses and the products of these always belong to the planter. According to Okullo et al. (2003) increased transition of land into permanent cropping systems in Uganda means that protection, planting and management of trees on compounds and farms is also becoming progressively more intensive. 4.2.3 Constraints in utilisation of IFTs Across all the priority IFTs, respondents noted slow growth rates, lack of knowledge and skills on their propagation and product processing, tall tree tendency that makes fruit harvesting difficult, short shelf life for the fruits and scarcity of trees as the major constraints. These results concur with Akinnifesi et al., (2006) who reported that the Miombo fruit trees were perceived to be slow growing and inappropriate for cultivation. This perception has been aggravated by the limited understanding of the natural variability, reproductive biology, propagation and the lack of techniques for adding value and cultivation. Although many rural households rely on IFTs as sources of cash and subsistence in the Southern Africa Development Community (SADC), there has been little effort to cultivate, improve or add value to these fruits (Akinnifesi et al., 2006). Additionally, wild harvested products can be very unreliable in the quantities and qualities due to the vagaries of the weather (Shackleton, 2004; Mumba et al., 2002). Quantities may also be affected by the existence of competing opportunities for producers,
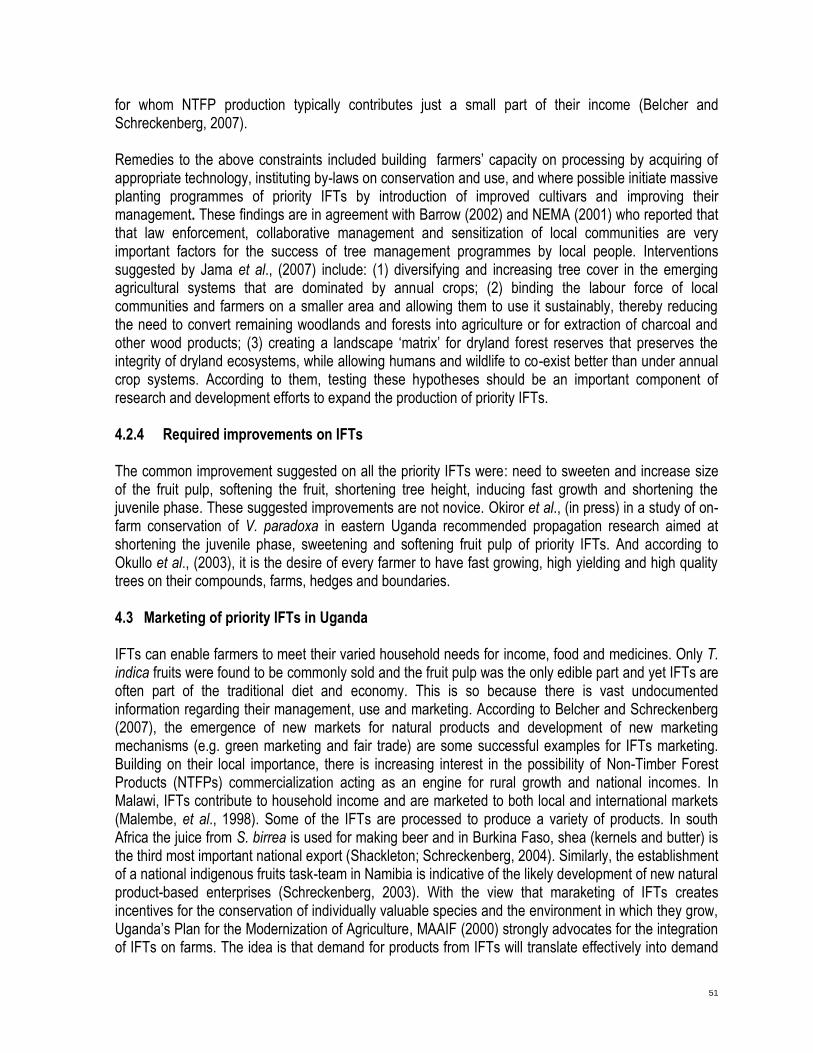
51
for whom NTFP production typically contributes just a small part of their income (Belcher and Schreckenberg, 2007). Remedies to the above constraints included building farmers‟ capacity on processing by acquiring of appropriate technology, instituting by-laws on conservation and use, and where possible initiate massive planting programmes of priority IFTs by introduction of improved cultivars and improving their management. These findings are in agreement with Barrow (2002) and NEMA (2001) who reported that that law enforcement, collaborative management and sensitization of local communities are very important factors for the success of tree management programmes by local people. Interventions suggested by Jama et al., (2007) include: (1) diversifying and increasing tree cover in the emerging agricultural systems that are dominated by annual crops; (2) binding the labour force of local communities and farmers on a smaller area and allowing them to use it sustainably, thereby reducing the need to convert remaining woodlands and forests into agriculture or for extraction of charcoal and other wood products; (3) creating a landscape „matrix‟ for dryland forest reserves that preserves the integrity of dryland ecosystems, while allowing humans and wildlife to co-exist better than under annual crop systems. According to them, testing these hypotheses should be an important component of research and development efforts to expand the production of priority IFTs. 4.2.4 Required improvements on IFTs The common improvement suggested on all the priority IFTs were: need to sweeten and increase size of the fruit pulp, softening the fruit, shortening tree height, inducing fast growth and shortening the juvenile phase. These suggested improvements are not novice. Okiror et al., (in press) in a study of on-farm conservation of V. paradoxa in eastern Uganda recommended propagation research aimed at shortening the juvenile phase, sweetening and softening fruit pulp of priority IFTs. And according to Okullo et al., (2003), it is the desire of every farmer to have fast growing, high yielding and high quality trees on their compounds, farms, hedges and boundaries. 4.3 Marketing of priority IFTs in Uganda IFTs can enable farmers to meet their varied household needs for income, food and medicines. Only T. indica fruits were found to be commonly sold and the fruit pulp was the only edible part and yet IFTs are often part of the traditional diet and economy. This is so because there is vast undocumented information regarding their management, use and marketing. According to Belcher and Schreckenberg (2007), the emergence of new markets for natural products and development of new marketing mechanisms (e.g. green marketing and fair trade) are some successful examples for IFTs marketing. Building on their local importance, there is increasing interest in the possibility of Non-Timber Forest Products (NTFPs) commercialization acting as an engine for rural growth and national incomes. In Malawi, IFTs contribute to household income and are marketed to both local and international markets (Malembe, et al., 1998). Some of the IFTs are processed to produce a variety of products. In south Africa the juice from S. birrea is used for making beer and in Burkina Faso, shea (kernels and butter) is the third most important national export (Shackleton; Schreckenberg, 2004). Similarly, the establishment of a national indigenous fruits task-team in Namibia is indicative of the likely development of new natural product-based enterprises (Schreckenberg, 2003). With the view that maraketing of IFTs creates incentives for the conservation of individually valuable species and the environment in which they grow, Uganda‟s Plan for the Modernization of Agriculture, MAAIF (2000) strongly advocates for the integration of IFTs on farms. The idea is that demand for products from IFTs will translate effectively into demand
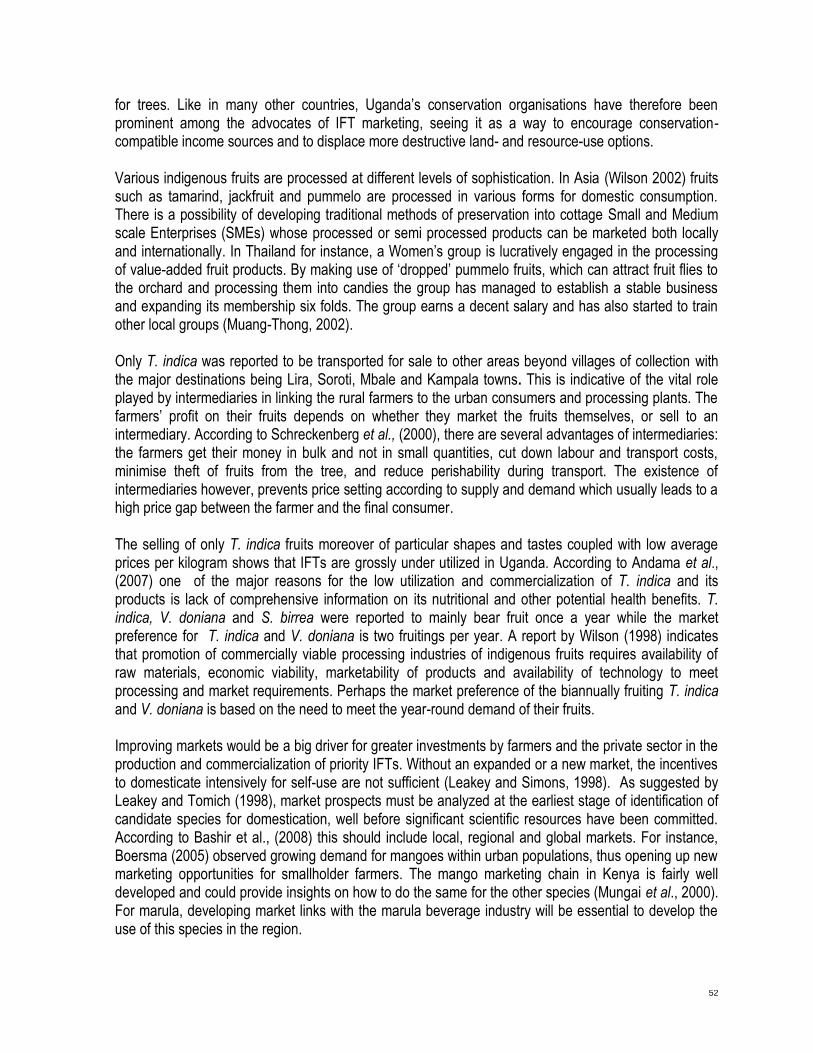
52
for trees. Like in many other countries, Uganda‟s conservation organisations have therefore been prominent among the advocates of IFT marketing, seeing it as a way to encourage conservation-compatible income sources and to displace more destructive land- and resource-use options. Various indigenous fruits are processed at different levels of sophistication. In Asia (Wilson 2002) fruits such as tamarind, jackfruit and pummelo are processed in various forms for domestic consumption. There is a possibility of developing traditional methods of preservation into cottage Small and Medium scale Enterprises (SMEs) whose processed or semi processed products can be marketed both locally and internationally. In Thailand for instance, a Women‟s group is lucratively engaged in the processing of value-added fruit products. By making use of „dropped‟ pummelo fruits, which can attract fruit flies to the orchard and processing them into candies the group has managed to establish a stable business and expanding its membership six folds. The group earns a decent salary and has also started to train other local groups (Muang-Thong, 2002). Only T. indica was reported to be transported for sale to other areas beyond villages of collection with the major destinations being Lira, Soroti, Mbale and Kampala towns. This is indicative of the vital role played by intermediaries in linking the rural farmers to the urban consumers and processing plants. The farmers‟ profit on their fruits depends on whether they market the fruits themselves, or sell to an intermediary. According to Schreckenberg et al., (2000), there are several advantages of intermediaries: the farmers get their money in bulk and not in small quantities, cut down labour and transport costs, minimise theft of fruits from the tree, and reduce perishability during transport. The existence of intermediaries however, prevents price setting according to supply and demand which usually leads to a high price gap between the farmer and the final consumer. The selling of only T. indica fruits moreover of particular shapes and tastes coupled with low average prices per kilogram shows that IFTs are grossly under utilized in Uganda. According to Andama et al., (2007) one of the major reasons for the low utilization and commercialization of T. indica and its products is lack of comprehensive information on its nutritional and other potential health benefits. T. indica, V. doniana and S. birrea were reported to mainly bear fruit once a year while the market preference for T. indica and V. doniana is two fruitings per year. A report by Wilson (1998) indicates that promotion of commercially viable processing industries of indigenous fruits requires availability of raw materials, economic viability, marketability of products and availability of technology to meet processing and market requirements. Perhaps the market preference of the biannually fruiting T. indica and V. doniana is based on the need to meet the year-round demand of their fruits. Improving markets would be a big driver for greater investments by farmers and the private sector in the production and commercialization of priority IFTs. Without an expanded or a new market, the incentives to domesticate intensively for self-use are not sufficient (Leakey and Simons, 1998). As suggested by Leakey and Tomich (1998), market prospects must be analyzed at the earliest stage of identification of candidate species for domestication, well before significant scientific resources have been committed. According to Bashir et al., (2008) this should include local, regional and global markets. For instance, Boersma (2005) observed growing demand for mangoes within urban populations, thus opening up new marketing opportunities for smallholder farmers. The mango marketing chain in Kenya is fairly well developed and could provide insights on how to do the same for the other species (Mungai et al., 2000). For marula, developing market links with the marula beverage industry will be essential to develop the use of this species in the region.

53
4.4 Threats to priority IFTs in Uganda Trade in fruits was reported to have started in the 1980‟s and the most traded fruits were V. paradoxa and T. indica. The increasing distance covered to collect the formally abundant IFT fruits means that scarcity is setting in. According to NEMA (2001) biodiversity conservation on land used for agricultural purposes poses greatest challenges in the tropics where rapid population growth, unplanned settlement and fragmentation destroy fragile habitats and reduce plant species richness and abundance. Additionally, a report by Malembo et al., (1998) indicates that several fruit species that had once been abundant are becoming scarce due to destructive methods of fruit harvesting, defforestation, firewood harvesting, fencing and construction. In South Africa, Akinnifesi et al., (2006) found deforestation and increasing population to be causing the miombo forests of southern Africa to recede, with serious consequences on the availability of wild fruits, medicinal plants and other plant products. This is exposing the most vulnerable segment of the communities, the aged, the poor, women and children, to malnutrition and reduced income, as traditionally their livelihoods partly depend on forest products. The trend taken by IFTs in Uganda, is not any different. Their abundance is greatly decreasing due to man‟s activities such as charcoal burning and indiscriminate bush burning, constant grazing and land clearance for cultivation (Okullo & Waithum, 2007). Despite these challenges, biodiversity conservation must include landscapes used for farming and pastoralism (Eilu et al., 2007). 4.5 Species biological characterisation Forty and seventeen different tree species were encountered in the degraded and less degraded habitats respectively. This difference in tree species numbers could be due to the fact that the number of degraded plots inventoried was twice that of the less degraded sites. Tree species diversity and evenness was generally high in both site categories. These results concur with Agea et al., (2007); Okullo and Waithum (2007) who found relatively high tree species diversities in Lira and Nebbi districts respectively. The high diversities could be a result of the favourable climatic factors and increased resilience of species to habitat dynamics such as seasonal fires and drought (Agea et al., 2005). There could also be interdependence and co-evolution in that other species may increase the reproductive success of all their members by attracting pollinators while another may produce a noxious chemical that protects all of them from herbivores (Agea et al., 2005). The diversity and evenness in degraded sites were higher (H’ = 3.099 and J = 0.902 respectively) than those of the less degraded sites (H’ = 2.472 and J = 0.891 respectively). This was contrary to studies by Eilu et al., (2004) and Agea et al., (2007) which indicated degraded habitats to be less diverse because of continuous cultivation, fuelwood and charcoal burning and prolonged drought. Such factors usually cause habitat degradation and threaten tree survival. A report by CTA (2000) also indicated the diversity of woody plants to be varying from one field type to another. Further assessment of similar sites by Okullo and Waithum (2007), revealed a likely correlation between on-farm woody plant diversity and farmers‟ occupation, farm size and the period over which fields have been under cultivation.
Generally, V. doniana had the highest number of stems per hectare in both study sites, followed by T. indica and S. birrea. This trend could be a direct effect of the prefenrential retentioon of IFTs by farmers during land clearance for cultivation. Related studies by Agea et al., (2007) in Lira district also indicated V. doniana to be more abundant than T. indica. The roots, bark and leaves of V. doniana were noted to
54
be used in the treatment of colvulsions, abdominal pain and diarrhoea besides providing edible fruit pulp. This put V. doniana a head of T. indica and S. birrea in the prefence ranking in one of the sub-counties in Lira district (Agea et al., 2007). Less degraded sites had more trees but less regeneration of the three IFTs than in the degraded habitats. There is likely to be less presure (tree cutting, cultivation and charcoal burning) exerted by local communities on trees in less degaraded than degraded sites leading to high tree densities of V. doniana, T. indica and S. birrea. While degraded sites could be offering favourable conditions like sun light and space for the germination hence higher densities of regenerates of the target IFTs in degraded than in less less degraded sites. A report by Denslow (1987) indicates that most species have some degree of shade tolerance but may also respond positively to canopy opening leading to advance in regeneration. 5.0 Conclusion The major findings on the IFTs study in Uganda are;
(i) Rural communities have strong social and economic attachment to IFTs. They ranked Vitellaria paradoxa, Tamarindus indica, Vitex doniana, Borassus aethiopum and Carissa edulis as the five priority indigenous fruit trees for Uganda.
(ii) A majority use IFTs as alternative or complementary food source. Fruits commonly used during months of food shortage include; V. paradoxa, T. indica, C. edullis and V. doniana . Indigenous fruits are mainly use as food (fruit), oil extraction (kernnel), juice, local brew and spices.
(iii) IFTs are retained on farms during cultivation for consumption, fuelwood, soil fertility enhancement and income generation among the resource poor communities.
(iv) Constraints use and growing include; slow growth rates, lack of knowledge and skills on their propagation and product processing, tall tree tendency that makes harvesting difficult,
short shelf life for the fruits and increasing scarcity of fruit trees. Suggested remedies are improvement in processing technology and instituting and instilling by-laws on their use and conservation.
(v) Suggested improvements on the priority IFTs are, need to sweeten and increase the fruit pulp size, softening the fruit, shortening tree height, inducing fast growth and shortening the juvenile phase.
(vi) Trade in fruits was reported to have started in 1980‟s and the most traded fruits were V. paradoxa and T. indica. Other fruits traded by then included; Citrus spp, Mangifera indica and Pasiflora edulis. Most of the fruits first sold were reported to have been collected mainly from rangeland and around homes.
(vii) A kilogram of T. indica fruits fetched USD 0.66. Vitex doniana and S. birrea were largely reported not to have been sold in the 1980s. However the distance covered during fruit collection and prices have continuously been on the increase indicating decreasing abundance of IFTs.
(viii) Tree species diversity and evenness was generally high. The diversity and evenness in degraded sites was higher than that of the less degraded sites. Degraded sites were dominated by Acacia hockii, Vitex doniana while less degraded sites had Phoenix reclinata and Vitex doniana as the most abundant species.

55
6.0 Recommendations Based on the above conclusions, the following recommendations are made:
a. In order to promote conservation of IFTs, bye-laws and policies on conservation need to be properly enforced in by local governments.
b. There is need for mass sensitization and mobilization of local communities, towards the sparing of regenerating IFTs during cultivation. A concerted effort by local and national governments, Non-Governmental organizations (NGOs), Community-Based Organisations (CBOs) and cultural institutions would lead to the achievement of this.
c. To promote the commercialization of viable IFTs, there is need for improvement of collection and processing methods. Improved access to necessary market information and support services including credit and subsidized agricultural equipment are also needed.
d. Efforts towards value addition to IFT products such as fruits, oil, drinks and medicine should be undertaken by the local and central government including interested NGOs and CBOs. This can greatly make rural communities to own and conserve IFTs let alone contributing to poverty alleviation.
e. More research especially on the nutritional analysis and medicinal value of indigenous fruits is very vital. The development of IFTs with shorter juvenile periods and higher yields need to be implemented by relevant agencies in Uganda in order to boost conservation efforts made by rural communities.
Acknowledgements
This study was supported by SIDA-SAREC through Africa Forestry Research Network (AFORNET). We wish to thank all the repondents who spared their valuable time to share with us their knowledge on indigenous fruit trees. We thank the other NAS implementating partners (KEFRI and TAFORI) for their valuable collaboration. We also thank Bioversity International for the technical backstopping role they have played to make the project a success.

56
References Agea, J.G., Obua, J., Namirembe, S., Buyinza, J. & Waiswa, D. 2005. Ecology and Conservation of Acacia senegal in the Rangelands of Luweero and Nakasongola Districts. Uganda Journal of Agricultural Sciences. 2005, 11: 40–46. Agea, J. G.; Obua, J.; Kaboggoza, J.R.S and Waiswa, D. 2007. Diversity of indigenous fruit trees in the traditional cotton-millet farming system: the case of Adwari subcounty, Lira district, Uganda. Afr. J. Ecol., 45 (suppl. 3), 39-43. Akinnifesi, F.K.; Kwesiga. F.; Mhango. J.; Chilanga. T.; Mkonda, a.; Kadu, c.a.c.; Kadzere, I.; Mithofer, D.; Saka J.D.K.; Sileshi, G.; Ramadhani. T. and Dhliwayo, P. 2006.towards the Development Of Miombo Fruit Trees As Commercial Tree Crops In Southern Africa. Forests, Trees and Livelihoods, 2006, Vol. 16, pp. 103–121. Akinnifesi, F.K., Chilanga, T.; Kadzere, I.; Dagmar, Mithöfer and Mkonda, A. 2005. Building opportunities for smallholder farmers to commoditize indigenous fruit trees and products in southern Africa: 1. Participatory selection, propagation and cultivation. Conference proceedings on International Agricultural Research for Development. Tropentag 2005 Stuttgart-Hohenheim, October 11-13, 2005. Akinnifesi F.K., Kwesiga F.R., Mhango J., Mkonda A., Chilanga T. and Swai R. 2004. Domesticating priority miombo indigenous fruit trees as a promising livelihood option for smallholder farmers in southrn Africa. Acta Horticulturae 632: 15-30. Andama, E.; Langole, S. and Ongeng, D. 2007. Distribution, Abundance, Phenology, Management And Processing Of Tamarindus indica LINN To Improve Community Livelihood In Northern Uganda. AICAD/RD/AE/06-01.
Andersen, H.P.1994. Local resource utilization in rural Uganda: A study of land use intensification and
landscape ecological changes in Budondo sub-county. Ressurs-og miljogeografi nr. 6. Geografisk institute,
Universitet of Oslo, Norway.
Barrow, C.J. 2002 Land Degradation. Cambridge University Press, Great Britain.
Belcher, B. and Schreckenberg, K. 2007.Commercialisation of Non-timber Forest Products: A Reality Check. Development Policy Review, 2007, 25 (3): 355-377. Boersma, T., 2005. Marketing mangos strategic advice for the World Agroforestry Centre based on a perceived quality study In the Netherlands and Kenya. Masters Thesis. University of Twente, The Netherlands. Boffa, J.M. 1999. Agroforestry parklands in Sub-Saharan Africa. FAO Conservation Guide, 34, Rome, 230 pp.
Chikamai, B., Eyong-Matig, O. & Mbogga, M. Eds. 2004. Review and Appraisal on the Status of Indigenous Fruits in Eastern Africa. A report preared for IPGRI-SAFORGEN in the framework of AFREA/FORNESSA. IPGRI, Nairobi, 152pp. CTA . 2000. Agricultural Biodiversity: The Farmer, the Planner and the Banker. CTA. Wageningen. Denslow, J. S. 1987. Tropical Rainforest Gaps and Tree species Diversity. Ann. Rev. Ecol. Syst. 1987. 18:431-51.
57
Eilu, G., Oriekot, J. & Tushabe, H. 2007. Conservation of indigenous plants outside protected areas in Tororo
District, eastern Uganda. African Journal of Ecology, Afr. J. Ecol., 45 (suppl.3), 73-78.
Eilu, G., Hafashimana D.L.N. & Kasenene, J.M. 2004. Density and species diversity of trees in four tropical forests of the Albertine rift, Western Uganda. African Journal of Ecology, Afr. J. Ecol., 42, 100-110. Etengu, N. 2006. Karamoja has amarula tree. New vision publication. Friday, 27th October, 2006. URL: http://www.newvision.co.ug/D/8/13/529011 FORRI, 2004. Determination, Propagation and Evaluation of important Trees/Shrubs with potential for Agrofororestry in Teso and Lango Farming Sysytems. NARO/DFID COARD Project No. 1024, Final Technical Report, FORRI, Kampala. 56pp. Fountain Publishers, 2005. Uganda districts information handbook: Expanded Edition 2005 – 2006. Fountain Publishers, Kampala, 182pp. Franzel, S., Jaenicke, H. & Janssen, W. 1996. Choosing the Right Trees: Setting Priorities for Multipurpose Tree Improvement. ISNAR Research Report No. 8. The Hague: International Service for National Agricultural Research. Franzel, S. & Scherr, S.J. 2002. Trees on the Farm: Assessing the Adoption and Potential of Agroforestry Practices in Africa. CABI. Wallingford. Glew, R.S., VanderJagt, D.J., Huang, Y.-S, Chuang, L.-T., Bosse, R., Glew, R.H., 2004. Nutritional analysis of the edible pit of Sclerocarya birrea in the Republic of Niger (daniya Hausa). J. Food Composition Anal. 17, 99–111. Hall, J.B., O‟Brien, E.M. and Sinclair, F.L. 2002. Sclerocarya birrea: a monograph. School of Agricultural and Forest Sciences, University of Wales, Bangor. 157 pp. ICRAF . 2003. Farmer-driven strategy in rebuilding valuable tree diversity on farms. ICRAF, Nairobi. Jama, B.A., Mohamed, A.M., Mulatya, J. and Njui A.N. 2005. The big five: harnessing the potential of dryland fruit tree species in east and central Africa for food security and poverty alleviation (In press) Jama, B.A.; Mohamed, A.M.; Mulatya, J. and Njui, A.N. (2008) Comparing the „„Big Five‟‟: A framework for the sustainable management of indigenous fruit trees in the drylands of East and Central Africa. Ecol. Indicat. 8(2):170-179. Kadzere, I., Chilanga, T. G., Tunu, R., Lungu, S., Malembo, L.N., Rukuni, D., Simwanza, P.P., Rarieya. M. and Mahembe, J. 1998. Choice of priority indigenous fruits for domestication in Southern Africa, Summary of case studies in Malawi, Tanzania, Zambia and Zimbabwe: In: Selecting indigenous fruit trees for domestication in southern Africa. Priority setting with farmers in Malawi, Tanzania, Zambia and Zimbabwe. Maghembe J.A.; Simons, A.J.; Kwesiga, F. and Rarieya, M. (Eds). Nairobi International Centre for Research in Agroforestry. Kelly B. A, Hardy, O. And Bouvet J-M. 2004. Temporal and spatial genetic structure of Vitellaria paradoxa (shea tree) in agroforestry systems in southern Mali. Molecular Ecology, 13, 1231– 1240. Leaky, R.R.B., Schreckenberg, K. and Tchoundjeu, Z. 2003. The participatory domestication of West African indigenous fruits. International Forestry Review 5(4), 338-347.

58
Leakey, R.R.B., Tomich, T.P., 1998. Domestication of tropical trees: from biology to economics and policy. In: Buck, L.E., Lassoie, J.P., Fernandez, E.C.M. (Eds.), Agroforestry in Sustainable Ecosystems. CRC Press/Lewis Publishers, New York, USA, pp. 319–338. Leakey, R.R.B., Simons, A.J., 1998. The domestication and commercialization of indigenous trees in agroforestry for the alleviation of poverty. Agroforest Syst. 38, 165–176. Leakey, R.R.B., 1999. Potential for novel food products from agrofroestry trees: a review. Food Chem. 66, 1–14.
Lovett P. N, Sanou, H., & Bouvet, J.-M. 2005. Comparison of quantitative and molecular variation in agroforestry populations of the shea tree (Vitellaria paradoxa C.F. Gaert) in Mali. Molecular Ecology 14 (8), 2601-2610. MAAIF. 2000. Plan for Modernization of Agriculture. Government Printery, Entebbe, Uganda.
Malembe, L.N.; Chilanga, T.G. and Maliwichi, C.P. 1998. Indigenous miombo fruits selected for domestication by farmers in Malawi. In: Selecting indigenous fruit trees for domestication in southern Africa. Priority setting with farmers in Malawi, Tanzania, Zambia and Zimbabwe. Maghembe J.A.; Simons, A.J.; Kwesiga, F. and Rarieya, M. (Eds). Nairobi International Centre for Research in Agroforestry. Mithofer D., Waibel H. & Akinnifesi F.K. 2006. The role of food from natural resources in reducing vulnerability to poverty: a case study from Zimbabwe. Paper accepted for the 26th Conference of the International Association of Agricultural Economists (IAAE), August 12-18, 2006, Queensland, Australia. Muang-Thong, N. 2002. Experience in processing and marketing of value-added products in Thailand (translated by B. Ratanachinakorn). In Haq, N. and Hughes, A. (Eds) Fruits for the Future in Asia. Proceedings for the Consultation meeting on the Processing and marketing of underutilized tropical fruits in Asia. International Centre of Underutilised Crops, Southampton, UK. Pp 100–101. Mulumba, J.W., Mudoma, J. M., Asega, J.J. 2005. Stataus Report on Indigenous Fruit tree species capture as a result of genetic erosion in Uganda, NARO, Entebbe. Mumba M.S., Simon S.M., Swai R. and Ramadhani T. 2002. Utilization of indigenous fruits of miombo woodlands: A Case of Tabora District, Tanzania. Pp. 35-38 in Rao M.R. and Kwesiga F.R. (eds.) Proceedings of Regional Agroforestry Conference on Agroforestry Impacts on Livelihoods in Southern Africa: Putting Research into Practice. World Agroforestry Centre: Nairobi, Kenya. Mungai, J.K., Ouko, J., Heiden, M., 2000. Processing of Fruits and Vegetables in Kenya. Marketing Information Branch, Ministry of Agriculture and Rural Development, Nairobi, Kenya. Musinguzi, E., kikafunda, J.K. and Kiremere, B. T. 2003. Utilisation of Indigenous Food Plants in Uganda: A case study of South-Western Uganda. Department of Food science and technology, Makerere University , Kampala. NEMA. 2001. State of the Environment Report for Uganda. National Environment Management Authority, Ministry of Water Lands and Environment, Kampala, 153 pp. NRI, 2004. Prospects for sustainable tree crop development in Sub-Saharan Africa. Policy Series 17. Natural Resources Institute: Enterprise, Trade and Finance Group, University of Greenwich. 46pp. Okafor, J.C. 1988. Domestication and Conservation of Indigenous Fruit Trees in Africa. Paper presented at the workshop on utilization and exploitation of Indigenous and often neglected plants and fruits of Eastern and Southern Africa, Zambia, Malawi.

59
Okia, C.A., Obua, J., Agea, J.G. and Agaro, E. 2005. Natural regeneration, population structure and traditional management of Vitellaria paradoxa subspecies nilotica in the shea parklands of northern and eastern Uganda. African Crop Science Conference Proceedings, 5-9 December 2005, Kampala, Uganda. Vol. 7. pp. 1187-1191. Okiror, P., Okullo, J.B.L. and Okia, C.A. (In press). On-farm Conservation and Agroforestry potential of Vitellaria paradoxa in Amuria district, Teso Sub-region, Uganda. Okullo, J.B.L. & Waithum, G. 2007. Diversity and conservation of on-farm woody plants by field types in Paromo Sub county, Nebbi District, north-western Uganda African Journal of Ecology 45 (s3) , 59–66. Okullo, J. B.L. 2005. Utilisation and domestication potential of indigenous fruit trees in the drylands of Uganda. A case study of Lira district, Northern Uganda. In: Proceedings of a Regional Workshop on Utilisation and Commercialization of dryland indigenous Fruit tree species to improve livelihoods in East and central Africa. 20th – 24th June, 2005. KEFRI Kitui, Kenya. Okullo, J.B.L. 2004. Vitalaria paradoxa in Uganda: Population structures and reproductive characteristics. PhD Thesis, School of Agricultural and Forest Sciences, University of Wales, Bangor. 303pp. Okullo, J.B.L., Obua, J., Okello, G. 2004. Use of indigenous knowledge in predicting fruit production of shea butter tree in agroforestry parklands of north – eastern Uganda. Uganda Journal of Agricultural Sciences, 9: 360 – 366. Okullo, J.B.L., Hall, J.B. & Obua, J. 2004b. Leafing, flowering and fruiting of Vitellaria paradoxa subsp. nilotica in savanna parklands in Uganda. Agrofor. Syst. 60, 77–91. Okullo, J.B.L. Obua, J., Kaboggoza, J.S.R. & Aluma, R.W. 2003. Traditional agroforestry systems, tree uses and management in northern Uganda. Uganda Journal of Agricultural Sciences. 2003, 8: 5–10. Palmer, E. & Pitman, N. 1972-1974. Trees of Southern Africa (3 vols). Balkema, Cape Town. 2235 pp. National Biomass Study. 2003. National Biomass Technical Report, Ministry of Water, Lands and Environment, Kampala, Uganda.
Saka J.D.K., Mwendo-Phiri E. and Akinnifesi F.K., 2002. Community processing and nutritive value of some miombo indigenous fruits in central and southern Malawi. – 169 in Kwesiga, F., Ayuk, E. and Agumya, A.(eds.) Proceedings of 14th Southern African Regional Review and Planning Workshop, 3 – 7 September 2001, Harare, Zimbabwe, International Centre for Research in Agroforestry. Shackleton, C.M. 2004. Use and selection of Sclerocarya birrea (Marula) in the Bushbuckridge lowveld, South Africa. Pp. 77–92 in Rao M.R. and Kwesiga F.R. (eds.). Proceedings of Regional Agroforestry Conference on Agroforestry Impacts on Livelihooods in Southern Africa: Putting Research into Practice: World Agroforestry Centre: Nairobi, Kenya. Schreckenberg, K. 2004. „The Contribution of Shea Butter (Vitellaria paradoxa C. F. Gaertner) to Local Livelihoods in Benin‟, in T. C. H. Sunderland and O. Ndoye (eds), Forest Products, Livelihoods and Conservation: Case-studies of Non-Timber Forest Product Systems. Vol. 2: Africa. Bogor: CIFOR. Schreckenberg, K. 2003. „Appropriate Ownership Models for Natural Product-based Small and Medium Enterprises in Namibia‟. Consultancy Report for the Ministry of Trade and Industry, Windhoek, Namibia.
60
Schreckenberg, K.; Awono, A.; Degrande, A; Mbosso, C. and Ndoye, O. 2006. Domesticating indigenous fruit trees as a contribution to povery reduction. Forests, Trees and Livelihoods, 16: 35-51.` Schreckenberg, K. 1999. Products of a managed landscape: non-timber forest products in the parklands of the Bassila region, Benin Global Ecology and Biogeography 8 (3-4), 279–289. Wilson, W. R. S. 1998. Identification of problems in processing of underutilised fruits of the tropics and their solutions. Acta Horticulturae 518 (8): 237–240. Wilson, W.R.S. 2002. Status report on the postharvest handling, processing and marketing of underutilised fruit crops in Sri Lanka. In Haq, N. and Hughes, A. (Eds) Fruits for the Future in Asia. Proceedings for the Consultation meeting on the Processing and marketing of underutilized tropical fruits in Asia. International Centre of Underutilised Crops, Southampton, UK. Pp 199–204.

61
Appendix I: Check list for group discussions
Use and conservation of IFTs for improved livelihood in Teso and Lango sub-regions, Uganda
Focus Group Discussions - Guide
1. Of what importance is this tree to people in this area?
Economic
Food security 2. What products do you get from the fruits of this tree? 3. How is the fruit processed to produce each of these products? 4. How is the fruit/product stored? 5. For how long does the fruit/product stay without getting spoilt? 6. How is the marketing of fruits/products organized?
Where does it take place?
When does it reach peak?
Who are involved? 7. In what units are the fruits/products sold (both at farm-gate and market)? 8. How much do the fruits/products cost per unit?
Farm-gate
Market 9. During what months does this tree undergo the following stages?
Flowering
Fruit setting
Fruit maturity 10. How many times in a year does this tree fruit? 11. What quantity of fruits (specify units) is produced per tree in a fruiting season?

62
Appendix II: Sample questionnaire for Selection of project species
Use and conservation of IFTs diversity for improved livelihood in Eastern Africa
A. General
1. Site identification
1. Village/City……………………………….…… .2. Division/Sub county……………………………......
3. District ………………………………………… 4. Date of interview
5. Agro-ecological zone………………… 6. Interviewer‟s name……………………………………….
2. Respondent identification
7. Name of respondent ...……………………………………………………………………………………………...
8. Sex of respondent (1) Male (2) Female
9. Age of respondent (1) <20 (2) 20-35 (3) 35-55 (4)>55
10. How long have you settled in this area (yrs)…………………………………
11. Where do you originate from (district of origin)? ……………………….. ………………………..
B. Socio-economic information
1. Household characteristics
11. How many are there in your household? .....................................................................................................
12. Who is the household head? [1] Male [2] female
13. What is your marital status? [1] Never married [2] married [3] divorced [4] separated [5] widowed [6] separated [7] other (specify) …….
14. What is your religion? (1) Christian ( 2) Muslim (3) African (4) Other (specify)……………………
15. What is your highest level of education? (1) None, (2) Primary, (3) Secondary, (4) University …………….
16. What is your major occupation (main source of livelihood)? (1) Farmer (2) employed, (3) Pet business (4)Pastrolist/Livestock keeper
17. Are you familiar with local fruit trees? (1) Yes, (2) No ……………………………………………………….
If Yes mention 3 local fruits in your local language* (1)……………………. (2)…………………… (3)...…………………
18. What is your ethnic group (to be adapted by each country) …………………………………………. *Specify the language
2. Food security
2.1 Do you grow crops (1) yes (2). No
2.2 If No go to section C. and If yes what major staple crops do you grow? (The 3 majors crops grown)
Codes: (1) Maize (2) Rice (3) Potatoes (4) Cassava (5) Banana (6) others (specify)……..
2.3. Did you harvest enough food last growing season to last you the whole year? [1] Yes [2] No
2.4. If no until what month did your food last? (Number of months) , ……………………………….
2.5. Do you keep livestock (1) yes (2) No
If No go to section C. and If yes which type of livestock and how many do you keep
Livestock Local breeds Number of local Exotic Exotic number
Codes: (1)Goats (2) Cattle (3)Poultry (4) Sheep (5) Camel (6)Donkeys ( 7)Others
Is there a presence of cultivated exotic fruits in this area (1) Yes (2) No
If which exotic fruits (mention the major ones)
2.6 What survival strategies do you adopt during period of food shortages? ……………………………………………….
2.7 Do indigenous fruit trees play an important role for your survival during the food shortages months? [1] Yes [2] No
2.8 If yes which species were used and how were they useful?

63
Species (use previous codes) survival usage
*Use the 5 priority species mentioned earlier (use the space below to take any extra information regarding the above question)
Conservation and Management of IFTs
2.1 What are the options to address the situation of the IFTs species that are becoming increasingly scarce or extinct?
Have you retain an indigenous fruit tree in your garden/ farm or your house? [1] Yes [2] No …………...
If no, why? …………………………………………………………………………………………………………...
If yes which species and why?
Species* Reasons for retaining
**Use the 5 priority species mentioned earlier (use the space below to take any extra information regarding the above question)
2.2 Have you ever planted any indigenous fruit trees? [1]Yes [2] No ………………………………………...
2.3 If no, why? …………………………………………………………………………………………………………...
2.4 If yes, which species, why, where planted, what materials and where did you obtain the planting materials?
Species (use
codes)
Reason/Why Where planted Planting Materials Sources of planting materials
1
2
3
4
5
*Local name or botanical name or identification code
Codes for planting materials: [1] Seedling, [2] Wildings, [3] Cuttings, [4] Truncheons, [5] Seeds, [6] Roots or rhizomes, [7] Other (specify)
Codes for sources of planting materials: [1] Wild material, [2] from a friend, [3] from a local nursery [4] from a research station, [5] Other (specify)
Codes for plantation site: [1] Farm, [2] home, [3] home garden, [4] orchard [5] other (specify)
If planted, What problems did you encounter in growing the trees and how did you solve them?
Species* Problem Solution
1
2
3
4
5
*Use the 5 priority species mentioned earlier (use the space below to take any extra information regarding the above question)
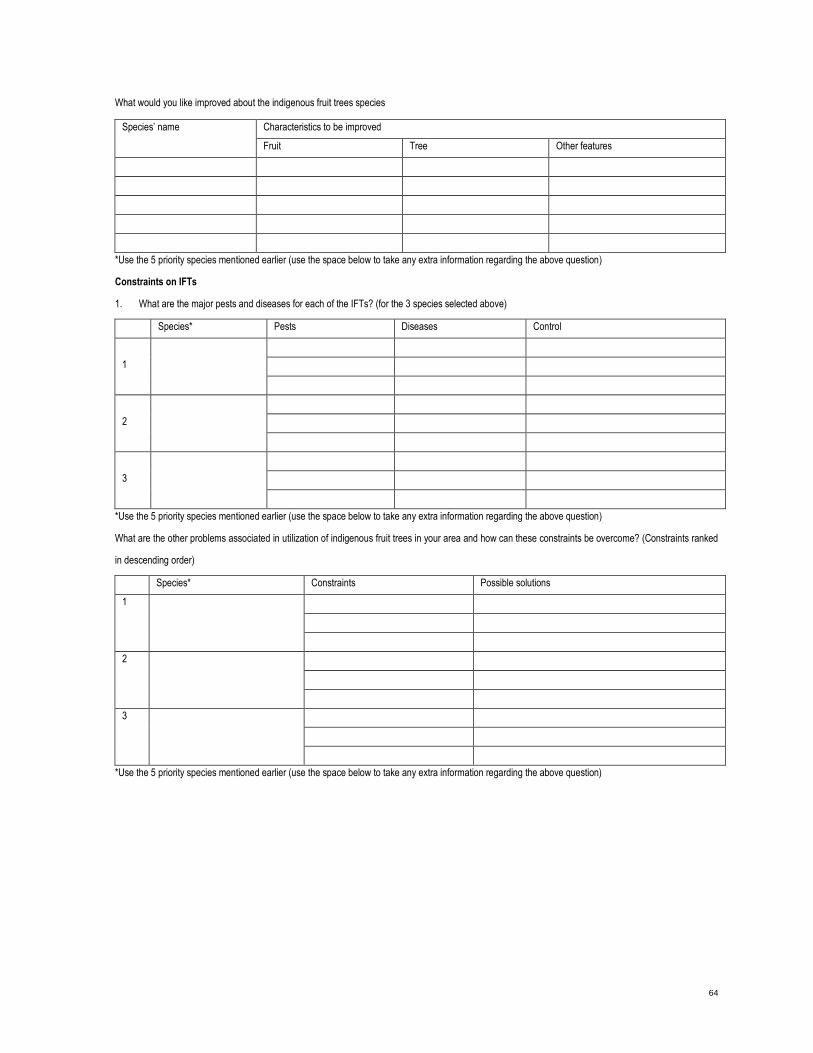
64
What would you like improved about the indigenous fruit trees species
Species‟ name Characteristics to be improved
Fruit Tree Other features
*Use the 5 priority species mentioned earlier (use the space below to take any extra information regarding the above question)
Constraints on IFTs
1. What are the major pests and diseases for each of the IFTs? (for the 3 species selected above)
Species* Pests Diseases Control
1
2
3
*Use the 5 priority species mentioned earlier (use the space below to take any extra information regarding the above question)
What are the other problems associated in utilization of indigenous fruit trees in your area and how can these constraints be overcome? (Constraints ranked
in descending order)
Species* Constraints Possible solutions
1
2
3
*Use the 5 priority species mentioned earlier (use the space below to take any extra information regarding the above question)

65
Appendix III: Sample Questionnaire for the market study
A. General
1. Site identification
1. Village/City……………………………….…….2. Division/Subcounty……………………………......
3. District …………………………………………4. Date of interview
5. GPS reading: Northings................................................. Eastings..............................................................
2. Respondent identification
6. Name of respondent ...……………………………………………………………………………………………...
7. Sex of respondent (1) Male (2)Female
8. Age of respondent (1) <20 (2) 20-35 (3) 35-55 (4)>55
9.How long have you settled here (yrs)…………………………………
B. Household characteristics
1. What is your ethnic group? (1) Ateso, (2) Acholi, (3) Langi, (4) Kumam, (5) others (specify).....................................
...…………...……….……….…………………........................................
2. What is your highest level of education? (1) None, (2) Primary, (3) Secondary, (4) University ……………
3. Activity in the field of IFTs: (1) IFTs trader, (2) IFTs consumer, (3) Other (specify) ………………………...
4. Are you traders/consumer of local fruit trees? (1) Yes, (2) No
5. If Yes, mention 3 local fruits in your local language*………………….… (1)……………………. (2)…………………… (3)...…………………(Only
respondents IFTs traders and IFTs consumers having mentioned names of 3 local fruits should be selected for the interview C)
*Specify the language
C. Information on the selected species
1. IFTs sold and consumed
1. Which ones of the following IFTs do you market? Rank them per priority order (Only for IFTs traders)
Species* Marketed** Rank Criteria of ranking/Market Preference
1
2
3
*Local name or botanical name or identification code
**Put a cross in the corresponding case if the target fruit is marketed
2. Which ones of the following IFTs do you consume? Rank them per priority order (Only for IFTs consumers)
Species* Consumed** Rank Criteria of ranking
1
2
3
*Local name or botanical name or identification code
**Put a cross in the corresponding case if the target fruit is consumed
2. IFTs chain
1. Description of IFTs chain
Species* Quantity traded Where collected*** Where sold*** Where exported***
Nb. of production in fruit
season per year (suck)
Nb. of production in
off season
1
2
3
*Local name or botanical name or identification code

66
**Specify the month with the following code: (1) January, (2) February ………… (12) December
***Only for IFTs traders, specify the place
3. Characteristics of the fruits and market preferences
1. Fruit size
Species* Types of fruit size ** Market preference
1 2 3
1
2
3
*Local name or botanical name or identification code **Put a cross in the corresponding case
Codes: [1] Big fruit, [2] Small fruit, [3] medium-sized fruit
2. Fruit shape
Species* Types of fruit shape** Market preference
1 2 3
1
2
3
*Local name or botanical name or identification code **Put a cross in the corresponding case
Codes: [1] rounded, [2] ovate, [3] Other (specify) ……………..
3. Fruit taste
Species* Types of fruit taste** Market preference
1 2 3
1
2
3
*Local name or botanical name or identification code **Put a cross in the corresponding case
Codes: [1] Sweet, [2] Sour, [3] Bitter
4. Fruit seasonality
a. Precocity
Species* Precocity** Market preference
1 2 3
1
2
3
*Local name or botanical name or identification code **Put a cross in the corresponding case
Codes: [1] early, [2] normal, [3] late
b. Frequency
Species* Frequency** Market preference
1 2 3
1
2
3
*Local name or botanical name or identification code **Put a cross in the corresponding case

67
Codes: [1] once a year, [2] twice a year, [3] other (specify) ………………………….
4. Market characteristics
1. Amount of fruit sold and prices (Only for IFTs traders)
Species Quantity sold** Range of prices***
1
2
3
**Use a local measurement unit such as number of baskets, number of bags etc. and then convert in IS unit (Kg)


![SPECIES DIVERSITY OF FRUIT-FEEDING BUTTERFLIES ... Thesis [Christha].pdfspecies diversity of fruit-feeding butterflies (lepidoptera: nymphalidae) in spatial, temporal and vertical](https://static.fdocuments.us/doc/165x107/5d0601dc88c993ea578cc99c/species-diversity-of-fruit-feeding-butterflies-thesis-christhapdfspecies.jpg)