USDA Foreign Agricultural Service GAIN Report · ... (Food Companies Association) ... as domestic...
26
Required Report - public distribution Date: 2/6/2006 GAIN Report Number: CI6003 CI6000 Chile Food Processing Ingredients Sector Annual Report 2006 Approved by: Christine M. Sloop, Agricultural Attache Office of Agricultural Affairs Prepared by: Office of Agricultural Affairs, U.S. Embassy, Santiago • Report Highlights: A key market driver for food processing is Chile’s strong economy, which has rebounded since the end of 2003. Supermarket sales are growing 7% steadily per year since 2004, when sales were US$5.6 billion, and are expected to grow another 7% in 2006. Consumption trends influencing the type and quality of inputs being used include easy-to- prepare food, new fast foods and snack foods, diet and light foods continue capturing market share. Organic foods are being adopted at a much slower rate but there increasing presence in the market is also marking a trend. The recent slow economic period drove price sensitivity to an all-time high among food processors. The market continues to consolidate through mergers, leaving a wide gap in size and capacity between the leading food producers and the universe of small ones Includes PSD Changes: No Includes Trade Matrix: No Annual Report Santiago [CI1] [CI] USDA Foreign Agricultural Service GAIN Report Global Agriculture Information Network Template Version 2.09
Transcript of USDA Foreign Agricultural Service GAIN Report · ... (Food Companies Association) ... as domestic...

Required Report - public distribution
Date: 2/6/2006
GAIN Report Number: CI6003
CI6000
Chile
Food Processing Ingredients Sector
Annual Report
2006 Approved by: Christine M. Sloop, Agricultural Attache Office of Agricultural Affairs
Prepared by: Office of Agricultural Affairs, U.S. Embassy, Santiago • Report Highlights: A key market driver for food processing is Chile’s strong economy,
which has rebounded since the end of 2003. Supermarket sales are growing 7% steadily per year since 2004, when sales were US$5.6 billion, and are expected to grow another 7% in 2006. Consumption trends influencing the type and quality of inputs being used include easy-to-prepare food, new fast foods and snack foods, diet and light foods continue capturing market share. Organic foods are being adopted at a much slower rate but there increasing presence in the market is also marking a trend. The recent slow economic period drove price sensitivity to an all-time high among food processors. The market continues to consolidate through mergers, leaving a wide gap in size and capacity between the leading food producers and the universe of small ones
Includes PSD Changes: No Includes Trade Matrix: No
Annual Report Santiago [CI1]
[CI]
USDA Foreign Agricultural Service
GAIN ReportGlobal Agriculture Information Network
Template Version 2.09

GAIN Report - CI6003 Page 2 of 26
UNCLASSIFIED USDA Foreign Agricultural Service
Table of Contents Section I. Market Summary .................................................................................3
Country Overview ................................................................................................ 3 Size of Chilean Food Processing Industry.................................................................. 3 Macro-Economic Factors and Key Demand Drivers in Food Processing Sector .................. 4 Advantages and Challenges facing U.S. Food Ingredient in Chile ................................... 4
Section II. Road Map for Market Entry .................................................................5 A. Entry Strategy................................................................................................ 5 B. Market Structure............................................................................................. 7 C. Company Profiles ............................................................................................ 8 D. Sector Trends............................................................................................... 21
Section III. Competition ................................................................................... 22 Section IV. Best Product Prospects.................................................................... 23 Section V. Post Contact and Further In formation ............................................... 26

GAIN Report - CI6003 Page 3 of 26
UNCLASSIFIED USDA Foreign Agricultural Service
Section I. Market Summary Country Overview Chile, with a population of 15.9 million, is a very centralized country with an estimated 5.5 million living in and around the greater Santiago area. The capital city of Santiago hosts most of the industrial activity and business activities in general. In 2005, Chile’s GDP (purchasing power parity) reached US$112 billion and per-capita GDP of nearly US$6,800 (depending on exchange rate). GDP growth reached approximately 6.3% benefit from high copper prices, solid export earnings (particularly forestry, fishing, and mining), and stepped-up foreign direct investment. Santiago, the capital city, is home to some 40 percent of the population and the great majority of the HRI sector companies that would purchase imported food products. Chileans spend on average around 20% of their household income on food, drinks and tobacco. In per capita terms, Chile is the second biggest consumer of bread in the world (98 kilos per year) after Germany, the 3rd consumer of tea (800 grs), and an important consumer of pastas, rice, seafood, carbonated beverages and beer. Supermarkets are the leading retail channel for food products. Chile has a longstanding commitment to trade liberalization and has signed free trade agreements with the European Union, Mexico, Canada, Korea, EFTA, Central America, Mercosur, Singapore/New Zealand, Ecuador, the U.S. and is negotiating agreements with Japan, China, India, Malaysia, Thailand, Peru and Bolivia. The U.S.-Chile Free Trade Agreement was signed on June 6, 2003 and took effect on 1 January 2004. The U.S.-Chile Free Trade Agreement reduces the previous 6% across-the-board tariff to 0% for 87% of non-agricultural products immediately, and for three quarters of agricultural products within 4 years, the rest over 12 years. U.S. and Chile Tariff Schedules for all Harmonized Tariff System customs codes can be found at www.ustr.gov/new/fta/Chile/text/, “Section 3. National Treatment and Market Access for Goods”. According to Chilealimentos, (Food Companies Association) over the last decade the Chilean food sector experienced the most pronounced annual growth in the world: 132%. Food sector exports are the second largest Chilean export sector reaching US$8.2 billion in 2005, comprising 10% of GDP, second after mining. In 2005, the leading imported food products were: rice, canned tuna, whisky, chocolates, candy, cereals, potatoes prepared or canned, rum, beer, pasta, cheese and cookies. The origin is mostly from Latin America (52%), with half of this from Argentina (26%). Other supplier countries were: Thailand (21%, rice), and England (10% whisky). The main Chilean processed food industries are those related to dairy products, processed or canned seafood, crackers/cookies, candy, chocolates, canned peaches, jams, tomato sauces, pasta and juices. Size of Chilean Food Processing Industry • The processed (packaged) food sector’s annual growth is represented by the sector’s
exports, which grew from US$717 million in 2004 to US$810 million in 2005. Certain sub sectors continue to see strong growth as more people join the work force and eat out-of-home, as domestic help salaries rise and their availability drops. Especially promising products are convenience and fast foods, out-of-home foods (snacks, etc., which are surprisingly consumed more by lower-income households and young consumers than others), and health and light foods.

GAIN Report - CI6003 Page 4 of 26
UNCLASSIFIED USDA Foreign Agricultural Service
• The number of Chilean food processing companies has shrunk through mergers and
acquisitions during the last couple of years. Currently, 53 companies dominate the market.
• The “gourmet food” sector includes spices and sauces; cheese and dairy products; red
meat, poultry and seafood products; prepared foods and soups; pastas, grains and legumes; bakery; crackers and snacks; desserts, confectionery and drinks. The sub sectors with the largest market share are: spices (11.1%); tea (5%); cheese (5%); coffee (5%), and snacks (4.7%).
Macro-Economic Factors and Key Demand Drivers in Food Processing Sector § Artesian production of bakery products still dominates Chile’s packaged food market, with
80% of total bakery sales concentrated in traditional bakeries. Of this 80%, approximately 43% is sold through bakery distribution companies and 37% in stores. The other 20% is sold at supermarket chains.
§ The market continues to consolidate through mergers, leaving a wide gap in size and capacity between the leading food producers and the universe of small ones; consumers and the small producers have little power and influence over prices.
• A key market driver for food processing is Chile’s strong economy, which has rebounded since the end of 2003. Supermarket sales are growing 7% steadily per year since 2004, when sales were US$5.6 billion, and are expected to grow another 7% in 2006.
• Consumption trends influencing the type and quality of inputs being used include easy-to-prepare food as more people join the workforce and spend less time at home, as out-of-home meals become more frequent, as young people continue adopting new fast foods and snack foods and as diet and light foods and beverages continue capturing market share. Organic foods are being adopted at a much slower rate but there increasing presence in the market is also marking a trend. The recent slow economic period drove price sensitivity to an all-time high among food processors.
Advantages and Challenges facing U.S. Food Ingredient in Chile
Advantages Challenges U.S. food inputs are known for their quality. They meet respected FDA & USDA standards. Health concerns are low.
Quality of food ingredients is said to have become very similar from the U.S., Europe, Asia, etc., and many European inputs meet U.S., European and Japanese standards.
The U.S. is a strong, traditional trading partner and its products are welcome.
U.S. food input producers sometimes are not as aggressive in following up sales leads as European or other suppliers.
The U.S.-Chile Free Trade Agreement, which went into force on January 1, 2004, is making U.S. products more competitive.
Prices for U.S. products may still be higher than local products or imports from nearby countries. FOB prices for U.S. inputs, even before adding freight, insurance and duties, often are 10-14% higher, or more, than local prices for equivalent quality. This remains true even after the import tariffs for U.S. products have been reduced or eliminated.
The rapidly dropping U.S. Dollar exchange rate, 11% in 2005, will make U.S. inputs more competitive.
The Argentine and Brazilian recessions and currency devaluations preceded the U.S. dollar’s depreciation, so that their products displaced U.S. raw materials, and U.S. products will have a hard time recovering their

GAIN Report - CI6003 Page 5 of 26
UNCLASSIFIED USDA Foreign Agricultural Service
market position.
Certain companies have corporate requirements to purchase U.S. inputs, for example Nestlé for products re-exported to the U.S.
Purchase decisions are often global and are influenced by headquarters, not just local management.
Shipping from the U.S. is cheaper and quicker than from Europe.
U.S. ingredients are often more expensive than local equivalents. The FOB cost is sometimes 10% higher.
Rising consumer spending and adoption of foreign food types favor new types of inputs.
Price sensitivity became stronger than ever during the economic slump in 1999.
Section II. Road Map for Market Entry A. Entry Strategy • U.S. food ingredient producers who want to enter the Chilean market can deal with local
food processors directly or with representatives/agents/distributors depending on the product and on the application and type of end users. Large corporations increasingly prefer to import directly from foreign suppliers, while smaller processors are often not able to purchase whole containers or prefer that a distributor manage logistics and their inventory. Eventually, large sales volumes would justify establishing a local subsidiary to guarantee customer service and quality levels.
• Sales in Chile are made based on a relationship of personal trust, and personally visiting the country and demonstrating products to potential distributors and end-users is fundamental for generating solid, durable business relationships.
• Market access is open to all products from all countries. Except for products covered by a Free Trade Agreement, all products pay a standard, across the board 6% tariff. All edible products must be approved by the Chilean health authorities and receive a registration number and open sales permit before being put on the market.
• U.S. food products are sought after and respected for their dependably high quality levels, but prices are generally uncompetitive. To compete in Chile, U.S. producers need to focus on profit margins, which are very often significantly lower in Chile than in other countries which are not as open to the world as Chile is. Specialty products and chemicals have a better chance of success than more basic inputs, which are often sourced locally.
• Distribution trade is very receptive to U.S. products as they are a guarantee of quality and good packaging and therefore low losses. As soon as possible, buyers will try to buy direct, without a local middleman, because they cannot pass those margins on to the product price and remain competitive.
• U.S. exporters are considered to be less flexible or agile than others in their ability and willingness to meet market requirements. Prices are key in this aspect as is a more active marketing style than American producers are used to at home, and minimum order quantities are often too high for this market, especially during the initial stages of market penetration. Local distributors also expect the manufacturer to share in marketing and promotion efforts and expenses.
What You Must Do to Successfully Enter and Develop the Chilean Market The key market success drivers are a strong proactive attitude, long-term commitment to the market, conscientious follow-through of exporting effort; marketing and promotion; adapting to competitive local price points and margins; customer service and terms of

GAIN Report - CI6003 Page 6 of 26
UNCLASSIFIED USDA Foreign Agricultural Service
payment. The Chilean market for ingredients imported from the U.S. is small compared to sales in the U.S., even at a State level. High U.S. market shares are linked mainly to a product’s uniqueness (e.g. peanut butter, baked beans, etc.) or special characteristics (above-average quality or quality consistency especially with respect to human health, service, international corporate headquarters requirements, quick response and delivery capabilities, etc.). Low U.S. market share is generally due to the high impact of freight costs on commodity products, the acceptably high quality of products offered at much more attractive prices by other regional competitors, or the inability to adapt product and packaging to local standards. Export Success is a Result of a Proactive Attitude and Long Term Commitment: U.S. suppliers are all-too-often less aggressive and persistent than European or Asian ones, or even Latin American competitors. The Chilean market is not large but it is sophisticated, innovative and competitive, and already being supplied by many world-class local and international suppliers. It should not be considered as a spot market but must be systematically developed with strong marketing and promotion campaigns in order to conquer and maintain market share. Stress Marketing and Customer Service: Building strong personal relationship based on personal trust is very important in Chile and in other Latin American countries towards establishing a strong, profitable long-term business relationship with a potential distributor or client. Personally visiting with potential or appointed distributors and with large clients is the best way to build up sales. Also, follow up, providing good support and consistently responding to technical inquiries will keep other competitors at bay with a client or distributor. For example, when a potential Chilean client contacts a U.S. supplier and requests a quote, the supplier should not ignore the opportunity and should respond as soon as possible, regardless of the value of the order. If not, he will probably not be contacted again and will not be considered as a possible regular supplier. Reliable delivery schedules are also a plus. Shipping from the U.S. is faster than from Europe or Asia, and effective freight forwarders or brokers can make a difference in earning a better reputation than other global competitors. Try to Match Local Quality, Prices and Margins: Chile is a very price-conscious and competitive market as a result of being open to imports from all nations and a low universal tariff rate (currently 6%). The U.S. has a free trade agreement with Chile, so tariffs are ever lower for U.S. products. U.S. products are well known and respected for their reliable quality control and high food ingredient standards, especially regarding human health aspects. However, quality standards of suppliers around the world have been increasing and reaching comparable levels due in part to automation and modern technology, and it is now possible to find quality products in most parts of the world. U.S. producers must either offer top quality products at a competitive price or compensate with special characteristics, better service, support, warranties, etc. Contacts regularly emphasize that the quality difference between U.S. food ingredients and their international competition is seldom large enough to justify the significantly higher prices charged by U.S. suppliers. Except for a few very quality-conscious end users such as Nestlé, which observes very high quality guidelines enforced by the corporate headquarters especially for product lines such as infant foods and baby formulas, non-U.S. food ingredient suppliers out-compete U.S. suppliers on price in Chile. If U.S. suppliers want to compete successfully in Chile, they must be willing to lower their US.-based profitability expectations and work with the lower pricing and profit margins common in the Chilean market. Take Advantage of the Window of Opportunity due to Low Dollar Exchange Rate: On the other hand, the significant drop of the U.S. Dollar against other currencies during 2004-2005 has made U.S. products more competitive. A strong effort to take market share away from

GAIN Report - CI6003 Page 7 of 26
UNCLASSIFIED USDA Foreign Agricultural Service
competitors in the Chilean market will be more productive during 2006 than when the U.S. Dollar strengthens again, so we encourage U.S. food ingredient suppliers to explore the Chilean market now. Consider Terms of Payment: European suppliers very commonly grant open accounts and long terms of payment (up to 90 to 120 days). They also enjoy strong support from governmental export promotion financing. U.S. suppliers should try to move away from letters of credit towards open accounts as soon as the client’s credit worthiness and payment performance are established. This will lower costs. Taking advantage of U.S. Government-sponsored export financing or risk insurance programs will also strengthen the food ingredient exporter’s financial and competitive position. Tap into Centralized Purchasing by International Corporations: When dealing with global or international food processing companies in Chile, any existing relationship with other international divisions or with headquarters of that company should be fully exploited to gain an edge with the Chilean subsidiary. Even without previous business relationship, approaching headquarters or subsidiaries in the U.S. is a good way to explore the company’s product and technical requirements and thus potential business opportunities within that corporation and with its Chilean subsidiary. Find a Good Distributor: Unless a sales program in Chile can be sustained by direct sales to a few large clients (and many processed food sectors are dominated by a small number of exactly these type of companies), a local distributor will be a crucial business partner. Chilean clients expect to be able to deal directly with a local representative for placing orders, voicing complaints and obtaining technical and pre- and post-sales support. Correct selection of a qualified distributor is of the highest importance, since the reputation of the U.S. supplier will rest on the ability of the distributor to provide prompt and reliable ordering, stocking and delivery services to clients. The distributor’s quality and performance standards should match those of the U.S. supplier’s as closely as possible, and this is often not easy to find in Chile. Also, when possible, only one distributor with a wide regional distribution network that covers as many market sectors and regions as possible should be selected. Appointing more than one distributor can often result in price wars that minimize profit margins and therefore marketing or promotional efforts. The availability of qualified distributors is not large, so a good initial choice is fundamental and should be a very well thought-out consideration. The strongest recommendation to U.S. food ingredient suppliers wanting to enter the Chilean market is to be as aggressive or committed as European competitors in their marketing, to make an effort to develop and nurture strong relationships with good distributors and clients so that the U.S. supplier becomes a trusted business partner, and then to be willing to compete by limiting profit margins to the degree necessary and possible while maintaining quality and service in order to compete, at least in the initial stages of market penetration. The relationships of trust and open communication with potential distributors and especially with clients will be the key to being given the chance to learn about what products are required and which ones present the best market potential opportunities for that particular supplier’s ingredients. B. Market Structure Food ingredient distribution patterns are different for local and for imported products, and are changing with time. Local inputs are purchased direct from the producer by all but the smallest food processors. Imported ingredients are more commonly handled by local distributor/representatives or wholly owned subsidiaries for the smaller users. Large

GAIN Report - CI6003 Page 8 of 26
UNCLASSIFIED USDA Foreign Agricultural Service
processors like to import their products directly to maximize savings, and deal with the logistics themselves. Generally, if sales volumes are not too high, direct imports will not be of interest to Chilean buyers as the costs and effort required to get an edible product approved are disproportionately high. In this case, it is more reasonable to have a local representative/distributor to handle the import process, health approval and open marketing permitting, marketing and promotion, selling and stocking. As food processors seek to rationalize their costs, they are leaning more towards direct purchases and away from middlemen with time. As the big processors get bigger, they reach economies of scale by negotiating direct with the supplier, even on a global scale. Logistics companies have become a strong market player in the past five years, but they work with finished products and are not involved in raw materials. Thus, unlike bigger processors, smaller buyers still depend on distributors to manage their stock. The food processors sales generally go mostly to supermarkets, followed by traditional retailers and to a small extent to institutions (HRI food services). Institutional sales are often handled as a separate business by the processors. Smaller neighborhood stores have been continuously decreasing in number as they cannot match the efficiencies and location advantages of market-leading hypermarkets. The supermarket sector is dominated by a few chains. Distribution Channel Diagram
C. Company Profiles The Chilean Securities Market is policed by the Chilean Securities and Exchange Commission (SVS). There are 489 open corporations traded in the Chilean Stock Market, and only these are required by law to publish financial statements in Chile. List of Food Sector Corporations listed in the Stock Market (therefore, the only ones that are obliged to publish financial statements or any financial results):
Foreign Input Supplier Local Input Supplier
Chilean Distributor
Large Food Processor Small Food Processor
Mostly Very Little
Very Little Mostly
GAIN Report - CI6003 Page 9 of 26
UNCLASSIFIED USDA Foreign Agricultural Service
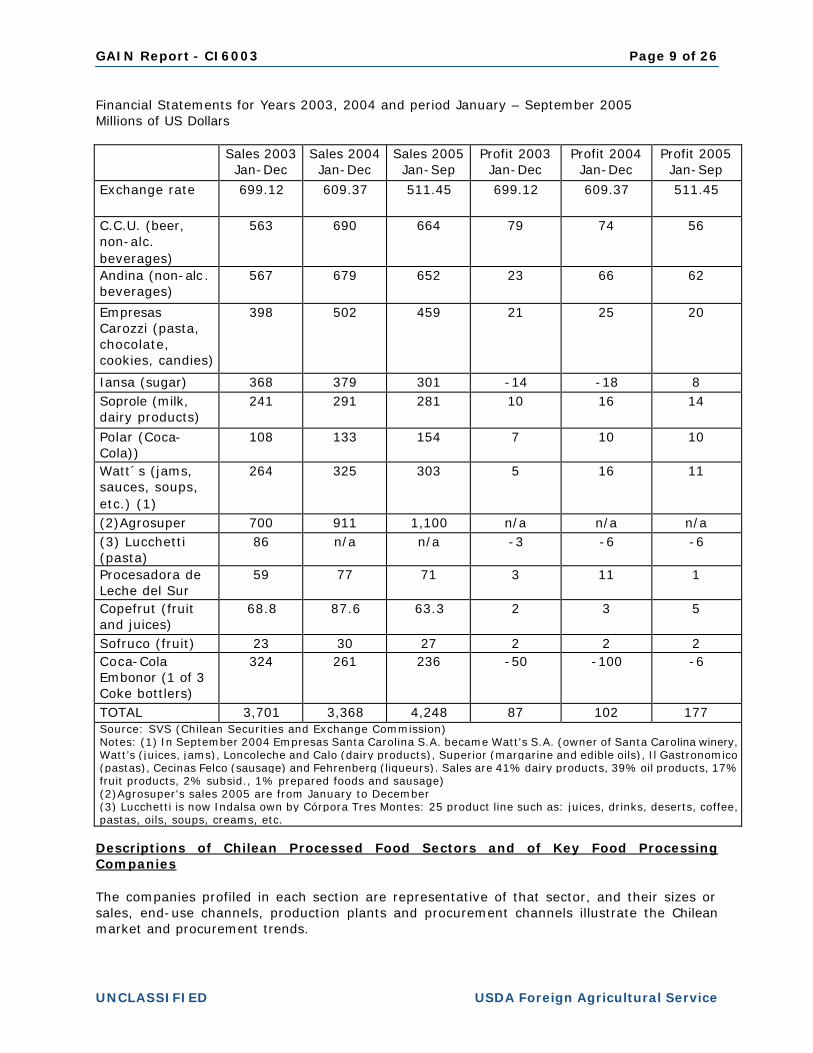
Financial Statements for Years 2003, 2004 and period January – September 2005 Millions of US Dollars Sales 2003
Jan-Dec Sales 2004 Jan-Dec
Sales 2005 Jan-Sep
Profit 2003 Jan-Dec
Profit 2004 Jan-Dec
Profit 2005 Jan-Sep
Exchange rate 699.12 609.37 511.45 699.12 609.37 511.45
C.C.U. (beer, non-alc. beverages)
563 690 664 79 74 56
Andina (non-alc. beverages)
567 679 652 23 66 62
Empresas Carozzi (pasta, chocolate, cookies, candies)
398 502 459 21 25 20
Iansa (sugar) 368 379 301 -14 -18 8 Soprole (milk, dairy products)
241 291 281 10 16 14
Polar (Coca-Cola))
108 133 154 7 10 10
Watt´s (jams, sauces, soups, etc.) (1)
264 325 303 5 16 11
(2)Agrosuper 700 911 1,100 n/a n/a n/a (3) Lucchetti (pasta)
86 n/a n/a -3 -6 -6
Procesadora de Leche del Sur
59 77 71 3 11 1
Copefrut (fruit and juices)
68.8 87.6 63.3 2 3 5
Sofruco (fruit) 23 30 27 2 2 2 Coca-Cola Embonor (1 of 3 Coke bottlers)
324 261 236 -50 -100 -6
TOTAL 3,701 3,368 4,248 87 102 177 Source: SVS (Chilean Securities and Exchange Commission) Notes: (1) In September 2004 Empresas Santa Carolina S.A. became Watt's S.A. (owner of Santa Carolina winery, Watt’s (juices, jams), Loncoleche and Calo (dairy products), Superior (margarine and edible oils), Il Gastronomico (pastas), Cecinas Felco (sausage) and Fehrenberg (liqueurs). Sales are 41% dairy products, 39% oil products, 17% fruit products, 2% subsid., 1% prepared foods and sausage) (2)Agrosuper's sales 2005 are from January to December (3) Lucchetti is now Indalsa own by Córpora Tres Montes: 25 product line such as: juices, drinks, deserts, coffee, pastas, oils, soups, creams, etc.
Descriptions of Chilean Processed Food Sectors and of Key Food Processing Companies The companies profiled in each section are representative of that sector, and their sizes or sales, end-use channels, production plants and procurement channels illustrate the Chilean market and procurement trends.

GAIN Report - CI6003 Page 10 of 26
UNCLASSIFIED USDA Foreign Agricultural Service
1) Red Meats and Poultry Meat The retail sector is rapidly expanding and has become a driving force for food imports. Grocery stores sell approximately 60% of all meat products consumed in Chile. Another fast-growing sector is foodservice, specifically U.S. casual dining chains such as Applebee’s, TGI Friday’s and Ruby Tuesday. U.S. pork gained free access to Chile in January 2004 due to the U.S.-Chile Free Trade Agreement (FTA). Through the first eight months of 2005, U.S. pork and pork variety meat exports to Chile increased 42% in volume to eight metric tons (mt) and 115% in value to US$39,147 compared to the same period last year. The Chilean pork industry’s expansion into international markets is creating a shortage in the domestic pork supply as exports are more lucrative. Animal disease issues prevent several Brazilian states from sending pork to Chile, increasing the potential for the U.S. industry. Chile opened its market in late July, 2005 to both chilled and frozen boneless U.S. beef from animals of under 30 months of age. Through the first eight months of 2005, U.S. beef and beef variety meat exports to Chile increased 419% in volume to 14 mt and 393% in value to US$58,210 compared to the same period last year. The FTA provides for the mutual recognition of each country’s beef grading systems, allowing USDA to certify U.S. beef for export to Chile. The agreement also removes all tariff and quota restrictions for beef in January 2007. Chilean meat availability is 75 kilos per capita. In 2005 the national production of meat was close to 1.2 million tons, 7% higher than 2004. Chile is a net exporter of white meats (pork 46% of all meat exports, poultry 33% and turkey products 8%) and a net importer of red meats. Special meats such as pork jowls and chicken thighs are in part imported. Meat imports have grown achieving a 15.3% increase during 2005 compared to 2004 with 129,580 tons (US$509.2 million). The main importers are: Supermarket chain Cencosud (“Jumbo”) (28,575 tons with 22.1% market share), Quinto Cuarto (15,782 tons) and supermarket chain D&S (“Lider”) (12,661 tons). Boneless red meat is the most imported representing 92% of total imports during 2005. Meat Market in Chile, metric tons, 2005 Product Bovines Pork Poultry Produced 221,000 tons 405,000 tons 450,000 tons Imported 107,000 tons* 525,000 tons 9,700 tons Exported 16,000 tons 81,000 tons 57,000 tons Source: ODEPA Notes: From January until October 2005/*boneless Processing plants, with direct links to cattle farmers, are displacing stockyards in the beef distribution chain. The beef processing industry is a tight sector, where 68% of the market is controlled by no more than five companies with high levels of vertical integration (including Lo Valledor, Friosa and Carnes Ñuble (AASA Holding), and Matadero de Temuco). The rest are distributed in 93 production locations throughout the country. The AASA group is the main actor in the sector. The red meat consumption per capita is 22.5 kilos. The poultry

GAIN Report - CI6003 Page 11 of 26
UNCLASSIFIED USDA Foreign Agricultural Service
sector production during 2004 was 535,002 tons and from January-November 2005 498,535 tons. Annual consumption stands at 27 kilos per capita. There are three holdings representing 90% of the national industry. These holdings are: Agrosuper (60% market share), Ariztía and Tarapacá (Arica) (32%) and Agrícola Don Pollo (8%). They are also vertically integrated, from producing the feed to distributing to the retailers. Cured meats have a large market. San Jorge, PF, Super, Winter and La Preferida are the leaders among some 40 sausage and cold cut makers. Annual consumption per person is 11.5 kilos. Cured Meat production
Year Tons 2001 168,000 2002 180,000 2003 187,857 2004 199,568
Company (Product Types)
Sales (US$) 2004 End-Use Channels
Production Location(s)
Procurement Channels
Agrícola Ariztía (chickens and
turkey)
US$260 million (2005) chicken
(30% of market), turkey (40% of
market)
Retail, HRI and Exports
Chile (4) N/A
Cecinas La Preferida (sausage and cold
cuts)
US$15 million Retail Chile (1) Pork: Direct (Local); Bovine:
Importers Cecinas San Jorge (sausage and cold
cuts)
30% mkt share. 3,000 tons per
month.
Retail Chile (1) Direct (Local)
Agrosuper, Cecinas Super (sausage and
cold cuts)
US$49 million, 130.000 tons, 50%
mkt. share
Retail and HRI Chile (4) Own Production
AASA Group (Frival(8%); Friosa(7%); Carnes Ñuble(4%) y Con-Cón(3%)) (bovine slaughterhouse)
US$228 million. 46% mkt share.
Retail, HRI and Exports
Chile (6) Pork: Own Production; bovine: Own
Production and Direct (Local);
Grains: Importers
Matadero Lo Valledor (bovine slaughterhouse, largest in Chile)
US$140 million Retail and HRI Chile (6) Bovine: Direct (Local); Pork:
Own Production and Importers
Productos Fernández (Cecinas PF - sausage and
cold cuts)
US$80 million. 15% Mkt share.
Retail and HRI Chile (2) Pork: Own Production,
Bovine: Importers
GAIN Report - CI6003 Page 12 of 26
UNCLASSIFIED USDA Foreign Agricultural Service
Sopraval (turkeys - part of Agrosuper)
US$60 million, 1,200 tons, 60%
Mkt Share.
Retail and HRI Chile (2) Direct (Local and Foreign),
Distributors (Local and Foreign)
Super Cerdo (pork - part of Agrosuper)
US$151 million, 110,000 tons, 50%
mkt. share
Retail and HRI Chile (1) Own Production
Super Pollo (chickens - part of
*Agrosuper)
US$220 million, 223,000 tons
Retail and HRI Chile (2) Own Production
Note:* Agrosuper is the main producer of meat and fresh food with US$1 billion sales. 2) Edible Fish and Seafood Products Chile has the fifth largest fishing industry and frozen and prepared (canned or fresh) seafood are traditional local consumption and export products. The Robinson Crusoe brand pioneered the frozen fish sector 45 years ago, and now competes with Geomar, Pacífico del Norte, Pesquera San José (which has a 55% market share) and others. Salmon and trout farming is a relatively recent Chilean industry, which started exporting in 1981 and has now boosted Chile to the No. 2 salmon producer after Norway. Whereas traditional fish preparation requires little in the way of ingredients, salmon farming generates strong potential for fish food producers and takes up most of the fishmeal produced by offshore fisheries. Main exporters of canned seafood and fish Exporters Kilos U.S. $ FOB Pesquera San José S.A. 32,822,356 34,479,192 Empresa de Desarrollo Pesquero de Chile 7,611,860 15,914,157 Pesquera Camanchaca 11,381,825 15,808,105 Foodcorp Chile S.A. 11,676,818 12,527,383 Pesquera Mar Brava S.A. 1,951,687 11,797,710 Pesquera Bio-Bio S.A. 10,838,826 11,337,765 Source: Chilealimentos 2005 Main exporters of frozen seafood and fish Exporters Kilos U.S. $ FOB Pesquera Palacios S.A. 139,986 1,180,645 Soc. Pesquera Pacifico Austral Ltda. 76,809 522,111 Shellfish S.A. 43,873 471,994 Pesquera Deep Sea Food Ltda. 46,841 467,889 Source: Chilealimentos 2005
Company (Product Types)
Sales (US$) 2004 End-Use Channels
Production Location(s)
Procurement Channels
Geomar (fish products)
US$2 million Exclusive distributor in New York for gourmet
stores
Chile (2) Direct (Local)

GAIN Report - CI6003 Page 13 of 26
UNCLASSIFIED USDA Foreign Agricultural Service
Pesquera San José (fish products)
55% market share frozen and canned
Retail and Exports Chile (3) Own Extraction
Robinson Crusoe (fish products)
Canned fish and sea food 54% mkt
share
Retail Chile (2) Own Extraction
3) Dairy Products The dairy food processing sector, the nucleus of the dairy industry production chain, is made up of around 15 companies that run 28 plants which process 75% of the local milk production, and where the leading four companies buy most of the milk. These four companies are Nestlé (Swiss) and Soprole (New Zealand Dairy Board Fonterra) of foreign capital, plus the local Loncoleche (Watt’s) and Colun (La Unión Agricultural and Milky Coorperative) operations. The other companies are mid-sized or small and most of them produce cheese. The milk producers are the main suppliers, and supermarkets are the main retailers. Dairy products, at 7.5%, are the second largest supermarket perishable sales group after meats. The dairy market is estimated at US$700 million of which the ice cream market is US$100 million and is dominated by Savory (Nestlé) and Bresler (Unilever). Dairy market Share 2005
Milk Reception - Million Liters Year 2005
Colún; 294
Loncoleche; 187
Others; 385
Fonterra (Soprole);
380
Nestlé; 299
Source: Fedeleche (Chilean Milk Producers Asociation)
Company
(Product Types) Sales (US$)
2004 End-Use Channels
Production Location(s)
Procurement Channels
Nestle (dairy, confectionery, cereals, dehyd.
soups)
US$500 million Retail Chile (7) Direct (Local and Foreign),
Distributors (Local and Foreign)
Soprole (milk, dairy products)
US$177 million Retail Chile (4) N/A
Colún (Milk, dairy products)
US$193 million Retail Chile (2) N/A
4) Prepared Fruit, Prepared Vegetables, Oilseed Products (Sauces, Oils and Other Frozen, Canned and Dried Products) This food market is dominated by those companies that export the most:

GAIN Report - CI6003 Page 14 of 26
UNCLASSIFIED USDA Foreign Agricultural Service
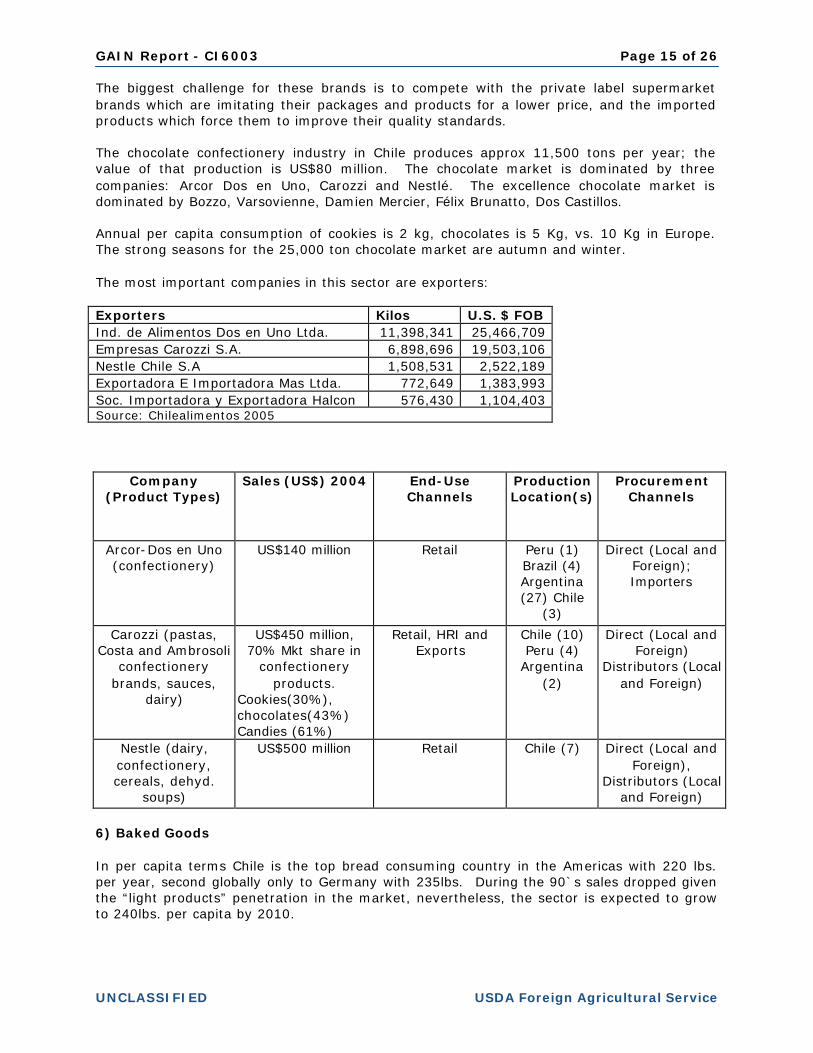
Frozen Food Exporters Kilos U.S. $ FOB Comercial Fruticola S.A. 12,484,057 21,833,923 Fruticola Olmue S.A. 5,742,995 10,895,340 Alimentos Naturales Vitafoods 4,750,505 9,447,142 Exportadora Frucol Ltda. 5,769,886 7,930,056 Soc. Agroindustrial Valle Frio Ltda. 5,133,348 7,345,336 Arlavan S.A. 5,368,495 7,022,468 Source: Chilealimentos 2005 Canned Food Exporters Kilos U.S. $ FOB Empresas Carozzi S.A. 87,009,674 56,688,334 Aconcagua Foods S.A. 74,648,032 56,623,057 Conservera Pentzke S.A. 24,111,375 22,866,167 Agrofrut Rengo S.A. 15,133,143 15,152,888 Agroindustrias Lafken S.A. 5,979,926 10,137,163 Alimentos Indal S.A. 8,352,030 6,372,473 Watt’s S.A. 7,179,594 6,199,256 Source: Chilealimentos 2005 Dried Products Exporters Kilos U.S. $ FOB Prunesco S A 10,650,193 26,304,462 Frutas De Exportación S A 12,249,388 25,279,938 Productos Silvestres Ltda. 9,102,181 16,183,225 Pacific Nut Company Chile S A 4,288,927 16,083,756 Invertec Foods S A 2,838,850 12,750,699 Del Monte Fresh Produce (Chile) 6,124,356 11,235,206 Hojas Export Limitada 3,106,924 10,292,180 Source: Chilealimentos 2005 The oilseed market is estimated at US$110 million of which Watt’s has 35% market share and Luchetti 17%, while Carozzi has 25% in tomato sauce. Prepared fruit, prepared vegetables, oilseed products and other frozen, canned and dried products have an exportation focus. It is estimated that by the year 2010 Chile will be exporting US$2 billion of processed food in total. 5) Confectionery Products The confectionery market in Chile is estimated in US$350 million, (64,000 tons) with an annual growth of 3%. The main brands are Arcor Dos en Uno, Costa (Carozzi) and Ambrosoli (Carozzi). The prices are the lowest in Latin America because it is a very competitive market. Carozzi has 30% of the cookie market, 43% of the chocolate market and 61% of the candy market. The latter represents 40% of Carozzi’s total income.
GAIN Report - CI6003 Page 15 of 26
UNCLASSIFIED USDA Foreign Agricultural Service
The biggest challenge for these brands is to compete with the private label supermarket brands which are imitating their packages and products for a lower price, and the imported products which force them to improve their quality standards. The chocolate confectionery industry in Chile produces approx 11,500 tons per year; the value of that production is US$80 million. The chocolate market is dominated by three companies: Arcor Dos en Uno, Carozzi and Nestlé. The excellence chocolate market is dominated by Bozzo, Varsovienne, Damien Mercier, Félix Brunatto, Dos Castillos. Annual per capita consumption of cookies is 2 kg, chocolates is 5 Kg, vs. 10 Kg in Europe. The strong seasons for the 25,000 ton chocolate market are autumn and winter. The most important companies in this sector are exporters: Exporters Kilos U.S. $ FOB Ind. de Alimentos Dos en Uno Ltda. 11,398,341 25,466,709 Empresas Carozzi S.A. 6,898,696 19,503,106 Nestle Chile S.A 1,508,531 2,522,189 Exportadora E Importadora Mas Ltda. 772,649 1,383,993 Soc. Importadora y Exportadora Halcon 576,430 1,104,403 Source: Chilealimentos 2005
Company (Product Types)
Sales (US$) 2004 End-Use Channels
Production Location(s)
Procurement Channels
Arcor-Dos en Uno (confectionery)
US$140 million Retail Peru (1) Brazil (4) Argentina (27) Chile
(3)
Direct (Local and Foreign); Importers
Carozzi (pastas, Costa and Ambrosoli
confectionery brands, sauces,
dairy)
US$450 million, 70% Mkt share in
confectionery products.
Cookies(30%), chocolates(43%) Candies (61%)
Retail, HRI and Exports
Chile (10) Peru (4)
Argentina (2)
Direct (Local and Foreign)
Distributors (Local and Foreign)
Nestle (dairy, confectionery, cereals, dehyd.
soups)
US$500 million Retail Chile (7) Direct (Local and Foreign),
Distributors (Local and Foreign)
6) Baked Goods In per capita terms Chile is the top bread consuming country in the Americas with 220 lbs. per year, second globally only to Germany with 235lbs. During the 90`s sales dropped given the “light products” penetration in the market, nevertheless, the sector is expected to grow to 240lbs. per capita by 2010.
GAIN Report - CI6003 Page 16 of 26
UNCLASSIFIED USDA Foreign Agricultural Service
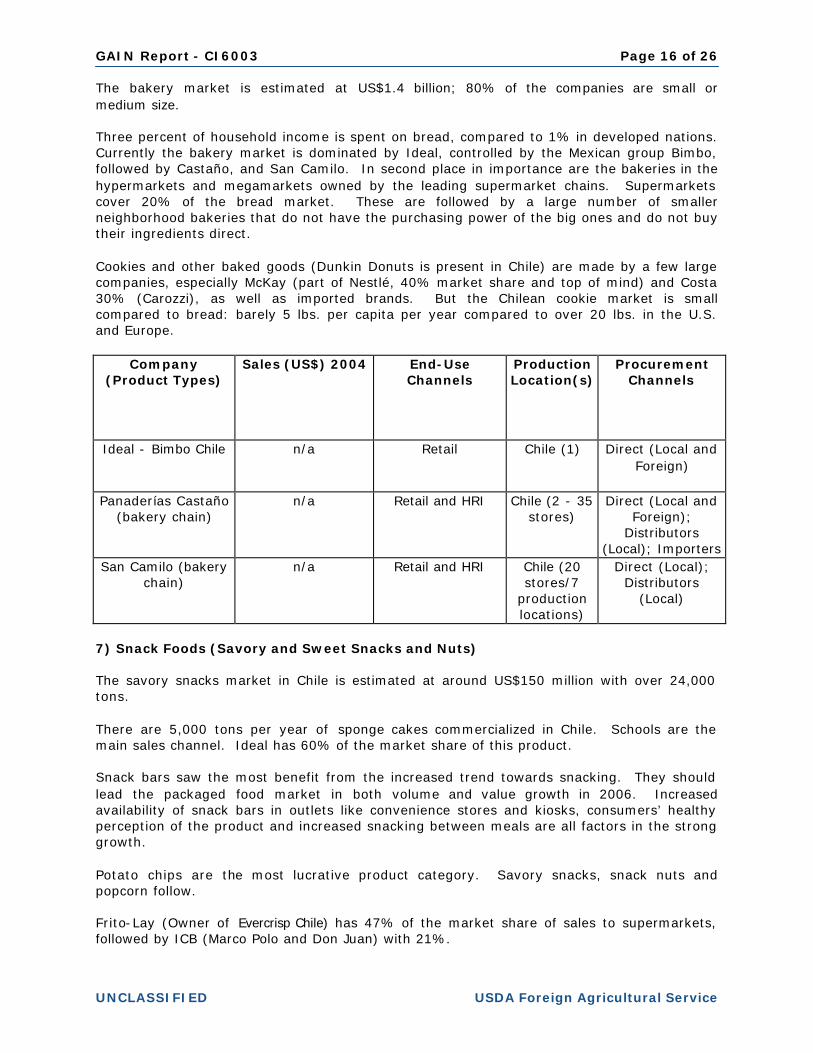
The bakery market is estimated at US$1.4 billion; 80% of the companies are small or medium size. Three percent of household income is spent on bread, compared to 1% in developed nations. Currently the bakery market is dominated by Ideal, controlled by the Mexican group Bimbo, followed by Castaño, and San Camilo. In second place in importance are the bakeries in the hypermarkets and megamarkets owned by the leading supermarket chains. Supermarkets cover 20% of the bread market. These are followed by a large number of smaller neighborhood bakeries that do not have the purchasing power of the big ones and do not buy their ingredients direct. Cookies and other baked goods (Dunkin Donuts is present in Chile) are made by a few large companies, especially McKay (part of Nestlé, 40% market share and top of mind) and Costa 30% (Carozzi), as well as imported brands. But the Chilean cookie market is small compared to bread: barely 5 lbs. per capita per year compared to over 20 lbs. in the U.S. and Europe.
Company (Product Types)
Sales (US$) 2004 End-Use Channels
Production Location(s)
Procurement Channels
Ideal - Bimbo Chile n/a Retail Chile (1) Direct (Local and Foreign)
Panaderías Castaño (bakery chain)
n/a Retail and HRI Chile (2 - 35 stores)
Direct (Local and Foreign);
Distributors (Local); Importers
San Camilo (bakery chain)
n/a Retail and HRI Chile (20 stores/7
production locations)
Direct (Local); Distributors
(Local)
7) Snack Foods (Savory and Sweet Snacks and Nuts) The savory snacks market in Chile is estimated at around US$150 million with over 24,000 tons. There are 5,000 tons per year of sponge cakes commercialized in Chile. Schools are the main sales channel. Ideal has 60% of the market share of this product. Snack bars saw the most benefit from the increased trend towards snacking. They should lead the packaged food market in both volume and value growth in 2006. Increased availability of snack bars in outlets like convenience stores and kiosks, consumers’ healthy perception of the product and increased snacking between meals are all factors in the strong growth. Potato chips are the most lucrative product category. Savory snacks, snack nuts and popcorn follow. Frito-Lay (Owner of Evercrisp Chile) has 47% of the market share of sales to supermarkets, followed by ICB (Marco Polo and Don Juan) with 21%.

GAIN Report - CI6003 Page 17 of 26
UNCLASSIFIED USDA Foreign Agricultural Service
Company
(Product Types) Sales (US$) 2004 End-Use
Channels Production Location(s)
Procurement Channels
Evercrisp (Frito-Lay - snack foods)
N/A Retail and HRI Chile (1) N/A
ICB Marcopolo (Café do Brasil - snacks,
nuts)
US$110 million Retail and HRI Chile (3) Direct (Local and Foreign)
8) Beverages, Non-Alcoholic During 2005 the sector sold US$1.05 billion, amounting to 1.8 billion liters of which 85% were carbonated beverages, 9% mineral water and 6% juices and nectars. Chileans consumed on average 111 liters per capita of non alcoholic beverages in 2005; including 94 liters of carbonated beverages, 10 liters of mineral water and seven liters of juices and nectars. Non-alcoholic beverages are the third most consumed food and beverage category by Chileans, after bread and meat. They are distributed through traditional channels (63%), supermarkets (25%) and consumption in food establishments (12%). Last year, Coca-Cola (including Embonor and Polar) had a 65.6% soft drink market share, followed by Ecusa (CCU-Pepsi) with 21.5%. According to Feller Rate in mineral water, Ecusa has 64% market share (brands Cachantún and Porvenir); followed by Andina (Vital). In juices and desserts, Carozzi is the most important player with 60% of the market. According to the Association of non-alcoholic beverages (Anber) there is room for new products, especially under the health and sport concept, such as mineral waters or light/diet beverages which are growing over 10% per year. Also consumption of energy beverages is becoming a new trend in Chile, representing 1% of the market with 155,000 cans sold per month.
Company (Product Types)
Sales (US$) 2004
End-Use Channels
Production Location(s)
Procurement Channels
Coca-Cola Embonor (non alc. beverages)
US$160 million Retail and HRI Chile (6) Bolivia (6)
Direct (Local and Foreign)
Embot. Andina (Coca-Cola, non alc.
beverages)
US$559 million Retail Chile (3) Brazil (2) Argentina
(2)
Direct (Local and Foreign)
Embotelladora Coca-Cola Polar (non alc.
beverages)
US$133 million Retail Chile (3) Argentina
(4)
Direct (Local); Distristributors
(Local); Importers
9) Beverages, Alcoholic The Chilean beer market is estimated at US$450 million and the annual consumption per capita is about 27 liters. Only10% of this market is Premium. Compañía de Cervecerías Unidas (CCU) owned by the Luksic group, has a 90% share of the market, followed by Cervecerías Chile, controlled by Inbev with 10%.

GAIN Report - CI6003 Page 18 of 26
UNCLASSIFIED USDA Foreign Agricultural Service
35% of beer sales are registered during the summer season, specially from December to February. In Chile only five of the 44 types of beer that exist are produced. Wine and alcohol exports grew from US$840 million in 2004 to US$890 million during 2005. However, future growth will not be helped by the weak dollar and cannibalism among Chilean wineries with foreign importers (US and European importers usually take on a new Chilean wine at the expense of another Chilean winery). Consumption in Chile is a very low 16 liters per capita (compared to England 22 liters or Argentina 40 liters), so wineries are trying to increase this consumption and to specifically incentivize the consumption of premium wines. Main Wine Exporters Jan- Oct 2005
Company Million US$ Viña Concha y Toro S.A. 110.2 Viña San Pedro S.A. 34.1 Viña Santa Rita S.A. 33.6 Viña Cono Sur Ltda. 27.5 Viña Errázuris Panquehue S.A. 19.3 Viña Undurraga S.A. 18.4 Viña Montes S.A. 17.9 Viña Carmen S.A. 16.4 Viña Tarapacá Ex Zavala S.A. 15.8 Vinos de Chile S.A. Vinex 13.6 Viña Santa Carolina S.A. 11.1 Viña Valdivieso S.A. 10.4 Viña La Rosa S.A. 10.4 Viña Los Vascos S.A. 10.3 Bodegas y Viñedos Sta. Emiliana 10.1 Source: El Mercurio
In the pisco market, CCU had 17% with Ruta Norte and Ruta Sour, competing with Control and Capel, pisco companies of a long tradition that used to share, in almost equal parts, a US$150 million market. In 2005 CCU agreed to buy 80% of Capel, becoming the biggest actor in the sector with a 50% market share. Licores Mitjans and Fehrenberg (Empresas Santa Carolina) are the leading liqueur manufacturers competing with abundant imports.
Company (Product Types)
Sales (US$) 2004
End-Use Channels
Production Location(s)
Procurement Channels
Viña Concha y Toro $338 million Retail, HRI and Exports
Chile (10) Distributors (Local); Importers
CCU $700 millions (Including wine (Viña San Pedro
and 3 more), beer (47% of total sales)
non alcoholic
Retail and HRI Chile (19) Distributors (Local); Importers

GAIN Report - CI6003 Page 19 of 26
UNCLASSIFIED USDA Foreign Agricultural Service
beverages and confectionary
products 10) Dry Goods and Condiments (Canned Soup, Dry Mixes, Pasta, Pet Food, Seasonings) The condiment market is estimated at US$20 million. ICB is the leader with its brands Don Juan and Marco Polo with 39% of the sector sales, followed by Gourmet, a Chilean company founded in 1958 with sales of US$ 6 million. Other brands include Sabu, McCormick, Frutisa, Carmencita, the Italian Drogheria & Alimentari and the supermarket brands. Almost all of the seasonings are imported from different countries worldwide. Chile is the third largest country in per capita pasta consumption with 8.7 Kg per person per year. Production of pasta in Chile achieves 130,000 tons, exporting only 18,000. Carozzi is the most important company in the pasta sector, with 51% of market share and close to 100% of penetration in Chilean homes. In 2003 Carozzi bought Parma, adding 9% of the market share. Lucchetti (now called Indalsa owned by Córpora Tres Montes) is the second company with 36% of the pasta market. Close to 75% of the pasta is sold through supermarkets, the rest through traditional retailers.
Company (Product Types)
Sales (US$) 2004 End-Use Channels
Production Location(s)
Procurement Channels
Carozzi (pastas, confectionery, sauces, dairy)
US$450 million Retail, HRI and Exports
Chile (6) Peru (3)
Argentina (3)
Direct (Local and Foreign)
Distributors (Local and Foreign)
Lucchetti (pasta) N/A Retail, HRI and Exports
Chile (3) Direct (Local and Foreign)
ICB (Marco Polo, Don Juan)
US$110 million Retail and HRI Chile (3) Direct (Local)
Canned soup is not as popular in Chile as it is in the US, but powdered or dehydrated soup in envelopes is very popular. Maggi (Nestle) is the traditional leader, but others like Naturezza, Knorr and Ipal have gained market through heavy advertising. According to AC Nielsen, Chileans spend approximately US$35 per year in food for dogs and cats. However, 70% of the 4 million pet owners mix home food with pet food. In Chile there are 120,000 tons of pet food consumed annually amounting to US$120 million. Pet food points of sale are predominantly supermarkets, home centers, fairs (ferias), stores, pet shops and veterinary clinics. The main pet food importers that distribute to supermarkets and retail stores are Effem (Whiskas), Nestle (Friskies, Purina, Alpo), Café do Brazil (Canta Claro), and Pet Market (Bil Jac, Precept, ANF, Star Pro, Pet Time, Must, and Windy Hill). Major international brands such as Pedigree, Friskies, Whiskas Eukanuba and Champion are all present in the Chilean market.

GAIN Report - CI6003 Page 20 of 26
UNCLASSIFIED USDA Foreign Agricultural Service
Quality Brand Premium Alpo, Dog Chow, Pedigree,
Purina Mid-range Champ, Doko, Champion,
Master Dog Low-end Cachupin, Rocky With the FTA, U.S. pet foods gained preferential access as tariffs fell to zero. This put U.S. products on a more competitive footing with Argentina, by far the largest supplier to Chile with annual sales of nearly $17 million. 11) Specialized Food Ingredients (Additives, Preservatives, Thickeners, Sweeteners) This sector is increasingly controlled by Chinese products. Large companies such as Carozzi import most of their ingredients from China because it is cheaper even than buying locally. Cape Food is one of the important Chinese distributors of sweeteners in Chile, in additives Granotec is the leader and Hochschild distributes imported preservatives. U.S. products are not very popular because of their cost. Other important companies are: Duas Rodas of Brazil (coloring agents), Inducorn (Corn Products Chile), Lefersa, (Chilean yeast company), Puratos Chile (bakery, pastry and confectionery industry supplier) Iansa (sugar) and Cramer.
Company (Product Types)
Sales (US$) 2004 End-Use Channels
Production Location(s)
Procurement Channels
Cramer (colors, flavorings, thick,
etc.)
N/A Food Processor Companies, Beverages,
pharmaceutical laboratories, cosmetics, detergent
producers and Households
Chile (2) USA (1) and
11 other countries
Direct (Local and Foreign);
Distributors (Local and Foreign);
Importers
Duas Rodas Chile (food additives)
N/A Directly to food manufacturer
Brazil (2) Chile (1) Argentina
(1)
Direct (Local and Foreign)
Iansa (sugar) $224 million Retail and HRI Chile (12) Perú (1) Brasil (1)
Tomatoes and Fruit: Direct (Local); Own Production;
Sugar: Importers, Direct (Local)
GAIN Report - CI6003 Page 21 of 26
UNCLASSIFIED USDA Foreign Agricultural Service
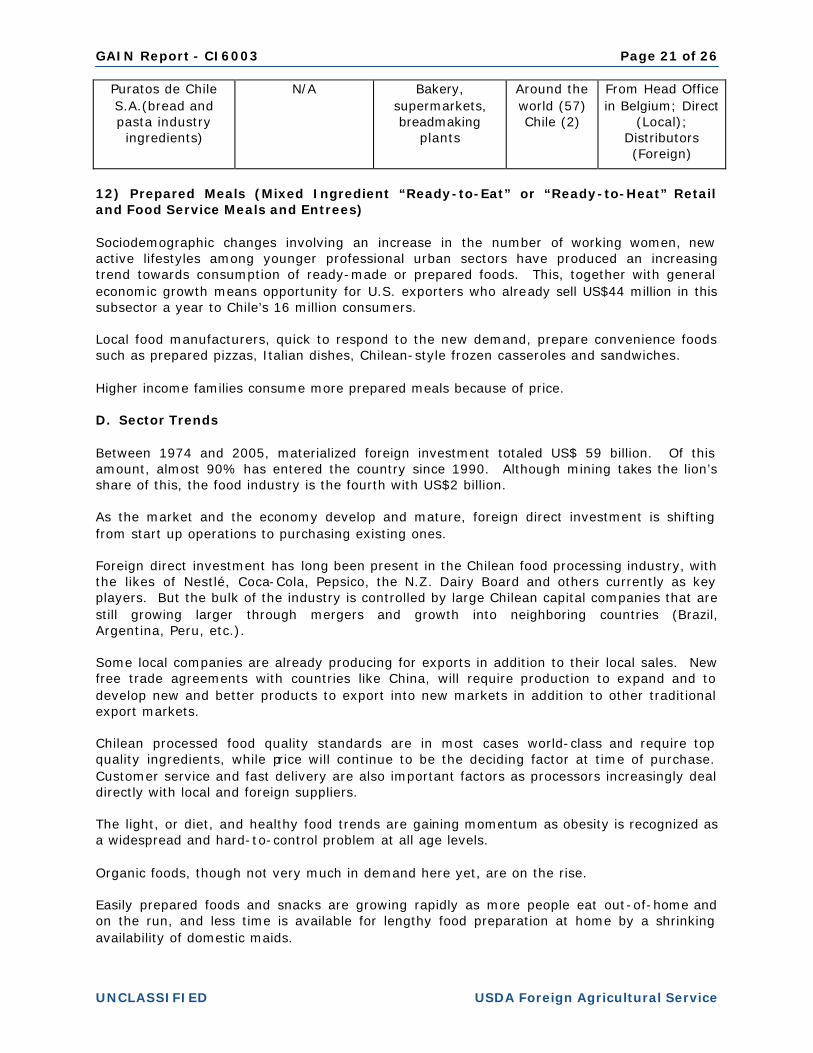
Puratos de Chile S.A.(bread and pasta industry ingredients)
N/A Bakery, supermarkets, breadmaking
plants
Around the world (57) Chile (2)
From Head Office in Belgium; Direct
(Local); Distributors (Foreign)
12) Prepared Meals (Mixed Ingredient “Ready-to-Eat” or “Ready-to-Heat” Retail and Food Service Meals and Entrees) Sociodemographic changes involving an increase in the number of working women, new active lifestyles among younger professional urban sectors have produced an increasing trend towards consumption of ready-made or prepared foods. This, together with general economic growth means opportunity for U.S. exporters who already sell US$44 million in this subsector a year to Chile’s 16 million consumers. Local food manufacturers, quick to respond to the new demand, prepare convenience foods such as prepared pizzas, Italian dishes, Chilean-style frozen casseroles and sandwiches. Higher income families consume more prepared meals because of price. D. Sector Trends Between 1974 and 2005, materialized foreign investment totaled US$ 59 billion. Of this amount, almost 90% has entered the country since 1990. Although mining takes the lion’s share of this, the food industry is the fourth with US$2 billion. As the market and the economy develop and mature, foreign direct investment is shifting from start up operations to purchasing existing ones. Foreign direct investment has long been present in the Chilean food processing industry, with the likes of Nestlé, Coca-Cola, Pepsico, the N.Z. Dairy Board and others currently as key players. But the bulk of the industry is controlled by large Chilean capital companies that are still growing larger through mergers and growth into neighboring countries (Brazil, Argentina, Peru, etc.). Some local companies are already producing for exports in addition to their local sales. New free trade agreements with countries like China, will require production to expand and to develop new and better products to export into new markets in addition to other traditional export markets. Chilean processed food quality standards are in most cases world-class and require top quality ingredients, while price will continue to be the deciding factor at time of purchase. Customer service and fast delivery are also important factors as processors increasingly deal directly with local and foreign suppliers. The light, or diet, and healthy food trends are gaining momentum as obesity is recognized as a widespread and hard-to-control problem at all age levels. Organic foods, though not very much in demand here yet, are on the rise. Easily prepared foods and snacks are growing rapidly as more people eat out-of-home and on the run, and less time is available for lengthy food preparation at home by a shrinking availability of domestic maids.

GAIN Report - CI6003 Page 22 of 26
UNCLASSIFIED USDA Foreign Agricultural Service
Section III. Competition The leading local products are produce, poultry and pork, a good variety of seafood (including salmon), fruits and wine. Imported products are mainly beef from Argentina, Brazil and Uruguay, and legumes and cereals such as corn and wheat from Argentina and Canada. Chileans still value freshness as much as possible but do consume large amounts of frozen food, mostly local, for storage convenience and year-round availability. Comparative Chilean Food and Agricultural Product Imports, 2004 vs. Jan- Nov 2005, Total Imports vs. US Imports, by Harmonized Tariff System chapters
2004 2005 2004 2005 2004 2005 Chapter Description (from HSC) Total, US$
CIF x 1000 Total, US$ CIF x 1000
U.S. US$ CIF x 1000
U.S. US$ CIF x 1000
US$ %
US$ %
1 Live Animals 4,386 4,068 1,479 2,198 33.7% 54%
2 Meat and edible meta offal
271,426 322,417 183 416 0.07% 0.1%
3 Fish, crustaceans & aquatic
invertebrates
13,731 15,475 179 188 1.3% 1.2%
4 Dairy prods; birds eggs; honey; ed. Animal pr. Nesoi
46,137 72,047 4,362 4,139 9.4% 5.7%
5 Products of animal origin, nesoi
25,685 28,918 1,543 2,122 6.0% 7.3%
6 Live trees, plants, bulbs etc.: cut
flowers, etc.
7,416 7,872 634 379 8.5% 4.8%
7 Edible vegetables & certain rotos &
tubers
17,842 21,944 143 2,181 8% 10%
8 Edible fruits & nuts; citrus fruti and melon peel
45,332 50,782 6,777 7,709 15% 15.1%
9 Coffee, tea, mate & spices
42,676 51,684 880 502 2.0% 1.0%
10 Cereals 234,246 217,302 11,489 11,502 5.0% 5.3% 11 Milling products;
malt; starch; inulin; wheat
gluten
12,594 19,347 247 109 2.0% 0.6%
12 Oliz sedes, etc.; misc. Grains,
sedes, fruit, plant, etc.
83,411 8,129 386 3,584 4.6% 4.4%
13 Lac; gums, resins & other vegetable
sap & extract
11,472 12,719 3,203 3,612 28.0% 28.4%
14 Vegetables planting materials & products nesoi
188 245 65 12 0.03% 5.1%
15 Animal or vegetable fats,
Oliz etc. & waxes
245,127 21,579 10,628 652 4.3% 0.3%
16 Edible preparations of
29,119 31,299 341 347 1.2% 1.1%
GAIN Report - CI6003 Page 23 of 26
UNCLASSIFIED USDA Foreign Agricultural Service
meta, fish, crustaceans, etc.
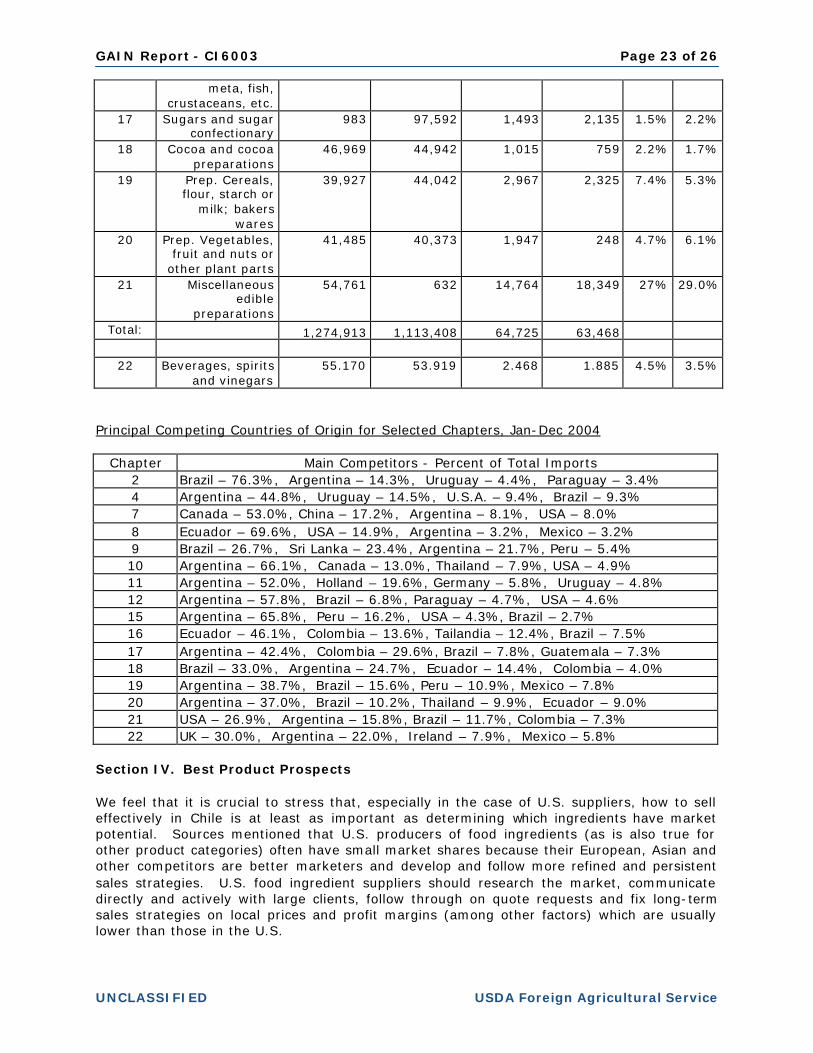
17 Sugars and sugar confectionary
983 97,592 1,493 2,135 1.5% 2.2%
18 Cocoa and cocoa preparations
46,969 44,942 1,015 759 2.2% 1.7%
19 Prep. Cereals, flour, starch or
milk; bakers wares
39,927 44,042 2,967 2,325 7.4% 5.3%
20 Prep. Vegetables, fruit and nuts or
other plant parts
41,485 40,373 1,947 248 4.7% 6.1%
21 Miscellaneous edible
preparations
54,761 632 14,764 18,349 27% 29.0%
Total: 1,274,913 1,113,408 64,725 63,468
22 Beverages, spirits and vinegars
55.170 53.919 2.468 1.885 4.5% 3.5%
Principal Competing Countries of Origin for Selected Chapters, Jan-Dec 2004
Chapter Main Competitors - Percent of Total Imports 2 Brazil – 76.3%, Argentina – 14.3%, Uruguay – 4.4%, Paraguay – 3.4% 4 Argentina – 44.8%, Uruguay – 14.5%, U.S.A. – 9.4%, Brazil – 9.3% 7 Canada – 53.0%, China – 17.2%, Argentina – 8.1%, USA – 8.0% 8 Ecuador – 69.6%, USA – 14.9%, Argentina – 3.2%, Mexico – 3.2% 9 Brazil – 26.7%, Sri Lanka – 23.4%, Argentina – 21.7%, Peru – 5.4% 10 Argentina – 66.1%, Canada – 13.0%, Thailand – 7.9%, USA – 4.9% 11 Argentina – 52.0%, Holland – 19.6%, Germany – 5.8%, Uruguay – 4.8% 12 Argentina – 57.8%, Brazil – 6.8%, Paraguay – 4.7%, USA – 4.6% 15 Argentina – 65.8%, Peru – 16.2%, USA – 4.3%, Brazil – 2.7% 16 Ecuador – 46.1%, Colombia – 13.6%, Tailandia – 12.4%, Brazil – 7.5% 17 Argentina – 42.4%, Colombia – 29.6%, Brazil – 7.8%, Guatemala – 7.3% 18 Brazil – 33.0%, Argentina – 24.7%, Ecuador – 14.4%, Colombia – 4.0% 19 Argentina – 38.7%, Brazil – 15.6%, Peru – 10.9%, Mexico – 7.8% 20 Argentina – 37.0%, Brazil – 10.2%, Thailand – 9.9%, Ecuador – 9.0% 21 USA – 26.9%, Argentina – 15.8%, Brazil – 11.7%, Colombia – 7.3% 22 UK – 30.0%, Argentina – 22.0%, Ireland – 7.9%, Mexico – 5.8%
Section IV. Best Product Prospects We feel that it is crucial to stress that, especially in the case of U.S. suppliers, how to sell effectively in Chile is at least as important as determining which ingredients have market potential. Sources mentioned that U.S. producers of food ingredients (as is also true for other product categories) often have small market shares because their European, Asian and other competitors are better marketers and develop and follow more refined and persistent sales strategies. U.S. food ingredient suppliers should research the market, communicate directly and actively with large clients, follow through on quote requests and fix long-term sales strategies on local prices and profit margins (among other factors) which are usually lower than those in the U.S.

GAIN Report - CI6003 Page 24 of 26
UNCLASSIFIED USDA Foreign Agricultural Service
A. Products Present in the Market Which Have Good Sales Potential - The U.S. food ingredients that have good market potential can be observed in the table below. In general, the food ingredients with the strongest market potential for U.S. producers are those that require fairly advanced processing technology and high quality standards. These products include coloring agents, flavorings, aromas, stabilizers and chemicals, certain dairy derivatives (weigh, etc.), spices and others. Less sophisticated products like dairy products are normally more competitive from nearby sources (e.g. Argentina, Brazil), but the U.S. has a strong chance with new-to-market products.
B. Products Not Present in Significant Quantities Which Have Good Sales Potential - U.S.
products that are still fairly unknown in the market but are being introduced by food chains such as T.G.I. Friday’s or Tony Roma’s, such as specialty cheeses and other ingredients, including sauces, have a good potential as the market continues becoming more global.
C. Products Not Present Because They Face Significant Barriers - There are very few
products not present in the market because of significant barriers. The main one is poultry because the Agricultural and Livestock Service has a non-specific Salmonella count that makes it difficult to import. Fresh meats in general are much more difficult to import than frozen or packaged processed meats for health regulation reasons. The U.S. and Chile are engaged in technical discussions and access for these products should open in the near future.
The table below includes best prospects where U.S. producers are already in the market and others where they should be able to compete if a stronger marketing effort is made. Key Food Ingredients with Potential for US Producers, Principal Competing Countries, Jan-Dec 2004
HS Code
Product
Total, US$ CIF x1000
US, US$ CIF x1000
US, Mkt.
Share
Main Competing Countries
0402.1000 Powdered milk with 1.5% or less fat
6,279 1,206 0.02% Uruguay-39%, Argentina 36%, Brazil 25%
0402.2118 Powdered milk with 26% or more fat
8,092 0.0 0.0% Argentina-87%, Uruguay 10%, New Zealand 2%
0404.1000 Whey 5,368 1,564 29% Argentina 24%, New Zealand 13%, Uruguay 11%
0406.1030 Mozzarella cheese 2,864 0.0 0.0% Argentina-55%, Brazil 40%, Uruguay 5%
0406.9010 Gouda cheese 4,051 0.0 0.0% Argentina-86%, Uruguay 13%, Germany 0.3%
0406.9090 Cheese, other 1,509 9.1 0.6% Argentina-28%, France-24%, Holland-11%
1001.1000 Durum wheat 15,151 0.0 0.0% Canada-97%, Argentina 2.5% 1001.9000 Wheat other than
Durum 29,617 7,258 24% Canada-36%, Argentina-35%,
Paraguay-3.6%, 1108.1200 Corn starch 2,709 193 7% Argentina-91%, France-1% 1109.0000 Wheat gluten 3,088 0.0 0.0% Holland-72%, Germany-15%, ,
France-7% 1502.0010 Animal fat, rendered 4,006 312 7.7% Uruguay-57%, Argentina-35% 1504.2010 Fish-liver oils, not 48,437 8,807 18% Peru-81%

GAIN Report - CI6003 Page 25 of 26
UNCLASSIFIED USDA Foreign Agricultural Service
refined 1509.9000 Olive oils, not virgin 964 3.7 0.3% Spain-61%, Argentina-32%,
Italy 6% 1516.2010 Vegetable fats and
their fractions 4,142 195 4.7% Ecuador-43%, Holland-23%,
Colombia-10% 1516.2020 Vegetable shortening 9,780 593 6% Sweden-25%, Ecuador-19%,
Colombia-17% 1517.9010 Vegetable oil mixtures,
not refined 47,543 0.0 0.0% Argentina-100%
1517.9020 Vegetable oil mixtures, refined
96,260 2.0 0.0% Argentina-99%, Malasia-0.1%
1517.9090 Mixes of animal with or without vegetable oils and fats
46,540 0.1 0.0% Argentina-77%, Denmark-5%, Spain-3%
1701.9910 Refined cane sugar 52,706 0.0 0.0 Colombia–42%, Argentina–26%, Brazil–10%
1702.3000 Glucose and glucose syrup, without fructose
1,704 151 8.8% Argentina-76%, France-10%, Germany-2%
1702.9090 Other sugars 1,502 3.6 0.2% Argentina-46%, Belgium-37%, Brazil-12%
1805.0000 Cocoa powder, not containing sugar or sweeteners
11,167 21.5 0.2% Ecuador-38%, Brazil-25%, Holland-9%
1905.9090 Bakery or pastry products nesoi
2,609 543 21% Argentina-31%, Brazil-11%, Germany-9%
2106.1010 Protein concentrates, not textured
6,562 4,523 69% Brazil-15%, New Zealand-12%, Argentina-1%
2106.9090 Edible preparations nesoi
22,178 6,724 30% Argentina-15%, Belgium-10%, Holland-9%,
Comparative Table, Key Food Ingredients with Potential for U.S. Producers, (2004 - Jan-Nov 2005) HS Code
2004 Total
US$CIF x1000
2005 Total
US$ CIF x1000
2004 US
US$ CIF x1000
2005 US
US$ CIF x1000
2004 US
Market Share
2005 US
Market Share
0402.1000 6,279 14,651 1,206 0.0 0.02% 0.0% 0402.2118 8,092 15,202 0.0 0.0 0.0% 0.0% 0404.1000 5,368 8,209 1,564 2,789 29% 34% 0406.1030 2,864 5,653 0.0 0.7 0.0% 0.0% 0406.9010 4,051 9,092 0.0 0.0 0.0% 0.0% 0406.9090 1,509 1,516 9.1 12 0.6% 0.8% 1001.1000 15,151 16,715 0.0 2,382 0.0% 14% 1001.9000 29,617 20,017 7,258 3,443 24% 17% 1108.1200 2,709 2,593 193 37 7% 1.4% 1109.0000 3,088 3,763 0.0 0.0 0.0% 0.0% 1502.0010 4,006 5,311 312 0.0 7.7% 0.0% 1504.2010 48,437 35,103 8,807 0.0 18% 0.0% 1509.9000 901 1,230 3.7 11.5 0.3% 0.9% 1516.2010 4,142 1,954 195 86.2 4.7% 4.4% 1516.2020 9,780 11,347 593 114 6% 1.0%

GAIN Report - CI6003 Page 26 of 26
UNCLASSIFIED USDA Foreign Agricultural Service
1517.9010 47,543 49,966 0.0 0.0 0.0% 0.0% 1517.9020 96,260 92,801 2.0 44 0.0% 0.0% 1517.9090 46,540 3,344 0.1 109 0.0% 3.2% 1701.9910 52,706 62,171 0.0 10 0.0% 0.0% 1702.3000 1,704 2,422 151 210 8.8% 8.7% 1702.9090 1,502 2,295 3.6 225 0.2% 10% 1805.0000 11,167 9,403 21.5 23 0.2% 0.2% 1905.9090 2,609 4,046 543 638 21% 16% 2106.1010 6,562 12,111 4,523 7,382 69% 61% 2106.9090 22,178 28,075 6,724 8,472 30% 30% NOTE: The Customs Data presented in the tables above can be obtained for any product, importer or recent time period through the U.S. Commercial Service Santiago post by contacting the Santiago Foreign Agricultural Service office. Wheat - Per capita wheat consumption is 140 kilograms per year. Chileans are the largest consumers per capita of bread in the Western Hemisphere. Although wheat production in Chile increased significantly over the past decade, due to a combination of increased seeded area and improved yields, imports from the U.S. could grow as the tariffs for U.S. wheat drop and the protective tariffs against wheat flour are phased out as mandated by the WTO. Pulse and Specialty Crops - During the past decade, Chile's production of pulse and specialty crops have decreased significantly and imports have increased. Dry peas and lentils, for example, were previously grown domestically in fairly large quantities but are now mostly imported. Though a large portion of pulse or dried legumes has been coming from Canada, the new U.S.-Chile FTA is expected to make U.S. suppliers more competitive in the Chilean market. Dairy products and ingredients (such as whey as mentioned above) from the U.S. have good potential, as do confectionery and baking ingredients. High-quality glazes were one such product. Section V. Post Contact and Further Information Mailing Address: Office of Agricultural Affairs U.S. Embassy, Santiago Unit 4118 APO AA 34033-4118 Street Address: Office of Agricultural Affairs U.S. Embassy, Santiago Av. Andres Bello 2800 – Las Condes Santiago, Chile Tel.: (56 2) 330-3704 Fax: (56 2) 330-3203 E-mail: [email protected] Websites: http://www.usembassy.cl; U.S. Embassy Santiago homepage. First click on “Food & Agriculture”, then click on “Marketing Reports” for research reports, and other pages for trade leads, contacts in Chile and more. http://www.fas.usda.gov; Foreign Agricultural Service homepage.


![VCRMP Recharge Basics (September 2011) [Read-Only] · – Salaries, wages, benefits, supplies, equipment depreciation and other costs associated with providing products or services](https://static.fdocuments.us/doc/165x107/5e6d8c6fa7e8e032897789c3/vcrmp-recharge-basics-september-2011-read-only-a-salaries-wages-benefits.jpg)