USDA Food Composition and Nutrient Databases€¦ · USDA Food Composition and Nutrient Databases...
36
1 USDA Food Composition and Nutrient Databases David B. Haytowitz Joanne M. Holden Agricultural Research Service Workshop Agenda A Bit of Food Comp History! What’s New: SR highlights Single Ingredient Meat Labeling Website tour NFNAP: Sodium Monitoring in Foods Exercise - Compositing Flavonoids Database: Version 3 release DSID-2 and Website Tour Q&A?
Transcript of USDA Food Composition and Nutrient Databases€¦ · USDA Food Composition and Nutrient Databases...
1
USDA Food Composition and Nutrient Databases
David B. Haytowitz
Joanne M. HoldenAgricultural
Research
Service
Workshop Agenda� A Bit of Food Comp History!
� What’s New:
� SR highlights
� Single Ingredient Meat Labeling
� Website tour
� NFNAP: Sodium Monitoring in Foods
� Exercise - Compositing
� Flavonoids Database: Version 3 release
� DSID-2 and Website Tour
� Q&A?
2
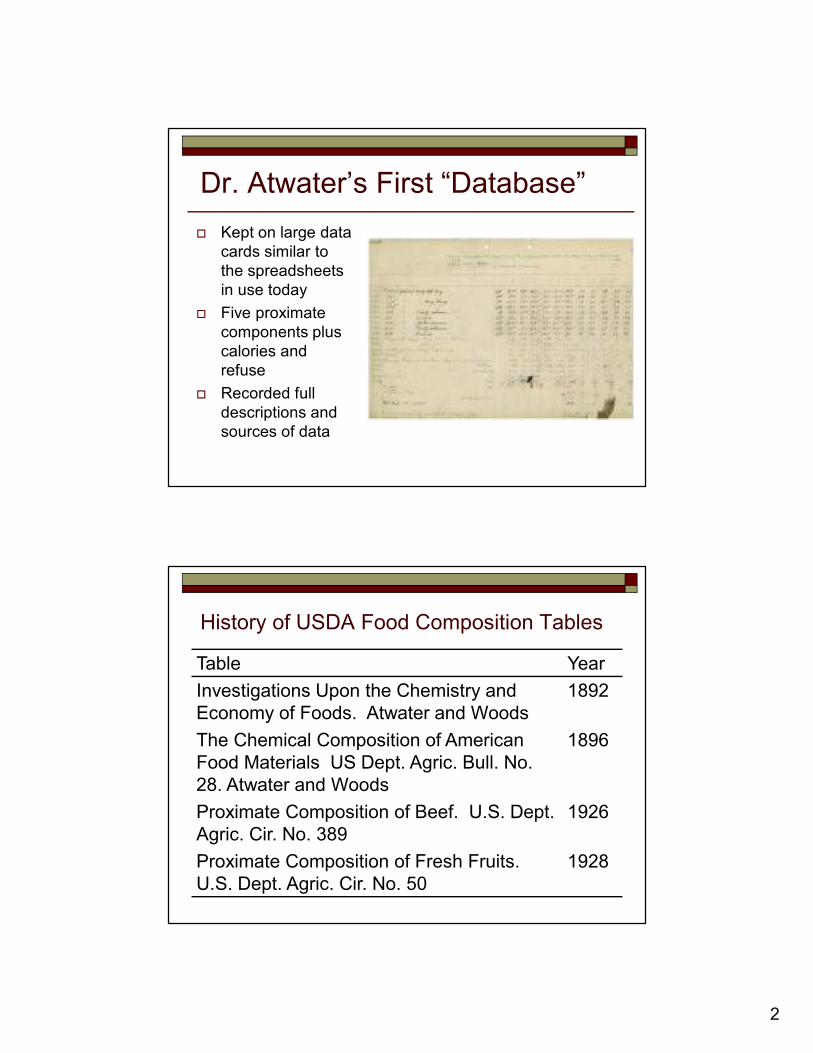
Dr. Atwater’s First “Database”
� Kept on large data cards similar to the spreadsheets in use today
� Five proximate components plus calories and refuse
� Recorded full descriptions and sources of data
History of USDA Food Composition Tables
Table Year
Investigations Upon the Chemistry and Economy of Foods. Atwater and Woods
1892
The Chemical Composition of American Food Materials US Dept. Agric. Bull. No. 28. Atwater and Woods
1896
Proximate Composition of Beef. U.S. Dept. Agric. Cir. No. 389
1926
Proximate Composition of Fresh Fruits. U.S. Dept. Agric. Cir. No. 50
1928
3
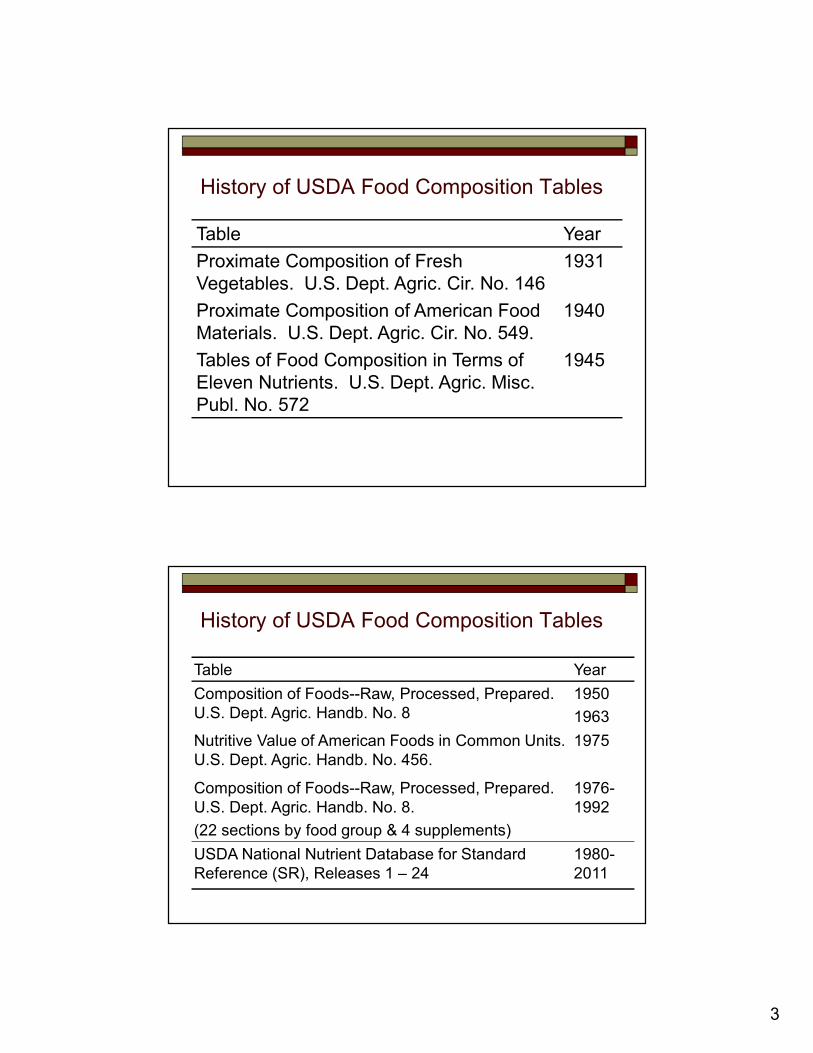
History of USDA Food Composition Tables
Table Year
Proximate Composition of Fresh Vegetables. U.S. Dept. Agric. Cir. No. 146
1931
Proximate Composition of American Food Materials. U.S. Dept. Agric. Cir. No. 549.
1940
Tables of Food Composition in Terms of Eleven Nutrients. U.S. Dept. Agric. Misc. Publ. No. 572
1945
History of USDA Food Composition Tables
Table Year
Composition of Foods--Raw, Processed, Prepared. U.S. Dept. Agric. Handb. No. 8
1950
1963
Nutritive Value of American Foods in Common Units. U.S. Dept. Agric. Handb. No. 456.
1975
Composition of Foods--Raw, Processed, Prepared. U.S. Dept. Agric. Handb. No. 8.
(22 sections by food group & 4 supplements)
1976-1992
USDA National Nutrient Database for Standard Reference (SR), Releases 1 – 24
1980-2011
4
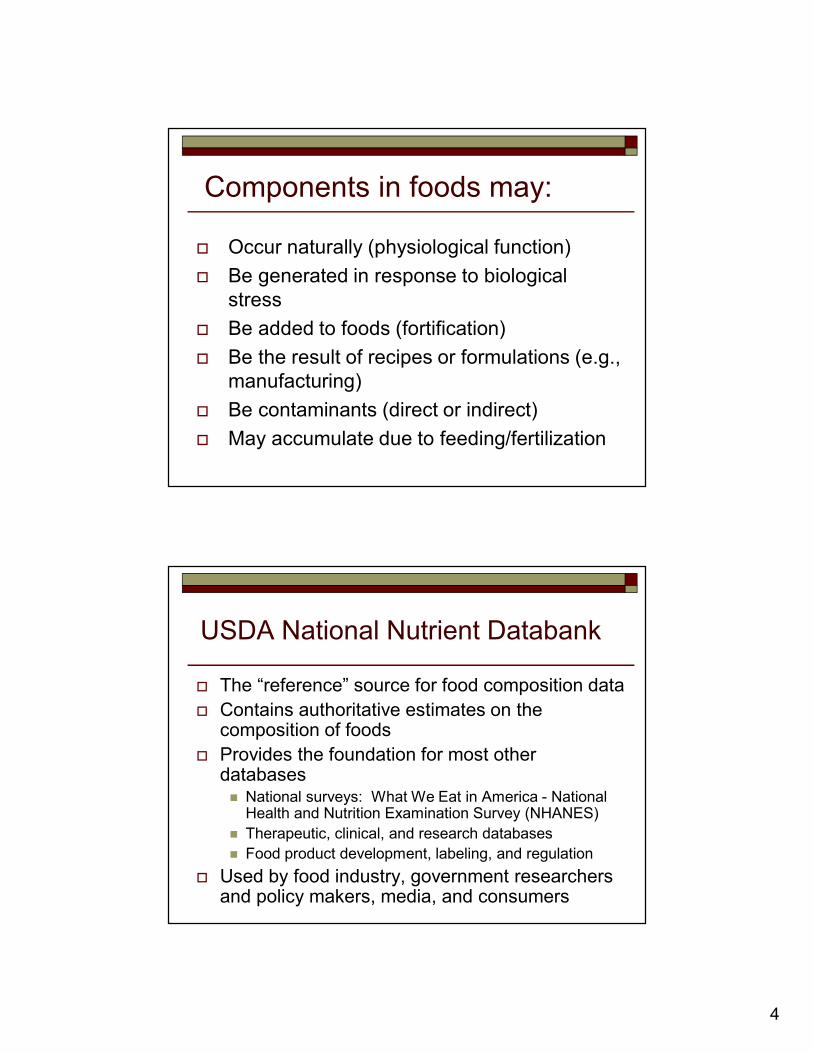
Components in foods may:
� Occur naturally (physiological function)
� Be generated in response to biological stress
� Be added to foods (fortification)
� Be the result of recipes or formulations (e.g., manufacturing)
� Be contaminants (direct or indirect)
� May accumulate due to feeding/fertilization
USDA National Nutrient Databank
� The “reference” source for food composition data
� Contains authoritative estimates on the composition of foods
� Provides the foundation for most other databases� National surveys: What We Eat in America - National
Health and Nutrition Examination Survey (NHANES)
� Therapeutic, clinical, and research databases
� Food product development, labeling, and regulation
� Used by food industry, government researchers and policy makers, media, and consumers
5
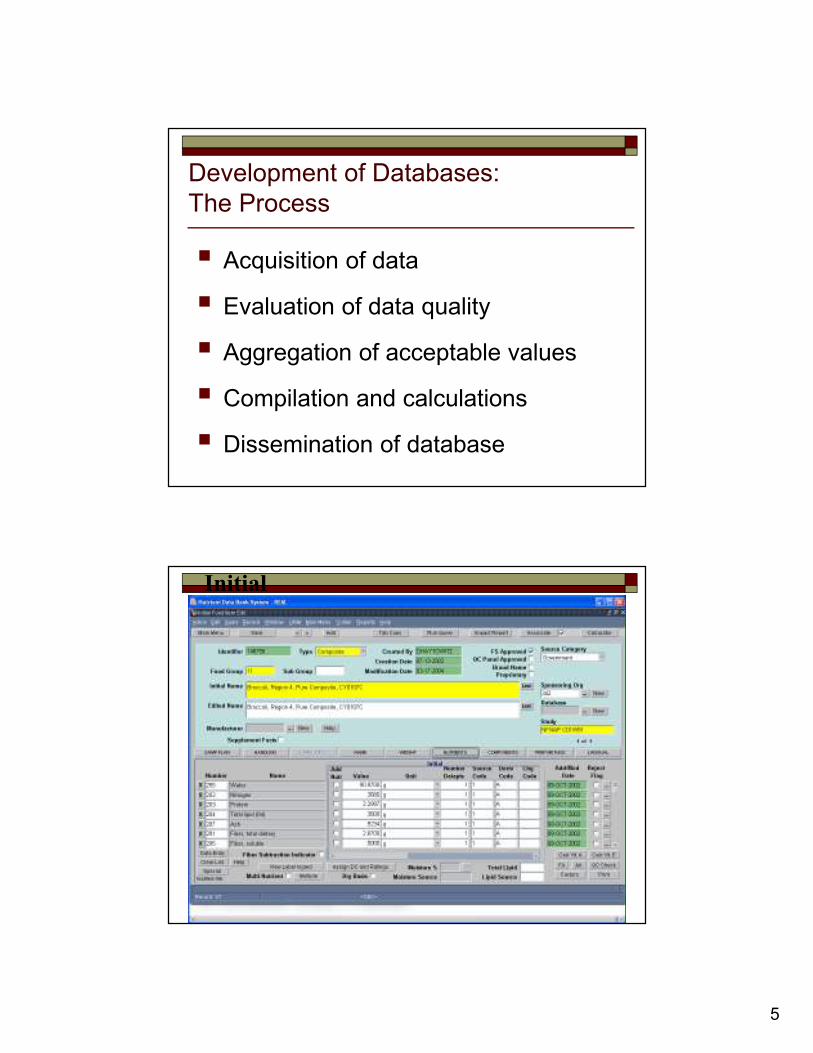
Development of Databases:The Process
� Acquisition of data
� Evaluation of data quality
� Aggregation of acceptable values
� Compilation and calculations
� Dissemination of database
Initial
6
Initial Food Item
� Complete food descriptions (original & edited)
� Common measures
� Component data (e.g. refuse)
� Original nutrient values converted to standard units
� Data Quality Evaluation System scores applied based on information entered
� Quality control/data validation must be run before release to next step
Aggregated Food Item
� Nutrient, weight and component data from multiple sources are combined into one record
� Database is queried by keywords or other information in the Initial Food item
� Data can be grouped and weighted
� Data from two or more companies can be weighted by market share
� Data on fresh produce can be weighted by production information.
7
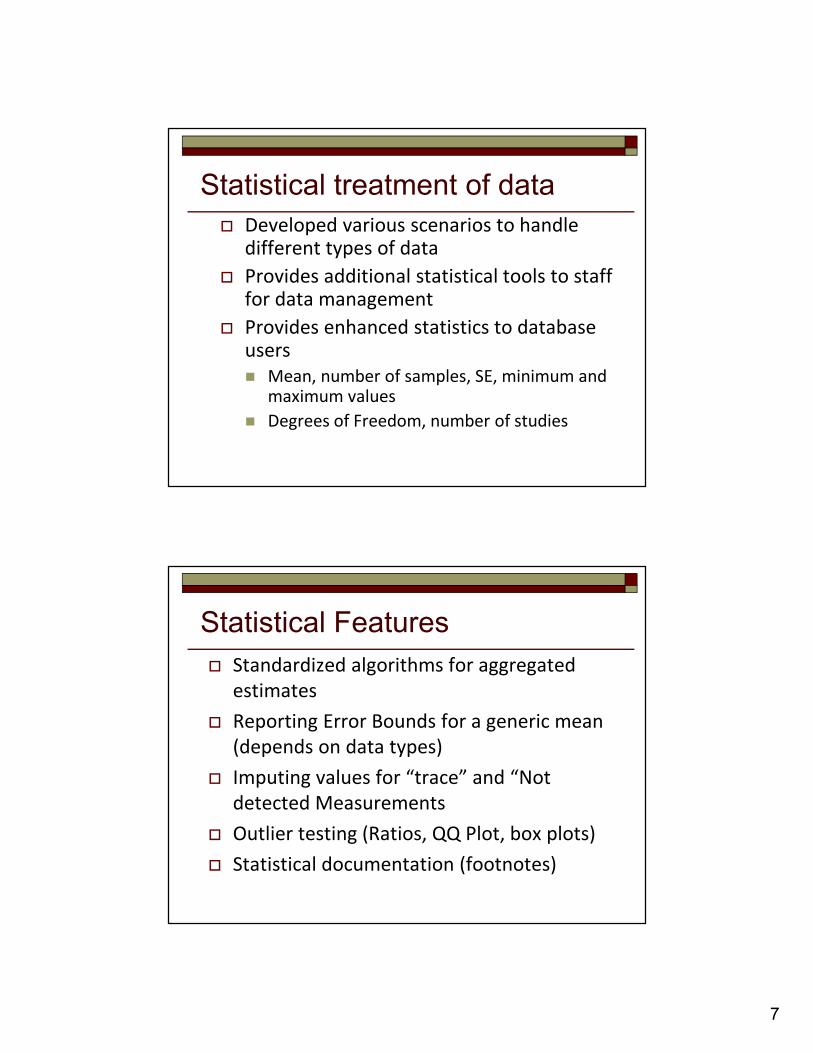
Statistical treatment of data
� Developed various scenarios to handle different types of data
� Provides additional statistical tools to staff for data management
� Provides enhanced statistics to database users
� Mean, number of samples, SE, minimum and maximum values
� Degrees of Freedom, number of studies
Statistical Features
� Standardized algorithms for aggregated
estimates
� Reporting Error Bounds for a generic mean
(depends on data types)
� Imputing values for “trace” and “Not
detected Measurements
� Outlier testing (Ratios, QQ Plot, box plots)
� Statistical documentation (footnotes)

8
Compiled Data
� All data elements about the food item are finalized
� Selected from approved aggregated items
� Can select data from more than one aggregated item, though
� Only one value for a nutrient can be used
� Items are marked to indicate release in SR and/or for use in Food and Nutrient Database for Dietary Surveys (FNDDS)
� Assign NDB Number
� Fill in missing values, particularly in items used in FNDDS which requires 65 components
Data Quality Control
� Selected tests performed before data can
be released:
� Sum of proximates should not be more than 100
� Sum of carbohydrate fractions should not exceed
value for total carbohydrates
� Sum of individual fatty acids should not exceed value
for total fat
� Sum of individual carotenoids times the appropriate
factors should not exceed vitamin A value
� Each food should have a refuse value, at least one
household measure
9
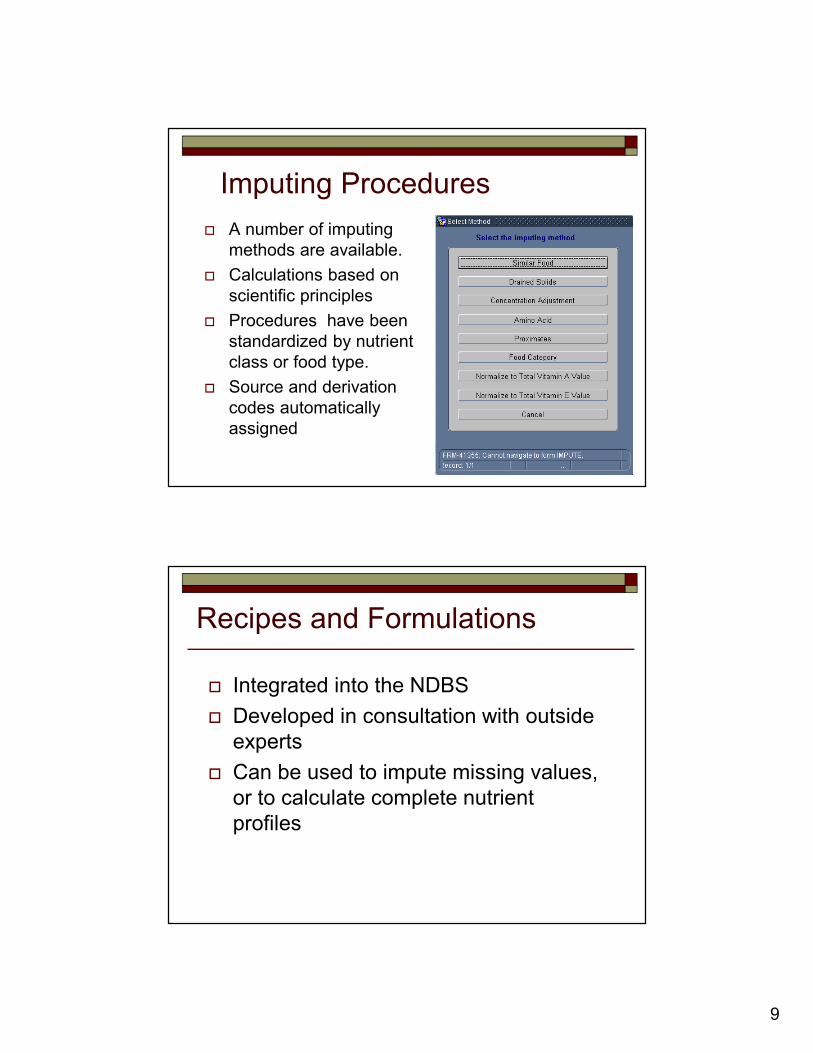
Imputing Procedures
� A number of imputing methods are available.
� Calculations based on scientific principles
� Procedures have been standardized by nutrient class or food type.
� Source and derivation codes automatically assigned
Recipes and Formulations
� Integrated into the NDBS
� Developed in consultation with outside experts
� Can be used to impute missing values, or to calculate complete nutrient profiles

10
Approvals and Dissemination� Data reports sent to experts for review:
� Brand name data to companies
� Commodity data to subject area experts
� Implement expert recommendations after careful consideredation
� Documentation sent for peer review
� Data disseminated
� ASCII files
� Microsoft Access database
� Update data for USDA search programs
NDBS Summary� System supports development of estimates on the
nutrient content of foods
� Maintains reservoir of documentation for data from various sources
� Major features
� Integrated modules
� Statistical treatment of data
� Formulations and recipes
� Data Quality Evaluation System
� Food yields and nutrient retention calculations
� Continual need for system upgrades and enhancements
11
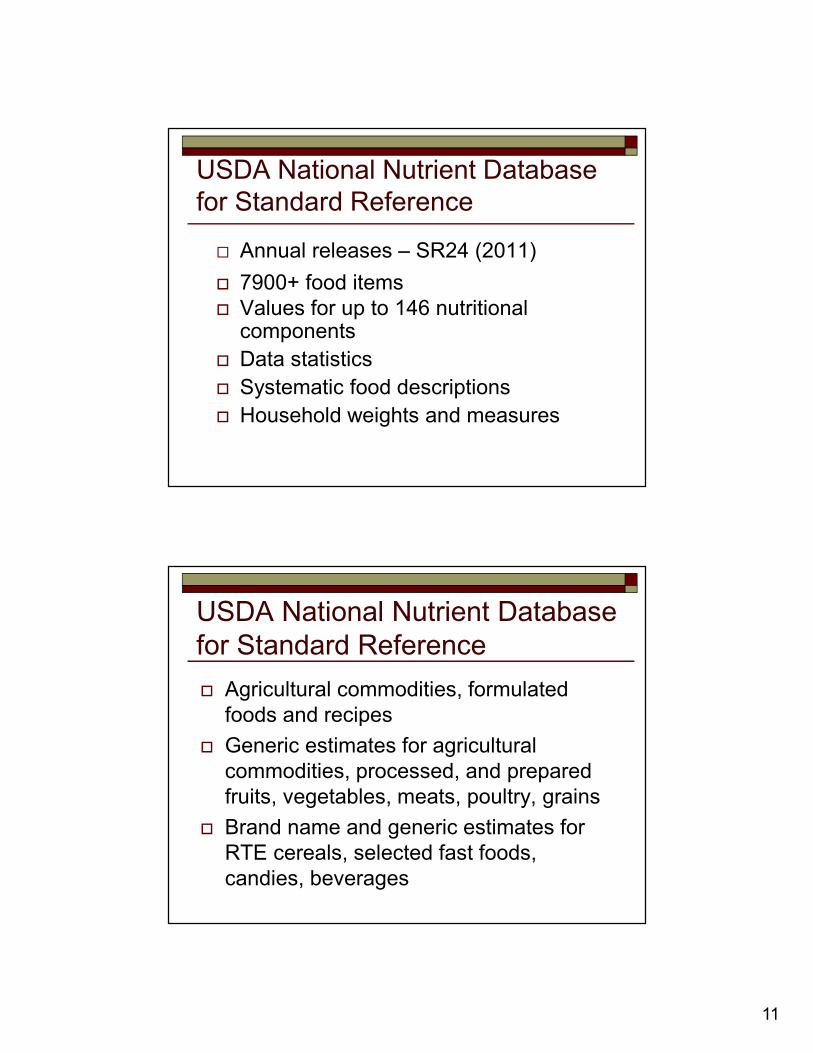
USDA National Nutrient Database for Standard Reference
� Annual releases – SR24 (2011)
� 7900+ food items� Values for up to 146 nutritional
components
� Data statistics
� Systematic food descriptions
� Household weights and measures
USDA National Nutrient Database for Standard Reference
� Agricultural commodities, formulated foods and recipes
� Generic estimates for agricultural commodities, processed, and prepared fruits, vegetables, meats, poultry, grains
� Brand name and generic estimates for RTE cereals, selected fast foods, candies, beverages
12
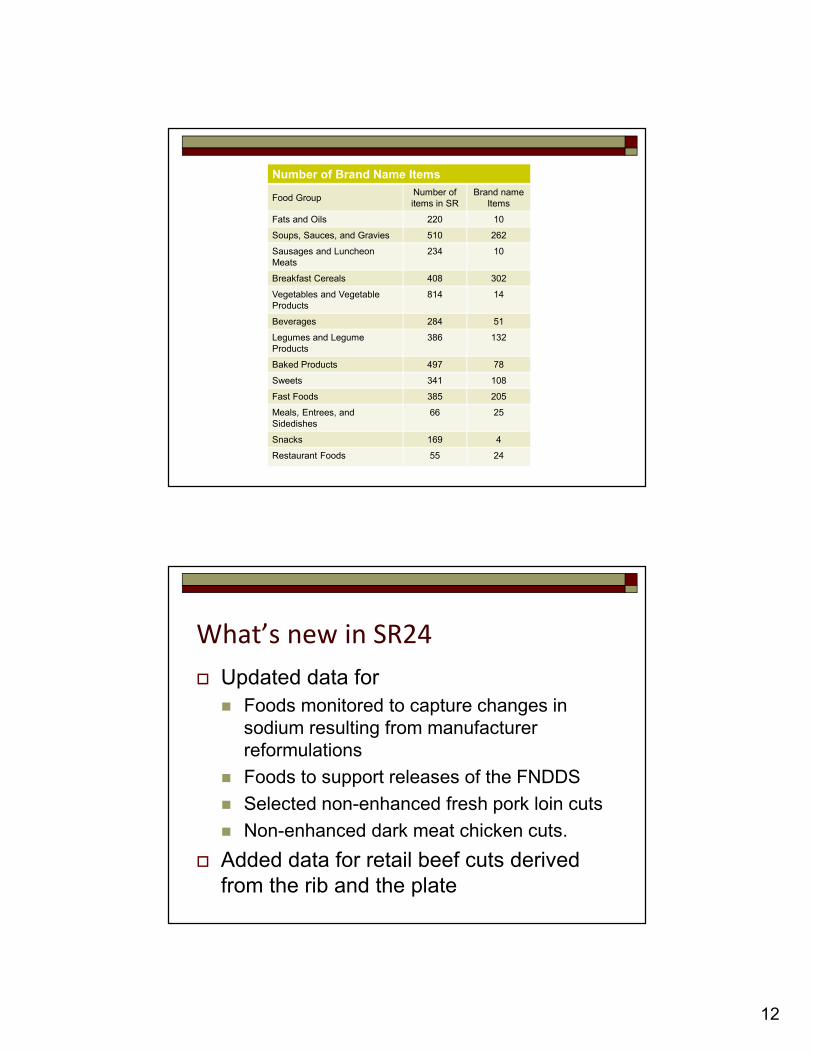
Number of Brand Name Items
Food GroupNumber of items in SR
Brand name Items
Fats and Oils 220 10
Soups, Sauces, and Gravies 510 262
Sausages and Luncheon Meats
234 10
Breakfast Cereals 408 302
Vegetables and Vegetable Products
814 14
Beverages 284 51
Legumes and Legume Products
386 132
Baked Products 497 78
Sweets 341 108
Fast Foods 385 205
Meals, Entrees, and Sidedishes
66 25
Snacks 169 4
Restaurant Foods 55 24
What’s new in SR24
� Updated data for
� Foods monitored to capture changes in sodium resulting from manufacturer reformulations
� Foods to support releases of the FNDDS
� Selected non-enhanced fresh pork loin cuts
� Non-enhanced dark meat chicken cuts.
� Added data for retail beef cuts derived from the rib and the plate
13
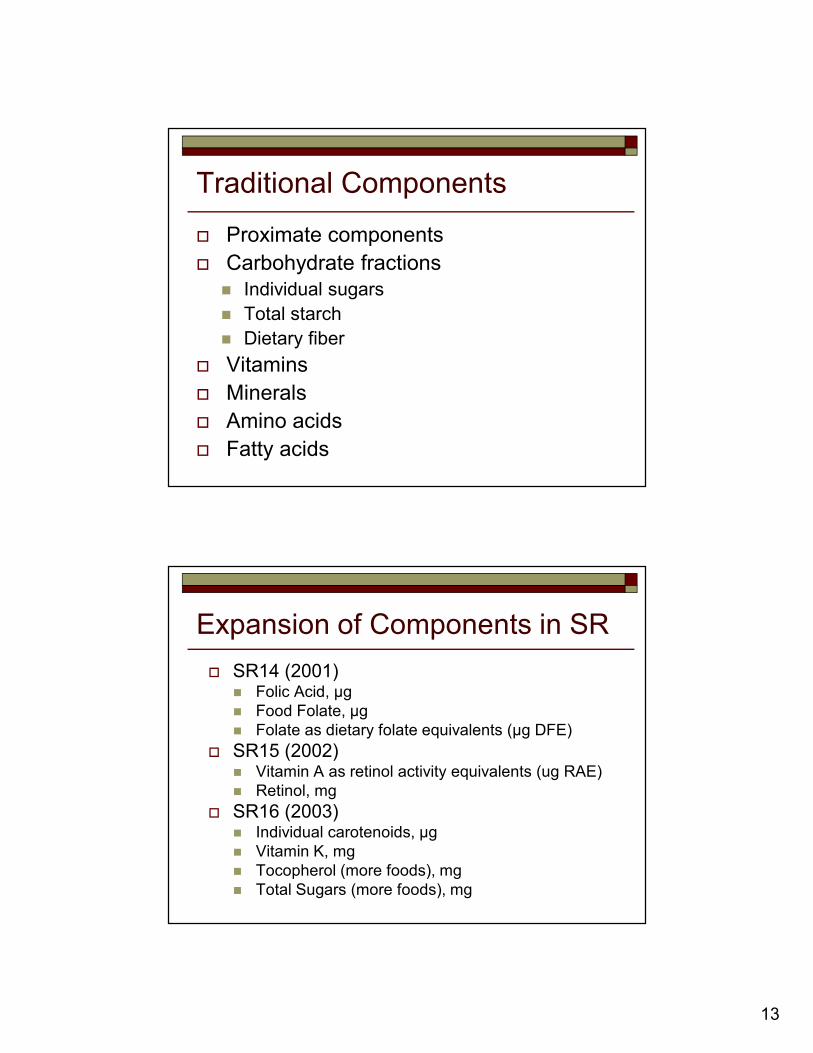
Traditional Components
� Proximate components
� Carbohydrate fractions� Individual sugars
� Total starch
� Dietary fiber
� Vitamins
� Minerals
� Amino acids
� Fatty acids
Expansion of Components in SR
� SR14 (2001)� Folic Acid, µg � Food Folate, µg � Folate as dietary folate equivalents (µg DFE)
� SR15 (2002)� Vitamin A as retinol activity equivalents (ug RAE) � Retinol, mg
� SR16 (2003)� Individual carotenoids, µg� Vitamin K, mg� Tocopherol (more foods), mg� Total Sugars (more foods), mg
14
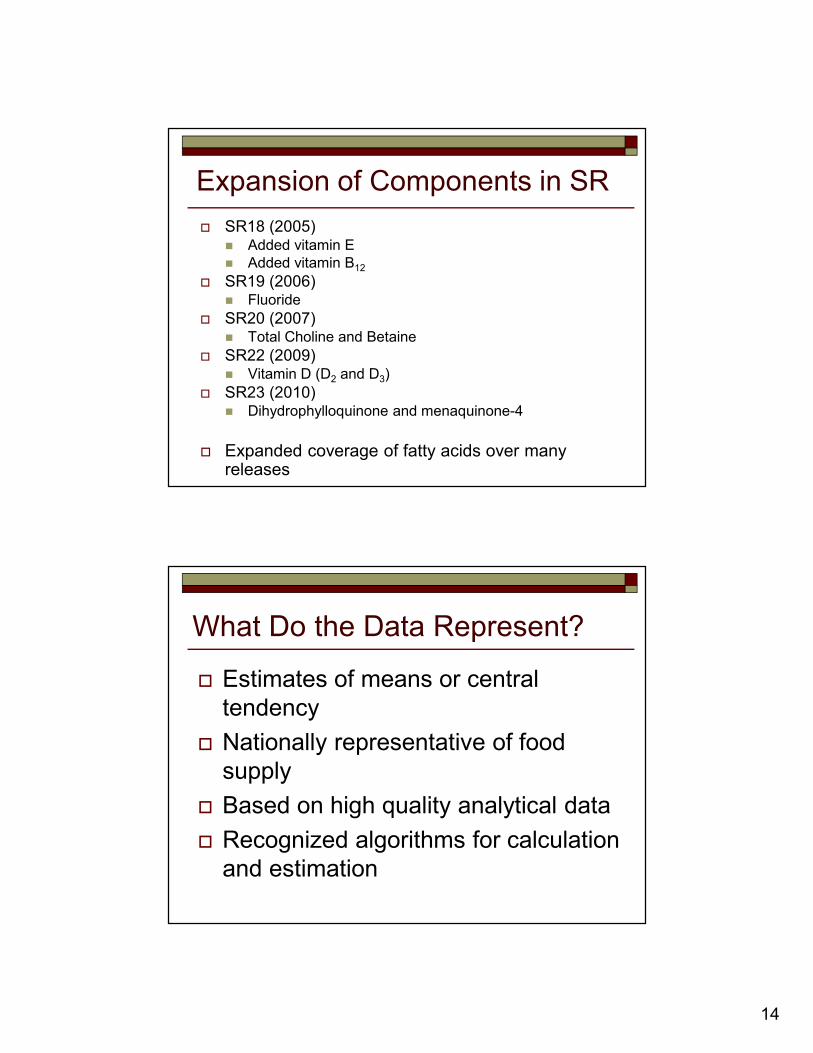
Expansion of Components in SR
� SR18 (2005)� Added vitamin E� Added vitamin B12
� SR19 (2006)� Fluoride
� SR20 (2007)� Total Choline and Betaine
� SR22 (2009)� Vitamin D (D2 and D3)
� SR23 (2010)� Dihydrophylloquinone and menaquinone-4
� Expanded coverage of fatty acids over many releases
What Do the Data Represent?
� Estimates of means or central tendency
� Nationally representative of food supply
� Based on high quality analytical data
� Recognized algorithms for calculation and estimation

15
Provision of Accurate and Current Data
� The U.S. food supply is constantly changing� New products are introduced � Existing products are reformulated
� Challenges for NDL:� Sodium reduction efforts � Changes in fortifications, including addition of vitamin D � Industry conversions to “trans-free” fats and oils
� NDL monitors industry changes through: � Food industry publications� Re-sampling and analysis of selected key foods (e.g.,
white bread, snack crackers)� Requests to manufacturers for new data
Sources of Data & Information Flow
Analytical Projects
(NFNAP, FCMDL, FDA,
Industry)
Food Industry
Data
Data from
Scientific
Literature
Label
InformationDatabase
Imputations Formulations
Recipes Algorithms
Standard
Reference
(SR24)
Nutritive
Value of Foods
(HG72)
Special Releases(Flavonoids, Choline,
isoflavones)
Food and
Nutrient
Database for
Dietary
Surveys
(FNDDS)
16
Web Site Tour
USDA Food Composition and Nutrient Databases
National Food and Nutrient Analysis Program (NFNAP)
17
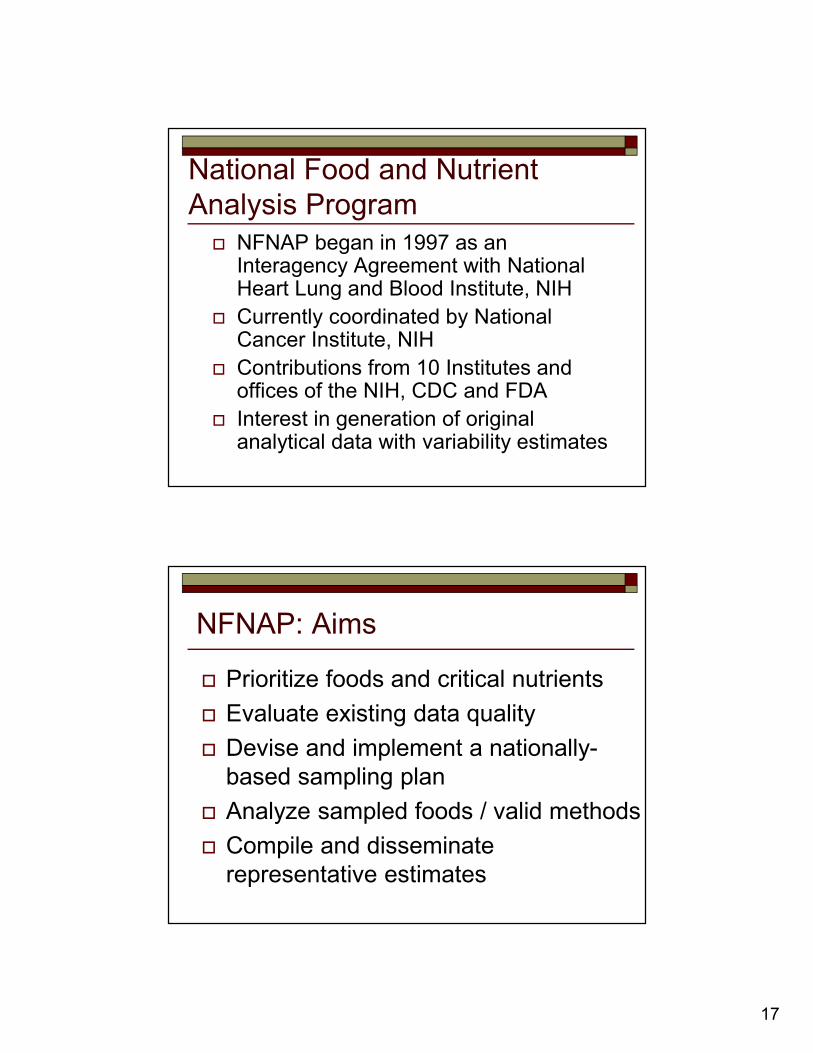
National Food and Nutrient Analysis Program
� NFNAP began in 1997 as an Interagency Agreement with National Heart Lung and Blood Institute, NIH
� Currently coordinated by National Cancer Institute, NIH
� Contributions from 10 Institutes and offices of the NIH, CDC and FDA
� Interest in generation of original analytical data with variability estimates
NFNAP: Aims
� Prioritize foods and critical nutrients
� Evaluate existing data quality
� Devise and implement a nationally-based sampling plan
� Analyze sampled foods / valid methods
� Compile and disseminate representative estimates

18
NFNAP: Aim 1
� Prioritize foods and critical nutrients
� Evaluate existing data quality
� Devise and implement a nationally-based sampling plan
� Analyze sampled foods / valid methods
� Compile and disseminate representative estimates
What are Key Foods?
� Frequency vs. concentration
� Foods alone and as ingredients
� Some foods are “key” for several nutrients
The list of foods which provide about 75% of the intake of a specific component to the diet

19
Key Foods – 1st Quartile1
� Egg, whole, raw, fresh
� Milk, reduced fat, fluid, 2% milkfat
� Milk, whole, 3.25% milkfat
� Carrots, raw
� Salt, table
� Cheese, cheddar
� Margarine, regular, 80% fat, composite, stick
� Rolls, hamburger or hotdog, plain
� Milk, nonfat, fluid (fat free or skim)
� Ice creams, vanilla
� Milk, lowfat, fluid, 1% milkfat
1 NHANES 2007-08
Examples of NFNAP Foods
� Fast food chicken and other items
� Pizza (restaurant and frozen)
� Luncheon meats
� Cheese
� Snacks, cookies, and breads
� Bacon
� Turkey
20
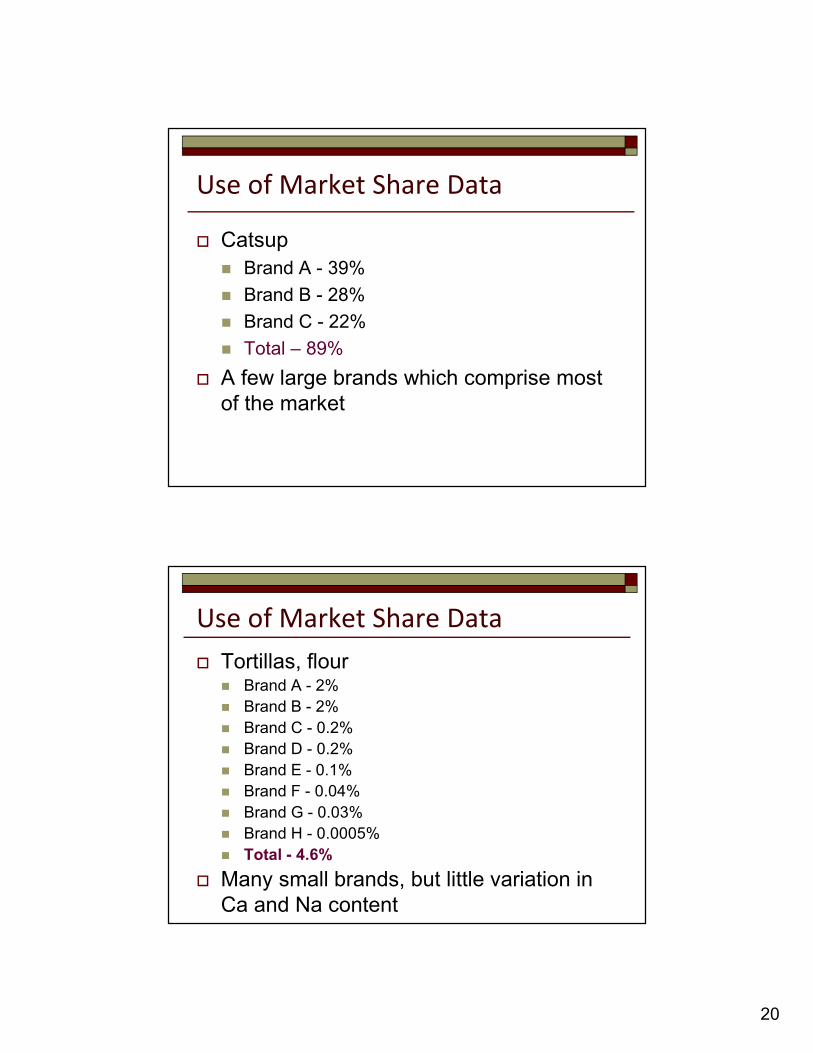
Use of Market Share Data
� Catsup
� Brand A - 39%
� Brand B - 28%
� Brand C - 22%
� Total – 89%
� A few large brands which comprise most of the market
Use of Market Share Data
� Tortillas, flour� Brand A - 2%
� Brand B - 2%
� Brand C - 0.2%
� Brand D - 0.2%
� Brand E - 0.1%
� Brand F - 0.04%
� Brand G - 0.03%
� Brand H - 0.0005%
� Total - 4.6%
� Many small brands, but little variation in Ca and Na content

21
NFNAP: Aim 2
� Prioritize foods and critical nutrients
� Evaluate existing data quality
� Devise and implement a nationally-based sampling plan
� Analyze sampled foods / valid methods
� Compile and disseminate representative estimates
Evaluation of Data Quality:
Categories for Evaluation
Documentation is collected for:
� Sampling plan
� Sample handling
� Number of samples
� Analytical methodology
� Analytical quality control
22
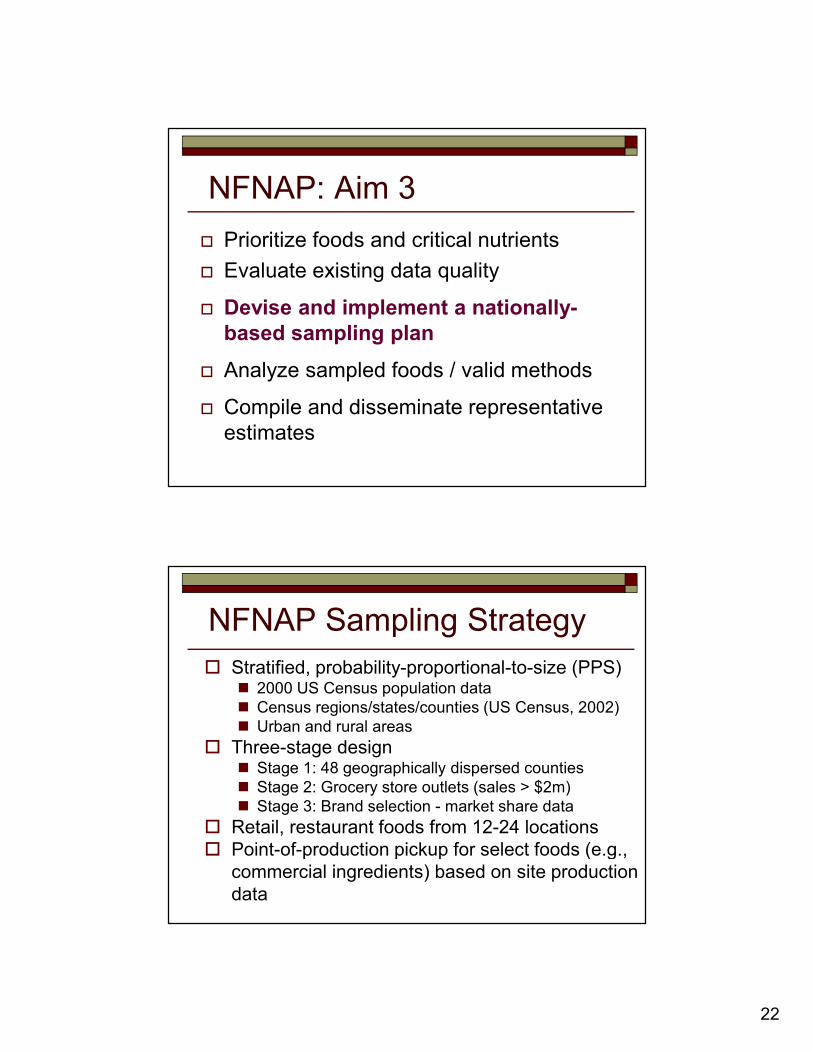
NFNAP: Aim 3
� Prioritize foods and critical nutrients
� Evaluate existing data quality
� Devise and implement a nationally-
based sampling plan
� Analyze sampled foods / valid methods
� Compile and disseminate representative estimates
NFNAP Sampling Strategy
� Stratified, probability-proportional-to-size (PPS) � 2000 US Census population data� Census regions/states/counties (US Census, 2002)� Urban and rural areas
� Three-stage design� Stage 1: 48 geographically dispersed counties � Stage 2: Grocery store outlets (sales > $2m)� Stage 3: Brand selection - market share data
� Retail, restaurant foods from 12-24 locations� Point-of-production pickup for select foods (e.g.,
commercial ingredients) based on site production data
23
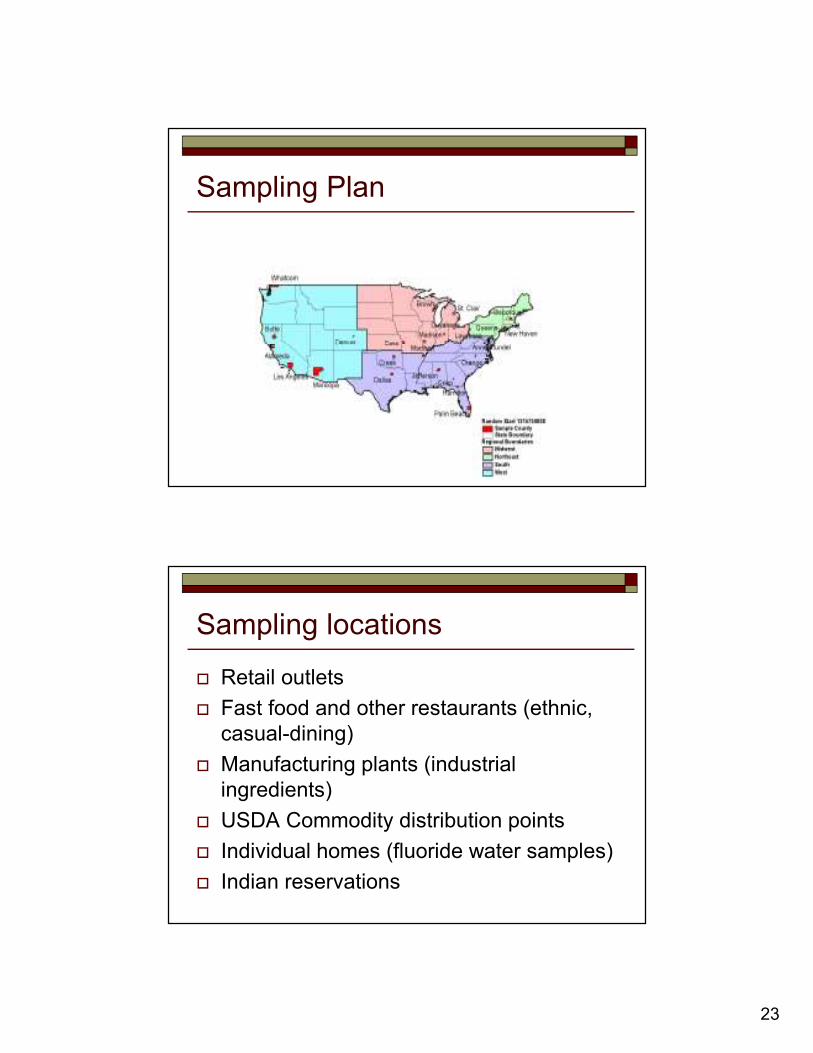
Sampling Plan
Sampling locations
� Retail outlets
� Fast food and other restaurants (ethnic, casual-dining)
� Manufacturing plants (industrial ingredients)
� USDA Commodity distribution points
� Individual homes (fluoride water samples)
� Indian reservations
24
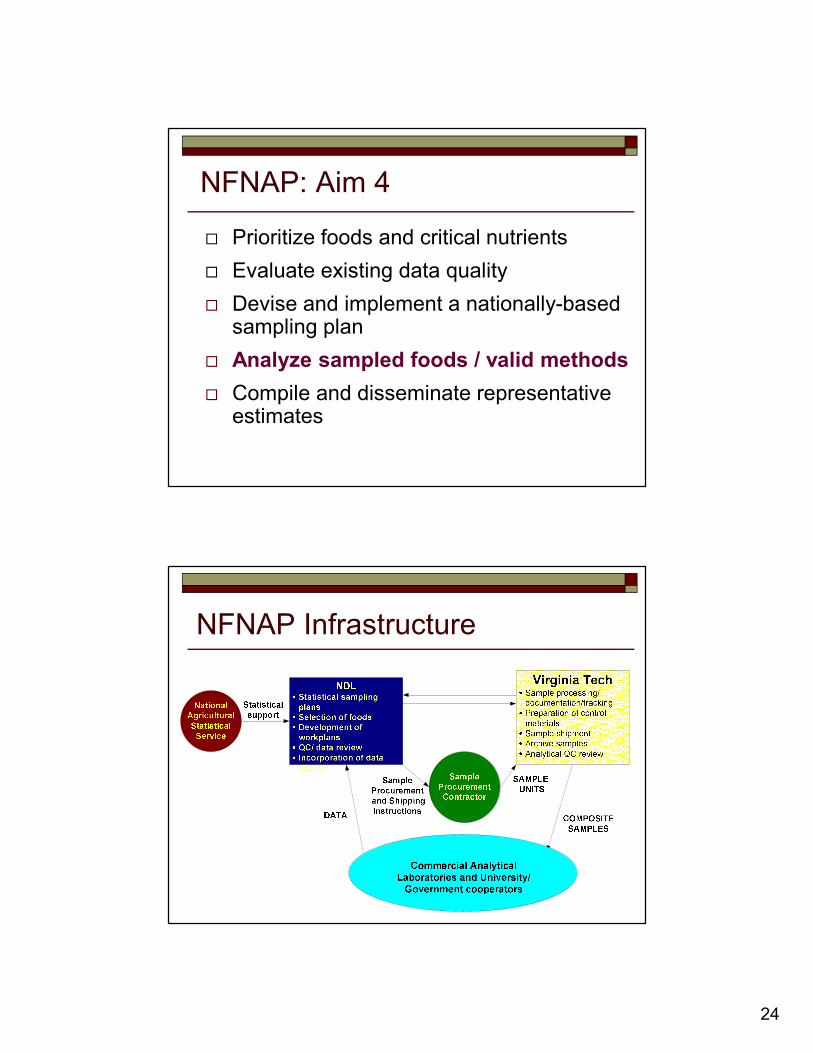
NFNAP: Aim 4
� Prioritize foods and critical nutrients
� Evaluate existing data quality
� Devise and implement a nationally-based sampling plan
� Analyze sampled foods / valid methods
� Compile and disseminate representative estimates
NFNAP Infrastructure
25
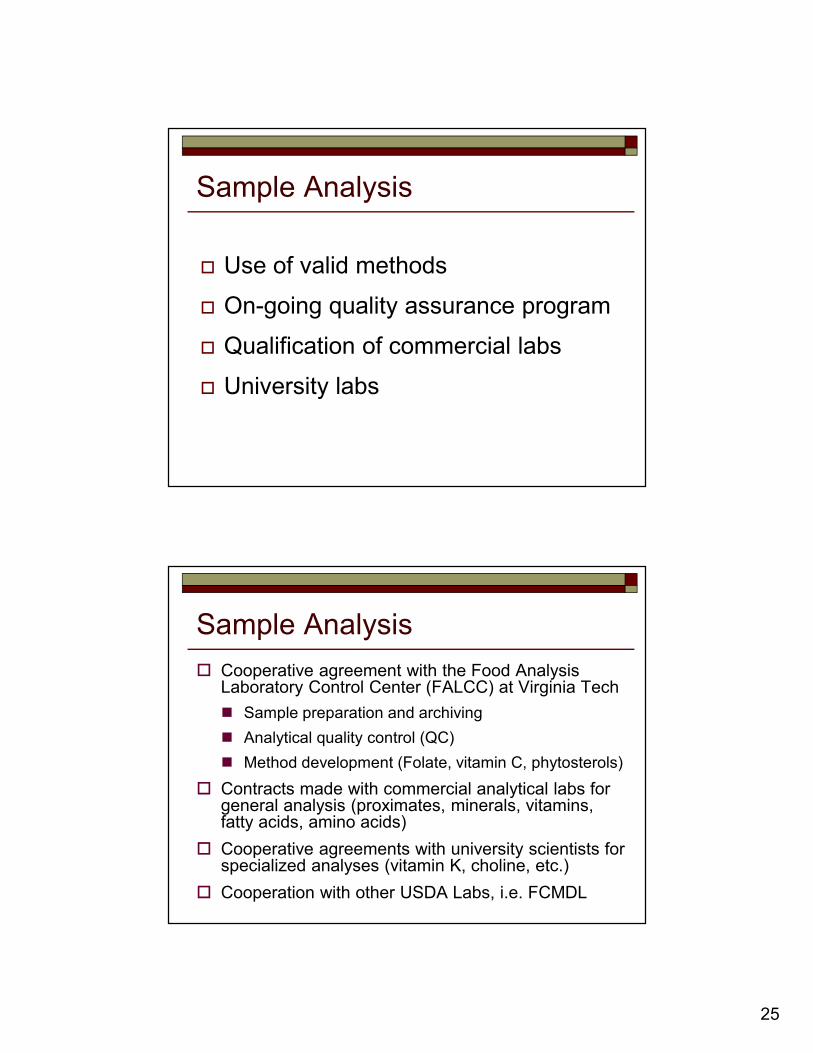
Sample Analysis
� Use of valid methods
� On-going quality assurance program
� Qualification of commercial labs
� University labs
Sample Analysis
� Cooperative agreement with the Food Analysis Laboratory Control Center (FALCC) at Virginia Tech
� Sample preparation and archiving
� Analytical quality control (QC)
� Method development (Folate, vitamin C, phytosterols)
� Contracts made with commercial analytical labs for general analysis (proximates, minerals, vitamins, fatty acids, amino acids)
� Cooperative agreements with university scientists for specialized analyses (vitamin K, choline, etc.)
� Cooperation with other USDA Labs, i.e. FCMDL
26
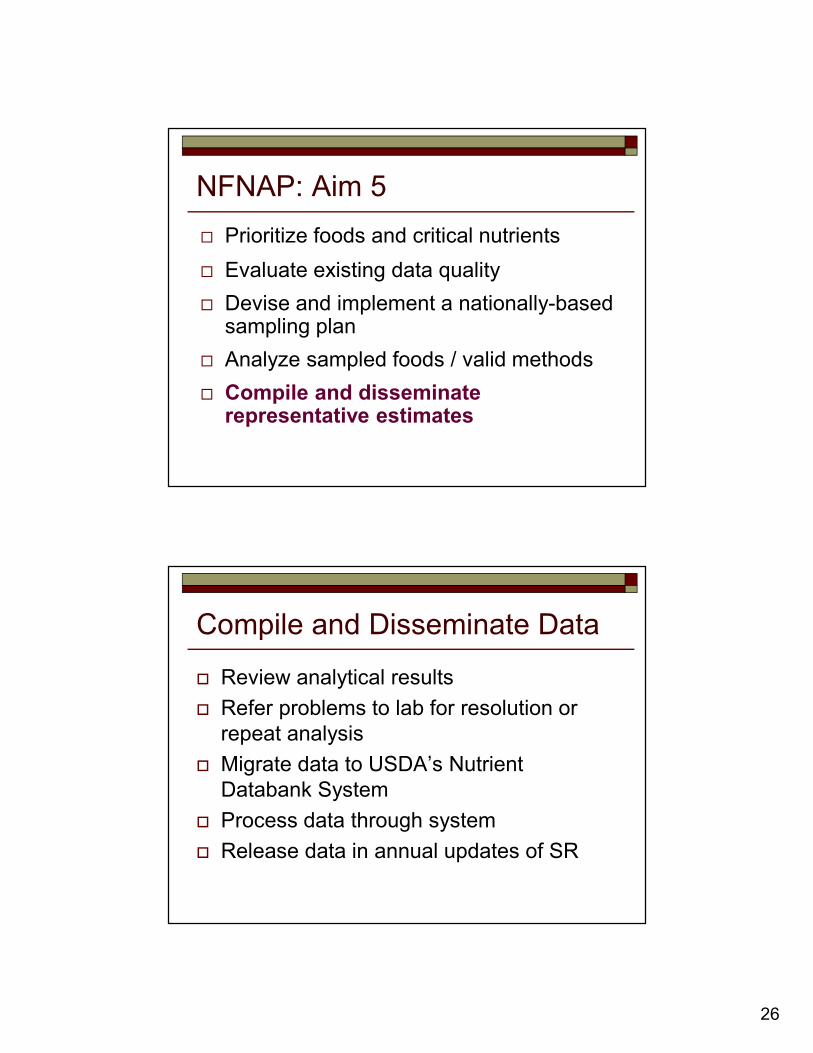
NFNAP: Aim 5
� Prioritize foods and critical nutrients
� Evaluate existing data quality
� Devise and implement a nationally-based sampling plan
� Analyze sampled foods / valid methods
� Compile and disseminate representative estimates
Compile and Disseminate Data
� Review analytical results
� Refer problems to lab for resolution or repeat analysis
� Migrate data to USDA’s Nutrient Databank System
� Process data through system
� Release data in annual updates of SR

27
National Food and Nutrient Analysis Program� Sampled and analyzed over 1,800 food items
� Over 1,600 food items in SR have been added or updated using NFNAP data
� Provided data on ingredients for recipes/ formulations and processed foods
� NFNAP data provides high quality data to support:� Nutrition Monitoring: FNDDS and the What We Eat in America
component of NHANES
� Nutrient values for critical, i.e. Key Foods
Exercise
28
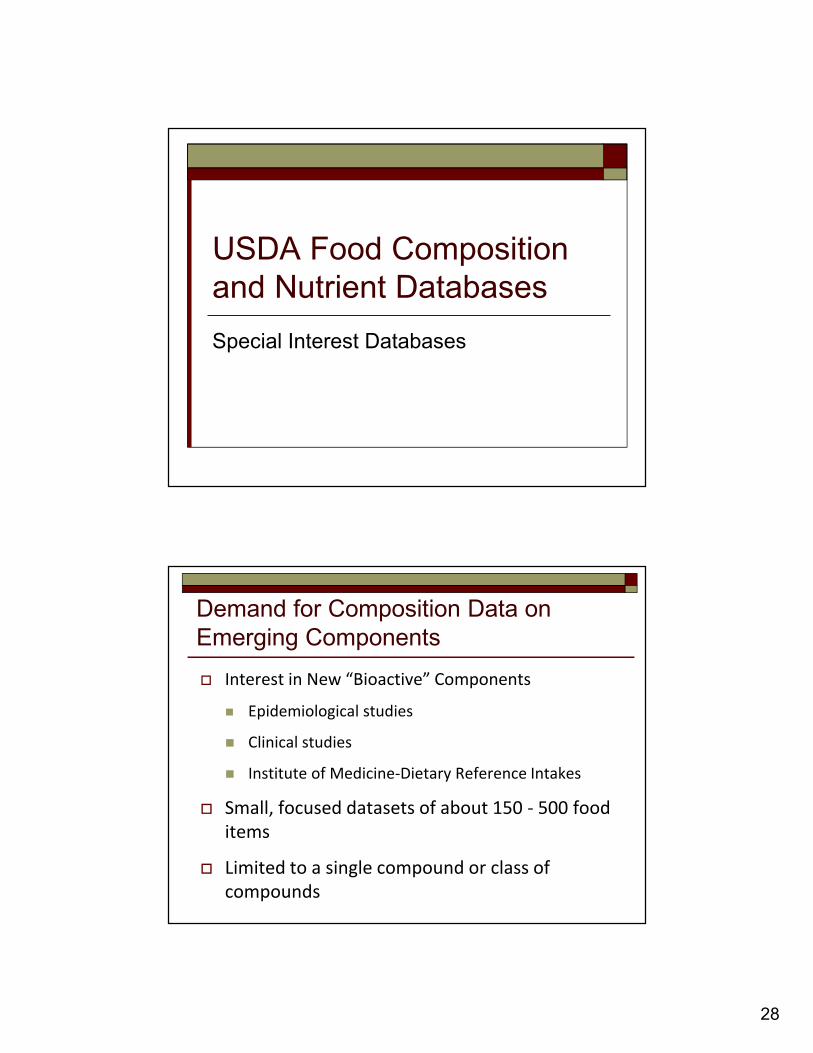
USDA Food Composition and Nutrient Databases
Special Interest Databases
Demand for Composition Data on Emerging Components
� Interest in New “Bioactive” Components
� Epidemiological studies
� Clinical studies
� Institute of Medicine-Dietary Reference Intakes
� Small, focused datasets of about 150 - 500 food
items
� Limited to a single compound or class of
compounds
29
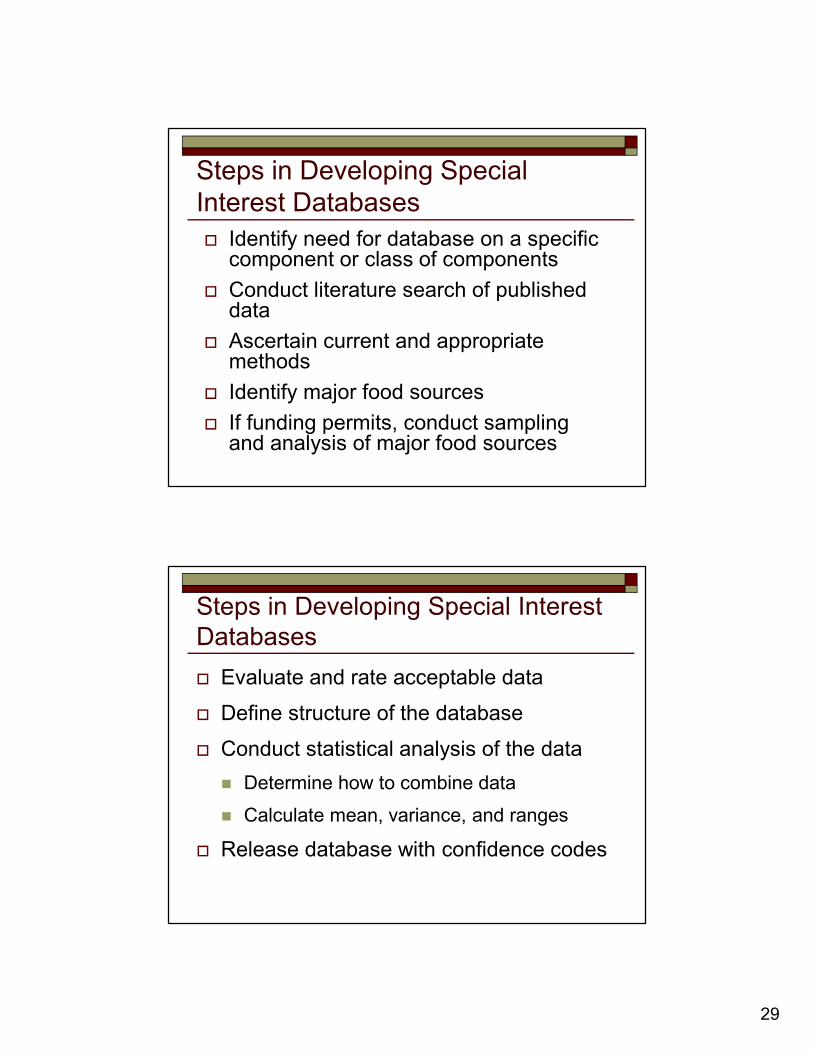
Steps in Developing Special Interest Databases
� Identify need for database on a specific component or class of components
� Conduct literature search of published data
� Ascertain current and appropriate methods
� Identify major food sources
� If funding permits, conduct sampling and analysis of major food sources
Steps in Developing Special Interest Databases
� Evaluate and rate acceptable data
� Define structure of the database
� Conduct statistical analysis of the data
� Determine how to combine data
� Calculate mean, variance, and ranges
� Release database with confidence codes
30
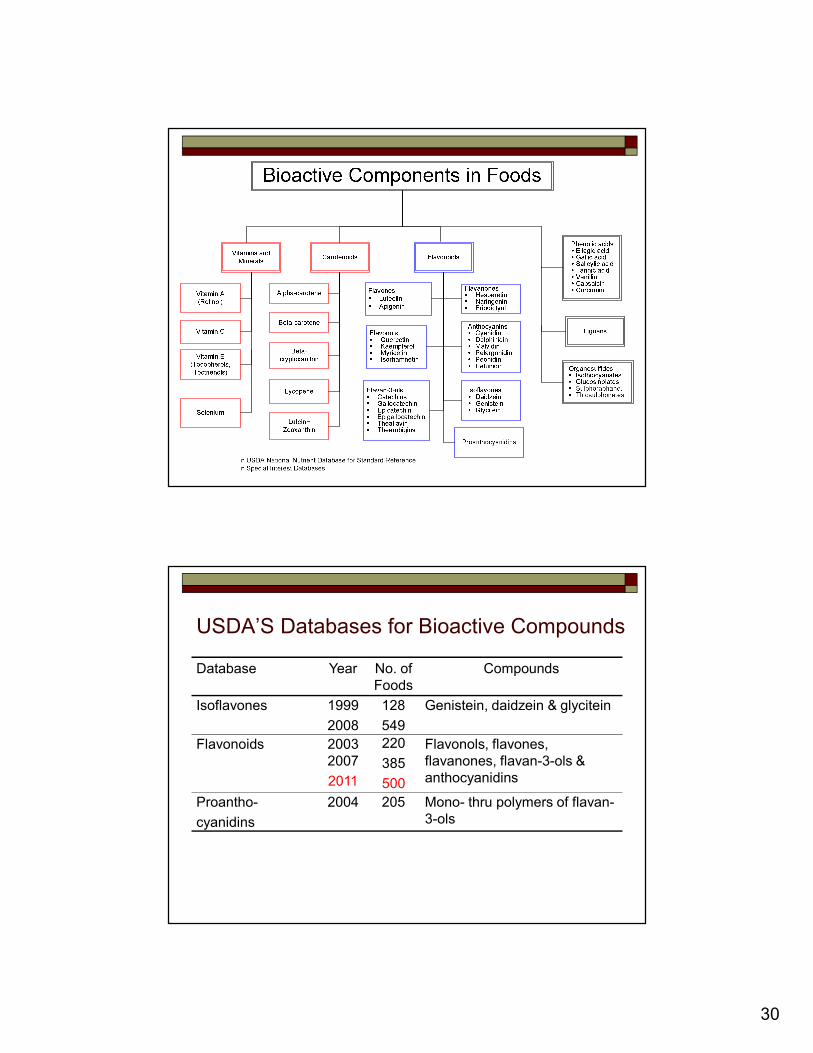
USDA’S Databases for Bioactive Compounds
Database Year No. of Foods
Compounds
Isoflavones 1999
2008
128
549
Genistein, daidzein & glycitein
Flavonoids 2003 2007
2011
220
385
500
Flavonols, flavones, flavanones, flavan-3-ols & anthocyanidins
Proantho-
cyanidins
2004 205 Mono- thru polymers of flavan-3-ols
31
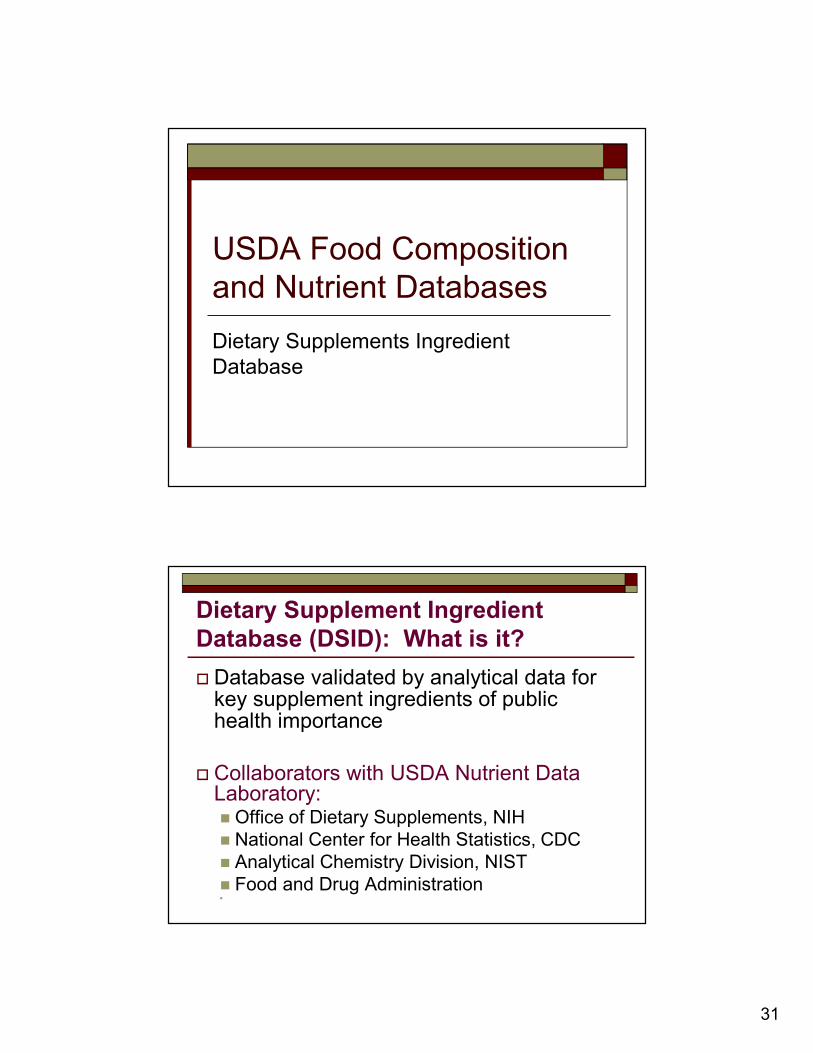
USDA Food Composition and Nutrient Databases
Dietary Supplements Ingredient Database
Dietary Supplement Ingredient
Database (DSID): What is it?
� Database validated by analytical data for key supplement ingredients of public health importance
� Collaborators with USDA Nutrient Data Laboratory:� Office of Dietary Supplements, NIH� National Center for Health Statistics, CDC� Analytical Chemistry Division, NIST� Food and Drug Administration�
32
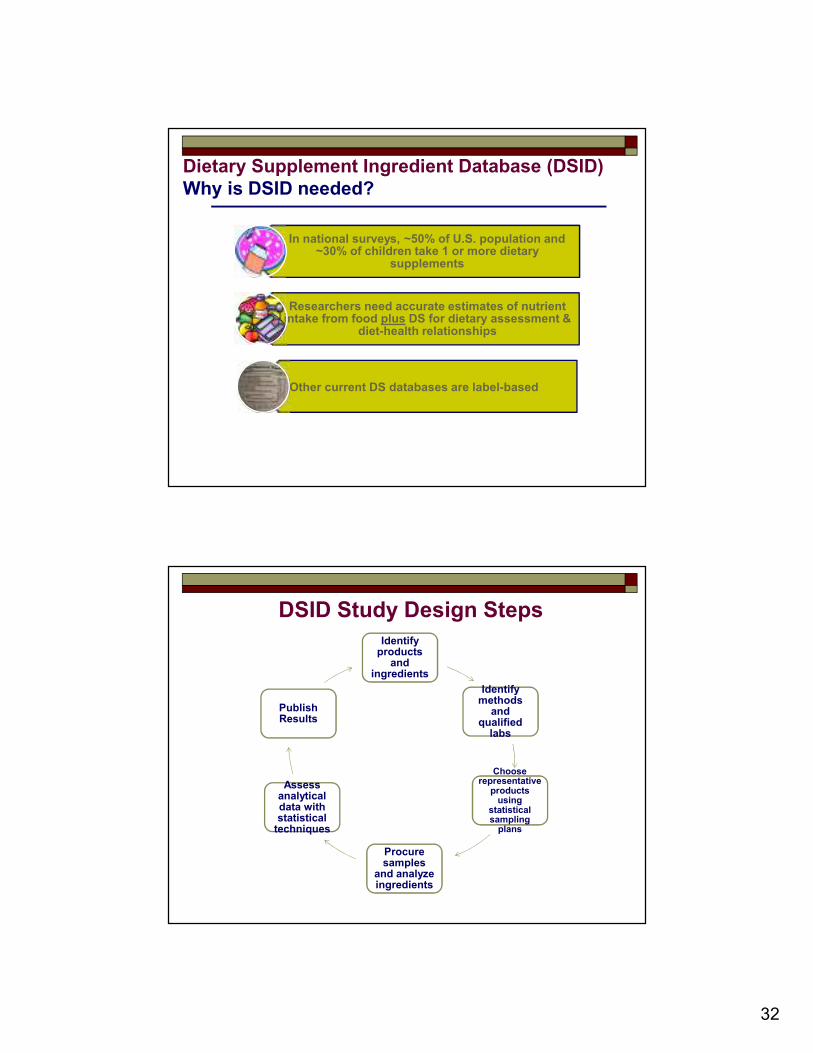
Dietary Supplement Ingredient Database (DSID)
Why is DSID needed?
In national surveys, ~50% of U.S. population and ~30% of children take 1 or more dietary
supplements
Researchers need accurate estimates of nutrient intake from food plus DS for dietary assessment &
diet-health relationships
Other current DS databases are label-based
Identify products and
ingredients
Identify methods and
qualified labs
Choose representative products using
statistical sampling plans
Procure samples
and analyze ingredients
Assess analytical data with statistical techniques
Publish Results
DSID Study Design Steps
33
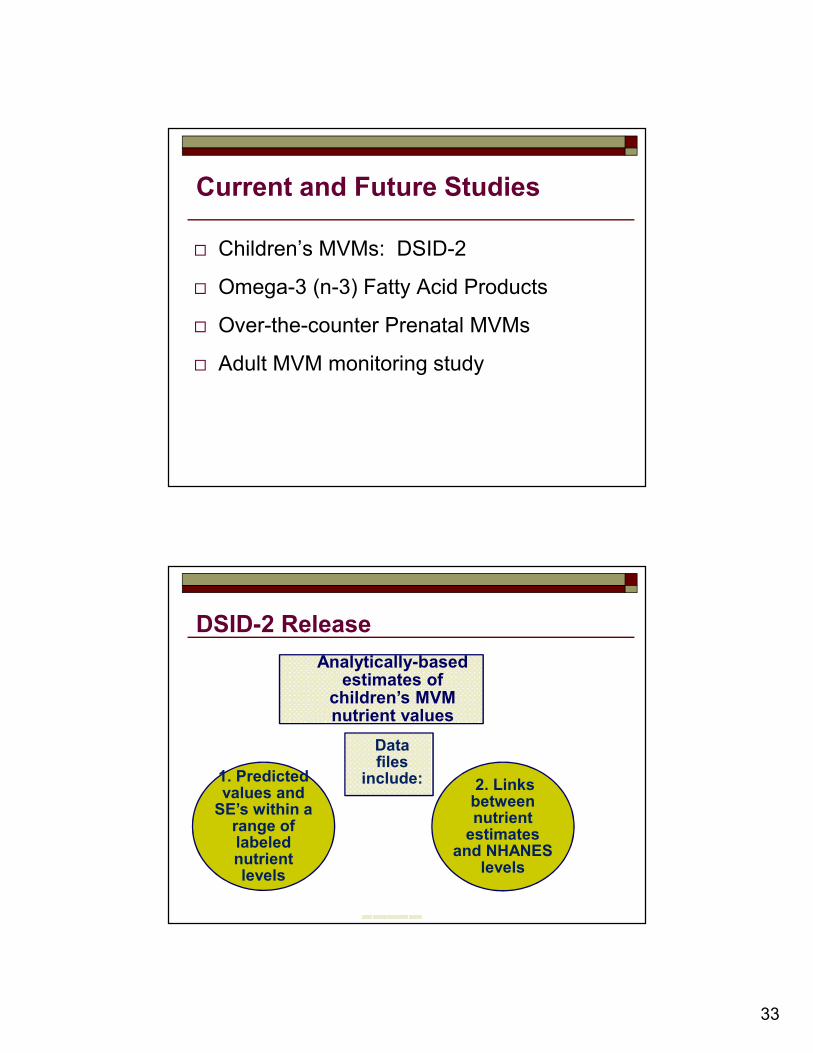
Current and Future Studies
� Children’s MVMs: DSID-2
� Omega-3 (n-3) Fatty Acid Products
� Over-the-counter Prenatal MVMs
� Adult MVM monitoring study
DSID-2 Release
Analytically-based estimates of
children’s MVM nutrient values
Data files
include:1. Predicted values and SE’s within a range of labeled nutrient levels
2. Links between nutrient estimates
and NHANES levels
34
DSID Summary
� The analytically-based Dietary Supplement Ingredient Database-Release Two (DSID-2) will be released tomorrow.
� DSID-2 includes a nutrient calculator and data files for children's and adult MVMs
� Food and dietary supplement data are valuable for accurate assessment of the U.S. population’s total nutrient intake
Presentations: Talks� ARS/USDA Updates Food Sampling Strategies to Keep
Pace with Demographic Shifts.
� Sources of Variability in the Flavonoid Content of Food.
� USDA Monitors Levels of Added Sodium in Processed
and Prepared Foods
� U.S. Dietary Supplement Ingredient Database (DSID):
Children’s Multivitamin/Mineral (MVM) Study Results
Released in DSID-2.
� Updates to the NHANES Dietary Supplement Data
� Prioritizing Non-Vitamin and Mineral Ingredients (Non-
VM) in the Dietary Supplement Ingredient Database
(DSID).
35
Presentations: Posters
� USDA Updates Nutrient Values for Fast Food Pizza
� USDA Develops a Database for Flavonoids to Assess
Dietary Intake
� Changes in Nutrient Levels for Three Fresh Pork Loin
Cuts Between 1992-2010
� LanguaL: Controlled Vocabulary for Indexing Dietary
Supplements in U.S. Databases
� INFOODS Advances in Standard Settings, Useful for
Food Composition and Dietary Assessment
International Activities
� International Network of Food Data Systems (INFOODS)� Serves as host for the North American
Regional Center (NORAMFOODS)� Participates in the development of standards
� Data Interchange format� Tagnames
� Participates in food composition training courses
� International Food Data Conference
36
"You can't keep running in here and demanding data every two years'."
Nutrient Data Laboratory
Web Site:http://www.ars.usda.gov/nutrientdata