USDA Commodity Analysis and the Guar Conundrum Allan Mustard and Santosh Singh December 6, 2013.
12
USDA Commodity Analysis and the Guar Conundrum Allan Mustard and Santosh Singh December 6, 2013
-
Upload
holly-leonard -
Category
Documents
-
view
214 -
download
0
Transcript of USDA Commodity Analysis and the Guar Conundrum Allan Mustard and Santosh Singh December 6, 2013.
USDA Commodity Analysisand the Guar Conundrum
Allan Mustard and Santosh SinghDecember 6, 2013

Why Does Everyone Look to USDA?
Reliable, credible, objective and unbiased
Publications and data on-line and updated regularly
FREE!
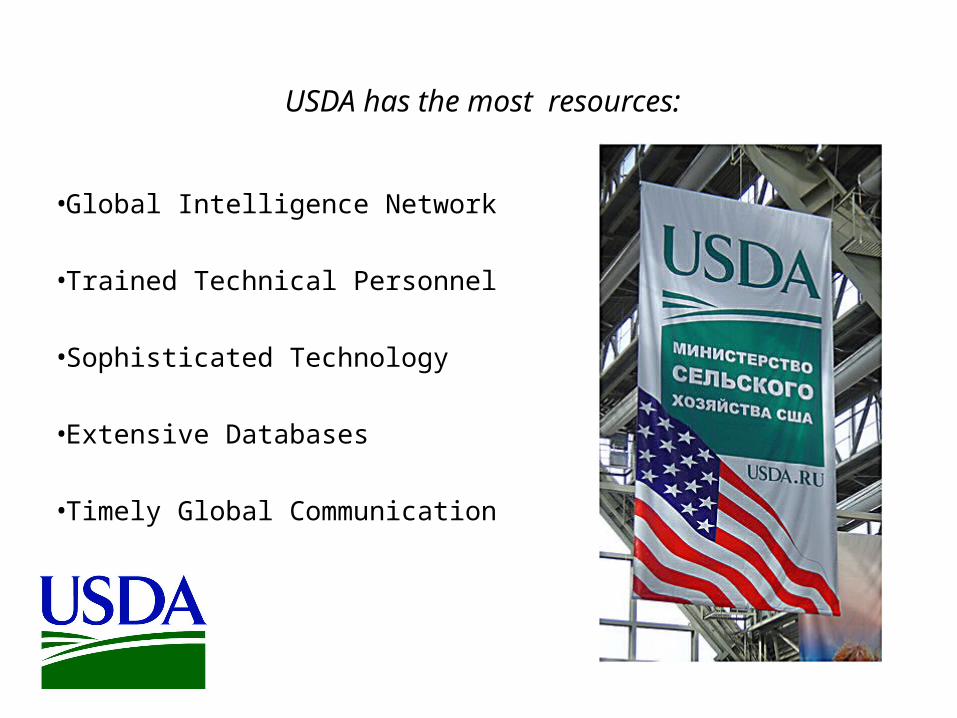
USDA has the most resources:
• Global Intelligence Network
• Trained Technical Personnel
• Sophisticated Technology
• Extensive Databases
• Timely Global Communication

Country/Commodity Balance Sheets
SUPPLY = DEMAND
Beginning Stocks
Production+ + Imports = Exports +Domestic
Use+
Ending Stocks
Private
(On-farm)
(Pipeline)
Government
(Security)
(Public Distribution)
Area
Yield
Commercial
ConcessionalFeed / Residual
FSI
(Food)
(Seed)
(Industrial)

Input From Multiple Sources
Private Market Reports
Government Reports
TravelReports
OfficialCountry Reports
World WeatherReports
AttachéReports
Agribusiness
Wire Services
Private Commodity
ReportsInternational Organizations
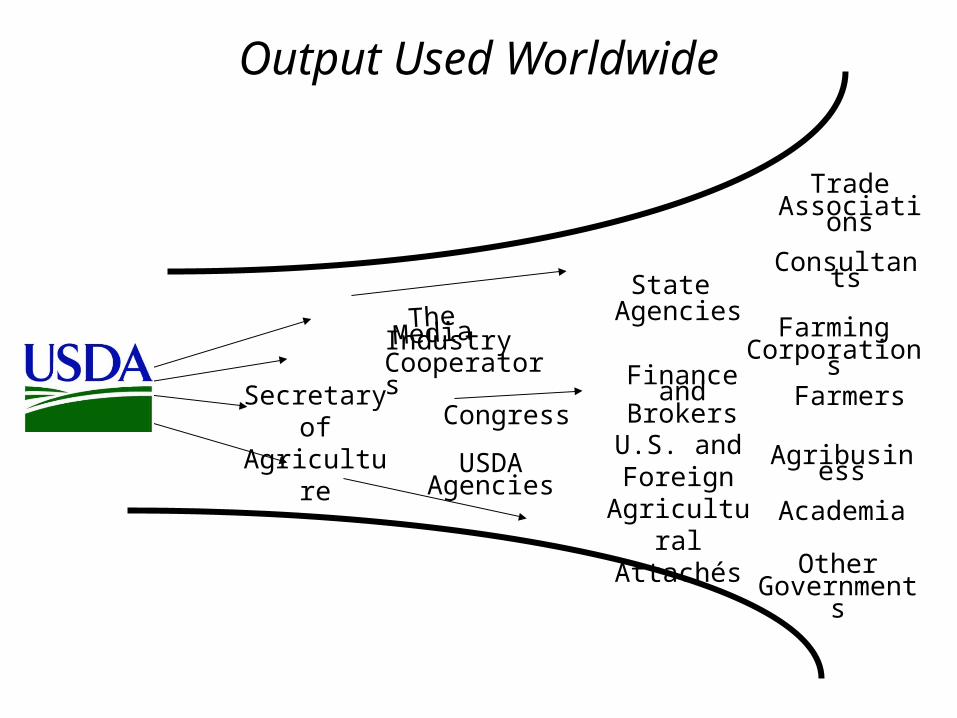
Output Used Worldwide
Secretary ofAgriculture
The Media
USDAAgencies
Academia
U.S. and Foreign
Agricultural Attachés
State Agencies
Farmers
FarmingCorporations
Consultants
TradeAssociations
Agribusiness
Congress
Finance andBrokers
Other Governments
Industry Cooperators

Guar (Gowar), Cyamopsis tetragonoloba
India: Area Planted to Guar Bean, in thousand hectares, selected states of India
State 2011 Final 2012 EstimateRajasthan 3,094 3,100Punjab n/a 20Gujarat 125 178Haryana 215 341 TOTAL n/a 3,639Sources: Department of Agriculture of Rajasthan, Department of Agriculture of Punjab, Gujarat Department of Agriculture and Cooperation, Department of Agriculture of Haryana, FAS Delhi estimates

1997199819992000200120022003200420052006200720082009
2.202.302.402.502.602.702.802.903.00
R² = 0.247917075297477
slope 0.01434 t = 1.92intercept -26.02895
India: Wheat Yields, in metric tons per hectare, 1997/98 – 2009/10
std err = 0.10
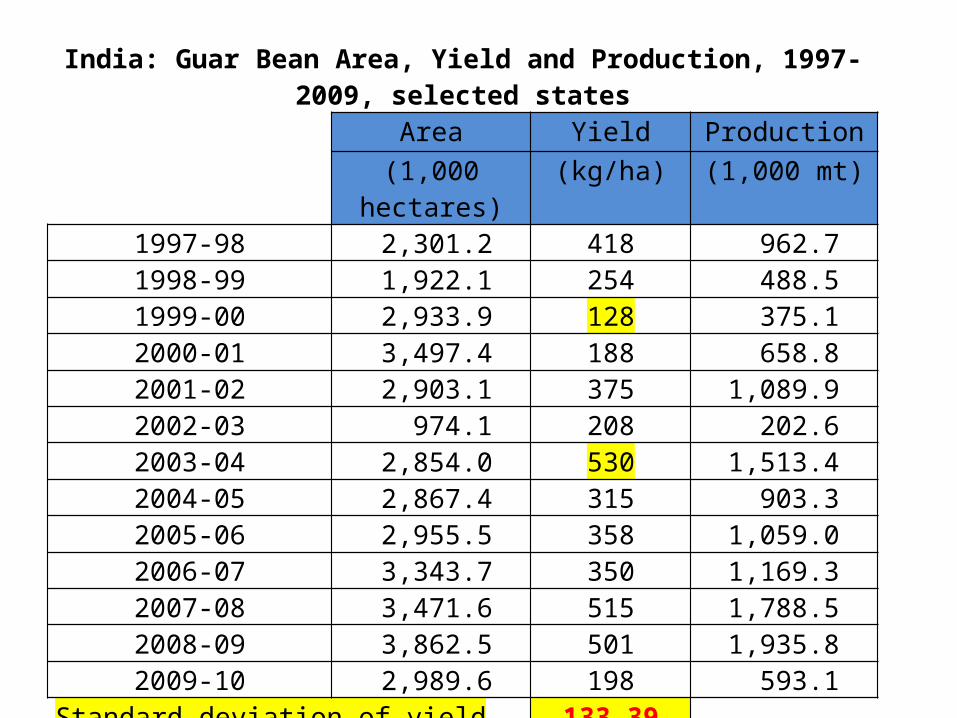
India: Guar Bean Area, Yield and Production, 1997-2009, selected statesArea Yield Production
(1,000 hectares) (kg/ha) (1,000 mt)
1997-98 2,301.2 418 962.71998-99 1,922.1 254 488.51999-00 2,933.9 128 375.12000-01 3,497.4 188 658.82001-02 2,903.1 375 1,089.92002-03 974.1 208 202.62003-04 2,854.0 530 1,513.42004-05 2,867.4 315 903.32005-06 2,955.5 358 1,059.02006-07 3,343.7 350 1,169.32007-08 3,471.6 515 1,788.52008-09 3,862.5 501 1,935.82009-10 2,989.6 198 593.1
Standard deviation of yield 133.39Source: India Stats (www.indiastats.com)

1997199819992000200120022003200420052006200720082009
00.10.20.30.40.50.60.70.80.9
1slope 0.0111 t = 1.14intercept -21.9194
India: Guar Yields, in metric tons per hectare, 1997/98 – 2009/10
R² = 0.1052std err = 0.1318

High Yield Variation = High Unpredictability
• Unusually wide yield variance
• Large number of critical points
• Relatively unresponsive to inputs

http://www.fas.usda.gov
http://gain.fas.usda.gov
http://www.fas.usda.gov/psdonline


![[PPT]The regulatory conundrum: achieving effective …acmd.com.bd/docs/Siddiqui, 2015. The regulatory conundrum... · Web viewThe regulatory conundrum: achieving effective corporate](https://static.fdocuments.us/doc/165x107/5aa627577f8b9a7c1a8e58e9/pptthe-regulatory-conundrum-achieving-effective-acmdcombddocssiddiqui.jpg)