USDA Agricultural Projections to 2025 · PDF fileUSDA Agricultural Projections to 2025 is...
99
United States Department of Agriculture Office of the Chief Economist World Agricultural Outlook Board Long-term Projections Report OCE-2016-1 February 2016 USDA Agricultural Projections to 2025 Interagency Agricultural Projections Committee World Agricultural Outlook Board, Chair Economic Research Service Farm Service Agency Foreign Agricultural Service Agricultural Marketing Service Office of the Chief Economist Office of Budget and Program Analysis Risk Management Agency Natural Resources Conservation Service National Institute of Food and Agriculture USDA Long-term Projections
Transcript of USDA Agricultural Projections to 2025 · PDF fileUSDA Agricultural Projections to 2025 is...

United States Department of Agriculture Office of the Chief Economist World Agricultural Outlook Board Long-term Projections Report OCE-2016-1 February 2016
USDA Agricultural Projections to 2025 Interagency Agricultural Projections Committee
World Agricultural Outlook Board, Chair Economic Research Service Farm Service Agency Foreign Agricultural Service Agricultural Marketing Service Office of the Chief Economist Office of Budget and Program Analysis Risk Management Agency Natural Resources Conservation Service National Institute of Food and Agriculture
USDA Long-term Projections

Long-term Projections on the Internet USDA Agricultural Projections to 2025 is available in both pdf and Microsoft Word formats at:
www.usda.gov/oce/commodity/projections/ and also at:
www.ers.usda.gov/publications/oce-usda-agricultural-projections/oce-2016-1.aspx Data from the new USDA long-term projections are available electronically at:
usda.mannlib.cornell.edu/MannUsda/viewDocumentInfo.do?documentID=1192
Information on USDA’s long-term projections process may be found at:
www.ers.usda.gov/topics/farm-economy/agricultural-baseline-projections/usdas-long-term-projections-process.aspx

Washington, D.C. 20250-3812
USDA Long-term Projections
February 2016
i
USDA Agricultural Projections to 2025. Office of the Chief Economist, World Agricultural Outlook Board, U.S. Department of Agriculture. Prepared by the Interagency Agricultural Projections Committee. Long-term Projections Report OCE-2016-1, 99 pp.
Abstract
This report provides projections for the agricultural sector to 2025. Projections cover agricultural commodities, agricultural trade, and aggregate indicators of the sector, such as farm income. The projections are based on specific assumptions about macroeconomic conditions, policy, weather, and international developments, with no domestic or external shocks to global agricultural markets. The Agricultural Act of 2014 is assumed to remain in effect through the projection period. The projections are one representative scenario for the agricultural sector for the next decade and reflect a composite of model results and judgment-based analyses. The projections in this report were prepared during October through December 2015. Over the next several years, the agricultural sector continues to adjust to lower prices for most farm commodities. Although reduced energy prices have decreased energy-related agricultural production costs, lower crop prices in the near term result in declines in planted acreage. Lower feed costs provide economic incentives for expansion in the livestock sector. Longrun developments for global agriculture reflect steady world economic growth and continued global demand for biofuel feedstocks, factors which combine to support longer run increases in consumption, trade, and prices of agricultural products. Although a stronger U.S. dollar constrains growth in U.S. agricultural exports somewhat, the United States remains competitive in global agricultural markets. Reflecting these near-term market adjustments and longer term factors, U.S. export values decline in 2015-16 and farm cash receipts fall in 2015-17 before both grow over the rest of the projection period. Net farm income generally increases over the projection period.
Keywords: Projections, crops, livestock, biofuel, ethanol, biodiesel, U.S. dollar value, crude oil prices, trade, farm income, U.S. Department of Agriculture, USDA
The U.S. Department of Agriculture (USDA) prohibits discrimination in all its programs and activities on the basis of race, color, national origin, age, disability, and, where applicable, sex, marital status, familial status, parental status, religion, sexual orientation, genetic information, political beliefs, reprisal, or because all or a part of an individual's income is derived from any public assistance program. (Not all prohibited bases apply to all programs.) Persons with disabilities who require alternative means for communication of program information (Braille, large print, audiotape, etc.) should contact USDA's TARGET Center at (202) 720-2600 (voice and TDD). To file a complaint of discrimination write to USDA, Director, Office of Civil Rights, 1400 Independence Avenue, S.W., Washington, D.C. 20250-9410 or call (800) 795-3272 (voice) or (202) 720-6382 (TDD). USDA is an equal opportunity provider and employer.

ii USDA Long-term Projections, February 2016
Contents Page
USDA Long-term Projections: Background ................................................................................. iii
USDA Contacts for Long-term Projections ................................................................................... iv
Acknowledgments.......................................................................................................................... iv
Introduction and Projections Overview ...........................................................................................1
Key Assumptions and Implications .................................................................................................2
Macroeconomic Assumptions ..........................................................................................................6
U.S. Crops ......................................................................................................................................19
U.S. Livestock ................................................................................................................................39
U.S. Farm Income ..........................................................................................................................48
Agricultural Trade ..........................................................................................................................53
Box: U.S. Agricultural Trade Projections ..........................................................................58
List of Tables .................................................................................................................................93
USDA Long-term Projections, February 2016 iii
USDA Long-term Projections: Background
USDA’s long-term agricultural projections presented in this report are a departmental consensus on a longrun scenario for the agricultural sector. These projections provide a starting point for discussion of alternative outcomes for the sector. The projections in this report were prepared during October through December 2015, with the Agricultural Act of 2014 assumed to remain in effect through the projection period. The scenario presented in this report is not a USDA forecast about the future. Instead, it is a conditional, longrun scenario about what would be expected to happen under a continuation of current farm legislation and other specific assumptions. Critical long-term assumptions are made for U.S. and international macroeconomic conditions, U.S. and foreign agricultural and trade policies, and growth rates of agricultural productivity in the United States and abroad. The report assumes that there are no domestic or external shocks that would affect global agricultural supply and demand. Normal weather is assumed. Changes in any of these assumptions can significantly affect the projections, and actual conditions that emerge will alter the outcomes. The report uses as a starting point the short-term projections from the November 2015 World Agricultural Supply and Demand Estimates report. The macroeconomic assumptions were completed in October 2015. The projections analysis was conducted by interagency committees in USDA and reflects a composite of model results and judgment-based analyses. The Economic Research Service had the lead role in preparing the departmental report. The projections and the report were reviewed and cleared by the Interagency Agricultural Projections Committee, chaired by the World Agricultural Outlook Board. USDA participants in the projections analysis and review include the World Agricultural Outlook Board; the Economic Research Service; the Farm Service Agency; the Foreign Agricultural Service; the Agricultural Marketing Service; the Office of the Chief Economist; the Office of Budget and Program Analysis; the Risk Management Agency; the Natural Resources Conservation Service; and the National Institute of Food and Agriculture.

iv USDA Long-term Projections, February 2016
USDA Contacts for Long-term Projections
Questions regarding these projections may be directed to the report coordinators: Paul Westcott, Economic Research Service, e-mail: [email protected] James Hansen, Economic Research Service, e-mail: [email protected] David Stallings, World Agricultural Outlook Board, e-mail: [email protected]
Acknowledgments
The report coordinators, on behalf of the Interagency Agricultural Projections Committee, thank the many analysts in different agencies of USDA for their contributions to the long-term projections analysis and to the preparation and review of this report.

USDA Long-term Projections, February 2016 1
USDA Agricultural Projections to 2025
Interagency Agricultural Projections Committee
Introduction and Projections Overview This report provides longrun projections for the agricultural sector to 2025. Major forces and uncertainties affecting future agricultural markets are discussed, such as prospects for long-term global economic growth and population trends. Projections cover production and consumption for agricultural commodities, global agricultural trade and U.S. exports, commodity prices, and aggregate indicators of the sector, such as farm income.
The projections are a conditional scenario based on specific assumptions about the macroeconomy, agricultural and trade policies, the weather, and international developments. The report assumes that there are no domestic or external shocks that would affect global agricultural markets. Normal weather with trend crop production yields is generally assumed. Provisions of the Agricultural Act of 2014 are assumed to remain in effect through the projection period. Thus, the projections are not intended to be a forecast of what the future will be, but instead are a description of what would be expected to happen under these very specific assumptions and circumstances. As such, the projections provide a neutral reference scenario that can serve as a point of departure for discussion of alternative farm-sector outcomes that could result under different domestic or international conditions.
The projections in this report were prepared during October through December 2015 and reflect a composite of model results and judgment-based analyses. Short-term projections used as a starting point in this report are from the November 2015 World Agricultural Supply and Demand Estimates report. The macroeconomic assumptions were completed in October 2015.
Over the next several years, the agricultural sector will continue to adjust to lower prices for most farm commodities and reduced energy prices. Reduced prices for crude oil and natural gas have decreased agricultural production costs—costs for fuel and fertilizer have fallen the most. Nonetheless, production response to lower crop prices in the near term will result in reduced planted acreage. In the livestock sector, lower feed costs will provide economic incentives for expansion.
Developments for global agriculture and U.S. trade reflect weaker income growth in developing countries and a strong U.S. dollar in the near term, with steady world economic growth and continued global demand for biofuel feedstocks in the longer term. Those factors combine to support longer run increases in consumption, trade, and prices of agricultural products. Global trade competition will continue to be strong and the higher valued U.S. dollar will constrain growth in U.S. agricultural exports somewhat. Nonetheless, the United States remains competitive in global agricultural markets.
Reflecting these near-term market adjustments and longer term prospects, U.S. export values decline in 2015-16 and farm cash receipts fall in 2015-17 before both grow over the rest of the projection period. Although farm production expenses also increase after 2017, net farm income, which has fallen sharply from its 2013 record, generally increases over the projection period.

2 USDA Long-term Projections, February 2016
Key Assumptions and Implications Major assumptions underlying the projections and selected implications include: Macroeconomic Overview
• Global macroeconomic conditions reflect relatively sluggish economic growth in developing countries, a strong dollar, and low oil prices in the near term, with stronger developing country growth, a somewhat weaker dollar, and rising oil prices in the longer term.
Economic Growth
• Global real economic growth is assumed to average 3.1 percent annually over the next decade, slightly below the long-term trend prior to the 2008 financial crisis. Strong growth is expected in the United States, and most other developed countries are expected to experience somewhat improved growth relative to recent years. In contrast, a growth slowdown is expected in developing countries. This is particularly notable in China.
• Despite the expected slowdown, the strongest growth in the world remains in developing countries. Although China’s economy slows, average annual growth still exceeds 5 percent. India is expected to remain among the world’s fastest growing economies, with average growth over 8 percent. Strong economic growth is also anticipated for Africa, the Middle East, and other countries in Asia over the projection period. Importantly, several Latin American countries face severe economic challenges that will be a considerable drag on growth, particularly in the beginning of the projection period.
• Developed countries are assumed to have relatively weak longrun real growth, especially in Japan and the European Union (EU). Japan’s economy continues the slow growth the country has had since the 1990s. Growth in the EU will be constrained by structural rigidities, including inflexible labor laws and an expensive social security system.
• U.S. economic growth is expected to be strong relative to the rest of the developed world, averaging about 2.5 percent over the next decade. Nonetheless, with stronger growth in developing economies, the U.S. share of global gross domestic product (GDP) falls over the projection period.
• Low oil prices and geopolitical conflicts, among other factors, pushed the former Soviet Union region into recession in 2015, which is expected to continue in 2016. Growth prospects for the region then are assumed to improve over the rest of the projection period, although economic gains remain smaller than the average over 2000-15.
• Steady global economic growth supports longer term gains in world food demand, global agricultural trade, and U.S. agricultural exports. Economic growth in developing countries is especially important because growth in food consumption and feed use are particularly responsive to income gains in those countries, with movement away from traditional staple foods and increased diversification of diets.

USDA Long-term Projections, February 2016 3
Population
• Economic growth over the next decade contributes to the continued slowing of population gains around the world as birth rates decline. Growth in global population is projected to average about 1.0 percent per year compared with an average annual rate of 1.2 percent in 2001-10.
• Population growth rates in most developing countries are projected to slow, although they remain above those in the rest of the world. As a consequence, the share of world population accounted for by developing countries continues to rise, accounting for 83 percent in 2025.
• Population gains in developing countries along with economic growth and expansion of the middle class are particularly important for the projected growth in global food demand. Populations in developing countries, in contrast to those in more-developed countries, tend to be both younger and, with economic growth, urbanizing more rapidly, factors that generally lead to the expansion and diversification of food consumption.
Value of the U.S. Dollar
• Following a 10-year depreciation from 2002 to 2011, the U.S. dollar has appreciated, with
a sharp increase in 2015. Further appreciation is projected through 2017. Although some depreciation is projected over the remainder of the projection period, the dollar is assumed to remain stronger than its 2011-14 lows.
• The strong U.S. dollar is expected to constrain growth in U.S. agricultural exports over the projection period—a stronger dollar increases the relative price of U.S. exports. Although trade competition will continue to be strong, the United States is projected to remain competitive in global agricultural markets. Export gains contribute to long-term increases in cash receipts for U.S. farmers.
Energy Prices
• Crude oil prices fell sharply beginning in mid-2014 as global crude oil production exceeded consumption and led to growing oil surpluses. As global economic activity improves, crude oil prices are assumed to increase from their recent lows at rates higher than the general inflation rate. Nonetheless, the U.S. nominal refiner acquisition cost for crude oil imports rises to only about $80 per barrel at the end of the projection period.
• Lower oil and natural gas prices have decreased agricultural production costs, with costs
for fuel and fertilizer falling the most. U.S. Agricultural Policy
• The Agricultural Act of 2014 is assumed to be in effect through the projection period.
• Acreage enrolled in the Conservation Reserve Program (CRP) is assumed at levels slightly
below its legislated maximum of 24 million acres under the 2014 Farm Act.

4 USDA Long-term Projections, February 2016
• Recent reductions in crop prices lead to higher direct Government payments to farmers in 2015 through 2017, mostly reflecting payments under the Agriculture Risk Coverage (ARC) and Price Loss Coverage (PLC) programs of the 2014 Farm Act. Beyond 2017, direct Government payments are lower and below the average of 2001-10. Payments under the CRP, ARC, and PLC programs are the largest Government payments to the U.S. agricultural sector over the projection period.
U.S. Biofuels
• Biofuel projections were completed before the final rule for the renewable fuel standards for
2014, 2015, and 2016 and the biomass-based diesel volume for 2017 were announced by the U.S. Environmental Protection Agency (EPA) on November 30, 2015. Projections are based on EPA’s proposed rule for these requirements from May 29, 2015.
• Ethanol production in the United States is projected to fall over the next decade. Almost all U.S. production of ethanol uses corn as a feedstock. Even with the U.S. ethanol production decline, demand for corn to produce ethanol continues to have a strong presence in the sector. While the share of U.S. corn expected to go to U.S. ethanol production falls, it accounts for over a third of total U.S. corn use throughout the projection period.
• Projected declines in overall gasoline consumption in the United States and the 10-percent
ethanol “blend wall” are assumed to constrain domestic ethanol production over the next decade. Most gasoline in the United States continues to be a 10-percent ethanol blend (E10). Infrastructural and other constraints severely limit growth in the E15 (15-percent ethanol blend) market. The E85 (85-percent ethanol blend) market remains very small. Moderate gains are projected for U.S. ethanol exports, but these are not large enough to offset declining ethanol use in the domestic market.
• The projections assume that a tax credit for blending biodiesel (previously, $1-per-gallon) is not available.
• The biomass-based diesel use volume requirement, as administered by the EPA, was increased to 1.28 billion gallons for 2013 and was proposed by EPA to rise to 1.9 billion gallons by 2017 (subsequently increased to 2.0 billion gallons in EPA’s November 30, 2015 final rule). Projections assume this volume requirement to remain at the proposed-rule level throughout the remainder of the projection period. However, some production of biodiesel and renewable diesel above the biomass-based diesel volume requirement is assumed to meet a portion of the nonspecific advanced biofuel requirement.
• Soybean oil used to produce methyl esters (biodiesel) in the United States is projected to support the production of almost 800 million gallons of biodiesel annually in the second half of the projection period. Other feedstocks used to produce biomass-based diesel include corn oil extracted from distillers grains, other first-use vegetable oils, animal fats, and recycled vegetable oils.

USDA Long-term Projections, February 2016 5
International Policy
• Agricultural trade projections assume trade agreements, sanitary and phytosanitary restrictions, and domestic policies in place in November 2015.
• The projections do not reflect potential effects of new policies implemented more recently in Argentina. These policies include reducing or removing export taxes on various agricultural commodities, eliminating the export permit system for grains and oilseeds, and lifting currency controls. These policy changes are likely to affect the agricultural sector in the country as well as global agricultural markets.
• The ban Russia imposed on agricultural imports from Western countries (such as the EU, United States, and Canada) is assumed to last through August 2016. However, the projections assume that Russia will continue to use policies to stimulate its domestic meat production and to limit its reliance on imports.
International Biofuels
• Global production of biofuel is projected to continue to increase during the next decade, although at a slower pace than over the last half decade. This slowdown in part reflects lower crude oil prices. As a result, demand for biofuel feedstocks is also projected to grow more slowly.
• The largest biofuel producers include the United States, Brazil, the EU, and China. Canada is projected to be the world’s largest importer of biofuels over the next decade, with most Canadian biofuel imports coming from the United States. Argentina, Brazil, and the United States are the largest biofuel exporters.
Prices
• Prices for most crops have fallen from recent highs as U.S. and global production responded to the high prices. As adjustments to the resulting lower prices occur, the projections indicate that nominal prices will bottom out and then rise moderately, reflecting long-term growth in global demand for agricultural products and continued biofuel feedstock demand. As a result, crop prices remain above pre-2007 levels.
• Reduced feed costs over the past several years have improved livestock-sector net returns, providing economic incentives for expansion. Additionally, U.S. turkey production and egg production rebound from 2015 reductions that were largely due to effects of highly pathogenic avian influenza (HPAI). Thus, nominal prices for beef cattle, hogs, broilers, turkeys, and eggs are projected to decline through most of the next decade as production rises. Nominal farm-level milk prices decline in 2015-18 as lower feed costs encourage increased production. Milk prices then rise faster than the overall rate of inflation for the rest of the projection period, largely reflecting strong growth in U.S. dairy product exports.
• Lower farm commodity prices result in reductions in U.S. export values 2015-16 and farm cash receipts in 2015-17, with both then growing over the rest of the projection period. Although farm production expenses also increase after 2017, higher cash receipts mean net farm income generally increases over the rest of the projection period.

6 USDA Long-term Projections, February 2016
Macroeconomic Assumptions The macroeconomic assumptions underlying USDA’s long-term projections indicate steady world economic growth over the next decade despite a near-term outlook moderated by a slowdown in many emerging economies. Real global gross domestic product (GDP) is projected to increase at an average annual rate of 3.1 percent over the projection period, slightly below the long-term, pre-financial crisis (1970-2007) average of 3.3 percent. The United States is expected to be the growth leader among developed countries over the next decade. U.S. economic growth is expected to be near 3 percent in 2016 and 2017 before moving to a longer term growth rate of 2.3 percent. While labor markets and credit conditions continue to improve in the United States and most developed countries, inflation is likely to remain subdued because of excess capacity. Long-run growth is expected to be relatively weak in the rest of the developed world, especially in Japan and the European Union (EU).
Economic growth in developing countries is projected to slow relative to recent years, especially in the near term. In particular, China’s economy is projected to grow less rapidly as the country makes the adjustment to a more consumer-oriented economy. Lingering economic challenges in Argentina, Brazil, and Venezuela constrain Latin American growth. Recessions in Russia and Ukraine are projected to continue in 2016. Nonetheless, developing country growth is expected to continue outpacing that of developed countries. As a result, developing countries’ share of global real GDP is projected to rise to 43.4 percent in 2025 from 37.7 percent in 2016. After a generally steady depreciation from 2002 to 2011 and relative weakness in subsequent years, the U.S. dollar appreciated significantly against the currencies of many key trade partners in 2015 and is projected to remain stronger than its 2011-14 lows throughout the projection period. Crude oil prices are projected to rise slowly to around $80 per barrel over the projection period after a dramatic decline starting in mid-2014.
-4
-3
-2
-1
0
1
2
3
4
5
1990 1995 2000 2005 2010 2015 2020 2025
U.S. and world gross domestic product (GDP) growthPercent
World
United States

USDA Long-term Projections, February 2016 7
Agricultural Implications Global demand for food and agricultural products is expected to grow over the projection period, even with slower economic growth in developing countries. Economic growth and population gains in developing countries provide a boost to global agricultural demand as more people in those countries become middle class consumers. Improved economic conditions in developed country markets will provide an additional boost to global demand. With world economic and population growth concentrated in developing countries, those countries continue to account for most of the gains in U.S. agricultural exports. Although a stronger U.S. dollar constrains growth in U.S. agricultural exports, the United States will remain a competitive agricultural exporter.
• Although growth prospects in developing countries have dampened, incomes will continue to rise, bringing more consumers into the middle class. In this process, diets become more diversified and meat, dairy, and processed foods consumption increases. This shifts import demand toward animal feed and high-value food products.
• The 2002-11 depreciation of the dollar gave the United States an advantage in international markets. The reversal of this trend will erode U.S. competitiveness as a stronger dollar increases the relative price of U.S. exports.
• Low energy prices in early years of the projection period will decrease costs of production for farmers and ranchers. The availability of domestic oil and natural gas supplies will dampen cost increases for U.S. producers relative to competitors as global energy prices rise. Agricultural trade also has benefited from reduced shipping and freight rates resulting from lower energy prices.
8 USDA Long-term Projections, February 2016
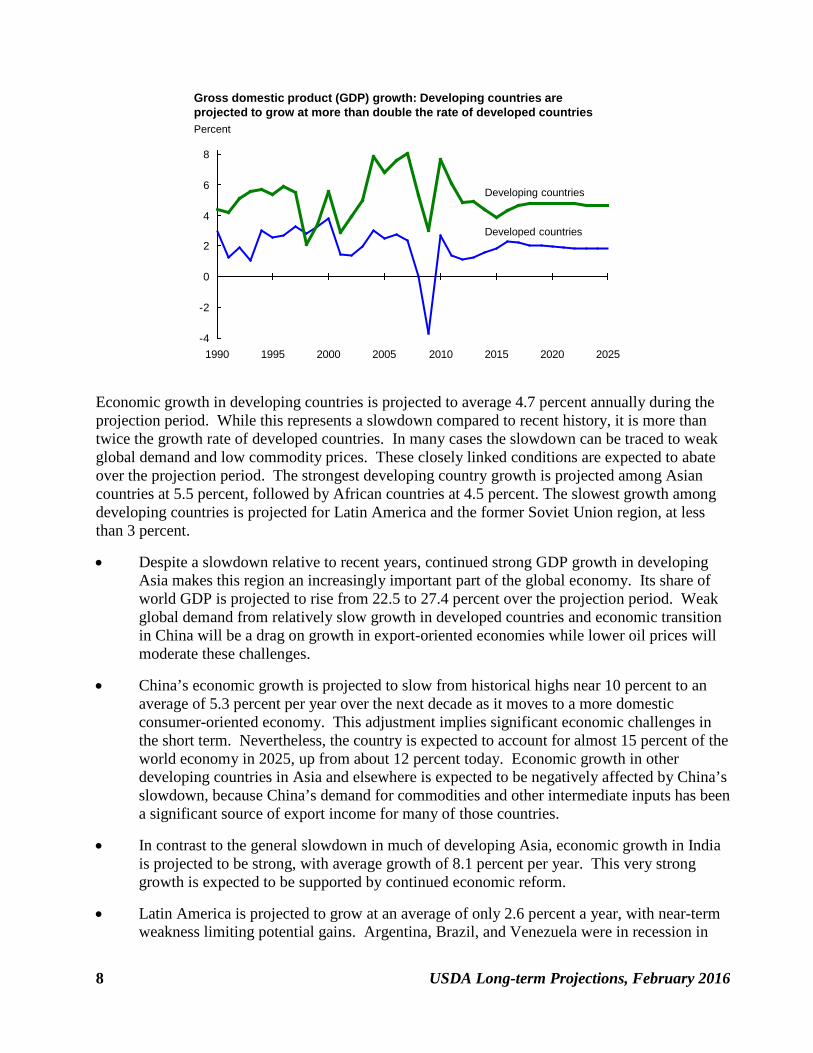
Economic growth in developing countries is projected to average 4.7 percent annually during the projection period. While this represents a slowdown compared to recent history, it is more than twice the growth rate of developed countries. In many cases the slowdown can be traced to weak global demand and low commodity prices. These closely linked conditions are expected to abate over the projection period. The strongest developing country growth is projected among Asian countries at 5.5 percent, followed by African countries at 4.5 percent. The slowest growth among developing countries is projected for Latin America and the former Soviet Union region, at less than 3 percent.
• Despite a slowdown relative to recent years, continued strong GDP growth in developing Asia makes this region an increasingly important part of the global economy. Its share of world GDP is projected to rise from 22.5 to 27.4 percent over the projection period. Weak global demand from relatively slow growth in developed countries and economic transition in China will be a drag on growth in export-oriented economies while lower oil prices will moderate these challenges.
• China’s economic growth is projected to slow from historical highs near 10 percent to an average of 5.3 percent per year over the next decade as it moves to a more domestic consumer-oriented economy. This adjustment implies significant economic challenges in the short term. Nevertheless, the country is expected to account for almost 15 percent of the world economy in 2025, up from about 12 percent today. Economic growth in other developing countries in Asia and elsewhere is expected to be negatively affected by China’s slowdown, because China’s demand for commodities and other intermediate inputs has been a significant source of export income for many of those countries.
• In contrast to the general slowdown in much of developing Asia, economic growth in India is projected to be strong, with average growth of 8.1 percent per year. This very strong growth is expected to be supported by continued economic reform.
• Latin America is projected to grow at an average of only 2.6 percent a year, with near-term weakness limiting potential gains. Argentina, Brazil, and Venezuela were in recession in
-4
-2
0
2
4
6
8
1990 1995 2000 2005 2010 2015 2020 2025
Gross domestic product (GDP) growth: Developing countries are projected to grow at more than double the rate of developed countries Percent
Developed countries
Developing countries
USDA Long-term Projections, February 2016 9
2015, with very slow growth or continued recession is expected in the near term, followed by a slow recovery. The projection for Mexico is stronger. After short term sluggishness due to low commodity prices, the Mexican economy is expected to benefit from a strengthening U.S. economy. Average annual growth is expected to be strong at roughly 3.3 percent.
• Economic growth in Africa, the poorest region in the world, is projected to average 4.5 percent per year. This growth rate is high by historical standards and is likely to improve standards of living and mitigate increases in the poverty rate. However, low per capita GDP levels imply significant poverty will persist. Near-term economic weakness in China is not expected to affect African growth, on average, to the same extent as other developing countries. This is less a sign of economic resilience than a reflection of Africa’s lack of integration with the global economy. However, there are important exceptions—for countries that are primarily commodity exporters, slowing Chinese demand and the persistence of low prices more generally present a challenge.
• Following several years of average annual growth below 3 percent, the Middle East and North Africa region is expected to grow at an average annual rate of about 4 percent over the projection period. As with other developing countries, many of these economies are facing slow growth in the near term. For some, this is due to low commodity prices, particularly oil prices. Others are experiencing political instability and violence that has brought economic activity to a virtual standstill.
• Low oil prices and geopolitical conflicts, among other factors, pushed the former Soviet
Union region into a deep recession in 2015, which is expected to continue in 2016. Growth prospects for the region have been nearly cut in half from recent history—projected growth is 2.5 percent on average for the next decade, compared to a 4.5 percent average over 2000-15.

10 USDA Long-term Projections, February 2016
Developed economies continue to recover from the 2007-08 global financial crisis and 2010-13 European debt crisis—growth is expected to be relatively anemic at an average rate of less than 2 percent annually over the projection period. The economies of the European Union and Japan are expected to experience particularly weak growth. Growth rates for the United States, Canada, and Australia is expected to be stronger, although still below the long-term trend.
• U.S. economic growth is expected to be strong relative to the rest of the developed world
throughout the projection period. The U.S. economy will benefit from relatively strong domestic consumer and investment demand, driven by low oil prices, low interest rates, and a continuing rebound from the 2007-08 global financial crisis. Weakness in the international sector and a strong dollar will be drags on export demand, however, particularly in the near term.
• Economic growth in the European Union is projected at about 1.8 percent per year over the next decade. Challenges continue within the Eurozone, particularly with the ability of Greece and other members to meet debt obligations. Structural rigidities also constrain the EU outlook. Growth in the former centrally planned EU member countries is projected to be somewhat higher, at an annual average close to 3 percent over the projection period.
• The projections assume economic growth in Japan averages less than 1 percent per year, a continuation of the slow growth and deflationary environment that Japan has experienced since the 1990s. Economic initiatives to boost growth and overcome deflation have had limited success. Going forward, a shrinking working age population implies slowing labor force growth, a key element of economic growth.
• The Canadian economy is facing sluggish near-term growth, as a nascent economic
recovery has been undercut by low energy prices. Low commodity prices are likewise expected to be a drag on Australian growth.
-6
-4
-2
0
2
4
6
1990 1995 2000 2005 2010 2015 2020 2025
Growth in gross domestic product (GDP) for developed countries, European Union, and JapanPercent
Developed countries
Japan
European Union

USDA Long-term Projections, February 2016 11
World population growth is projected to continue slowing over the next decade, rising about 1.0 percent per year for the projection period compared to an annual rate of 1.4 percent over the decade 1991-2000 and 1.2 percent in 2001-10. • Developed countries have very low projected rates of population growth, at 0.4 percent over
2016-25. U.S. population growth is projected to exceed the developed country average at about 0.7 percent, in part reflecting the importance of immigration. Only small population increases are projected for the European Union, averaging 0.2 percent over the next decade. However, this projection does not take into account recent increases in immigration from Africa and the Middle East, which may affect European population growth for several years. Population in Japan is projected to fall at around 0.3 percent per year.
• Population growth rates in developing countries are projected to be sharply lower than in previous decades, but remain above those in the rest of the world at about 1.1 percent per year over the projection period. As a result, developing countries’ share of global population is projected to be 83 percent by 2025, compared to 79 percent in 2000. Notable lower rates of population growth include Brazil, where the population is expected to grow by 0.7 percent per year from 2016-25, compared to an average of 1.6 percent in 1991-2000. Similarly, Indonesia’s population is expected to grow by 0.8 percent per year from 2016-25 compared to 1.7 percent in 1991-2000.
• Sub-Saharan Africa maintains the highest population growth rate at 2.4 percent per year. Like other regions, population growth has fallen compared to historical experience, although the decline is relatively modest.
• China and India together accounted for 36 percent of the world’s population in 2015. Population growth in both countries has declined significantly relative to 1991-2000. China’s population is expected to grow at only 0.3 percent per year over the projection period, well below the global average. As such, its share of the global population is
-0.5
0.0
0.5
1.0
1.5
2.0
2.51991-20002001-102016-25
Population growth continues to slowAverage annual percent
Source: U.S. Department of Commerce, U.S. Census Bureau, International Data Base athttp://www.census.gov/population/international/data/idb/informationGateway.php
World United States
FormerSoviet Union
AfricaMiddle East
DevelopingAsia
LatinAmerica
Developingcountries
Developedcountries

12 USDA Long-term Projections, February 2016
projected to decline. Population growth in India is likewise expected to slow to 1.1 percent per year over 2016-25 compared to 1.8 percent per year over 1991-2000.
• Population growth in the former Soviet Union region is expected to average 0.1 percent per year over the projection period. Russian and Ukrainian populations are expected to decline, with average growth rates of -0.2 and -0.4 percent, respectively.
• Population growth in the Middle East is forecast to grow above the world average, at 1.4 percent. Migration within and outside the region is expected to continue. However, this projection does not take into account recent increases in emigration, primarily to Europe.

USDA Long-term Projections, February 2016 13
From mid-2014 to the end of 2015, the U.S. agricultural trade-weighted dollar appreciated more than 13 percent in real terms. This appreciation was primarily driven by the relative strength and safety of the U.S. economy. Monetary policy both at home and abroad will continue to keep the value of the U.S. dollar strong. Although U.S. interest rates are likely to remain relatively low for some time before moving back toward historical averages, they are expected to rise sooner and faster than rates in other developed countries. • The real value of the dollar increased substantially in 2015 relative to developed country
currencies, up more than 18 percent relative to the euro, 13.5 percent relative to the yen, over 14 percent relative to the Canadian dollar, and more than 18 percent relative to the Australian dollar. These gains largely reflect the relative strength of the U.S. economy in a period of economic uncertainty in Europe and weakness elsewhere in the developed world. Since these conditions are expected to persist in the near term, the dollar is expected to strengthen further, although at a slower pace, against most developed country currencies before stabilizing in the longer run as economic conditions improve and monetary policy normalizes in these countries.
• The dollar also appreciated relative to developing country currencies in 2015, although generally less sharply. The real dollar appreciated about 11 percent relative to Latin American currencies; 5.6 percent relative to Southeast Asian countries; 6.6 percent relative to Middle Eastern countries; and 6.8 percent relative to African countries. In the near term, the dollar is projected to continue appreciating relative to most developing country currencies in nominal terms. However, high rates of inflation in many developing countries are expected to mitigate rising nominal dollar values and may result in real dollar depreciation, notably in Latin American countries.
• The dollar appreciated relative to the Chinese yuan in the second half of 2015. The Chinese
have maintained a policy of keeping the value of the yuan closely linked to the dollar, which, for the 10 years up through the end of 2014, resulted in a slow, steady appreciation of the yuan. However, as the dollar began to strengthen and the Chinese economy began to
90
100
110
120
1990 1995 2000 2005 2010 2015 2020 2025
U.S. agricultural trade-weighted dollar Index values, 2010=100, foreign currency per dollar
Note: Real U.S. agricultural trade-weighted dollar exchange rate, using 2009-2011 U.S. agricultural export weights.

14 USDA Long-term Projections, February 2016
slow at the end of 2014, the yuan began to slowly depreciate. In August 2015, Chinese authorities announced a policy change that would allow its exchange rate to be more influenced by market forces. This led to an immediate nominal depreciation of roughly 3 percent, along with some with further depreciation toward the end of the year. The projections assume that the economic slowdown in China will mean that the yuan will continue depreciating at a measured pace over the next two years, followed by a period of relatively stable real exchange rates as adjustment takes hold.
• The largest real appreciation of the dollar in 2015 was with respect to the countries of the former Soviet Union. The dollar appreciated 33 percent in real terms against a trade-weighted basket of currencies in the region, appreciating more than 36 percent with respect to the Russian ruble and over 26 percent against Ukraine’s currency. The dollar is expected to continue to appreciate in nominal terms in the next few years against many of the FSU currencies, although generally high rates of inflation in the FSU are expected to result in real dollar depreciation in many cases.

USDA Long-term Projections, February 2016 15
The projections reflect continued low crude oil prices in the near term, rising to about $80 per barrel by the end of the projection period.
• Growing surpluses of oil in late 2014 and into 2015 led to a more than 50 percent decline in crude oil prices. Both weak global demand and steady, if not rising, supply are expected to keep prices low in the near term. Low oil prices will lead to a significant reduction in exploration and development, resulting in rising prices throughout the projection period.
• Increased domestic oil and natural gas production using horizontal drilling and hydraulic fracturing (fracking) technology has increased U.S. domestic supply substantially, reducing the need for petroleum imports. In the absence of a substantial increase in U.S. crude oil exports, domestic oil prices will be below world crude oil prices.
0
25
50
75
100
125
1990 1995 2000 2005 2010 2015 2020 2025
U.S. crude oil pricesDollars per barrel
Refiner acquisition cost,crude oil imports
Refiner acquisition cost, adjusted for inflation

16 USDA Long-term Projections, February 2016
Table 1. U.S. macroeconomic assumptionsItem 2014 2015 2016 2017 2018 2019 2020 2021 2022 2023 2024 2025
Gross Domestic Product Nominal, billion dollars 17,348 17,966 18,786 19,648 20,548 21,483 22,438 23,413 24,431 25,493 26,600 27,756 Real, billion 2009 chain-weighted dollars 15,962 16,329 16,812 17,290 17,751 18,195 18,632 19,060 19,498 19,947 20,405 20,875 percent change 2.4 2.3 3.0 2.8 2.7 2.5 2.4 2.3 2.3 2.3 2.3 2.3
Disposable personal income Nominal, billion dollars 12,914 13,478 14,079 14,710 15,366 16,043 16,725 17,428 18,160 18,922 19,717 20,545 percent change 4.2 4.4 4.5 4.5 4.5 4.4 4.3 4.2 4.2 4.2 4.2 4.2 Nominal per capita, dollars 40,461 41,921 43,473 45,097 46,772 48,484 50,193 51,939 53,749 55,628 57,577 59,601 percent change 3.4 3.6 3.7 3.7 3.7 3.7 3.5 3.5 3.5 3.5 3.5 3.5 Real, billion 2009 chain-weighted dollars 11,836 12,208 12,562 12,912 13,248 13,566 13,872 14,177 14,489 14,808 15,133 15,466 percent change 2.7 3.1 2.9 2.8 2.6 2.4 2.3 2.2 2.2 2.2 2.2 2.2 Real per capita, 2009 chained dollars 37,084 37,971 38,790 39,584 40,323 40,999 41,630 42,251 42,884 43,531 44,192 44,867 percent change 2.0 2.4 2.2 2.0 1.9 1.7 1.5 1.5 1.5 1.5 1.5 1.5
Personal consumption expenditures Real, billion 2009 chain-weighted dollars 10,876 11,208 11,531 11,845 12,153 12,445 12,725 13,005 13,291 13,584 13,883 14,188 percent change 2.7 3.1 2.9 2.7 2.6 2.4 2.3 2.2 2.2 2.2 2.2 2.2
Inflation measures GDP chained price index, 2009=100 108.7 110.0 111.7 113.6 115.8 118.1 120.4 122.8 125.3 127.8 130.4 133.0 percent change 1.6 1.2 1.6 1.7 1.9 2.0 2.0 2.0 2.0 2.0 2.0 2.0 CPI-U, 1982-84=100 236.7 237.2 241.7 246.6 251.7 257.3 263.2 269.2 275.4 281.8 288.2 294.9 percent change 1.6 0.2 1.9 2.0 2.1 2.2 2.3 2.3 2.3 2.3 2.3 2.3 PPI, finished goods 1982=100 200.4 194.8 199.3 203.6 207.6 211.8 216.4 221.2 226.0 231.0 236.1 241.3 percent change 1.9 -2.8 2.3 2.2 2.0 2.0 2.2 2.2 2.2 2.2 2.2 2.2 PPI, crude goods 1982=100 249.2 197.8 205.3 212.8 219.8 226.5 233.0 239.3 245.4 251.2 256.9 262.5 percent change 1.1 -20.6 3.8 3.6 3.3 3.1 2.9 2.7 2.5 2.4 2.3 2.2
Crude oil price, $/barrel EIA refiner acquisition cost, imports 89.6 47.2 50.1 53.9 57.5 61.1 64.6 68.0 71.4 74.6 77.8 80.9 percent change -8.7 -47.3 6.2 7.5 6.8 6.2 5.7 5.3 4.9 4.6 4.3 4.0 Real 2009 chain-weighted dollars 82.4 42.9 44.9 47.4 49.7 51.8 53.6 55.4 57.0 58.4 59.7 60.9 percent change -10.2 -47.9 4.6 5.7 4.8 4.1 3.6 3.2 2.9 2.5 2.2 2.0
Labor compensation per hour nonfarm business, 2005=100 111.1 114.5 117.3 120.4 123.7 126.9 130.2 133.5 137.0 140.6 144.2 148.0 percent change 2.7 3.0 2.4 2.7 2.7 2.6 2.6 2.6 2.6 2.6 2.6 2.6
Interest rates, percent 3-month Treasury bills 0.03 0.05 0.5 1.2 1.9 2.6 3.1 3.2 3.2 3.2 3.2 3.2 3-month AA nonfinancial commercial paper 0.10 0.13 0.6 1.3 2.0 2.8 3.3 3.4 3.4 3.4 3.4 3.4 Bank prime rate 3.25 3.25 3.9 4.7 5.2 5.8 6.2 6.2 6.2 6.2 6.2 6.2 10-year Treasury bonds 2.54 2.20 2.9 3.5 3.9 4.1 4.3 4.3 4.4 4.4 4.4 4.4 Moody's Aaa bond yield index 4.16 3.90 4.6 4.9 5.1 5.3 5.6 5.6 5.7 5.7 5.7 5.7
Labor and populationCivilian unemployment rate, percent 6.2 5.4 5.1 4.9 4.9 5.0 5.1 5.2 5.2 5.2 5.2 5.2Nonfarm payroll employees, millions 139.0 141.6 143.5 145.0 146.0 147.0 148.1 149.1 150.2 151.2 152.3 153.3 percent change 1.9 1.9 1.3 1.0 0.7 0.7 0.7 0.7 0.7 0.7 0.7 0.7
Total population, millions 319.2 321.5 323.9 326.2 328.5 330.9 333.2 335.5 337.9 340.2 342.4 344.7 percent change 0.7 0.7 0.7 0.7 0.7 0.7 0.7 0.7 0.7 0.7 0.7 0.7
Domestic macroeconomic assumptions were completed in October 2015. CPI-U is the consumer price index for all urban consumers. PPI is the producer price index. EIA is the Energy Information Administration, U.S. Department of Energy.

USDA Long-term Projections, February 2016 17
Table 2. Global real GDP growth assumptions
2014 2015 2016 2017 2018 2019 1991-2000 2001-2010 2016-2025
Bil. 2010 dollars Percent
2010 dollars Percent change in real GDP
World 72,574 100.0 10,188 2.6 2.4 3.0 3.1 3.1 3.1 2.8 2.8 3.1
North America 18,053 24.9 50,997 2.4 2.2 2.9 2.8 2.7 2.5 3.4 1.7 2.5Canada 1,771 2.4 50,852 2.5 1.0 2.2 2.7 2.7 2.4 2.9 1.9 2.3United States 16,282 22.5 51,013 2.4 2.3 3.0 2.8 2.7 2.5 3.4 1.7 2.5
Latin America 5,975 8.3 9,787 1.0 -0.3 0.9 2.0 2.5 2.8 3.1 3.3 2.6Mexico 1,178 1.6 9,792 2.1 2.5 3.1 3.3 3.4 3.5 3.6 1.8 3.3Caribbean & Central America 470 0.6 5,580 2.9 2.8 3.2 3.2 3.3 3.4 3.0 3.0 3.5South America 4,327 6.0 10,659 0.5 -1.3 0.0 1.5 2.2 2.5 3.0 3.8 2.3
Argentina 523 0.7 12,149 0.5 -0.3 0.1 0.3 0.4 0.4 4.7 4.1 0.7Brazil 2,404 3.4 11,862 0.1 -2.7 -1.0 1.0 1.7 2.2 2.6 3.7 1.8Other 1,400 1.9 8,737 1.0 0.6 1.7 2.9 3.5 3.7 3.2 3.9 3.6
Europe 18,547 26.0 34,196 1.3 1.8 2.0 2.0 1.8 1.8 2.2 1.5 1.8European Union 17,373 24.3 33,888 1.3 1.9 2.1 2.0 1.8 1.8 2.2 1.3 1.8Other Europe 1,175 1.6 39,506 1.9 0.7 1.3 2.1 2.0 1.9 1.9 1.9 1.8
Former Soviet Union 2,249 3.1 7,918 0.9 -3.3 -0.3 2.4 3.3 3.3 -4.0 5.4 2.5Russia 1,677 2.3 11,770 0.6 -4.0 -1.0 2.0 3.0 3.0 -3.6 4.9 2.1Ukraine 134 0.2 2,982 -6.8 -10.3 -4.0 0.1 4.0 4.4 -7.7 4.6 3.1Other 438 0.6 4,534 4.5 1.7 3.3 4.1 4.2 3.9 -3.3 8.5 3.5
Asia and Oceania 22,469 30.4 5,732 4.4 4.4 4.6 4.3 4.3 4.4 3.8 4.8 4.3East Asia 15,914 21.6 10,127 4.1 4.0 4.2 3.8 3.7 3.8 3.5 4.6 3.7
China 8,236 10.8 6,050 7.4 6.5 6.1 5.7 5.5 5.3 10.5 10.5 5.3Hong Kong 257 0.4 36,202 2.5 2.4 2.8 3.1 3.3 3.5 4.0 4.1 3.3Japan 5,650 7.9 44,455 -0.1 1.0 1.6 0.7 0.8 1.3 1.1 0.8 1.0South Korea 1,234 1.7 25,162 3.3 2.7 3.4 3.4 3.4 3.2 6.6 4.4 3.0Taiwan 483 0.7 20,686 3.8 1.6 3.4 3.5 3.1 2.8 6.2 4.0 2.4
Southeast Asia 2,439 3.3 3,882 4.6 4.5 4.7 4.9 5.1 5.0 5.1 5.1 4.9Burma 125 0.2 2,247 7.7 6.8 7.2 7.0 6.7 6.5 6.5 5.2 6.2Cambodia 15 0.0 960 7.0 7.7 7.7 7.6 7.5 7.4 6.9 8.1 7.3Indonesia 943 1.3 3,717 5.0 4.8 5.0 5.3 5.4 5.3 4.4 5.2 5.2Malaysia 305 0.4 10,158 6.0 4.7 4.3 4.7 4.7 4.7 7.2 4.6 4.5Philippines 251 0.3 2,528 6.1 5.4 5.6 5.6 5.6 5.3 2.9 4.8 5.2Thailand 352 0.5 5,199 0.7 2.7 3.3 3.3 3.8 3.8 4.6 4.4 3.6Vietnam 145 0.2 1,550 6.0 6.3 6.4 6.7 6.7 6.6 7.6 6.6 6.5
South Asia 2,660 3.5 1,579 7.1 7.2 7.7 7.7 7.7 7.8 5.3 7.0 7.7Bangladesh 147 0.2 884 6.1 5.9 6.3 6.7 6.9 6.9 4.7 5.6 6.5India 2,198 2.9 1,778 7.4 7.6 8.1 8.0 8.0 8.2 5.6 7.5 8.1Pakistan 208 0.3 1,059 5.4 5.5 5.6 5.6 5.5 5.5 4.0 4.2 5.4
Oceania 1,456 2.0 40,389 2.6 2.6 2.7 2.9 2.9 2.9 3.3 3.0 2.8Australia 1,272 1.8 56,534 2.5 2.4 2.6 2.9 2.9 3.0 3.3 3.0 2.8New Zealand 161 0.2 36,495 3.3 2.8 2.7 2.7 2.6 2.6 3.1 2.5 2.5
Middle East 3,083 4.3 10,085 2.1 2.4 3.2 3.7 4.3 4.4 4.0 4.3 4.0Iran 408 0.6 5,052 1.5 1.0 4.3 4.9 5.3 5.5 3.8 5.1 5.0Iraq 174 0.3 4,847 -6.4 2.3 3.0 4.8 5.3 5.5 9.1 5.0 5.5Saudi Arabia 649 0.9 23,715 3.5 3.0 3.1 3.4 4.8 4.8 2.8 5.1 4.3Turkey 871 1.2 11,104 2.9 2.9 3.0 3.4 4.0 4.0 3.7 4.0 3.8Other 982 1.4 11,799 2.6 2.1 3.0 3.5 3.7 3.9 5.5 4.0 3.3
Africa 2,198 3.0 1,986 3.4 3.5 4.0 4.7 4.8 4.8 2.6 5.3 4.5North Africa 612 0.9 3,481 0.7 3.2 3.3 4.6 4.7 4.5 3.8 4.5 4.2
Egypt 238 0.3 2,735 2.2 4.3 3.7 4.2 4.5 4.6 4.3 4.9 4.4Morocco 105 0.1 3,175 2.6 4.7 4.4 5.0 4.8 4.5 3.0 4.9 3.9
Sub-Saharan Africa 1,586 2.1 1,703 4.5 3.6 4.2 4.7 4.9 4.9 2.1 5.7 4.7South Africa 411 0.6 7,753 1.5 1.5 1.9 2.6 3.2 3.2 1.8 3.5 3.0West African Community 599 0.8 1,790 4.1 4.8 5.1 5.0 4.9 4.9 2.3 6.0 4.9Other Sub-Saharan Africa 576 0.8 1,059 5.2 4.6 5.1 5.5 5.5 5.6 2.1 6.0 5.5
AverageGDP share
2012-14Region/countryPer capita GDP, 2014GDP, 2014
Source: Historical data from various sources; compiled in the International Macroeconomic Data Set, U.S. Department of Agriculture, Economic Research Service. International macroeconomic assumptions were based on information available in August 2015.

18 USDA Long-term Projections, February 2016
Table 3. Population growth assumptions
2014 2015 2016 2017 2018 2019 1991-2000 2001-2010 2016-2025Millions Percent change
World1 7,200 1.1 1.1 1.1 1.1 1.0 1.0 1.4 1.2 1.0
North America 357 0.7 0.7 0.7 0.7 0.7 0.7 1.2 0.9 0.7Canada 35 0.8 0.8 0.7 0.7 0.7 0.7 1.1 0.8 0.7United States 322 0.7 0.7 0.7 0.7 0.7 0.7 1.2 0.9 0.7
Latin America 617 1.0 1.0 1.0 1.0 0.9 0.9 1.6 1.2 0.9Mexico 122 1.2 1.2 1.2 1.1 1.1 1.1 1.7 1.3 1.0Caribbean & Central America 85 1.0 1.0 1.0 1.0 1.0 0.9 1.7 1.2 0.9South America 410 1.0 0.9 0.9 0.9 0.9 0.9 1.6 1.2 0.8
Argentina 43 1.0 0.9 0.9 0.9 0.9 0.9 1.2 1.0 0.8Brazil 204 0.8 0.8 0.8 0.7 0.7 0.7 1.6 1.2 0.7Other 162 1.2 1.1 1.1 1.1 1.1 1.1 1.8 1.3 1.0
Europe 544 0.3 0.3 0.2 0.2 0.2 0.2 0.2 0.4 0.2European Union 514 0.3 0.3 0.2 0.2 0.2 0.2 0.2 0.4 0.2Other Europe 30 0.4 0.3 0.3 0.3 0.3 0.3 0.0 0.2 0.2
Former Soviet Union 284 0.1 0.1 0.2 0.2 0.2 0.2 0.1 0.0 0.1Russia 142 0.0 0.0 0.0 -0.1 -0.1 -0.1 -0.1 -0.3 -0.2Ukraine 44 -1.0 -1.1 -0.5 -0.4 -0.2 0.0 -0.5 -0.7 -0.4Other 97 0.8 0.8 0.8 0.8 0.7 0.7 0.6 0.7 0.7
Asia and Oceania 3,956 0.9 0.9 0.9 0.9 0.9 0.8 1.4 1.1 0.8East Asia 1,578 0.4 0.4 0.4 0.4 0.3 0.3 0.9 0.5 0.2
China 1,367 0.4 0.5 0.4 0.4 0.4 0.4 1.0 0.5 0.3Hong Kong 7 0.4 0.4 0.4 0.3 0.3 0.3 1.6 0.5 0.2Japan 127 -0.1 -0.1 -0.2 -0.2 -0.2 -0.2 0.3 0.1 -0.3South Korea 49 0.2 0.2 0.1 0.1 0.1 0.1 0.9 0.4 0.1Taiwan 23 0.3 0.2 0.2 0.2 0.2 0.1 0.9 0.4 0.1
Southeast Asia 635 1.1 1.1 1.0 1.0 1.0 1.0 1.8 1.4 0.9Burma 56 1.0 1.0 1.0 1.0 1.0 1.0 1.6 1.2 0.9Cambodia 16 1.7 1.6 1.6 1.5 1.5 1.5 2.8 1.6 1.4Indonesia 256 1.0 0.9 0.9 0.9 0.8 0.8 1.7 1.3 0.8Malaysia 31 1.5 1.5 1.4 1.4 1.4 1.3 2.6 2.0 1.3Philippines 101 1.7 1.6 1.6 1.6 1.6 1.6 2.2 2.0 1.5Thailand 68 0.4 0.3 0.3 0.3 0.3 0.3 1.2 0.6 0.2Vietnam 94 1.0 1.0 1.0 0.9 0.9 0.9 1.6 1.2 0.8
South Asia 1,707 1.4 1.3 1.3 1.3 1.3 1.2 2.0 1.6 1.2Bangladesh 169 1.6 1.6 1.6 1.6 1.6 1.6 1.6 1.7 1.6India 1,252 1.3 1.2 1.2 1.2 1.2 1.1 1.8 1.5 1.1Pakistan 199 1.5 1.5 1.5 1.5 1.4 1.4 2.5 1.9 1.4
Oceania 36 1.2 1.2 1.2 1.1 1.1 1.1 1.4 1.4 1.0Australia 23 1.1 1.1 1.1 1.0 1.0 1.0 1.2 1.2 1.0New Zealand 4 0.8 0.8 0.8 0.8 0.8 0.8 1.1 1.1 0.7
Middle East 310 1.4 1.4 1.5 1.6 1.6 1.5 2.1 1.9 1.4Iran 82 1.2 1.2 1.2 1.2 1.1 1.1 1.7 1.1 1.0Iraq 37 3.7 3.0 2.9 2.7 2.6 2.5 2.5 2.8 2.5Saudi Arabia 28 1.5 1.5 1.5 1.5 1.4 1.4 2.9 1.9 1.4Turkey 79 1.3 1.3 1.1 0.7 0.5 0.5 1.6 1.2 0.6Other 84 0.6 1.0 1.7 2.2 2.5 2.4 3.0 2.8 1.9
Africa 1,133 2.4 2.4 2.3 2.3 2.3 2.3 2.5 2.5 2.2North Africa 179 1.7 1.7 1.6 1.5 1.5 1.5 1.7 1.8 1.4
Egypt 88 1.9 1.8 1.8 1.7 1.7 1.7 1.7 2.1 1.6Morocco 33 1.0 1.0 1.0 1.0 1.0 0.9 1.6 1.2 0.9
Sub-Saharan Africa 954 2.5 2.5 2.5 2.4 2.4 2.4 2.6 2.6 2.4South Africa 54 1.1 1.3 1.2 1.0 1.0 1.0 1.6 1.3 1.0West African Community 343 2.6 2.5 2.5 2.5 2.5 2.5 2.6 2.7 2.5Other Sub-Saharan Africa 558 2.7 2.6 2.6 2.5 2.5 2.5 2.8 2.7 2.4
AveragePopulation in 2015Region/country
1/ Totals for the world include countries not otherwise listed in the table.Source: U.S. Department of Commerce, U.S. Census Bureau, http://www.census.gov/population/international/data/idb/informationGateway.php.The population assumptions were completed in August 2015 based on the July 2015 Census update.

USDA Long-term Projections, February 2016 19
U.S. Crops Prices for most crops have fallen from highs of recent years as U.S. and global supplies have rebounded from relatively low levels. In response to the associated lower producer returns, planted area for major field crops in the United States has fallen from the highs of 2012-14 and is projected to continue to decline. U.S. planted acreage for eight major field crops (corn, sorghum, barley, oats, wheat, rice, upland cotton, and soybeans) averaged almost 257 million acres in 2012-14 and is projected to fall below 250 million acres by 2017. Wheat, corn, and cotton account for most of the decline between these years.
Over the long run, steady global economic growth provides a foundation for increasing crop demand, with gains in world consumption and trade. Although crop prices are projected to be below recent records, they remain above pre-2007 levels. U.S. plantings for the eight major crops continue to fall during the second half of the projection period, to about 244 million acres by 2025. Corn and soybeans decrease the most. Increasing yields provide most of the gains in U.S. production.
Farm programs of the Agricultural Act of 2014 are assumed to be extended through the projection period. Acreage enrolled in the Conservation Reserve Program (CRP) is assumed at levels slightly below the legislated maximum of 24 million acres.
230
240
250
260
1990 1995 2000 2005 2010 2015 2020 2025
U.S. planted area: Eight major crops1
Million acres
1 The eight major crops are corn, sorghum, barley, oats, wheat, rice, upland cotton, and soybeans.
0
10
20
30
40
1990 1995 2000 2005 2010 2015 2020 2025
Conservation Reserve Program (CRP) acreage
Million acres

20 USDA Long-term Projections, February 2016
Moderate growth in demand for U.S. corn is projected over the next decade with rising yields boosting production and supporting growth in usage. Planted area, however, falls as real prices and returns for corn decline over time.
• Ethanol production in the United States is based almost entirely on corn as a feedstock. Corn-based ethanol production is projected to fall over the next 10 years. This reflects declining overall gasoline consumption in the United States (which is mostly a 10-percent ethanol blend, E10), infrastructural and other constraints on growth for E15 (15-percent ethanol blend), and the small size of the market for E85 (85-percent ethanol blend), with less-than-offsetting increases in U.S. ethanol exports. Demand for corn to produce ethanol continues to have a strong presence in the sector, although the share of total U.S. corn use expected to go to ethanol production falls from 37 to 34 percent during the projection period.
• Rising corn production, lower corn prices than in recent years, and increasing meat production underlie projected gains in feed and residual corn use over the next decade. Also supporting gains in feed use of corn is the decline in the production of distillers grains, a co-product of dry mill ethanol production used for feeding livestock, as corn-based ethanol falls.
• Food and industrial use of corn (other than ethanol production) is projected to rise at a moderate pace over the next decade. Use of corn for high fructose corn syrup (HFCS) falls slightly over the projection period as increases in HFCS exports to Mexico are offset by declines in domestic use. Increases in corn used for glucose and dextrose are small. Corn use for starch will increase at a slightly faster rate than population as demand for corn-based starch, used in the production of drywall and paper products, grows with the economy.
• The United States remains the world’s largest corn exporter in the projection period, with U.S. corn exports increasing in response to rising global demand for feed grains to support growth in world meat production. Nonetheless, the strong U.S. dollar constrains U.S. corn export growth somewhat. Combined with trade competition from Argentina, Brazil, and Ukraine, growing domestic feed use, and continued use of corn for ethanol production in the United States, the U.S. market share of global corn trade is held steady at 38-39 percent in the projection period, well below its 1970-2000 average of 71 percent.
0
1
2
3
4
5
6
7
1990 1995 2000 2005 2010 2015 2020 2025
U.S. corn: Feed and residual use, ethanol, and exports
Billion bushels
Feed and residual use
Exports
Ethanol

USDA Long-term Projections, February 2016 21
U.S. wheat plantings are projected to decline to 51.0-51.5 million acres and remain at that level over the next decade. Domestic demand for U.S. wheat is projected to be relatively stable through the projection period, with gains in food use generally offset by declines in feed use. U.S. wheat exports are expected to increase from recent lows while the U.S. share of global wheat trade is relatively steady.
• Domestic demand for wheat reflects a relatively mature market. Food use of wheat is projected to show moderate gains, generally in line with U.S. population increases.
• Feed use of wheat is a lower value market for the crop. With near-term wheat supplies
relatively high, wheat prices are projected low relative to corn prices, providing economic incentives to feed more wheat. As wheat supplies tighten over the projection period, wheat prices rise relative to corn prices and wheat feed use falls over the decade.
• U.S. wheat imports are projected to rise through the projection period due to increases from Canada. Comparatively low transportation costs between the two countries and a stronger U.S. dollar encourage more U.S. wheat imports from Canada.
• U.S. wheat exports grow slowly over the next decade. U.S. wheat trade faces competition
from countries of the former Soviet Union (FSU), particularly Russia, with FSU wheat exports rising from 25 percent to 27 percent of global trade over the next decade. The U.S. market share of world wheat trade holds steady at 15-16 percent.
0.0
0.5
1.0
1.5
1990 1995 2000 2005 2010 2015 2020 2025
U.S. wheat: Domestic use and exports
Billion bushels
Domestic use
Exports

22 USDA Long-term Projections, February 2016
U.S. soybean plantings fall from about 83 million acres in 2014 and 2015 as lower prices and producer returns reduce planting incentives from those in recent years. Nonetheless, soybean acreage remains above 80 million acres throughout the projection period as growth in both domestic use and export demand lead to increases in prices, allowing soybeans to compete with corn and other crops for land.
• Gains in domestic demand for soybean meal and, thus, soybean crush are projected over the coming decade. These gains reflect reduced feed prices, increasing meat production, slowing production of canola meal, and declining distillers grains production.
• Strong global demand for soybeans, particularly in China, boosts soybean trade over the projection period—China accounts for over 90 percent of the increase in world soybean imports. Even though U.S. soybean exports are projected to rise, competition from South America leads to a reduction in the U.S. share of global soybean trade from 38 percent in 2016/17 to about 33 percent in 2025/26. Brazil is projected to remain the world’s largest exporter of soybeans.
• U.S. exports of soybean oil and soybean meal also face strong competition from South America. Argentina, in particular, is a competitive exporter of soybean products because its graduated export taxes favor exports of soybean products over soybeans. As a result, Argentina is projected to remain the leading soybean meal exporter, accounting for more than half of global soybean meal exports in the second half of the projection period. Brazil remains the second largest soybean meal exporter, with a small gain in its global trade market share, followed by the United States, whose market share falls.
• Soybean oil used to produce methyl esters (biodiesel) in the United States is projected to rise from 5.2 billion pounds in 2015/16 to 5.7 billion pounds in 2020/21 and later years, supporting the production of almost 800 million gallons of biodiesel annually in the second half of the projection period. These projections reflect a growing biomass-based diesel use requirement through 2017 under the Renewable Fuel Standard (RFS), assumed here at EPA’s mid-2015 proposed level of 1.9 billion gallons (later raised to 2.0 billion in the final rule). Some additional demand for biodiesel and renewable diesel is also assumed, which meets a portion of the RFS’s advanced biofuel requirement. Other feedstocks used to produce biomass-based diesel include corn oil extracted from distillers grains, other first-use vegetable oils, animal fats, and recycled vegetable oils.
0.0
0.5
1.0
1.5
2.0
2.5
1990 1995 2000 2005 2010 2015 2020 2025
U.S. soybeans: Domestic use and exports
Billion bushels
Domestic use
Exports

USDA Long-term Projections, February 2016 23
Larger global production of grains and oilseeds in response to high prices in recent years has raised world supplies and lowered U.S. prices for corn, wheat, and soybeans. Following these near-term price declines, the continuing influence of global growth in population and per capita income along with biofuel demand underlies moderate gains in these prices and keeps them above pre-2007 levels.
• Corn prices are projected to decline through 2016/17 and then increase marginally over the next decade as ending stocks-to-use ratios fall somewhat due to growth in feed use and exports and continuing demand for corn for ethanol production.
• Prices for soybeans also initially fall through 2016/17 as continued high soybean acreage
keeps supplies and stocks high. Soybean prices rise moderately through the rest of the projection period, reflecting a reduction of soybean plantings, increasing demand for soybeans and soybean products, and declining stocks.
• Wheat prices also decline through 2016/17, reflecting higher wheat stocks and lower corn prices. Wheat prices increase somewhat faster than corn prices through the remainder of the projection period as increases in exports and food use reduce stocks and result in less wheat being priced for feed use.
0
2
4
6
8
10
12
14
1990 1995 2000 2005 2010 2015 2020 2025
U.S. farm-level prices: Corn, wheat, and soybeans
Dollars per bushel
Corn
Wheat
Soybeans

24 USDA Long-term Projections, February 2016
U.S. acreage planted to long-grain rice is projected to rise over the next decade. In contrast, plantings for medium- and short-grain rice decrease in 2016, before increasing moderately afterwards.
• Domestic and residual use of rice is projected to account for a steady share of U.S. production over the next decade, increasing slightly faster than population growth. U.S. rice imports are projected to expand over the next decade, but at a slower rate than in the past. Asian aromatic varieties, classified as long-grain rice and nearly all from Thailand, India, and Pakistan, are expected to continue to account for most of U.S. rice imports.
• U.S. rice exports are projected to increase over the next decade. Continued growth of U.S. rough-rice exports to Latin America (nearly all long-grain rice) is projected to account for most of the overall expansion of U.S. rice exports. The U.S. market share of all rice traded globally remains at about 8 percent over the projection period.
• Prices for medium- and short-grain rice will increase early in the projections period as acreage for the higher priced California rice is expected to return to more normal levels after several years of drought-induced area contraction. Prices for both long-grain rice and medium- and short-grain rice are then projected to rise moderately through the rest of the projections reflecting increasing domestic and export demand and a relatively stable overall stocks-to-use ratio.
0
20
40
60
80
100
120
140
160
1990 1995 2000 2005 2010 2015 2020 2025
U.S. rice: Domestic and residual use and exports
Million hundredweight
Domestic and residual use
Exports

USDA Long-term Projections, February 2016 25
Upland cotton plantings are projected to rebound from 2015’s low level of 8.4 million acres to about 9.5 million acres in 2016, in part due to higher expected returns relative to competing crops. Acreage then increases slowly over the next decade as rising prices and improved returns provide incentives to expand, although projected plantings remain below 10 million acres. Mill use and exports of U.S. upland cotton are projected to rise moderately.
• U.S. mill use is projected to grow somewhat over the next decade in response to rising
demand for U.S. textile product exports (such as fabric and yarn), mainly to other countries in the Western Hemisphere. Nonetheless, even with this growth, domestic mill use is projected to represent less than 29 percent of total U.S. disappearance of upland cotton over the projection period, down from more than 60 percent in the late 1990s.
• U.S. upland cotton exports are projected to rise throughout the projection period. The
United States remains the world’s largest exporter of cotton, although the U.S. share of global cotton trade falls to 24 percent by 2025/26, compared to an average of more than 37 percent in 2000-10. Brazil and India are the next two largest cotton exporters and together account for about half of the gain in global cotton exports over the projection period. China is the world’s largest importer of cotton, accounting for about a third of global imports by 2025/26 and over 87 percent of global import growth from 2016/17 to 2025/26.
0
2
4
6
8
10
12
14
16
18
1990 1995 2000 2005 2010 2015 2020 2025
U.S. upland cotton: Domestic mill use and exports
Million bales
Domestic mill use
Exports

26 USDA Long-term Projections, February 2016
• U.S. sugar production is projected to generally increase over the next decade. Total sugar production is projected to increase from 8.763 million short tons in 2016 to almost 9.8 million short tons in 2022, before dropping off somewhat toward the end of the projection period. Cane sugar production rises throughout the decade with beet sugar production peaking in 2019. Nonetheless, beet sugar production will remain the larger of the two sugar-producing crops, although cane sugar production is expected to increase its share of total sugar production.
• Sugar deliveries for domestic use increase steadily over the course of the projection period. Total deliveries in 2025/26 are 7.7 percent higher than 2016/17, driven by population growth. Deliveries for food and beverage use constitute the large majority of total use and growth throughout the projection period.
• Total sugar imports are projected to increase at a gradual pace to meet increased deliveries. Total imports account for about one-quarter of total supply by 2025/26, which is nearly the same as the proportion projected for 2016/17.
• Projected imports from Mexico for the duration of the projection period follow the terms of the agreements currently in place that restrict volumes and prices of sugar entering the United States from Mexico. Imports from Mexico are projected to rise along with increased U.S. needs for sugar, until the latter years of the projection period where Mexican exportable supplies are constrained.
• Imports under quota programs remain relatively constant in the beginning years of the projection period and then increase to account for lower imports from Mexico toward the end of the decade.
• Sugar production in Mexico is expected to increase steadily due to improved yields. Relatively stagnant producer returns projected during the period result in a slight, but steady, decline in harvested area. Combined with deliveries for human consumption increasing at higher rate than domestic production, exportable supplies are reduced, constraining exports to the United States in the latter portion of the projection period.
• U.S. consumption of high fructose corn syrup (HFCS) is projected to steadily decline, accounting for a small proportion of total caloric sweetener consumption. However, U.S. production of HFCS falls only slightly as increased exports, particularly to Mexico, nearly offset the decrease in domestic consumption.
0
2
4
6
8
10
12
14
1995 2000 2005 2010 2015 2020 2025
U.S. sugar: Domestic production, use, and imports
Million short tons
Domestic deliveries
Imports
Production
USDA Long-term Projections, February 2016 27
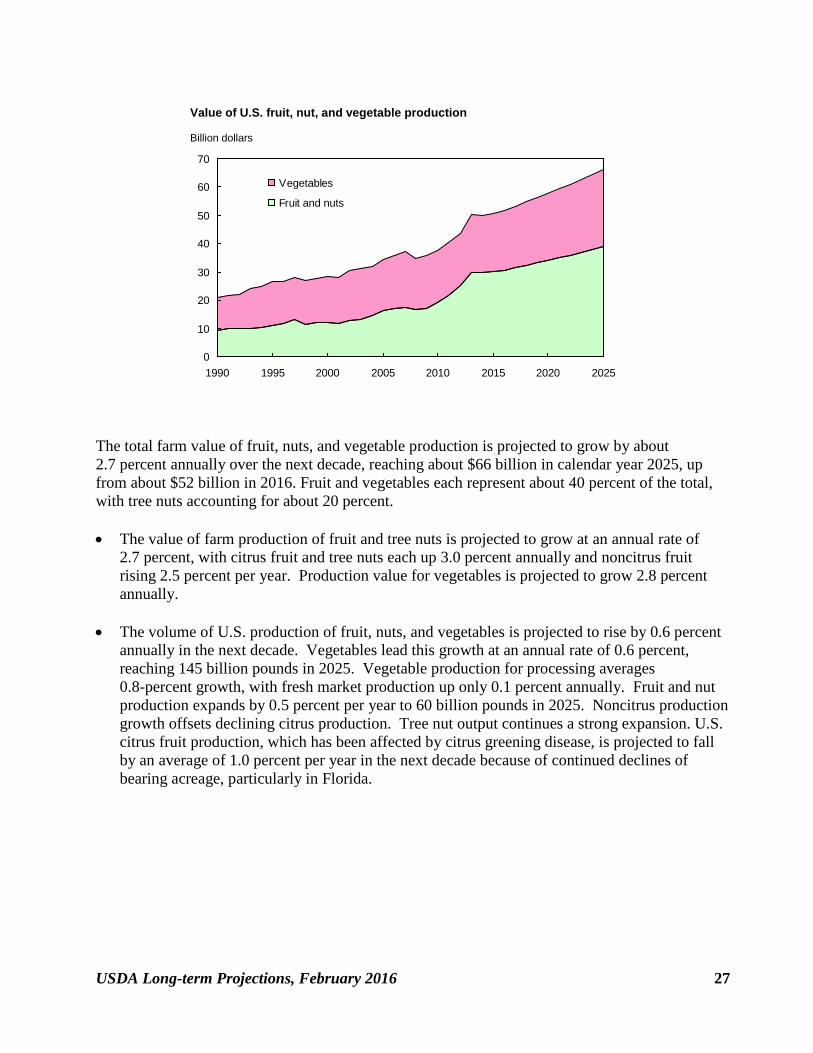
The total farm value of fruit, nuts, and vegetable production is projected to grow by about 2.7 percent annually over the next decade, reaching about $66 billion in calendar year 2025, up from about $52 billion in 2016. Fruit and vegetables each represent about 40 percent of the total, with tree nuts accounting for about 20 percent. • The value of farm production of fruit and tree nuts is projected to grow at an annual rate of
2.7 percent, with citrus fruit and tree nuts each up 3.0 percent annually and noncitrus fruit rising 2.5 percent per year. Production value for vegetables is projected to grow 2.8 percent annually.
• The volume of U.S. production of fruit, nuts, and vegetables is projected to rise by 0.6 percent
annually in the next decade. Vegetables lead this growth at an annual rate of 0.6 percent, reaching 145 billion pounds in 2025. Vegetable production for processing averages 0.8-percent growth, with fresh market production up only 0.1 percent annually. Fruit and nut production expands by 0.5 percent per year to 60 billion pounds in 2025. Noncitrus production growth offsets declining citrus production. Tree nut output continues a strong expansion. U.S. citrus fruit production, which has been affected by citrus greening disease, is projected to fall by an average of 1.0 percent per year in the next decade because of continued declines of bearing acreage, particularly in Florida.
0
10
20
30
40
50
60
70
1990 1995 2000 2005 2010 2015 2020 2025
Vegetables
Fruit and nuts
Billion dollars
Value of U.S. fruit, nut, and vegetable production

28 USDA Long-term Projections, February 2016
Table 4. Acreage for major field crops and Conservation Reserve Program (CRP) assumptions , long-term projections2014 2015 2016 2017 2018 2019 2020 2021 2022 2023 2024 2025
Million acresPlanted acreage, eight major crops
Corn 90.6 88.4 90.5 90.3 90.3 90.3 90.0 89.5 89.0 88.5 88.0 88.0Sorghum 7.1 8.7 7.3 6.7 6.3 6.0 5.9 5.8 5.8 5.8 5.8 5.8Barley 3.0 3.6 3.3 3.2 3.0 3.0 3.0 3.0 3.0 3.0 3.0 3.0Oats 2.8 3.1 2.8 2.5 2.5 2.5 2.5 2.5 2.5 2.5 2.5 2.5Wheat 56.8 54.6 53.0 51.0 51.5 51.5 51.5 51.5 51.5 51.5 51.5 51.5Rice 2.9 2.6 2.8 2.8 2.8 2.8 2.9 2.9 2.9 2.9 2.9 2.9Upland cotton 10.8 8.4 9.5 9.5 9.5 9.6 9.6 9.7 9.7 9.8 9.8 9.9Soybeans 83.3 83.2 82.0 81.5 81.5 81.5 81.5 81.0 81.0 81.0 80.5 80.5
Tota l 257.3 252.6 251.2 247.5 247.4 247.2 246.9 245.9 245.4 245.0 244.0 244.1
CRP acreage assumptions
Tota l CRP 25.4 24.2 23.7 23.9 24.0 23.9 24.0 24.0 24.0 23.9 24.0 23.9
Tota l planted plus CRP 282.8 276.8 274.9 271.4 271.4 271.1 270.9 269.8 269.4 268.9 268.0 268.0
Harvested acreage, eight major crops
Corn 83.1 80.7 82.7 82.5 82.5 82.5 82.2 81.7 81.2 80.7 80.2 80.2Sorghum 6.4 7.6 6.3 5.7 5.4 5.1 5.1 5.0 5.0 5.0 5.0 5.0Barley 2.5 3.1 2.9 2.8 2.6 2.6 2.6 2.6 2.6 2.6 2.6 2.6Oats 1.0 1.3 1.0 0.9 0.9 0.9 0.9 0.9 0.9 0.9 0.9 0.9Wheat 46.4 47.1 44.9 43.2 43.6 43.6 43.6 43.6 43.6 43.6 43.6 43.6Rice 2.9 2.6 2.8 2.8 2.8 2.8 2.8 2.9 2.9 2.9 2.9 2.9Upland cotton 9.2 8.0 8.1 8.1 8.1 8.1 8.2 8.2 8.3 8.3 8.3 8.4Soybeans 82.6 82.4 81.1 80.7 80.7 80.7 80.7 80.2 80.2 80.2 79.7 79.7
Tota l 234.1 232.8 229.8 226.7 226.6 226.3 226.1 225.1 224.7 224.2 223.2 223.3

USDA Long-term Projections, February 2016 29
Table 5. U.S. corn long-term projectionsItem 2014/15 2015/16 2016/17 2017/18 2018/19 2019/20 2020/21 2021/22 2022/23 2023/24 2024/25 2025/26
Area (million acres):
Planted acres 90.6 88.4 90.5 90.3 90.3 90.3 90.0 89.5 89.0 88.5 88.0 88.0 Harvested acres 83.1 80.7 82.7 82.5 82.5 82.5 82.2 81.7 81.2 80.7 80.2 80.2
Yield:
Bushels per harvested acre 171.0 169.3 168.1 170.1 172.1 174.0 176.0 177.9 179.9 181.9 183.8 185.8
Supply and use (million bushels):
Beginning stocks 1,232 1,731 1,760 1,755 1,730 1,740 1,755 1,775 1,785 1,790 1,785 1,735 Production 14,216 13,654 13,900 14,035 14,200 14,355 14,465 14,535 14,610 14,680 14,740 14,900 Imports 32 30 30 30 30 30 30 30 30 30 30 30 Supply 15,479 15,415 15,690 15,820 15,960 16,125 16,250 16,340 16,425 16,500 16,555 16,665
Feed & residual 5,315 5,300 5,450 5,550 5,650 5,750 5,850 5,925 6,000 6,075 6,150 6,225 Food, seed, & industrial 6,568 6,555 6,585 6,615 6,595 6,595 6,550 6,530 6,485 6,465 6,445 6,425 Ethanol and by-products 5,209 5,175 5,200 5,225 5,200 5,200 5,150 5,125 5,075 5,050 5,025 5,000 Domestic use 11,883 11,855 12,035 12,165 12,245 12,345 12,400 12,455 12,485 12,540 12,595 12,650 Exports 1,864 1,800 1,900 1,925 1,975 2,025 2,075 2,100 2,150 2,175 2,225 2,275 Total use 13,748 13,655 13,935 14,090 14,220 14,370 14,475 14,555 14,635 14,715 14,820 14,925
Ending stocks 1,731 1,760 1,755 1,730 1,740 1,755 1,775 1,785 1,790 1,785 1,735 1,740 Stocks/use ratio, percent 12.6 12.9 12.6 12.3 12.2 12.2 12.3 12.3 12.2 12.1 11.7 11.7
Price (dollars per bushel):
Farm price 3.70 3.65 3.60 3.65 3.70 3.70 3.70 3.70 3.70 3.70 3.75 3.75
Variable costs of production (dollars):
Per acre 360 340 343 348 350 353 357 361 365 369 373 377
Returns over variable costs (dollars per acre):
Net returns 273 278 262 273 287 291 294 297 300 304 316 320Note: Marketing year beginning September 1 for corn.

30 USDA Long-term Projections, February 2016
Table 6. U.S. sorghum long-term projectionsItem 2014/15 2015/16 2016/17 2017/18 2018/19 2019/20 2020/21 2021/22 2022/23 2023/24 2024/25 2025/26
Area (million acres):
Planted acres 7.1 8.7 7.3 6.7 6.3 6.0 5.9 5.8 5.8 5.8 5.8 5.8 Harvested acres 6.4 7.6 6.3 5.7 5.4 5.1 5.1 5.0 5.0 5.0 5.0 5.0
Yield:
Bushels/harvested acre 67.6 77.7 65.1 65.1 65.1 65.1 65.1 65.1 65.1 65.1 65.1 65.1
Supply and use (million bushels):
Beginning stocks 34 18 58 53 49 46 38 35 36 37 38 39 Production 433 594 410 371 352 332 332 326 326 326 326 326 Imports 0 1 0 0 0 0 0 0 0 0 0 0 Supply 467 613 468 424 401 378 370 361 362 363 364 365
Feed & residual 80 130 115 100 90 80 80 75 75 75 75 75 Food, seed, & industrial 15 100 100 100 100 100 100 100 100 100 100 100 Domestic use 96 230 215 200 190 180 180 175 175 175 175 175 Exports 353 325 200 175 165 160 155 150 150 150 150 150 Total use 449 555 415 375 355 340 335 325 325 325 325 325
Ending stocks 18 58 53 49 46 38 35 36 37 38 39 40 Stocks/use ratio, percent 4.0 10.5 12.8 13.1 13.0 11.2 10.4 11.1 11.4 11.7 12.0 12.3
Price (dollars per bushel):
Farm price 4.03 3.60 3.40 3.45 3.45 3.45 3.45 3.45 3.45 3.45 3.50 3.50
Variable costs of production (dollars):
Per acre 147 136 137 139 140 142 144 146 148 150 152 153
Returns over variable costs (dollars per acre):
Net returns 126 144 85 86 84 83 81 79 77 75 76 74 Note: Marketing year beginning September 1 for sorghum.

USDA Long-term Projections, February 2016 31
Table 7. U.S. barley long-term projectionsItem 2014/15 2015/16 2016/17 2017/18 2018/19 2019/20 2020/21 2021/22 2022/23 2023/24 2024/25 2025/26
Area (million acres):
Planted acres 3.0 3.6 3.3 3.2 3.0 3.0 3.0 3.0 3.0 3.0 3.0 3.0 Harvested acres 2.5 3.1 2.9 2.8 2.6 2.6 2.6 2.6 2.6 2.6 2.6 2.6
Yield:
Bushels/harvested acre 72.7 68.9 71.1 71.7 72.3 73.0 73.6 74.2 74.8 75.5 76.1 76.7
Supply and use (million bushels):
Beginning stocks 82 79 96 94 92 82 79 78 79 81 81 83 Production 182 214 206 201 188 190 191 193 194 196 198 199 Imports 24 18 20 20 20 20 20 20 20 20 20 20 Supply 287 311 322 315 300 292 290 291 293 297 299 302
Feed & residual 43 50 60 55 50 45 45 45 45 50 50 55 Food, seed, & industrial 151 153 153 153 153 153 152 152 152 151 151 151 Domestic use 194 203 213 208 203 198 197 197 197 201 201 206 Exports 14 12 15 15 15 15 15 15 15 15 15 15 Total use 209 215 228 223 218 213 212 212 212 216 216 221
Ending stocks 79 96 94 92 82 79 78 79 81 81 83 81 Stocks/use ratio, percent 37.8 44.7 41.2 41.3 37.6 37.1 36.8 37.3 38.2 37.5 38.4 36.7
Price (dollars per bushel):
Farm price 5.30 5.20 4.80 4.65 4.70 4.70 4.70 4.70 4.70 4.70 4.75 4.75
Variable costs of production (dollars):
Per acre 197 182 183 187 189 191 193 196 199 202 204 207
Returns over variable costs (dollars per acre):
Net returns 188 176 158 147 151 152 152 153 152 153 157 157 Note: Marketing year beginning June 1 for barley.

32 USDA Long-term Projections, February 2016
Table 8. U.S. oats long-term projectionsItem 2014/15 2015/16 2016/17 2017/18 2018/19 2019/20 2020/21 2021/22 2022/23 2023/24 2024/25 2025/26
Area (million acres):
Planted acres 2.8 3.1 2.8 2.5 2.5 2.5 2.5 2.5 2.5 2.5 2.5 2.5 Harvested acres 1.0 1.3 1.0 0.9 0.9 0.9 0.9 0.9 0.9 0.9 0.9 0.9
Yield:
Bushels/harvested acre 67.9 70.2 66.2 66.6 67.0 67.4 67.7 68.1 68.5 68.9 69.2 69.6
Supply and use (million bushels):
Beginning stocks 25 54 59 50 40 34 34 34 33 33 33 32 Production 70 90 66 60 60 61 61 61 62 62 62 63 Imports 107 95 100 100 100 100 100 100 100 100 100 100 Supply 202 238 225 210 200 195 195 195 195 195 195 195
Feed & residual 70 100 95 90 85 80 80 80 80 80 80 80 Food, seed, & industrial 77 77 78 78 79 79 79 80 80 80 81 81 Domestic use 147 177 173 168 164 159 159 160 160 160 161 161 Exports 2 2 2 2 2 2 2 2 2 2 2 2 Total use 149 179 175 170 166 161 161 162 162 162 163 163
Ending stocks 54 59 50 40 34 34 34 33 33 33 32 32 Stocks/use ratio, percent 36.2 33.0 28.6 23.5 20.5 21.1 21.1 20.4 20.4 20.4 19.6 19.6
Price (dollars per bushel):
Farm price 3.21 2.20 2.10 2.10 2.15 2.15 2.15 2.15 2.15 2.15 2.20 2.20
Variable costs of production (dollars):
Per acre 118 108 109 111 112 113 115 116 118 120 121 123
Returns over variable costs (dollars per acre):
Net returns 100 47 30 29 32 32 31 30 29 28 31 30 Note: Marketing year beginning June 1 for oats.

USDA Long-term Projections, February 2016 33
Table 9. U.S. wheat long-term projectionsItem 2014/15 2015/16 2016/17 2017/18 2018/19 2019/20 2020/21 2021/22 2022/23 2023/24 2024/25 2025/26
Area (mi l l ion acres ):
Planted acres 56.8 54.6 53.0 51.0 51.5 51.5 51.5 51.5 51.5 51.5 51.5 51.5 Harvested acres 46.4 47.1 44.9 43.2 43.6 43.6 43.6 43.6 43.6 43.6 43.6 43.6
Yield:
Bushels/harvested acre 43.7 43.6 45.9 46.3 46.7 47.0 47.4 47.7 48.1 48.4 48.8 49.1
Supply and use (mi l l ion bushels ):
Beginning s tocks 590 753 911 928 842 784 739 707 688 677 669 669 Production 2,026 2,052 2,060 2,000 2,035 2,050 2,065 2,080 2,095 2,110 2,130 2,140 Imports 149 125 125 130 135 140 145 150 155 160 165 170 Supply 2,766 2,930 3,096 3,058 3,012 2,974 2,949 2,937 2,938 2,947 2,964 2,979
Food 958 967 974 981 988 995 1,002 1,009 1,016 1,023 1,030 1,037 Seed 81 72 69 70 70 70 70 70 70 70 70 70 Feed & res idual 120 180 225 215 210 200 190 180 175 175 175 175 Domestic use 1,159 1,219 1,268 1,266 1,268 1,265 1,262 1,259 1,261 1,268 1,275 1,282 Exports 854 800 900 950 960 970 980 990 1,000 1,010 1,020 1,030 Tota l use 2,013 2,019 2,168 2,216 2,228 2,235 2,242 2,249 2,261 2,278 2,295 2,312
Ending s tocks 753 911 928 842 784 739 707 688 677 669 669 667 Stocks/use ratio, percent 37.4 45.1 42.8 38.0 35.2 33.1 31.5 30.6 29.9 29.4 29.2 28.8
Price (dol lars per bushel ):
Farm price 5.99 5.00 4.40 4.50 4.60 4.65 4.70 4.75 4.80 4.85 4.90 4.95
Variable costs of production (dol lars ):
Per acre 129 119 120 122 124 125 127 128 130 132 134 136
Returns over variable costs (dol lars per acre):
Net returns 133 99 82 86 91 93 96 98 100 103 105 107Note: Marketing year beginning June 1 for wheat.

34 USDA Long-term Projections, February 2016
Table 10. U.S. soybeans and products long-term projectionsItem 2014/15 2015/16 2016/17 2017/18 2018/19 2019/20 2020/21 2021/22 2022/23 2023/24 2024/25 2025/26
Soybeans
Area (mi l l ion acres ): Planted 83.3 83.2 82.0 81.5 81.5 81.5 81.5 81.0 81.0 81.0 80.5 80.5 Harvested 82.6 82.4 81.1 80.7 80.7 80.7 80.7 80.2 80.2 80.2 79.7 79.7Yield: bushels per harvested acre 47.5 48.3 46.7 47.2 47.7 48.2 48.6 49.1 49.6 50.1 50.6 51.0Supply (mi l l ion bushels ) Beginning s tocks , September 1 92 191 465 421 382 348 323 299 275 270 270 265 Production 3,927 3,981 3,785 3,810 3,850 3,890 3,920 3,940 3,980 4,020 4,035 4,065 Imports 33 30 30 30 30 30 30 30 30 30 30 30 Tota l supply 4,052 4,203 4,280 4,261 4,262 4,268 4,273 4,269 4,285 4,320 4,335 4,360Use (mi l l ion bushels ) Crush 1,873 1,890 1,910 1,920 1,940 1,960 1,980 1,995 2,005 2,020 2,030 2,045 Seed and res idual 145 133 124 124 124 125 124 124 125 125 125 124 Exports 1,843 1,715 1,825 1,835 1,850 1,860 1,870 1,875 1,885 1,905 1,915 1,925 Tota l use 3,861 3,738 3,859 3,879 3,914 3,945 3,974 3,994 4,015 4,050 4,070 4,094Ending s tocks , August 31 Tota l ending s tocks 191 465 421 382 348 323 299 275 270 270 265 266 Stocks/use ratio, percent 4.9 12.4 10.9 9.8 8.9 8.2 7.5 6.9 6.7 6.7 6.5 6.5Price (dol lars per bushel ) Soybean price, farm 10.10 8.90 8.65 8.80 8.95 9.00 9.10 9.20 9.20 9.20 9.30 9.35
Variable costs of production (dol lars ): Per acre 184 174 175 178 179 181 183 185 187 189 191 193Returns over variable costs (dol lars per acre): Net returns 296 256 229 238 248 253 259 267 269 272 279 283
Soybean oi l (mi l l ion pounds)
Beginning s tocks , October 1 1,165 1,820 2,295 2,505 2,560 2,600 2,600 2,590 2,605 2,595 2,615 2,605 Production 21,399 21,850 22,100 22,235 22,485 22,735 22,990 23,180 23,320 23,515 23,650 23,845 Imports 264 175 185 195 205 215 225 235 245 255 265 275 Tota l supply 22,828 23,845 24,580 24,935 25,250 25,550 25,815 26,005 26,170 26,365 26,530 26,725 Domestic disappearance 18,994 19,250 19,475 19,700 19,925 20,150 20,375 20,500 20,625 20,750 20,875 21,000
Biodiesel 1 5,050 5,200 5,300 5,400 5,500 5,600 5,700 5,700 5,700 5,700 5,700 5,700 Food, feed, and other industria l 13,944 14,050 14,175 14,300 14,425 14,550 14,675 14,800 14,925 15,050 15,175 15,300 Exports 2,014 2,300 2,600 2,675 2,725 2,800 2,850 2,900 2,950 3,000 3,050 3,100 Tota l use 21,008 21,550 22,075 22,375 22,650 22,950 23,225 23,400 23,575 23,750 23,925 24,100 Ending s tocks , September 30 1,820 2,295 2,505 2,560 2,600 2,600 2,590 2,605 2,595 2,615 2,605 2,625 Soybean oi l price (dol lars per lb) 0.316 0.290 0.280 0.290 0.295 0.300 0.303 0.308 0.313 0.315 0.320 0.325
Soybean meal (thousand short tons)
Beginning s tocks , October 1 250 260 300 300 300 300 300 300 300 300 300 300 Production 45,062 44,865 45,410 45,610 46,110 46,585 46,985 47,335 47,660 47,960 48,260 48,560 Imports 333 325 165 165 165 165 165 165 165 165 165 165 Tota l supply 45,645 45,450 45,875 46,075 46,575 47,050 47,450 47,800 48,125 48,425 48,725 49,025 Domestic disappearance 32,235 33,300 33,925 34,425 34,875 35,300 35,650 35,950 36,225 36,475 36,725 36,975 Exports 13,150 11,850 11,650 11,350 11,400 11,450 11,500 11,550 11,600 11,650 11,700 11,750 Tota l use 45,385 45,150 45,575 45,775 46,275 46,750 47,150 47,500 47,825 48,125 48,425 48,725 Ending s tocks , September 30 260 300 300 300 300 300 300 300 300 300 300 300 Soybean meal price (dol lars per ton) 368.49 320.00 315.00 319.00 324.00 326.00 330.00 333.00 333.00 333.00 336.00 337.00
Crushing yields (pounds per bushel ) Soybean oi l 11.43 11.56 11.57 11.58 11.59 11.60 11.61 11.62 11.63 11.64 11.65 11.66 Soybean meal 48.12 47.48 47.50 47.50 47.50 47.50 47.50 47.50 47.50 47.50 47.50 47.50 Crush margin (dol lars per bushel ) 2.38 2.05 2.07 2.13 2.16 2.22 2.25 2.28 2.34 2.38 2.41 2.44Note: Marketing year beginning September 1 for soybeans ; October 1 for soybean oi l and soybean meal . 1Reflects biodiesel made from methyl ester as reported by the U.S. Department of Energy, Energy Information Adminis tration.

USDA Long-term Projections, February 2016 35
Table 11. U.S. rice long-term projections , tota l rice, rough bas isItem 2014/15 2015/16 2016/17 2017/18 2018/19 2019/20 2020/21 2021/22 2022/23 2023/24 2024/25 2025/26
Area (thousand acres ):
Planted 2,939 2,611 2,800 2,820 2,845 2,845 2,870 2,880 2,905 2,905 2,930 2,930 Harvested 2,919 2,570 2,771 2,796 2,824 2,824 2,849 2,858 2,883 2,883 2,908 2,908
Yield:
Pounds per harvested acre 7,572 7,423 7,633 7,686 7,727 7,766 7,803 7,845 7,881 7,922 7,957 7,999
Supply and use (mi l l ion hundredweight):
Beginning s tocks 31.8 48.5 39.8 37.3 37.6 37.7 37.8 38.5 39.1 39.4 39.3 39.3 Production 221.0 190.8 211.5 214.9 218.2 219.3 222.3 224.2 227.2 228.4 231.4 232.6 Imports 24.7 25.5 26.0 26.5 27.0 27.5 28.1 28.6 29.2 29.7 30.3 30.9 Tota l supply 277.5 264.8 277.3 278.7 282.8 284.5 288.1 291.3 295.5 297.5 301.0 302.8
Domestic use and res idual 128.7 127.0 130.0 128.6 130.6 131.3 133.1 134.2 136.1 136.8 138.7 139.4 Exports 100.3 98.0 110.0 112.5 114.5 115.5 116.5 118.0 120.0 121.5 123.0 124.0 Tota l use 229.0 225.0 240.0 241.1 245.1 246.8 249.6 252.2 256.1 258.3 261.7 263.4
Ending s tocks 48.5 39.8 37.3 37.6 37.7 37.8 38.5 39.1 39.4 39.3 39.3 39.4 Stocks/use ratio, percent 21.2 17.7 15.5 15.6 15.4 15.3 15.4 15.5 15.4 15.2 15.0 15.0
Price (dol lars per hundredweight):
Average farm price 13.30 13.80 14.10 14.20 14.40 14.60 14.80 15.00 15.20 15.40 15.60 15.80
Variable costs of production (dol lars ):
Per acre 628 584 588 598 603 609 616 623 631 638 645 653
Returns over variable costs (dol lars per acre):
Net returns 379 441 488 494 510 525 539 553 567 582 596 611 Note: Marketing year beginning August 1 for rice.

36 USDA Long-term Projections, February 2016
Table 12. U.S. rice long-term projections , long-gra in rice, rough bas isItem 2014/15 2015/16 2016/17 2017/18 2018/19 2019/20 2020/21 2021/22 2022/23 2023/24 2024/25 2025/26
Area (thousand acres ):
Planted 2,207 1,876 2,100 2,100 2,125 2,125 2,150 2,150 2,175 2,175 2,200 2,200 Harvested 2,192 1,846 2,079 2,083 2,110 2,110 2,135 2,135 2,160 2,160 2,185 2,185
Yield:
Pounds per harvested acre 7,408 7,170 7,456 7,493 7,531 7,568 7,606 7,644 7,682 7,721 7,760 7,798
Supply and use (mi l l ion hundredweight):
Beginning s tocks 16.2 26.5 21.8 23.3 24.2 24.6 24.7 25.3 25.7 26.1 25.8 25.9 Production 162.4 132.4 155.0 156.1 158.9 159.7 162.4 163.2 165.9 166.8 169.5 170.4 Imports 21.1 22.0 22.4 22.9 23.4 23.8 24.3 24.8 25.3 25.8 26.3 26.9 Tota l supply 199.7 180.8 199.3 202.3 206.4 208.1 211.4 213.3 216.9 218.7 221.6 223.2
Domestic use & res idual 102.5 94.0 100.0 100.1 101.9 102.4 104.1 104.6 106.3 106.9 108.6 109.2 Exports 70.8 65.0 76.0 78.0 80.0 81.0 82.0 83.0 84.5 86.0 87.0 88.0 Tota l use 173.2 159.0 176.0 178.1 181.9 183.4 186.1 187.6 190.8 192.9 195.6 197.2
Ending s tocks 26.5 21.8 23.3 24.2 24.6 24.7 25.3 25.7 26.1 25.8 25.9 25.9 Stocks/use ratio, percent 15.3 13.7 13.2 13.6 13.5 13.5 13.6 13.7 13.7 13.3 13.2 13.2
Price (dol lars per hundredweight): Average farm price 11.90 12.00 12.30 12.40 12.60 12.80 13.00 13.20 13.40 13.60 13.80 14.00Note: Marketing year beginning August 1 for rice.
Table 13. U.S. ri ce long-term projections , medium- and short-gra in rice, rough bas isItem 2014/15 2015/16 2016/17 2017/18 2018/19 2019/20 2020/21 2021/22 2022/23 2023/24 2024/25 2025/26
Area (thousand acres ):
Planted 732 735 700 720 720 720 720 730 730 730 730 730 Harvested 727 724 692 713 714 714 714 723 723 723 723 723
Yield:
Pounds per harvested acre 8,068 8,067 8,168 8,250 8,311 8,353 8,395 8,437 8,479 8,521 8,564 8,607
Supply and use (mi l l ion hundredweight):
Beginning s tocks 13.3 20.2 16.1 12.1 11.5 11.2 11.1 11.2 11.5 11.4 11.6 11.5 Production 58.7 58.4 56.5 58.8 59.3 59.6 59.9 61.0 61.3 61.6 61.9 62.2 Imports 3.5 3.5 3.6 3.6 3.7 3.7 3.8 3.8 3.9 3.9 4.0 4.1 Tota l supply 75.9 82.1 76.1 74.5 74.5 74.5 74.8 76.1 76.7 77.0 77.5 77.7
Domestic use & res idual 26.2 33.0 30.0 28.5 28.8 28.9 29.1 29.6 29.7 29.9 30.0 30.2 Exports 29.5 33.0 34.0 34.5 34.5 34.5 34.5 35.0 35.5 35.5 36.0 36.0 Tota l use 55.8 66.0 64.0 63.0 63.3 63.4 63.6 64.6 65.2 65.4 66.0 66.2
Ending s tocks 20.2 16.1 12.1 11.5 11.2 11.1 11.2 11.5 11.4 11.6 11.5 11.6 Stocks/use ratio, percent 36.1 24.3 18.9 18.2 17.7 17.5 17.7 17.8 17.5 17.7 17.4 17.5
Price (dol lars per hundredweight): Average farm price 18.20 18.10 18.30 18.30 18.50 18.70 18.90 19.10 19.30 19.50 19.70 19.90
Cal i fornia 21.40 21.50 21.00 20.80 20.70 20.70 20.80 21.00 21.20 21.40 21.70 21.90Other States 14.40 13.00 13.40 13.60 14.10 14.70 15.10 15.30 15.40 15.60 15.80 15.90
Note: Marketing year beginning August 1 for rice; Ca l i fornia marketing year beginning October 1.

USDA Long-term Projections, February 2016 37
Table 14. U.S. upland cotton long-term projectionsItem 2014/15 2015/16 2016/17 2017/18 2018/19 2019/20 2020/21 2021/22 2022/23 2023/24 2024/25 2025/26
Area (mi l l ion acres ):
Planted acres 10.8 8.4 9.5 9.5 9.5 9.6 9.6 9.7 9.7 9.8 9.8 9.9 Harvested acres 9.2 8.0 8.1 8.1 8.1 8.1 8.2 8.2 8.3 8.3 8.3 8.4
Yield:
Pounds per harvested acre 826 770 805 808 811 814 817 820 823 826 829 832
Supply and use (thousand ba les ):
Beginning s tocks 2,225 3,441 2,910 3,100 3,150 3,150 3,200 3,200 3,250 3,250 3,300 3,300 Production 15,753 12,830 13,600 13,600 13,700 13,800 13,900 14,000 14,100 14,300 14,400 14,500 Imports 9 5 5 5 5 5 5 5 5 5 5 5 Supply 17,987 16,276 16,515 16,705 16,855 16,955 17,105 17,205 17,355 17,555 17,705 17,805
Domestic use 3,550 3,675 3,700 3,750 3,800 3,850 3,900 3,950 4,000 4,050 4,100 4,150 Exports 10,836 9,700 9,700 9,800 9,900 9,900 10,000 10,000 10,100 10,200 10,300 10,400 Tota l use 14,386 13,375 13,400 13,550 13,700 13,750 13,900 13,950 14,100 14,250 14,400 14,550
Ending s tocks 3,441 2,910 3,100 3,150 3,150 3,200 3,200 3,250 3,250 3,300 3,300 3,250 Stocks/use ratio, percent 23.9 21.8 23.1 23.2 23.0 23.3 23.0 23.3 23.0 23.2 22.9 22.3
Price (dol lars per pound):
Farm price 0.613 0.590 0.580 0.590 0.600 0.615 0.630 0.640 0.650 0.660 0.670 0.680
Variable costs of production (dol lars ):
Per acre 532 504 509 518 523 528 535 541 548 555 562 569
Returns over variable costs (dol lars per acre):
Net returns 1 105 83 84 87 94 105 113 118 122 127 132 136Note: Marketing year beginning August 1 for upland cotton.1Includes revenue from cottonseed.

38 USDA Long-term Projections, February 2016
Table 16. Fruit, nuts, and vegetables long-term projectionsItem Unit 2014 2015 2016 2017 2018 2019 2020 2021 2022 2023 2024 2025
Production, farm weightFruit and nuts Mil. lbs. 62,019 59,863 57,912 58,163 58,421 58,684 58,954 59,231 59,514 59,804 60,101 60,405
Citrus Mil. lbs. 18,822 18,044 15,690 15,533 15,378 15,224 15,072 14,921 14,772 14,624 14,478 14,333Noncitrus Mil. lbs. 38,070 36,928 37,224 37,521 37,821 38,124 38,429 38,736 39,046 39,359 39,674 39,991Tree nuts Mil. lbs. 5,127 4,891 4,999 5,109 5,221 5,336 5,454 5,574 5,696 5,822 5,950 6,080
Vegetables1 Mil. lbs. 134,377 136,645 137,452 138,273 139,108 139,956 140,820 141,699 142,593 143,503 144,430 145,373Fresh market Mil. lbs. 41,317 41,358 41,399 41,441 41,482 41,524 41,565 41,607 41,648 41,690 41,732 41,773Processing Mil. lbs. 39,928 41,319 41,650 41,983 42,319 42,657 42,999 43,343 43,689 44,039 44,391 44,746Potatoes Mil. lbs. 44,217 44,560 44,694 44,828 44,962 45,097 45,233 45,368 45,504 45,641 45,778 45,915Pulses Mil. lbs. 5,057 5,531 5,730 5,936 6,150 6,371 6,601 6,838 7,085 7,340 7,604 7,878
Total fruit, nuts, vegetables Mil. lbs. 196,396 196,509 195,365 196,436 197,528 198,641 199,774 200,930 202,107 203,307 204,531 205,778
Farm valueFruit and nuts $ Mil. 30,047 30,116 30,688 31,522 32,380 33,260 34,165 35,095 36,050 37,032 38,040 39,076
Citrus $ Mil. 3,704 3,378 3,231 3,327 3,425 3,527 3,631 3,738 3,849 3,963 4,080 4,201Noncitrus $ Mil. 16,330 16,575 16,989 17,414 17,849 18,296 18,753 19,222 19,702 20,195 20,700 21,217Tree nuts $ Mil. 10,013 10,163 10,468 10,782 11,105 11,438 11,782 12,135 12,499 12,874 13,260 13,658
Vegetables $ Mil. 19,984 20,585 21,153 21,737 22,337 22,953 23,586 24,236 24,904 25,590 26,295 27,020Fresh market $ Mil. 10,760 11,679 12,008 12,347 12,694 13,051 13,417 13,793 14,178 14,574 14,980 15,397Processing $ Mil. 2,172 2,247 2,311 2,376 2,443 2,512 2,583 2,655 2,730 2,807 2,886 2,968Potatoes $ Mil. 3,928 3,515 3,614 3,715 3,820 3,927 4,037 4,151 4,267 4,387 4,511 4,637Pulses $ Mil. 1,309 1,255 1,300 1,347 1,396 1,446 1,498 1,552 1,608 1,666 1,726 1,788
Total fruit, nuts, vegetables $ Mil. 50,031 50,700 51,841 53,259 54,717 56,214 57,752 59,332 60,955 62,622 64,335 66,0961Includes melons, sweet potatoes, and mushrooms. Utilized production is used for potatoes. Pulses include edible dry beans and peas, lentils, and other peas.
Table 15. U.S. sugar long-term projectionsItem Units 2014/15 2015/16 2016/17 2017/18 2018/19 2019/20 2020/21 2021/22 2022/23 2023/24 2024/25 2025/26
Sugarbeets Planted area 1,000 acres 1,163 1,164 1,178 1,233 1,261 1,265 1,245 1,225 1,206 1,189 1,172 1,156 Harvested area 1,000 acres 1,147 1,140 1,147 1,200 1,227 1,231 1,211 1,192 1,174 1,157 1,141 1,125 Yield Tons/acre 27.4 29.9 29.0 29.3 29.5 29.8 30.0 30.2 30.3 30.4 30.5 30.5 Production Mil. s. tons 31.4 35.2 33.2 35.1 36.3 36.7 36.3 35.9 35.6 35.2 34.7 34.3
Sugarcane Harvested area 1,000 acres 829 841 863 894 924 949 972 991 1,006 1,019 1,028 1,034 Yield Tons/acre 33.4 35.3 35.5 35.7 35.8 35.9 36.0 36.0 36.0 36.0 36.0 36.0 Production Mil. s. tons 27.7 29.7 30.7 31.9 33.1 34.1 35.0 35.6 36.2 36.6 37.0 37.2
Supply: Beginning stocks 1,000 s. tons 1,810 1,767 1,855 1,695 1,710 1,724 1,739 1,753 1,768 1,782 1,795 1,809 Production 1,000 s. tons 8,649 8,810 8,763 9,203 9,512 9,694 9,745 9,772 9,783 9,776 9,754 9,716 Beet sugar 1,000 s. tons 4,893 5,075 4,970 5,250 5,416 5,474 5,420 5,362 5,303 5,242 5,179 5,113 Cane sugar 1,000 s. tons 3,755 3,735 3,793 3,952 4,095 4,220 4,325 4,410 4,479 4,534 4,575 4,603 Total imports 1,000 s. tons 3,569 3,398 3,633 3,478 3,277 3,202 3,257 3,335 3,428 3,538 3,662 3,801
TRQ imports 1,000 s. tons 1,534 1,528 1,498 1,502 1,506 1,510 1,513 1,517 1,606 1,729 1,874 2,015 Imports from Mexico 1,000 s. tons 1,549 1,540 1,720 1,561 1,357 1,278 1,329 1,403 1,408 1,393 1,374 1,371 Other imports 1,000 s. tons 486 330 415 415 415 415 415 415 415 415 415 415
Total supply 1,000 s. tons 14,028 13,975 14,251 14,375 14,498 14,620 14,741 14,860 14,978 15,095 15,211 15,326
Use: Exports 1,000 s. tons 185 200 225 225 225 225 225 225 225 225 225 225 Domestic deliveries 1,000 s. tons 12,076 11,920 12,331 12,440 12,549 12,656 12,763 12,868 12,972 13,075 13,177 13,278 Total use 1,000 s. tons 12,261 12,120 12,556 12,665 12,774 12,881 12,988 13,093 13,197 13,300 13,402 13,503
Ending stocks 1,000 s. tons 1,767 1,855 1,695 1,710 1,724 1,739 1,753 1,768 1,782 1,795 1,809 1,823
Raw sugar price:
New York (No. 16)1 Cents/lb. 24.46 25.25 25.25 25.25 25.25 25.25 25.25 25.25 25.25 25.25 25.25 25.25 Raw sugar loan rate Cents/lb. 18.75 18.75 18.75 18.75 18.75 18.75 18.75 18.75 18.75 18.75 18.75 18.75 Beet sugar loan rate Cents/lb. 24.09 24.09 24.09 24.09 24.09 24.09 24.09 24.09 24.09 24.09 24.09 24.09 Grower prices:
Sugarbeets Dollars/ton 43.30 42.81 42.68 43.58 43.64 43.80 44.04 44.32 44.57 44.77 44.95 45.09 Sugarcane Dollars/ton 33.36 34.07 34.44 34.48 34.52 34.55 34.56 34.56 34.56 34.56 34.56 34.56
Note: Data shown are for an October-September year.1Price for July-September quarter.

USDA Long-term Projections, February 2016 39
U.S. Livestock
The U.S. livestock sector is projected to increase production over the next decade, an expansion that reflects several factors. Feed costs have fallen from recent highs and are projected to rise only moderately over the next 10 years. Also, demand for meats and dairy products in both the domestic market and for export is projected to be strong. As a result, total U.S. red meat and poultry production rises over the projection period. Milk production also increases over the next decade.
• Lower feed prices than in the past several years raise producer returns and, coupled with
improved pasture, provide incentives for herd expansion in the cattle sector and increases in beef production over the projection period. Beef cow numbers rise from 29.7 million head at the start of 2015 to more than 33 million toward the end of the projection period. The total cattle inventory rises from 89.8 million head to more than 97 million. Rising slaughter weights also contribute to the longer term increases in beef production.
• Lower feed costs and a rebound from the Porcine Epidemic Diarrhea virus (PEDv) led to a large rise in pork production in 2015. With demand projected to be strong over the next decade and only moderate projected increases in feed costs, producers are expected to increase farrowings. The number of pigs saved per litter also rises. Consequently, pork production rises over the projection period, with increases also supported by rising slaughter weights.
• Poultry production rises through the projection period, with both broiler and turkey meats projected to expand. Production growth is expected to come from both higher numbers of birds and higher average weights at slaughter.
10
15
20
25
30
35
40
45
1990 1995 2000 2005 2010 2015 2020 2025
U.S. red meat and poultry production
Billion pounds
Beef
Pork
Broilers

40 USDA Long-term Projections, February 2016
As production increases, consumption of red meats and poultry is projected to rise from about 211 pounds per person in 2015 to about 219 pounds toward the end of the projection period. Although this level consumption is below those in 2004-07 of more than 221 pounds per person, it represents a rebound from a low of 202 pounds per person in 2014.
• Per capita beef consumption rises moderately over the projection period, as production gains are large enough to support increasing net exports as well as rising domestic use.
• Per capita pork consumption rebounded sharply in 2015 as production gains reflected
producer response to improved returns and higher pigs per litter following losses due to PEDv. As with beef, for the remainder of the projections, gains in pork production are large enough to accommodate both increased domestic use as well as rising U.S. pork exports. Gains in per capita pork consumption slow toward the end of the projection period as production growth moderates.
• Poultry production rose sharply in 2015, although broilers and turkeys followed divergent
paths—overall gains were led by increases for broilers while turkey production fell largely due to effects of highly pathogenic avian influenza (HPAI). U.S. exports were down sharply in 2015 for both broilers and turkeys as many countries placed restrictions on the imports of U.S. poultry products following the HPAI outbreak. As a result, 2015 U.S. per capita consumption rose for both broilers and turkeys, even with the decline in turkey output. Poultry production is projected to increase throughout the next decade, with per capita consumption also rising.
30
40
50
60
70
80
90
100
1990 1995 2000 2005 2010 2015 2020 2025
U.S. per capita meat consumption
Pounds per capita, retail weight
Beef
Broilers
Pork

USDA Long-term Projections, February 2016 41
• Nominal prices for beef cattle, hogs, and broilers are projected to decline through most of the next decade as production levels for overall meats rise.
• Livestock prices begin to level off and increase slightly toward the end of the projection
period as production gains for beef, pork, and poultry slow and exports continue to grow.
20
40
60
80
100
120
140
160
1990 1995 2000 2005 2010 2015 2020 2025
Nominal U.S. livestock prices
Dollars per hundredweight
Beef cattle: Steers, 5-area
Broilers: National composite
Hogs: National base

42 USDA Long-term Projections, February 2016
The stronger U.S. dollar coupled with poultry trade restrictions related to HPAI led to a reduction in U.S. meat exports in 2015. However, U.S. red meat and poultry exports are projected to rise over the next decade as steady global economic growth supports foreign demand for selected meat cuts and parts from the large U.S. market.
• Most U.S. beef exports are high-quality, grain-fed beef that typically go to Mexico, Canada,
and Pacific Rim nations. The United States is projected to remain the world’s largest importer of beef, primarily of grass-fed, lean beef from Australia, New Zealand, and NAFTA countries for use in ground beef and processed products.
• U.S pork exports are projected to rise over the next decade. Production efficiency in the U.S. pork sector enhances the sector’s international competitiveness. Pacific Rim nations and Mexico are key markets for long-term growth of U.S. pork exports. Although Russia’s recent ban on imports from several countries is assumed to end, Russia’s pork imports are projected to continue to drop over the next decade, reflecting continued use of policies to facilitate expansion of its domestic pork industry and limit reliance on imports—these policies affect pork exports from the United States and Brazil the most.
• U.S. broiler exports rise through the projection period, with strong near-term gains reflecting a rebound from import restrictions due to HPAI. Major U.S. export markets include China and Mexico, but U.S. broiler exports also have been increasing to a number of other countries. Longer term gains in these markets reflect economic growth and increasing consumer demand. International demand for broilers also remains strong because of its lower cost relative to beef and pork. U.S. poultry producers continue to face competition from other major exporters, particularly Brazil. Over the projection period, most poultry exports from Thailand and China will continue to be fully cooked products, although Thai export gains also reflect the reopening of trade in uncooked chicken products from that country to the EU and Japan. As noted for pork, Russia is assumed to continue policies to support its domestic poultry industry—as a consequence, Russia’s poultry imports are projected to continue to fall.
0
2
4
6
8
10
12
14
16
18
20
1990 1995 2000 2005 2010 2015 2020 2025
Beef
Pork
Poultry
U.S. meat exports
Billion pounds

USDA Long-term Projections, February 2016 43
Milk production is projected to continue rising over the projection period. The long-term upward trend in output per cow continues. Strong domestic and export demand for dairy products combined with only moderate gains in projected feed costs provide favorable returns to dairy producers that also encourage a general expansion of milk cow numbers.
• Milk cow numbers are projected to decrease in 2016, remain about even through 2020, and then rise through the remainder of the projection period. Rising milk prices after 2018 and lower feed costs than in recent years give favorable returns to producers and provide economic incentives for this continued expansion.
• U.S. milk output per cow is projected to increase through the projection period, reflecting continued technological and genetic developments as well as efficiency gains resulting from consolidation in the sector.
• Domestic demand grows at a strong pace, with commercial use of dairy products rising faster than the growth in U.S. population over the next decade. Demand for cheese is expected to rise due to greater consumption of prepared foods and increased away-from-home eating. Butter demand is also expected to grow, in part due to the phase out of trans fats. A decline in per capita consumption of fluid milk products is expected to continue.
• Commercial exports of U.S. dairy products declined in 2015, mostly due to lower demand from China and greater competition from the EU as a result of the Russian trade ban. However, U.S. exports are projected to recover and expand over the next decade, led by greater exports of products that are high in nonfat milk solids, such as nonfat dry milk. Exports are projected to reach record levels on both a milk-fat and a skim-solids basis. Production increases in other major dairy exporting countries are expected to lag growth in global import demand.
• Nominal farm-level milk prices are projected to decline through 2018 as lower feed costs encourage increased production. Prices then rise faster than the general inflation rate over the remainder of the projection period, largely on the strength of export market gains.
8.5
9.0
9.5
10.0
1990 1995 2000 2005 2010 2015 2020 202510
15
20
25
U.S. dairy herd and milk production per cow
Million cows
Milk cows(left scale)
Output per cow(right scale)
Milk produced per cow(1,000 pounds)

44 USDA Long-term Projections, February 2016
Table 17. Per capita meat consumption, retail weightItem 2014 2015 2016 2017 2018 2019 2020 2021 2022 2023 2024 2025
Pounds
Beef 54.1 54.4 55.3 55.2 55.6 56.1 56.3 56.6 56.7 56.7 56.8 56.8 Veal 0.3 0.2 0.2 0.2 0.2 0.2 0.2 0.2 0.2 0.2 0.2 0.2 Pork 46.4 49.5 49.7 50.1 50.5 50.8 50.9 51.0 51.0 51.1 51.1 51.1 Lamb and mutton 0.9 1.0 0.9 0.9 0.9 0.9 0.9 0.9 0.9 0.8 0.8 0.8 Total red meat 101.7 105.2 106.1 106.5 107.2 108.0 108.3 108.6 108.8 108.9 108.9 108.9
Broilers 83.3 89.1 89.6 89.5 89.8 90.2 90.7 91.1 91.3 91.4 91.5 91.5 Other chicken 1.3 1.2 1.3 1.3 1.4 1.4 1.4 1.4 1.4 1.4 1.5 1.5 Turkeys 15.7 15.8 16.2 16.7 17.0 17.1 17.2 17.3 17.3 17.3 17.3 17.3 Total poultry 100.3 106.1 107.1 107.5 108.1 108.7 109.3 109.7 110.0 110.2 110.2 110.3
Red meat & poultry 202.1 211.2 213.2 214.0 215.3 216.7 217.6 218.4 218.8 219.0 219.1 219.2
Table 18. Beef long-term projectionsItem Units 2014 2015 2016 2017 2018 2019 2020 2021 2022 2023 2024 2025
Beginning stocks Mil. lbs. 584 591 600 560 560 560 560 560 560 560 560 560 Commercial production Mil. lbs. 24,252 23,715 24,850 25,230 25,696 26,231 26,619 26,992 27,303 27,559 27,786 27,992 Change from previous year Percent -5.7 -2.2 4.8 1.5 1.8 2.1 1.5 1.4 1.2 0.9 0.8 0.7
Farm production Mil. lbs. 68 65 64 65 65 65 65 65 65 65 65 65 Total production Mil. lbs. 24,320 23,780 24,914 25,295 25,761 26,296 26,684 27,057 27,368 27,624 27,851 28,057 Imports Mil. lbs. 2,947 3,432 3,045 2,950 2,975 3,000 3,050 3,100 3,150 3,200 3,250 3,300 Total supply Mil. lbs. 27,851 27,803 28,559 28,805 29,296 29,856 30,294 30,717 31,078 31,384 31,661 31,917
Exports Mil. lbs. 2,573 2,223 2,425 2,500 2,650 2,800 2,925 3,050 3,150 3,250 3,325 3,400
Ending stocks Mil. lbs. 591 600 560 560 560 560 560 560 560 560 560 560
Total consumption Mil. lbs. 24,687 24,980 25,574 25,745 26,086 26,496 26,809 27,107 27,368 27,574 27,776 27,957 Per capita, retail weight Pounds 54.1 54.4 55.3 55.2 55.6 56.1 56.3 56.6 56.7 56.7 56.8 56.8 Change from previous year Percent -3.8 0.5 1.6 -0.1 0.6 0.9 0.5 0.4 0.3 0.1 0.1 0.0
Prices:
Beef cattle, farm $/cwt 152.83 149.01 141.58 136.49 132.89 130.59 126.55 124.82 121.73 120.88 121.21 121.49 Calves, farm $/cwt 254.58 271.83 268.86 222.39 207.48 198.81 189.92 187.62 183.93 181.86 182.89 183.95 Steers, 5-area $/cwt 154.56 149.19 141.75 136.65 133.05 130.75 126.70 124.96 121.87 121.02 121.35 121.63 Feeder steers, Oklahoma City $/cwt 202.82 207.12 205.00 169.57 158.20 151.59 144.81 143.05 140.25 138.67 139.45 140.26
Feed price ratio:
Beef cattle-corn Ratio 34.3 40.3 38.8 37.9 36.4 35.3 34.2 33.7 32.9 32.7 32.8 32.4
Cattle inventory 1,000 head 88,526 89,800 92,900 95,200 95,700 96,200 96,600 96,900 97,100 97,200 97,300 97,400Beef cow inventory 1,000 head 29,086 29,675 30,382 30,800 31,300 31,800 32,200 32,500 32,800 33,000 33,100 33,200Total cow inventory 1,000 head 38,293 39,000 39,800 40,102 40,602 41,102 41,502 41,812 42,122 42,332 42,442 42,547Note: Cwt = hundredweight.

USDA Long-term Projections, February 2016 45
Table 19. Pork long-term projectionsItem Units 2014 2015 2016 2017 2018 2019 2020 2021 2022 2023 2024 2025
Beginning stocks Mil. lbs. 618 560 675 650 650 650 650 650 650 650 650 650 Commercial production Mil. lbs. 22,843 24,508 24,925 25,359 25,807 26,201 26,510 26,786 27,041 27,306 27,551 27,794 Change from previous year Percent -1.5 7.3 1.7 1.7 1.8 1.5 1.2 1.0 1.0 1.0 0.9 0.9
Farm production Mil. lbs. 18 18 18 18 18 18 18 18 18 18 18 18 Total production Mil. lbs. 22,861 24,526 24,943 25,377 25,825 26,219 26,528 26,804 27,059 27,324 27,569 27,812 Imports Mil. lbs. 1,008 1,106 1,000 1,015 1,025 1,035 1,045 1,055 1,065 1,075 1,085 1,095 Total supply Mil. lbs. 24,487 26,192 26,618 27,042 27,500 27,904 28,223 28,509 28,774 29,049 29,304 29,557
Exports Mil. lbs. 4,857 4,996 5,225 5,325 5,450 5,575 5,700 5,800 5,900 6,013 6,125 6,250
Ending stocks Mil. lbs. 560 675 650 650 650 650 650 650 650 650 650 650
Total consumption Mil. lbs. 19,070 20,521 20,743 21,067 21,400 21,679 21,873 22,059 22,224 22,386 22,529 22,657 Per capita, retail weight Pounds 46.4 49.5 49.7 50.1 50.5 50.8 50.9 51.0 51.0 51.1 51.1 51.1 Change from previous year Percent -0.9 6.8 0.3 0.8 0.9 0.6 0.2 0.2 0.1 0.1 0.0 0.0
Prices: Hogs, farm $/cwt 77.10 53.71 51.31 48.47 45.70 44.16 43.42 42.90 42.64 42.52 42.52 42.63 National base, live equivalent $/cwt 76.03 50.82 48.50 46.08 43.52 42.06 41.35 40.86 40.61 40.50 40.50 40.60
Feed price ratio:
Hog-corn Ratio 17.3 14.5 14.1 13.5 12.5 11.9 11.7 11.6 11.5 11.5 11.5 11.4
Hog inventory, December 1, previous year 1,000 head 64,775 67,776 68,025 68,662 69,320 69,899 70,352 70,757 71,132 71,520 71,881 72,237Note: Cwt = hundredweight.
Table 20. Young chicken long-term projectionsItem Units 2014 2015 2016 2017 2018 2019 2020 2021 2022 2023 2024 2025
Beginning stocks Mil. lbs. 669 680 800 695 695 695 695 695 695 695 695 695 Federally inspected slaughter Mil. lbs. 38,550 40,207 40,975 41,648 42,173 42,734 43,323 43,831 44,255 44,602 44,928 45,216 Change from previous year Percent 1.9 4.3 1.9 1.6 1.3 1.3 1.4 1.2 1.0 0.8 0.7 0.6
Production Mil. lbs. 38,138 39,777 40,537 41,202 41,721 42,277 42,860 43,362 43,781 44,125 44,447 44,733 Total supply Mil. lbs. 38,924 40,582 41,453 42,014 42,534 43,091 43,675 44,178 44,598 44,943 45,266 45,553
Change from previous year Percent 1.9 4.3 2.1 1.4 1.2 1.3 1.4 1.2 1.0 0.8 0.7 0.6
Exports Mil. lbs. 7,301 6,426 6,975 7,334 7,510 7,652 7,801 7,914 7,990 8,053 8,112 8,141
Ending stocks Mil. lbs. 680 800 695 695 695 695 695 695 695 695 695 695
Consumption Mil. lbs. 30,943 33,356 33,783 33,985 34,329 34,744 35,179 35,569 35,913 36,195 36,459 36,717 Per capita, retail weight Pounds 83.3 89.1 89.6 89.5 89.8 90.2 90.7 91.1 91.3 91.4 91.5 91.5 Change from previous year Percent 1.8 7.0 0.5 -0.1 0.3 0.5 0.5 0.4 0.3 0.1 0.1 0.0
Prices:
Broilers, farm Cents/lb. 63.8 53.1 50.8 50.6 50.8 50.8 50.7 50.6 50.6 50.7 50.7 50.7 Broilers, National composite Cents/lb. 104.9 89.5 85.8 85.0 85.0 84.7 84.5 84.3 84.3 84.5 84.5 84.5
Feed price ratio:
Broiler-feed1 Ratio 4.7 4.9 5.1 5.2 5.1 5.0 5.0 5.0 4.9 4.9 4.9 4.91Broiler feed price based on 58 percent corn price and 42 percent soybean price, as used by USDA, National Agricultural Statistics Service.

46 USDA Long-term Projections, February 2016
Table 21. Turkey long-term projectionsItem Units 2014 2015 2016 2017 2018 2019 2020 2021 2022 2023 2024 2025
Beginning stocks Mil. lbs. 237 193 190 250 275 275 275 275 275 275 275 275 Production Mil. lbs. 5,756 5,570 6,010 6,212 6,350 6,454 6,541 6,613 6,674 6,731 6,784 6,831 Total supply Mil. lbs. 6,022 5,804 6,236 6,498 6,661 6,765 6,852 6,924 6,985 7,042 7,095 7,142
Change from previous year Percent -0.4 -3.6 7.4 4.2 2.5 1.6 1.3 1.0 0.9 0.8 0.7 0.7
Exports Mil. lbs. 805 537 740 786 813 833 850 860 868 875 882 888
Ending stocks Mil. lbs. 193 190 250 275 275 275 275 275 275 275 275 275
Consumption Mil. lbs. 5,024 5,077 5,246 5,437 5,573 5,657 5,727 5,789 5,843 5,892 5,938 5,979 Per capita Pounds 15.7 15.8 16.2 16.7 17.0 17.1 17.2 17.3 17.3 17.3 17.3 17.3 Change from previous year Percent -1.3 0.3 2.6 2.9 1.8 0.8 0.5 0.4 0.2 0.2 0.1 0.0
Prices:
Turkey, farm Cents/lb. 73.2 81.3 79.0 77.2 75.5 74.2 73.6 73.1 73.0 73.1 73.3 73.6 Hen turkeys, National Cents/lb. 107.6 117.1 114.0 111.4 108.9 107.1 106.2 105.5 105.3 105.5 105.7 106.2
Feed price ratio:
Turkey-feed1 Ratio 5.8 8.0 8.6 8.7 8.4 8.1 8.0 7.9 7.8 7.8 7.8 7.81Turkey feed price based on 51 percent corn price, 28 percent soybean price, and 21 percent wheat price, as used by USDA, National Agricultural Statistics Service.
Table 22. Egg long-term projectionsItem Units 2014 2015 2016 2017 2018 2019 2020 2021 2022 2023 2024 2025
Beginning stocks Mil. doz. 23 23 23 22 21 20 20 20 20 20 20 20 Production Mil. doz. 8,335 7,915 8,141 8,426 8,637 8,809 8,941 9,058 9,158 9,258 9,360 9,463 Change from previous year Percent 2.3 -5.0 2.9 3.5 2.5 2.0 1.5 1.3 1.1 1.1 1.1 1.1
Imports Mil. doz. 35 81 71 50 45 45 45 45 45 45 45 45 Total supply Mil. doz. 8,393 8,019 8,235 8,498 8,703 8,874 9,006 9,123 9,223 9,323 9,425 9,528
Change from previous year Percent 2.6 -4.5 2.7 3.2 2.4 2.0 1.5 1.3 1.1 1.1 1.1 1.1
Hatching use Mil. doz. 981 993 1,005 1,017 1,028 1,037 1,047 1,057 1,065 1,071 1,077 1,082 Exports Mil. doz. 394 323 350 375 400 403 406 409 412 415 418 421
Ending stocks Mil. doz. 23 23 22 21 20 20 20 20 20 20 20 20
Consumption Mil. doz. 6,995 6,680 6,858 7,084 7,255 7,414 7,533 7,637 7,726 7,817 7,910 8,005 Per capita Number 263.0 249.3 254.1 260.6 265.0 268.9 271.3 273.1 274.4 275.8 277.2 278.7 Change from previous year Percent 1.8 -5.2 1.9 2.6 1.7 1.5 0.9 0.7 0.5 0.5 0.5 0.5
Prices:
Eggs, farm Cents/doz. 125.8 171.0 153.2 130.5 112.5 103.5 99.0 94.5 91.8 90.9 90.0 90.0 New York, Grade A large Cents/doz. 142.3 188.0 167.5 145.0 125.0 115.0 110.0 105.0 102.0 101.0 100.0 100.0
Feed price ratio:
Egg-feed1 Ratio 11.0 18.7 17.8 15.5 13.2 11.9 11.4 10.8 10.4 10.3 10.1 10.11/ Egg feed price based on 75 percent corn price and 25 percent soybean price, as used by USDA, National Agricultural Statistics Service.

USDA Long-term Projections, February 2016 47
Table 23. Dairy long-term projectionsItem Units 2014 2015 2016 2017 2018 2019 2020 2021 2022 2023 2024 2025
Milk production and marketings: Number of cows Thousand 9,256 9,310 9,305 9,305 9,305 9,305 9,305 9,315 9,325 9,335 9,345 9,350 Milk per cow Pounds 22,260 22,410 22,880 23,290 23,745 24,200 24,760 25,215 25,750 26,295 26,920 27,405 Milk production Bil. lbs. 206.0 208.7 212.9 216.7 220.9 225.2 230.4 234.9 240.1 245.5 251.6 256.2 Farm use Bil. lbs. 1.0 1.0 1.0 1.0 1.0 1.0 1.0 1.0 1.0 0.9 0.9 0.9 Marketings Bil. lbs. 205.1 207.7 211.9 215.7 219.9 224.2 229.4 233.9 239.1 244.6 250.7 255.3
Supply and use, milkfat basis:
Beginning commercial stocks Bil. lbs. 11.2 11.2 12.4 12.2 12.7 13.1 12.9 12.7 12.5 12.4 12.3 12.3 Marketings Bil. lbs. 205.1 207.7 211.9 215.7 219.9 224.2 229.4 233.9 239.1 244.6 250.7 255.3 Imports Bil. lbs. 4.3 5.9 5.8 5.2 4.9 4.7 4.6 4.5 4.5 4.5 4.5 4.5 Commercial supply Bil. lbs. 220.6 224.8 230.1 233.1 237.5 242.0 246.9 251.1 256.1 261.5 267.5 272.1
Domestic commercial use Bil. lbs. 196.9 203.6 208.6 208.9 212.2 217.0 222.0 226.5 231.1 236.4 242.1 246.2 Commercial exports Bil. lbs. 12.4 8.8 9.4 11.5 12.2 12.1 12.2 12.1 12.6 12.8 13.1 13.6
Ending commercial stocks Bil. lbs. 11.2 12.4 12.2 12.7 13.1 12.9 12.7 12.5 12.4 12.3 12.3 12.3
Supply and use, skim solids basis:
Beginning commercial stocks Bil. lbs. 11.7 13.1 13.4 13.6 13.2 13.3 13.4 13.4 13.5 13.5 13.6 13.7 Marketings Bil. lbs. 205.1 207.7 211.9 215.7 219.9 224.2 229.4 233.9 239.1 244.6 250.7 255.3 Imports Bil. lbs. 5.6 6.0 6.1 5.8 5.7 5.7 5.6 5.6 5.6 5.6 5.6 5.7 Commercial supply Bil. lbs. 222.4 226.8 231.4 235.1 238.8 243.2 248.4 252.9 258.2 263.7 269.9 274.7
Domestic commercial use Bil. lbs. 170.2 175.6 178.4 181.3 184.4 187.4 190.6 193.7 197.5 201.2 205.2 207.5 Commercial exports Bil. lbs. 39.1 37.8 39.5 40.6 41.1 42.4 44.4 45.7 47.2 48.9 51.0 53.4
Ending commercial stocks Bil. lbs. 13.1 13.4 13.6 13.2 13.3 13.4 13.4 13.5 13.5 13.6 13.7 13.8
Prices: All milk $/cwt 23.97 17.05 16.40 16.25 16.15 16.60 17.20 17.85 18.45 18.95 19.50 19.90 Cheese $/lb. 2.18 1.65 1.64 1.61 1.58 1.60 1.65 1.70 1.76 1.82 1.87 1.90 Butter $/lb. 2.14 2.03 1.90 1.58 1.48 1.52 1.58 1.64 1.64 1.65 1.67 1.67 Nonfat dry milk $/lb. 1.77 0.91 0.99 1.20 1.27 1.32 1.37 1.43 1.49 1.53 1.58 1.63 Dry whey $/lb. 0.65 0.38 0.30 0.35 0.36 0.37 0.40 0.42 0.45 0.47 0.49 0.53Note: Cwt = hundredweight.Totals may not add due to rounding.

48 USDA Long-term Projections, February 2016
U.S. Farm Income
Net cash income and net farm income initially fall from recent record highs. Net cash income declines through 2019 before generally rising over the latter part of the projection period. Net farm income, which through 2015 fell more sharply from its peak, generally rises after 2016.
• Projected reductions in prices for most major crops and livestock result in declines in farm cash receipts in 2015-17. Crop cash receipts fall through 2016, while livestock cash receipts decline through 2018. Cash receipts then grow over the rest of the projection period as steady domestic and international economic growth support longer term demand for U.S. agricultural products.
• Total direct Government payments are projected to increase to more than $13 billion in 2016 and 2017, largely reflecting lower crop prices that push up payments under the Agriculture Risk Coverage (ARC) and Price Loss Coverage (PLC) programs of the Agricultural Act of 2014. Government payments then fall in 2018 and 2019 as commodity prices begin to rise. Government payments are projected to increase again in 2020 before falling over the remainder of the projection period.
• Total farm production expenses and cash expenses fell in 2015 as declines in feed costs and energy-related input prices combined with reduced acreage to lower expenses for farm-origin and manufactured inputs. Farm production expenses are projected to increase after 2017 as crude oil prices and interest rates rise.
0
25
50
75
100
125
150
1990 1995 2000 2005 2010 2015 2020 2025
U.S. farm income indicators
Billion dollars
Net cash income
Net farm income

USDA Long-term Projections, February 2016 49
0
100
200
300
400
500
1990 1995 2000 2005 2010 2015 2020 2025
U.S. net cash income
Gross cash income
Cash expenses
Net cash income
Billion dollars
0
100
200
300
400
500
1990 1995 2000 2005 2010 2015 2020 2025
U.S. net farm income
Total gross income
Total expenses
Net farm income
Billion dollars
0
100
200
300
400
500
1990 1995 2000 2005 2010 2015 2020 2025
Livestock
Crops
U.S. cash receipts
Billion dollars

50 USDA Long-term Projections, February 2016
Direct Government payments to farmers rise sharply in 2016, mostly due to ARC and PLC payments under the Agricultural Act of 2014. After falling to $7.5 billion in 2019, direct Government payments rise again in 2020 and average less than $10 billion per year over 2020-25, compared to an annual average of more than $15 billion in 2001-10. The Conservation Reserve Program (CRP), ARC, and PLC provide the largest direct Government payments to the agricultural sector over the projection period.
• Acreage enrolled in the CRP is assumed at slightly less than its legislative maximum of 24 million acres under the Agricultural Act of 2014. As crop prices begin to rise again, average rental rates for land in the CRP will also increase. As a result, CRP payments are projected to increase from about $1.8 billion in 2015 to $2.4 billion in 2025.
• Payments under the ARC and PLC programs total about $9 billion annually in 2016 and 2017, reflecting reductions in crop prices from relatively high levels of recent years. While these payments fall in 2018 and 2019 as crop prices rise, they jump to nearly $5 billion in 2020 as some producers are assumed to shift to PLC. (The initial producer election of ARC or PLC under the Agricultural Act of 2014 covers 2014-18 crops. For projections beyond those years, another enrollment election is assumed to be available for 2019-25 crops.) These payments and overall direct Government payments to farmers then fall over the last 5 years of the projection period, again reflecting rising crop prices.
0
5
10
15
20
25
1990 1995 2000 2005 2010 2015 2020 2025
Direct Government payments
Total direct Government payments
Billion dollars

USDA Long-term Projections, February 2016 51
Total farm production expenses fell in 2015 as declining agricultural commodity prices reduced farm-origin costs, while lower planted acreage and crude oil prices reduced manufactured input expenses. Production expenses rise after 2017, although increases are less rapid than the overall rate of inflation through 2025. While interest expenses and fuel and oil costs rise faster than the general inflation rate during these years, expenses for farm-origin inputs and other manufactured inputs are up less than the general inflation rate. Aggregate expenses for other nonfarm-origin inputs increase at rates somewhat below the overall inflation rate.
• Interest costs rise faster than the general inflation rate over the projection period, reflecting
rising farm debt levels as well as increasing interest rates due largely to tightening monetary policy.
• Production expenses for fuel and oil also rise faster than the general inflation rate after 2017, largely reflecting increases in crude oil prices. Reductions in planted acreage in 2016-17 combine with anticipated higher domestic nitrogen fertilizer production capacity and relatively low natural gas prices to lower fertilizer expenses slightly in this period, with these costs rising more slowly than the general rate of inflation later in the projection period.
0
100
200
300
400
500
1990 1995 2000 2005 2010 2015 2020 2025
Other ManufacturedFarm origin
U.S. farm production expenses
Billion dollars

52 USDA Long-term Projections, February 2016
Table 24. Farm receipts, expenses, and income, long-term projections2014 2015 2016 2017 2018 2019 2020 2021 2022 2023 2024 2025
Billion dollarsCash income statement
Cash receipts: 421.9 378.3 371.9 366.8 368.0 372.2 375.5 380.6 384.7 389.9 396.6 403.0 Crops 209.7 191.5 187.2 188.8 192.7 196.2 199.2 202.1 204.9 207.7 210.8 214.1 Livestock 212.2 186.8 184.7 178.0 175.3 176.0 176.4 178.5 179.8 182.2 185.8 188.9Direct government payments 9.8 10.8 13.8 13.6 8.8 7.5 10.0 9.8 9.7 9.5 9.4 9.1Farm-related income 35.4 34.6 34.0 34.1 34.2 34.3 34.3 34.5 34.6 34.7 34.8 34.9Gross cash income 467.1 423.6 419.6 414.5 410.9 413.9 419.9 424.8 429.0 434.1 440.8 447.0
Cash expenses 338.5 330.6 331.8 329.8 334.3 339.5 344.4 349.0 353.8 358.1 362.4 367.9Net cash income 128.6 93.0 87.8 84.7 76.6 74.4 75.5 75.9 75.2 76.0 78.3 79.1
Farm income statementGross cash income 467.1 423.6 419.6 414.5 410.9 413.9 419.9 424.8 429.0 434.1 440.8 447.0Non-money income 16.9 16.5 17.1 17.7 18.4 19.0 19.6 20.4 20.8 21.2 21.5 21.9Value of inventory change -3.3 -1.6 -2.7 1.1 1.5 1.3 1.0 0.7 0.7 0.7 0.6 0.9Gross farm income 480.7 438.5 434.1 433.4 430.7 434.2 440.5 446.0 450.5 456.0 462.9 469.8
Total expenses 390.3 382.6 383.1 372.6 372.7 376.2 378.8 382.2 386.9 391.3 395.4 401.0Net farm income 90.4 55.9 51.0 60.7 58.0 58.0 61.7 63.8 63.6 64.7 67.5 68.8
The projections were completed in December 2015. History for 2014 and short-term forecasts for 2015 are from USDA-Economic Research Service, November 24, 2015.
USDA Long-term Projections, February 2016 53
Agricultural Trade
Steady world economic growth is projected over the next decade, despite a near-term slowdown in many developing countries. Projected global demand for agricultural products will rise, but at a slower rate than in the past decade. At the same time, world agricultural production is projected to increase more rapidly than world population, enabling a small increase in global per capita use of most agricultural products. Growth in world agricultural trade is projected to continue, albeit at a slower rate than in recent years. Together, these trends result in continued declines in the projected prices of agricultural commodities over the short term and the persistence of low prices throughout the projection period. Foreign Crop Production World agricultural production is projected to continue rising in the coming decade due to yield growth and some expansion in cultivated area. Yield growth continues due to technological enhancements and increasing economies of scale in many countries. Lower prices and profits impact production decisions throughout the world. Producers may reduce input use, which may lower yields. Lower prices will also limit overall area expansion. Projected relatively low energy prices will help lower production costs. Globally, the total area planted to grains, oilseeds, and cotton is projected to expand at an average annual rate of 0.45 percent from 2016 to 2025. Oilseed area expands the most, especially for soybeans. Area harvested for total coarse grains increases moderately throughout the projection period, at an average annual rate of 0.2 percent. Global area for the major food staples grows slowly, with rice area increasing at a projected annual rate of 0.3 percent and wheat area increasing at a rate of 0.4 percent. Some area expansion continues with a conversion of new cropland and in regions with lower cost of production, such as Brazil, countries of the former Soviet Union (FSU), and Indonesia. Among the world’s leading soybean producers, Brazil exhibits the greatest increase in area over the projection period, with an annual growth rate of more than 1.8 percent. Increased soybean plantings in Brazil of a little over 6 million hectares accounts for more than half of the total world area added to soybeans during the projection period.
General International Assumptions
Trade projections to 2025 are based on economic relationships and assumptions concerning trends in area, yields, and use. The development and use of technology and changes in consumer preferences are assumed to continue evolving based on past performance and consensus judgment of USDA analysts regarding future developments. The projections also reflect effects of trade agreements, sanitary and phytosanitary restrictions, and domestic policies in place or authorized by November 2015. International macroeconomic assumptions were completed in October 2015.
54 USDA Long-term Projections, February 2016
Yield growth for grains and oilseeds is the major contributor to increasing global production. Worldwide, yield growth rates have decreased slightly over the past couple of decades, which are, in turn, lower than the growth rates of 3 to 4 decades ago. The projected annual yield growth rates over the coming decade are 1.0 percent for corn, 1.1 percent for soybeans, 0.7 percent for rice, and 0.6 percent for wheat. Crop yields and yield growth rates vary greatly across countries. For example, in the first year of the projection (2016/17), corn yields are 10.7 tons per hectare in the United States and 6.0 tons per hectare in China, while wheat yields are 4.0 tons per hectare and 5.4 tons per hectare, respectively.
Contributing to cross-country differences in yields are factors such as differences in natural resource endowments, differences in the varieties that are suitable for specific countries and for specific regions within countries, varying levels of access to technology, and differences in management practices. Country-specific factors that can affect future investments to improve land quality and yields and adopt improved technologies include the extent to which property rights are protected, the country’s legal system, and how inheritances are handled. A few agricultural commodities have experienced tremendous yield gains (rice is a prominent example), but in some instances, these gains have come at the expense of quality and taste. These two attributes of food grains are important to many consumers, and with increasing global incomes, food grain producers in certain countries have switched to or continue to cultivate lower yielding varieties in order to respond to consumer demand for higher quality and better tasting food grains.
Tightening water supplies and the rising cost of pumping from underground sources are major impediments to yield growth in some regions, particularly in areas with falling water tables, and limit the ability to maintain or expand irrigated area. Some countries face worsening water quality problems due to pollution and natural salinity issues. Countries such as India are dependent on regular wet-season rainfall to recharge reservoirs for dry-season irrigation.
Global stocks have increased for most commodities over the past several years and are projected to continue increasing throughout the projection period. A number of factors are driving this accumulation of inventories. First, for most crops, world production has increased faster than demand, which has contributed to lower prices and led producers and governments to increase their holdings of stocks. Normally, producers increase their stock levels in the face of lower commodity prices, with the expectation that prices will eventually improve. Meanwhile, government policies in some countries have facilitated the accumulation of higher reserve stocks as a way to support producers and construct a buffer against large future swings in commodity prices. Some countries use price supports and input subsidies as policy levers to maintain food security and to support the incomes of farm households. These policies have led to large accumulation of stocks in some countries, including larger stocks of grains and cotton in China, rice in Thailand, and rice and wheat in India. Over the coming decade, Thailand and China are projected to lower their stock levels. In particular, China is projected to reduce its cotton stocks. Also, Thailand began to reduce rice stocks in 2015/16, cutting stocks almost in half, and is projected to continue reducing its rice stocks during the first half of the projection period.

USDA Long-term Projections, February 2016 55
Food and feed demand Low- and middle-income countries are the main sources of growing food and feed demand and are projected to account for most of the increase in world consumption and imports of basic agricultural commodities over the coming decade. Developing countries account for more than four-fifths of the projected increase in global consumption of meat, demand for grains and oilseeds, and virtually all of the growth in cotton consumption. Demand for agricultural products in developing countries increases faster than production, resulting in increasing imports. In addition to rising household incomes and low commodity prices, several longer term demographic and economic trends are driving world demand for these commodities upward. An important factor is world population growth, which grows about 1 percent annually over the next decade. The low- and middle-income countries are increasing the fastest, adding more consumers to the market. Moreover, these same countries are experiencing higher income growth, further urbanization, upgraded infrastructures, better access to modern food markets, and changing diets and preferences. Large numbers of once-poor consumers are spending their higher incomes on more and better food. Urbanization and modern food retailers expose these same consumers to new types of food, and improved infrastructure and food retail chains make it possible for more food options to reach consumers. Taken together, these factors stimulate world demand for grains, oilseeds, cotton, and livestock products. Meat demand and trade A large portion of international trade in basic agricultural commodities is driven by increasing meat consumption and feed demand resulting from the production of livestock. Global meat consumption continues to rise throughout the projection period. Consumption of poultry meat, the lowest priced of the three major types of meat, increases at the fastest rate: 1.8 percent annually. Global beef and pork consumption both grow at an annual rate near 0.9 percent. These growth rates are lower than those experienced during the previous decade, due to slightly slower income growth in the early years of the projection. Global per capita meat consumption remains low compared with levels in higher-income countries—an indication of the potential for continued growth in world meat consumption. In the first projection year (2016/17), global per capita meat consumption is 9.6 kilograms of beef, 16.4 kilograms of pork, and 15.3 kilograms of poultry. Average per capita consumption for developing economies is much lower: for example, 2016 per capita meat consumption in the West Africa Community (ECOWAS) includes 3.4 kilograms of beef, 1.3 kilograms of pork, and 3.1 kilograms of poultry. Meat consumption is projected to grow at 2.4 percent annually for both Sub-Saharan Africa and North Africa and 1.9 percent annually for the Middle East through 2025/26. Southeast Asia’s projected annual growth rate for meat consumption is 2.4 percent through 2025/26. Over the projection period, these 4 combined regions increase meat consumption by 7.8 million tons, which is 20 percent of the global growth in meat demand. Meat imports for these 4 regions increase by 3 million tons, accounting for about 38 percent of their increased meat consumption. The rest comes from increased domestic production. These 4 regions account for almost 40 percent of increased global meat imports through 2025/26.
Increasing meat consumption does not necessarily lead to increases in meat imports. China, India, Brazil, and the United States account for almost half (49 percent) of the increased global

56 USDA Long-term Projections, February 2016
consumption of meat by 2025/26, with a combined increase of 18.9 million tons. Although these countries have much lower consumption growth rates they all have large populations and higher levels of per capita meat consumption. In these 4 countries, increased consumption is mostly matched by increased domestic production. The main exception to this pattern is China, where about 9 percent of the additional meat consumption is supplied by imports. China exhibits the largest increase in meat consumption at 10.1 million tons by 2025/26, followed by India at 4 million tons. In Brazil and the United States, meat production grows faster than consumption. This allows Brazilian meat exports to increase by 2.8 million tons by 2025/26 and U.S. meat exports to increase by 2.1 million tons. Mexico, China, and Hong Kong have the largest increases in meat imports by 2025/26, with additional imports of 1.0 million, 0.9 million, and 0.8 million tons, respectively. Increasing global feed demand and trade results from increasing meat consumption and production. The regions with the fastest growth in corn imports over the projection period include Sub-Saharan Africa, North Africa, and the Middle East, with annual growth rates of 9.9 percent, 3 percent, and 2.4 percent, respectively. The increase in corn imports for these three regions is a combined 12.5 million tons, which accounts for about 63 percent of the world increase in corn imports over the projection period. Southeast Asia’s corn imports are increasing due to its fast growing meat sectors, mostly poultry and pork. Over the projection period, Southeast Asia’s annual corn demand increases by 8.7 million tons, but annual domestic corn production only increases by 5.5 million tons, leading to an increase in annual corn imports of over 3 million tons by 2025/26. Vietnam, Indonesia, and Malaysia are the major corn importers in this region. Together, they import a total of 12.9 million tons of corn in 2025/26, which is an increase of 2.7 million tons over the projection period. Exporters Increasing global demand for agricultural commodities, especially by developing countries, leads to higher production and exports by major exporting countries throughout the projection period. Increasing trade also benefits from lower freight rates, which reflect projections of continued low oil prices. Countries that have traditionally exported a large quantity and a wide range of agricultural products, such as Argentina, Australia, Brazil, Canada, the European Union (EU), and the United States, are expected to remain important exporters during the coming decade. But countries that have made significant investments in their agricultural sectors and are pursuing policies intended to encourage agricultural production, including Russia, Ukraine, and Kazakhstan, are expected to have an increasing presence in export markets for agricultural commodities. India has emerged as a major exporter of rice, cotton, and beef (carabeef, from water buffalo) over the last decade, and is expected to remain important in each of these markets during the projection period. Both Burma and Cambodia have expanded rice production and are expected to increase their rice exports significantly over the projection period.

USDA Long-term Projections, February 2016 57
Biofuel Global expansion of biofuel production is projected to continue during the next decade, although at a slower pace than over the last half decade. This slowdown in part reflects lower crude oil prices. However, it is also attributable to technical limits and some withdrawal of government support for biofuels. As a result, demand for biofuel feedstocks also continues to grow more slowly. The largest global biofuel producers include the United States, Brazil, the EU, and China. Ethanol is the primary biofuel produced in the United States, Brazil, and China, whereas biodiesel accounts for about three-fourths of EU biofuel production. Indonesia and Malaysia continue to increase biofuel production from palm oil, and the Philippines is expanding copra use for biofuel. Canada replaced the EU as the world’s largest importer of biofuels in 2014, mostly due to EU border protection measures that sharply lowered biofuel imports. Canada remains the world’s largest importer of biofuels throughout the projection period, with ethanol accounting for the majority of those imports. The United States supplies most of Canada’s ethanol imports. Argentina, Brazil, and the United States are the world’s largest biofuel exporters, with Argentina specializing in soybean oil-based biodiesel, Brazil in sugarcane-based ethanol, and the United States in corn-based ethanol. Biofuel exports from each of these three countries grow steadily in the projections although exports from Argentina and Brazil are constrained by increased domestic use of biofuels. Indonesia and Malaysia have also implemented policies favoring more domestic consumption of biodiesel in lieu of exports.
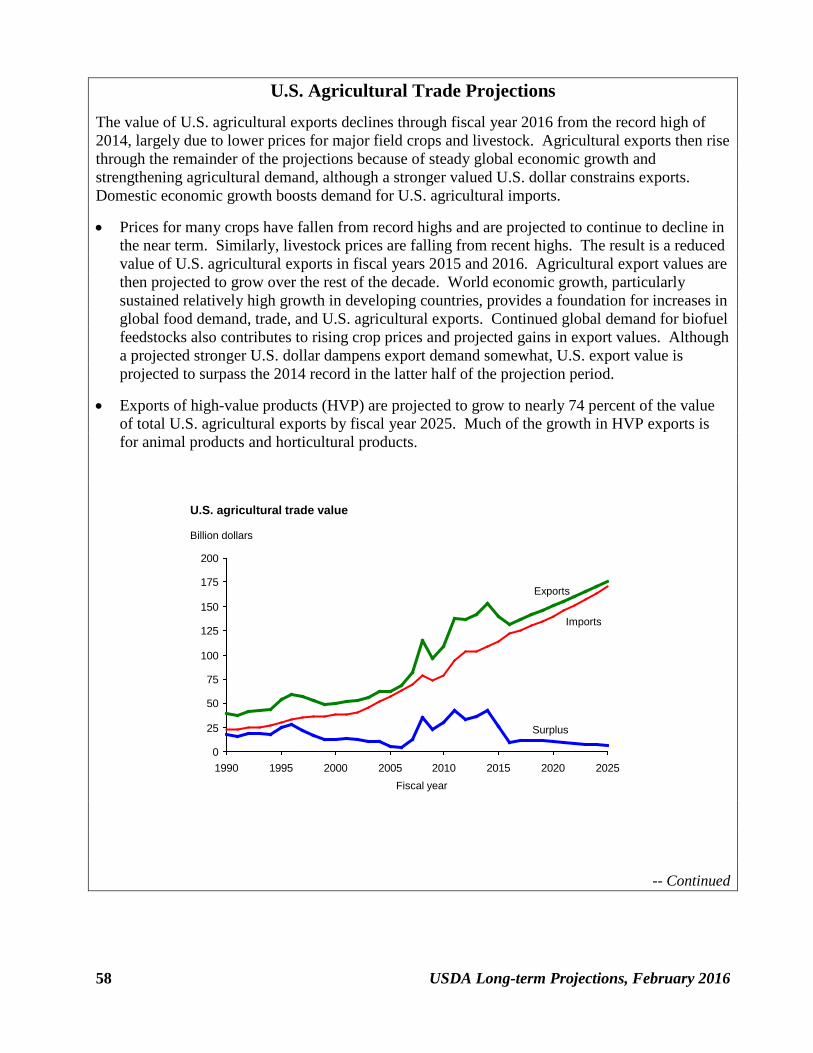
58 USDA Long-term Projections, February 2016
U.S. Agricultural Trade Projections The value of U.S. agricultural exports declines through fiscal year 2016 from the record high of 2014, largely due to lower prices for major field crops and livestock. Agricultural exports then rise through the remainder of the projections because of steady global economic growth and strengthening agricultural demand, although a stronger valued U.S. dollar constrains exports. Domestic economic growth boosts demand for U.S. agricultural imports.
• Prices for many crops have fallen from record highs and are projected to continue to decline in the near term. Similarly, livestock prices are falling from recent highs. The result is a reduced value of U.S. agricultural exports in fiscal years 2015 and 2016. Agricultural export values are then projected to grow over the rest of the decade. World economic growth, particularly sustained relatively high growth in developing countries, provides a foundation for increases in global food demand, trade, and U.S. agricultural exports. Continued global demand for biofuel feedstocks also contributes to rising crop prices and projected gains in export values. Although a projected stronger U.S. dollar dampens export demand somewhat, U.S. export value is projected to surpass the 2014 record in the latter half of the projection period.
• Exports of high-value products (HVP) are projected to grow to nearly 74 percent of the value of total U.S. agricultural exports by fiscal year 2025. Much of the growth in HVP exports is for animal products and horticultural products.
-- Continued
0
25
50
75
100
125
150
175
200
1990 1995 2000 2005 2010 2015 2020 2025
U.S. agricultural trade value
Billion dollars
Exports
Imports
Fiscal year
Surplus

USDA Long-term Projections, February 2016 59
U.S. Agricultural Trade Projections (Continued) • U.S. agricultural import values rise throughout the projection period to about $170 billion in
fiscal year 2025, up from $122 billion in 2016. These increases are boosted by gains in U.S. consumer incomes and demand for a large variety of foods. Strong growth in horticultural imports is assumed to continue, contributing more than half of the overall increase in agricultural imports during the projection period.
• With the value of U.S. exports initially falling, the agricultural trade balance is expected to decline from 2014’s record high of $43.1 billion to $9.5 billion in fiscal year 2016. The U.S. agricultural trade surplus rebounds somewhat through 2018 before falling marginally over the rest of the projection period to under $6 billion in fiscal year 2025.
Table 25. U.S. agricul tura l trade long-term projections , fi sca l years
2014 2015 2016 2017 2018 2019 2020 2021 2022 2023 2024 2025
Billion dollarsAgricul tura l exports (va lue): Livestock, poultry, and da i ry 33.8 29.3 28.2 29.8 31.1 32.3 33.8 35.2 36.7 38.3 39.9 41.8 Livestock products 20.0 18.2 17.5 17.9 18.6 19.4 20.1 20.9 21.6 22.4 23.2 24.1 Da i ry products 7.4 5.6 5.6 6.4 6.8 7.1 7.6 8.1 8.7 9.3 10.0 10.9 Poul try products 6.4 5.5 5.2 5.5 5.7 5.9 6.1 6.2 6.4 6.5 6.7 6.8 Gra ins and feeds 36.4 31.6 28.6 29.6 30.7 31.5 32.4 33.2 34.1 35.0 36.1 37.1 Coarse gra ins 12.5 11.0 9.8 9.9 10.3 10.5 10.7 10.8 11.0 11.1 11.5 11.8 Feeds and fodder 10.0 8.1 7.0 7.3 7.5 7.8 8.1 8.4 8.7 9.0 9.4 9.7 Oi l seeds and products 34.9 31.7 26.3 26.8 27.4 27.8 28.2 28.7 28.8 29.1 29.6 29.9 Soybeans and products 30.6 27.7 22.4 22.8 23.4 23.7 24.1 24.4 24.6 24.8 25.2 25.5 Horticul tura l products 33.4 34.1 36.5 38.0 39.5 41.1 42.7 44.4 46.2 48.0 50.0 52.0 Cotton 4.6 4.1 3.2 3.3 3.4 3.5 3.6 3.6 3.7 3.8 3.9 4.0 Sugar and tropica l products 6.3 6.1 6.1 6.3 6.4 6.6 6.8 7.0 7.2 7.4 7.6 7.8
Other exports 1 2.9 2.8 2.6 2.7 2.7 2.8 2.8 2.9 2.9 3.0 3.0 3.1
Tota l agricul tura l exports 152.3 139.7 131.5 136.4 141.2 145.5 150.3 155.0 159.7 164.6 170.2 175.8
Major bulk products 2 52.6 46.0 38.9 40.0 41.1 41.8 42.7 43.3 43.9 44.5 45.5 46.2
High-va lue product exports 3 99.7 93.7 92.6 96.4 100.0 103.7 107.7 111.7 115.8 120.1 124.7 129.5
High-va lue product share 65.5% 67.1% 70.4% 70.7% 70.9% 71.3% 71.6% 72.1% 72.5% 73.0% 73.3% 73.7%
Million metric tonsAgricul tura l exports (volume):
Bulk commodity exports 134.6 134.6 128.9 130.6 132.3 134.0 135.6 136.6 138.4 139.9 141.7 143.5
Billion dollars
Livestock and da i ry products 16.0 19.5 18.0 17.1 17.1 17.4 17.8 18.2 18.7 19.2 19.7 20.3 Livestock and meats 12.1 15.2 13.7 12.7 12.6 12.8 13.1 13.4 13.7 14.0 14.4 14.9 Da i ry products 3.3 3.5 3.5 3.5 3.6 3.7 3.8 3.9 4.0 4.1 4.2 4.4 Gra ins and feeds 10.8 10.8 11.2 11.4 11.8 12.3 12.8 13.3 13.8 14.4 14.9 15.5 Gra in products 6.6 7.0 7.2 7.5 7.8 8.1 8.4 8.8 9.1 9.5 9.9 10.3 Oi l seeds and products 9.9 8.8 9.4 9.7 10.3 10.9 11.5 12.0 12.6 13.1 13.8 14.4 Vegetable oi l s 5.6 5.5 5.6 5.9 6.2 6.4 6.7 7.0 7.4 7.7 8.1 8.4 Horticul tura l products 47.0 49.7 54.5 56.8 59.3 62.0 64.7 67.5 70.5 73.6 76.8 80.2 Sugar and tropica l products 23.2 23.5 27.2 28.3 29.1 29.9 30.9 32.0 33.2 34.5 35.8 37.2 Sugar and related products 4.7 4.9 4.9 5.2 5.1 5.0 4.9 5.0 5.2 5.3 5.5 5.6 Cocoa, coffee, and products 10.7 11.1 12.6 13.1 13.6 14.1 14.6 15.2 15.8 16.4 17.0 17.7
Other imports 4 2.2 1.8 1.9 2.0 2.0 2.1 2.1 2.2 2.3 2.4 2.4 2.5
Tota l agricul tura l imports 109.2 114.0 122.0 125.3 129.8 134.7 139.8 145.3 151.1 157.1 163.5 170.1
Net agricul tura l trade ba lance 43.1 25.7 9.5 11.1 11.4 10.8 10.5 9.6 8.5 7.5 6.8 5.7Sources : U.S. Department of Agricul ture and U.S. Department of Commerce, Census Bureau.
1Includes planting seeds , unmanufactured tobacco, and cotton l inters .2Includes bulk gra ins , soybeans , cotton, and tobacco.
4Includes planting seeds , unmanufactured tobacco, and cotton.
Agricul tura l imports (va lue):
U.S. trade va lue projections were completed in December 2015. For updates of the nearby year forecasts , see USDA's Outlook for U.S. Agricultural Trade report, publ i shed in February, May, August, and November.
3The category "high-va lue product exports" i s ca lculated as tota l exports less bulk commodities . The category includes semiprocessed and processed gra ins and oi l seeds , animals and animal products , horticul tura l products , and sugar and tropica l products .
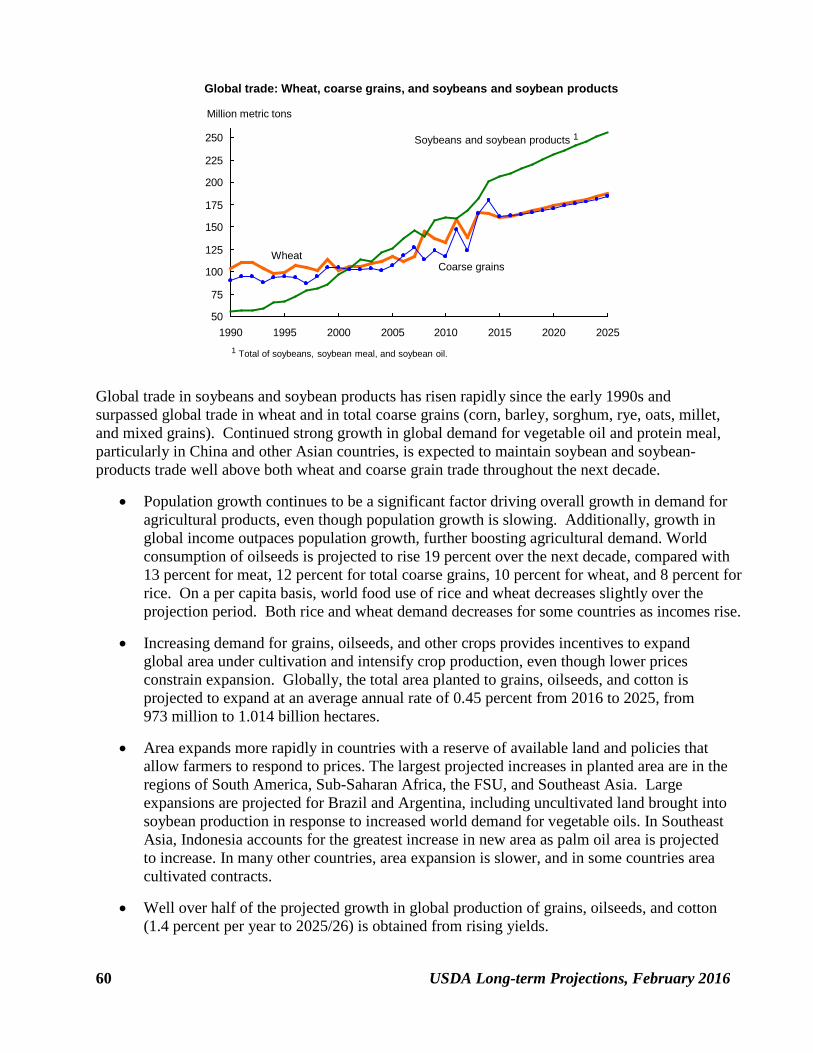
60 USDA Long-term Projections, February 2016
Global trade in soybeans and soybean products has risen rapidly since the early 1990s and surpassed global trade in wheat and in total coarse grains (corn, barley, sorghum, rye, oats, millet, and mixed grains). Continued strong growth in global demand for vegetable oil and protein meal, particularly in China and other Asian countries, is expected to maintain soybean and soybean-products trade well above both wheat and coarse grain trade throughout the next decade.
• Population growth continues to be a significant factor driving overall growth in demand for agricultural products, even though population growth is slowing. Additionally, growth in global income outpaces population growth, further boosting agricultural demand. World consumption of oilseeds is projected to rise 19 percent over the next decade, compared with 13 percent for meat, 12 percent for total coarse grains, 10 percent for wheat, and 8 percent for rice. On a per capita basis, world food use of rice and wheat decreases slightly over the projection period. Both rice and wheat demand decreases for some countries as incomes rise.
• Increasing demand for grains, oilseeds, and other crops provides incentives to expand global area under cultivation and intensify crop production, even though lower prices constrain expansion. Globally, the total area planted to grains, oilseeds, and cotton is projected to expand at an average annual rate of 0.45 percent from 2016 to 2025, from 973 million to 1.014 billion hectares.
• Area expands more rapidly in countries with a reserve of available land and policies that allow farmers to respond to prices. The largest projected increases in planted area are in the regions of South America, Sub-Saharan Africa, the FSU, and Southeast Asia. Large expansions are projected for Brazil and Argentina, including uncultivated land brought into soybean production in response to increased world demand for vegetable oils. In Southeast Asia, Indonesia accounts for the greatest increase in new area as palm oil area is projected to increase. In many other countries, area expansion is slower, and in some countries area cultivated contracts.
• Well over half of the projected growth in global production of grains, oilseeds, and cotton (1.4 percent per year to 2025/26) is obtained from rising yields.
50
75
100
125
150
175
200
225
250
1990 1995 2000 2005 2010 2015 2020 2025
Global trade: Wheat, coarse grains, and soybeans and soybean products
Million metric tons
Soybeans and soybean products 1
Coarse grainsWheat
1 Total of soybeans, soybean meal, and soybean oil.

USDA Long-term Projections, February 2016 61
World coarse grain trade is projected to increase by 21.7 million tons (13 percent) between 2016/17 and 2025/26. Expansion of livestock production in feed-deficit countries continues to be the main driver of growth in coarse grain imports. Key growth markets are Mexico, the rest of Latin America, Africa, the Middle East, and South East Asia. Corn is expected to gain a larger share (81 percent) of the world coarse grain trade by 2025/26, while barley’s share is expected to decrease slightly to 14 percent.
• China’s coarse grain imports are expected to gradually decline from high levels reached in 2014/15, due to lower sorghum and barley imports. Corn imports are expected to fall to 3 million tons in 2015/16 as authorities seek to reduce domestic inventories and expected to rebound to 6.3 million tons by 2025/26 as China’s feed demand grows and newly-announced initiatives curb corn production in erodible and drought-prone regions. High support prices for corn led to record-high corn inventories and prompted imports of sorghum and barley as substitutes for expensive domestic corn. Sorghum and barley imports are projected to fall as China aligns its high domestic prices with lower world prices.
• Together, Africa and the Middle East account for about 67 percent of the growth in world coarse grain imports through 2025/26, as rising incomes and populations foster strong demand growth for livestock products and limited arable land and water constrain domestic grain production. By 2025/26, this region will import 35 percent of world coarse grains imports.
• Growth in Mexico’s coarse grain imports represents almost one-fifth of the increase in global coarse grain trade during the coming decade. This reflects increased meat consumption and domestic production. As China’s sorghum imports increased, Mexico’s sorghum imports decreased in 2013/14 and 2014/15 due to high sorghum prices relative to corn. Mexico’s corn imports decreased in 2015/16 to 10.5 million tons and are projected to rise from 10.9 million tons in 2016/17 to 13.8 million tons in 2025/26.
• South and Southeast Asian and Oceania corn imports rise 31.5 percent to 15.7 million tons by 2025/26 in response to increased demand from livestock producers and transition to modern feed rations. These 3 regions account for 17 percent of the growth in world corn imports.
• Japan and South Korea are the first and third largest coarse grain importers. These two countries and Taiwan face environmental constraints to expanding livestock production, which limit potential growth in their coarse grain imports. These countries now account for about 20 percent of world coarse grain imports, but their share is projected to fall slightly.
0
20
40
60
80
100
120
140
160
180
1990 1995 2000 2005 2010 2015 2020 2025
Other
China & Hong Kong
Mexico
Africa & M. East
Latin America
EU
FSU & OE
East Asia
Global coarse grain imports
Million metric tons
1 Former Soviet Union and Other Europe; prior to 1999, includes Czech Republic, Estonia, Hungary, Latvia, Lithuania, Malta, Poland, Slovakia, and Slovenia.
1

62 USDA Long-term Projections, February 2016
U.S. corn exports are expected to increase by 9.5 million tons over the projection period, and reach 57.8 million tons in 2025/26. With the expansion of exporters by several countries, the U.S. share of world corn exports will increase slowly (from 38.1 to 38.9 percent) over the projection period, well below the 59 percent average share for the 2001/02 through 2010/11 period.
• Annual corn exports by the countries of the FSU, mostly Ukraine, rise by 3.3 million tons (17 percent) and reach 23.4 million tons in 2025/26. The region’s favorable resource endowments, increasing economic openness, wider use of hybrid seed, and greater investment in the agriculture sector all stimulate corn production. Although feed use of corn in the FSU countries rises rapidly in the projections, this region remains the world’s third-largest corn exporter, after the United States and Brazil.
• Argentina is the fourth largest corn exporter. Argentina’s corn production is projected to increase modestly, mostly through yield growth. Corn area is discouraged by the assumed continuation of quantitative export controls. Exports increase from 18.0 to 20.3 million tons from 2016/17 to 2025/26.
• Brazil’s annual corn exports have more than doubled since 2010/11 and averaged 25 million tons in the past 5 years. Production of second-crop corn following soybeans, much of which takes place in the State of Mato Grosso, continues with expansion onto new cropland. This growing region is not in a good location to meet domestic demand, so production tends to be exported when port capacity is not occupied by soybean shipments. Transportation costs constrain Brazil’s corn exports to some degree in the near term; however, exports increase during the later years of the period reflecting improved export infrastructure and moderately increasing world prices. Exports rise by 22 percent to 31.1 million tons by 2025/26.
• EU corn imports are projected to decline by 3.6 million tons to 8.4 million tons by 2025/26. Exports grow slowly and reach 2.5 million tons, by the end of the projection period, as the EU takes advantage of its lower transportation costs to parts of North Africa and the Middle East.
• Corn exports from the Other Europe region, mostly from Serbia to the EU, increase by 8 percent over the projection period and reach 2.6 million tons by 2025/26. South Africa corn exports increase by 14 percent and reach 1.6 million tons by 2025/26.
0
20
40
60
80
100
120
140
160
1990 1995 2000 2005 2010 2015 2020 2025
United States
FSU
Brazil
Argentina
EU
China
Other
Global corn exports
Million metric tons
1 Former Soviet Union.
1

USDA Long-term Projections, February 2016 63
World sorghum imports are expected to decrease by 18 percent during the coming decade as China’s recent surge in imports recedes. World sorghum imports trend downward from around 8.4 million tons in 2016/17 to 6.9 million tons by 2025/26. U.S. sorghum exports to China spiked in recent years as feed mills in China sought cheaper substitutes for expensive domestic corn. China’s imports are expected to fall in coming years as policies are revised to eliminate price distortions. Mexico becomes the largest sorghum importer by 2021/22. Mexico and Japan account for 52 percent of global imports by 2025/26.
• U.S. sorghum exports surged in 2013/14 due to China’s emergence as the leading importer, but exports are projected to decrease in 2016/17 to 5.1 million tons as China’s demand falls. Projected exports decrease to 3.8 million tons by 2021/22 and remain at that level through 2025/26.
• China’s sorghum imports significantly jumped in the past 3 years, but are projected to decrease from 7.0 million tons in 2015/16 to 4.4 million tons in 2016/17 and fall further to 1.0 million tons by 2025/26. The high price of corn in China that drove sorghum import demand falls toward parity with global prices as China phases out price support and reduces large corn inventories.
• Sorghum imports by Japan—currently the world’s second-largest importer—are projected to increase slightly from 1.0 million tons to 1.3 million tons over the next decade.
• Mexico’s sorghum imports increase over the projection period, after decreasing significantly the past couple of years when prices for alternative feed commodities, especially corn, were more competitive. China’s surging sorghum imports pushed sorghum prices up relative to corn prices and induced Mexico to shift imports from sorghum to corn. However, Mexico is expected to revert to its historical import pattern as China’s imports recede and prices are more favorable for sorghum imports. Mexico’s sorghum imports are projected to rise to 1.1 million tons in 2016/17 and reach 2.3 million tons by 2025/26.
• Argentina is expected to continue to be the world’s second-largest sorghum exporter during the coming decade. Argentina’s exports are projected to be stable near 1.9 to 2.0 million tons per year. Production of new sorghum varieties with lower tannin content enables Argentina to gain a slightly larger share of international trade. The primary markets for Argentine sorghum are Japan, Chile, Europe, and other countries in South America.
• Australia remains the world’s third largest sorghum exporter. Australia’s sorghum exports are projected to decrease slightly from 813,000 tons in 2016/17 to 592,000 tons by 2025/26.
0
2
4
6
8
10
12
14
1990 1995 2000 2005 2010 2015 2020 2025
China Mexico Other Sub-Saharan Africa Japan
Global sorghum imports
Million metric tons
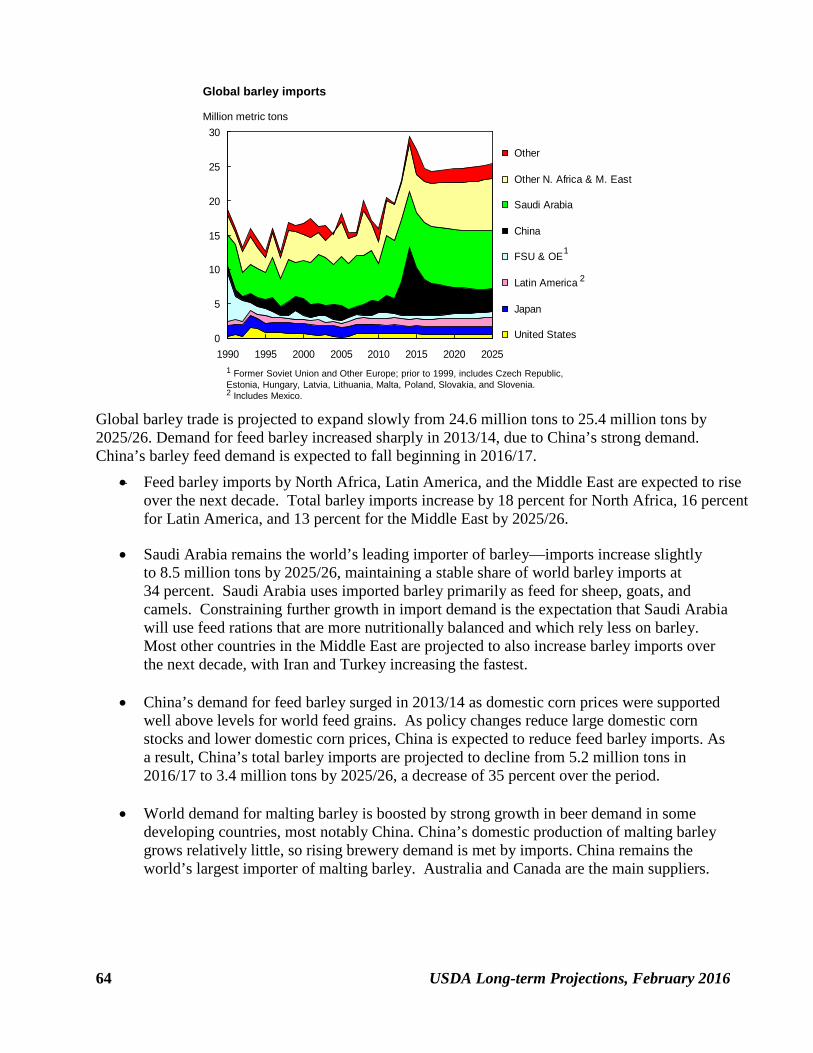
64 USDA Long-term Projections, February 2016
Global barley trade is projected to expand slowly from 24.6 million tons to 25.4 million tons by 2025/26. Demand for feed barley increased sharply in 2013/14, due to China’s strong demand. China’s barley feed demand is expected to fall beginning in 2016/17.
• Feed barley imports by North Africa, Latin America, and the Middle East are expected to rise over the next decade. Total barley imports increase by 18 percent for North Africa, 16 percent for Latin America, and 13 percent for the Middle East by 2025/26.
• Saudi Arabia remains the world’s leading importer of barley—imports increase slightly to 8.5 million tons by 2025/26, maintaining a stable share of world barley imports at 34 percent. Saudi Arabia uses imported barley primarily as feed for sheep, goats, and camels. Constraining further growth in import demand is the expectation that Saudi Arabia will use feed rations that are more nutritionally balanced and which rely less on barley. Most other countries in the Middle East are projected to also increase barley imports over the next decade, with Iran and Turkey increasing the fastest.
• China’s demand for feed barley surged in 2013/14 as domestic corn prices were supported
well above levels for world feed grains. As policy changes reduce large domestic corn stocks and lower domestic corn prices, China is expected to reduce feed barley imports. As a result, China’s total barley imports are projected to decline from 5.2 million tons in 2016/17 to 3.4 million tons by 2025/26, a decrease of 35 percent over the period.
• World demand for malting barley is boosted by strong growth in beer demand in some
developing countries, most notably China. China’s domestic production of malting barley grows relatively little, so rising brewery demand is met by imports. China remains the world’s largest importer of malting barley. Australia and Canada are the main suppliers.
0
5
10
15
20
25
30
1990 1995 2000 2005 2010 2015 2020 2025
Other
Other N. Africa & M. East
Saudi Arabia
China
FSU & OE
Latin America
Japan
United States
Global barley imports
Million metric tons
1 Former Soviet Union and Other Europe; prior to 1999, includes Czech Republic, Estonia, Hungary, Latvia, Lithuania, Malta, Poland, Slovakia, and Slovenia.2 Includes Mexico.
1
2

USDA Long-term Projections, February 2016 65
The EU and Australia are the largest barley exporters during the projection period, followed by Russia, Ukraine, and Argentina. Ukraine and Australia barley exports decrease slightly.
• EU’s barley exports for 2016/17 are projected at 5.9 million tons and are expected to increase to 6.5 million tons by the end of the projection period, in part due to increased barley demand from the Middle East and the EU’s logistical comparative advantage for this region.
• Australia’s barley exports are expected to decrease slightly during the coming decade to 5.9 million tons by 2025/26. The EU surpasses Australia as the world’s largest barley exporter in 2024/25.
• Argentina’s barley exports are projected to increase from 2 million tons in 2016/17 to 2.4 million tons by 2025/26. Barley area expansion occurred in the southern part of the country, and barley has been double-cropped with soybeans in the central region. Other South American countries and Saudi Arabia are the main buyers of Argentina’s feed barley. Argentine malting barley mostly is exported to Brazil and neighboring countries.
• Barley exports by the FSU countries are projected to remain around 8.2 million tons during the coming decade. Russia’s barley exports are projected at 3.7 million tons and Ukraine’s at 3.5 million tons by the end of the projection period. Kazakhstan is also expected to increase its exports, especially to Iran.
• Malting barley’s substantial price premium will continue to influence planting decisions in Canada and Australia, where malting barley’s share of total barley area is expected to rise during the next 10 years. However, Canada’s total barley area continues to decline as canola production increases in response to growing demand and higher profitability.
0
5
10
15
20
25
30
1990 1995 2000 2005 2010 2015 2020 2025
Other
FSU
Argentina
EU & OE
Canada
Australia
Global barley exports
Million metric tons
1 Former Soviet Union and Other Europe; prior to 1999, includes Czech Republic, Estonia, Hungary, Latvia, Lithuania, Malta, Poland, Slovakia, and Slovenia.
1

66 USDA Long-term Projections, February 2016
World wheat trade (including flour) is projected to expand by nearly 26 million tons (16 percent) between 2016/17 and 2025/26, reaching 187.3 million tons. Growth in wheat imports is concentrated in those developing countries where income and population gains drive increases in demand. The largest growth markets include other Sub-Saharan Africa countries, the 15 countries of the Economic Community of West African States, the Middle East, North Africa, Indonesia, the countries of the FSU, and Iraq.
• Almost no change in per capita wheat consumption is expected in many developing countries, but imports are projected to expand modestly due to population growth and limited potential to expand domestic wheat production. As incomes rise in Indonesia, Vietnam, and some other Asian countries, demand for instant noodles and bakery products continue to increase.
• Egypt and Indonesia remain the world’s leading wheat importers, with annual imports climbing to 12.6 million tons and 10.1 million tons, respectively, by 2025/26. Indonesian imports grow rapidly as increased consumption of non-traditional instant noodles, bread, cakes, and cookies continues. Brazil is the third largest wheat importing country at 7 million tons by 2025/26.
• Imports by China, Vietnam, Thailand, Bangladesh, and the Philippines are all projected to rise, collectively adding 3.6 million tons to imports by 2025/26, with a 2.4 percent annual growth rate. Imports are driven by rising incomes and populations, with greater diversified consumption due to urbanization and rising number of specialty food outlets. China has abundant wheat supplies overall, but its production of wheat suitable for use in bakery and specialty products falls short of demand for those types of wheat. China views wheat as critical to food security and limits imports using a quota. Imports by Japan, South Korea, and Taiwan remain stable, totaling about 11.1 million tons per year.
• Countries in Africa and the Middle East increase their wheat imports by 10.1 million and 4.6 million tons, respectively, by 2025/26, accounting for 57 percent of the total increase in world wheat trade. Only Morocco exhibits a small decrease in imports. Saudi Arabia is progressing toward a planned phase-out of wheat production due to water scarcity. Saudi Arabia’s annual imports are projected to increase to 4.5 million tons by 2025/26.
• Historically, India has been a large wheat importer in some years and a large exporter in others. From 2012/13 through 2014/15, India exported significant amounts of wheat, partially as a result of price-support policies and accumulation of government stocks. India is projected to be a net wheat exporter over the projection period, exporting about 800,000 tons annually while importing about 100,000 tons per year.
0
50
100
150
200
1990 1995 2000 2005 2010 2015 2020 2025
Other
Southeast Asia
Middle East
Other Africa
Egypt
NAFTA
Lat Am
EU, FSU, & OE
East Asia
Global wheat imports
Million metric tons
1 Africa, excluding Egypt. 2 European Union, former Soviet Union, and Other Europe. Includes intra-FSU trade.
1
2

USDA Long-term Projections, February 2016 67
Similar to the past decade, the five largest wheat exporters (the EU, United States, Canada, Russia, and Australia) are projected to account for 73 percent of world trade in 2025/26. The FSU region exhibits the fastest growth in world export share, rising from 12 percent in the late 1990s to 22 percent over the past decade to a projected 27 percent by 2025/26.
• U.S. wheat exports are projected to rise steadily from 24.5 million tons to 28 million tons during the coming decade. The U.S. share of world exports increases to 15.7 percent in 2017/18, recovering from three years of weak exports. For the remaining projection period the U.S. export share decreases slowly to 15 percent by 2025/26.
• Wheat exports from Russia, Ukraine, and Kazakhstan have been strong during the past five years and are projected to climb from 40 million tons in 2016/17 to 50.8 million tons by 2025/26, accounting for 42 percent of the projected increase in world wheat trade. Although not explicitly reflected in the projections, year-to-year volatility in FSU wheat production and trade is likely because of the impact of the region’s highly variable weather.
• Canada’s wheat exports grow from 21.1 million tons in 2016/17 to 23.5 million tons in 2025/26. Wheat production increases due to yield growth even as area declines slowly in response to more favorable returns for canola. Also, slower growth in food demand in Canada supports higher exports.
• Argentina’s wheat area largely remains unchanged, even though government policies (prior to the 2015 election) encouraging double cropping of barley have resulted in the shift of a small proportion of traditional wheat area into barley cultivation. Recent exports levels have modestly rebounded from the low levels of 2012/13 and 2013/14, and are expected to continue to rise throughout the projection period, from 6.3 million tons in 2016/17 to 7.3 million tons in 2025/26, but not reach previous higher levels of 12.9 million tons in 2011/12.
• The EU’s market share is projected to remain at 20 percent throughout the projection period. EU wheat exports are projected to reach 37.7 million tons by 2025/26 (1.5 percent annual growth rate) as less wheat is fed to livestock domestically due to relatively low feed grain prices.
0
50
100
150
200
1990 1995 2000 2005 2010 2015 2020 2025
Other
FSU & OE
EU
Australia
Argentina
Canada
United States
Global wheat exports
Million metric tons
1 Former Soviet Union and Other Europe; prior to 1999, includes Czech Republic, Estonia, Hungary, Latvia, Lithuania, Malta, Poland, Slovakia, and Slovenia.
1

68 USDA Long-term Projections, February 2016
Global rice trade is projected to grow at an annual rate of 1.9 percent from 2016/17 to 2025/26, and reach 50.7 million tons by the end of the projection period. This is an increase of almost 40 percent from the average over the previous decade. The main factors driving this expansion in trade are steady growth in demand—largely due to population and income growth in developing countries, mostly in Sub-Saharan Africa —and the inability of several key importing countries in Sub-Saharan Africa to boost production significantly. Since the early 1990s, world trade as a share of world consumption has risen from 4.0 percent to 8.5 percent. This upward trend is expected to continue, with the trade share of global consumption projected to reach 9.5 percent by 2025/26.
• China remains the largest rice importing country throughout the projection period. While China has adequate domestic supplies, its high prices attract imports of lower priced rice, primarily from Southeast Asia. Over the coming decade, China’s imports are projected to trend slowly downward, but remain historically large.
• In Africa and the Middle East, strong demand growth is driven by rapidly expanding income and population, while production growth is limited. In North Africa and the Middle East, production is primarily limited by climate. In Sub-Saharan Africa, production growth is constrained by infrastructure deficiencies and resource limitations. Altogether, the Africa and Middle East region accounts for 87 percent of the increase in world rice trade during the projections. Nigeria is the world’s second largest rice importing country.
• Saudi Arabia imports 1.77 million tons by 2025/26, while South Africa and Malaysia import more than 1 million tons. Saudi Arabia and South Africa—which do not grow rice—are expected to show strong consumption growth over the next decade. Malaysia’s production, consumption, and trade vary little over the next decade.
• After China and Nigeria, the next largest importers are Indonesia, Iran, Iraq, and the Philippines, each purchasing about 1.6 to 2.1 million tons a year by 2025/26. For all four countries, production growth cannot keep pace with rising use. Bangladesh’s annual imports rise rapidly from 640,000 tons in 2016/17 to almost 1.1 million tons in 2025/26, due to strong population growth and limited land for expanding area planted to rice.
• Japan, South Korea, and Taiwan maintain minimum market access import levels as mandated under the WTO Uruguay Round on Agriculture. In Canada and the United States, immigration continues to support slightly higher per capita consumption and modest import growth, with aromatics accounting for the bulk of U.S. imports.
0
10
20
30
40
50
1990 1995 2000 2005 2010 2015 2020 2025
Other
Other Asia & Oceania
China
Indonesia
Sub-Saharan Africa
N. Africa & M. East
EU, FSU, & OE
Latin America
Global rice imports
Million metric tons
1 European Union, former Soviet Union, and Other Europe. 2 Includes Mexico.
1
2

USDA Long-term Projections, February 2016 69
Asia continues to supply most of the world’s rice exports throughout the projection period. • Thailand and Vietnam, typically the world’s largest rice-exporting countries, account for more
than 40 percent of world rice exports and about 54 percent of the growth in world exports in the coming decade. In Thailand, increasing production and a drawdown of large stocks enable exports to rise 3.1 million tons, to 12.9 million by 2025/26. Vietnam’s exports expand 1.1 million tons, rising from 7.0 million tons to almost 8.1 million tons over the projection period. In both countries, per capita consumption declines as rising incomes support shifts from rice toward a more diversified diet with increasing meat consumption.
• India’s rice exports have historically been volatile, primarily due to government policies and fluctuating stock levels. In September 2011, the Indian Government eased a partial export ban on non-basmati rice, and exports jumped, making India the leading rice exporter for several years. India is projected to remain the second largest exporter during the projection period, with exports increasing by 1.4 million tons and reaching 10.5 million tons by 2025/26.
• Pakistan exported between 3 and 4 million tons of rice in recent years. Pakistan’s rising consumption and weak production growth result in reduced rice exports through the projection period, from 4.5 million tons in 2016/17 to 4.1 million tons in 2025/26. Pakistan maintains it current share of world rice exports and remains the world’s fourth largest rice exporter.
• The United States is the world’s fifth-largest rice exporter. Modest expansion in U.S. rice exports is projected, about 1.3 percent per year, due to a slight increase in area, improving yields, and slow growth in domestic use. The U.S. share of world rice exports is projected at about 8 percent during the coming decade. The United States exports both long-grain and medium- and short-grain rice.
• Burma and Cambodia are projected to increase rice production over the next decade, with rice exports of 2.7 million and 1.5 million tons, respectively, by 2025/26.
• Exports from South America—primarily Argentina, Brazil, Guyana, Paraguay, and Uruguay—expand over the next decade and account for almost 9 percent of global trade.
• Australia’s rice area is expected to recover from current drought-reduced levels, facilitating a slight expansion in rice exports beginning in 2017/18. Exports reach a projected 610,000 tons by 2025/26. Egypt’s rice exports slowly decline throughout the projection period, as domestic demand grows faster than production. Australia and Egypt export medium- and short-grain rice.
0
10
20
30
40
50
1990 1995 2000 2005 2010 2015 2020 2025
Other
Burma & Cambodia
India
China
Thailand
Vietnam
Pakistan
United States
South America
Global rice exports
Million metric tons

70 USDA Long-term Projections, February 2016
Increasing incomes and growing populations in developing countries, along with urbanization and development of modern food markets and outlets, are projected to boost demand for vegetable oils for food consumption and for protein meals used in livestock production. Global vegetable oil use for biodiesel production also is projected to increase, although at a slower pace than in recent years.
• China remains the predominant importer of soybeans, which are crushed domestically in order to meet robust domestic demand for both vegetable oil and oilseed meals for feed. China will also remain a significant importer of vegetable oils. India and China are the leading importers of palm oil from Indonesia and Malaysia. Indonesia will expand palm area for oil exports to meet demand for palm oil used in food and numerous consumer products by those countries.
• Many countries with increasing feed demand and limited opportunities to expand oilseed production have invested in crushing capacity. China is the most prominent example, but countries in North Africa, the Middle East, and South East Asia are seeing similar developments. As a result, import demand for oilseeds has grown rapidly, and this growth is projected to continue. During the next decade, global soybean trade is projected to increase by 22 percent, soybean meal trade by 20 percent, and soybean oil trade by 30 percent.
• Argentina, Brazil, and the United States maintain about 86 percent of the world’s aggregate exports of soybeans, soybean meal, and soybean oil throughout the projection.
• Brazil’s share of world exports of soybeans and soybean products climbs from 35 percent to 38 percent, as production expands faster than in any other soybean-exporting country.
• In Argentina, escalating production costs for grains and policy uncertainties are expected to cause farmers to keep more land in soybean production. Argentina’s share of world exports of soybeans and soybean products (mostly products) climbs to 24 percent.
• The U.S. share of global exports of soybeans and soybean products is projected to decline from 29 percent to 25 percent by 2025/26.
• The EU is expected to continue expanding its biodiesel production, but at a slower pace than in recent years. Production of rapeseed oil, the EU’s primary biodiesel feedstock, increases along with rapeseed production. EU’s projected imports of soybean meal and soybean oil are constant.
0
20
40
60
80
100
120
140
160
1990 1995 2000 2005 2010 2015 2020 20250
2
4
6
8
10
12
14
16
Global exports: Soybeans, soybean meal, and soybean oil
Soybeans and soybean meal, million metric tons
Soybeans
Soybean meal
Soybean oil
Soybean oil, million metric tons

USDA Long-term Projections, February 2016 71
World soybean trade is projected to rise rapidly during the next 10 years, climbing 29 million tons (22 percent) to 161 million tons. China increases soybean imports by 26.5 million tons by 2025/26.
• China’s soybean imports have risen sharply since the late 1990s and now account for about 63 percent of world soybean trade. China’s imports are projected to increase from 83 million in 2016/17 to 109.5 million tons in 2025/26, accounting for 91 percent of the increase in trade. The projections assume that China will continue to meet rising demand for vegetable oils and protein in feed by importing soybeans, while focusing domestic production on cereal grains to maintain food security. China continues to add oilseed crushing capacity that will further contribute to strong gains in soybean imports. Some surplus soybean meal will be exported to Asian countries.
• EU soybean imports declined over the past decade due to decreases in internal EU grain prices and increases in grain and rapeseed meal feeding. EU soybean imports are projected to remain around 13.7 million tons per year through the projection period.
• Imports of soybeans and soybean meal by East Asia (Japan, South Korea, and Taiwan) are influenced by a continuing shift from importing feedstuffs for domestic meat production to importing meat and other livestock products. The region’s projected soybean imports gradually decrease, but soybean meal imports increase due to slowly rising livestock production.
• Egypt is projected to increase soybean and soybean meal imports in an effort to improve feed efficiency and meet increased per capita demand for vegetable oils. Many other countries in the North Africa and Middle East region also have a limited ability to expand soybean production, so they increase imports to fill their growing feed and food needs.
• Mexico’s soybean imports are projected to increase 16 percent, to 4.8 million tons by 2025/26. These imports will support the production of soybean meal for the Mexican poultry and hog industries and soybean oil for domestic food consumption.
• Indonesian soybean imports increase by 22.6 percent to 2.9 million tons by 2025/26. In Indonesia, soybeans are used for food consumption in the form of tempeh and tofu. Indonesia has no crushing industry for soybeans, and imports all of the soybean meal that the country uses.
0
20
40
60
80
100
120
140
160
1990 1995 2000 2005 2010 2015 2020 2025
China
Other
N. Africa & Middle East
Latin America
East Asia
EU
Global soybean imports
Million metric tons
1 Includes Mexico.
1
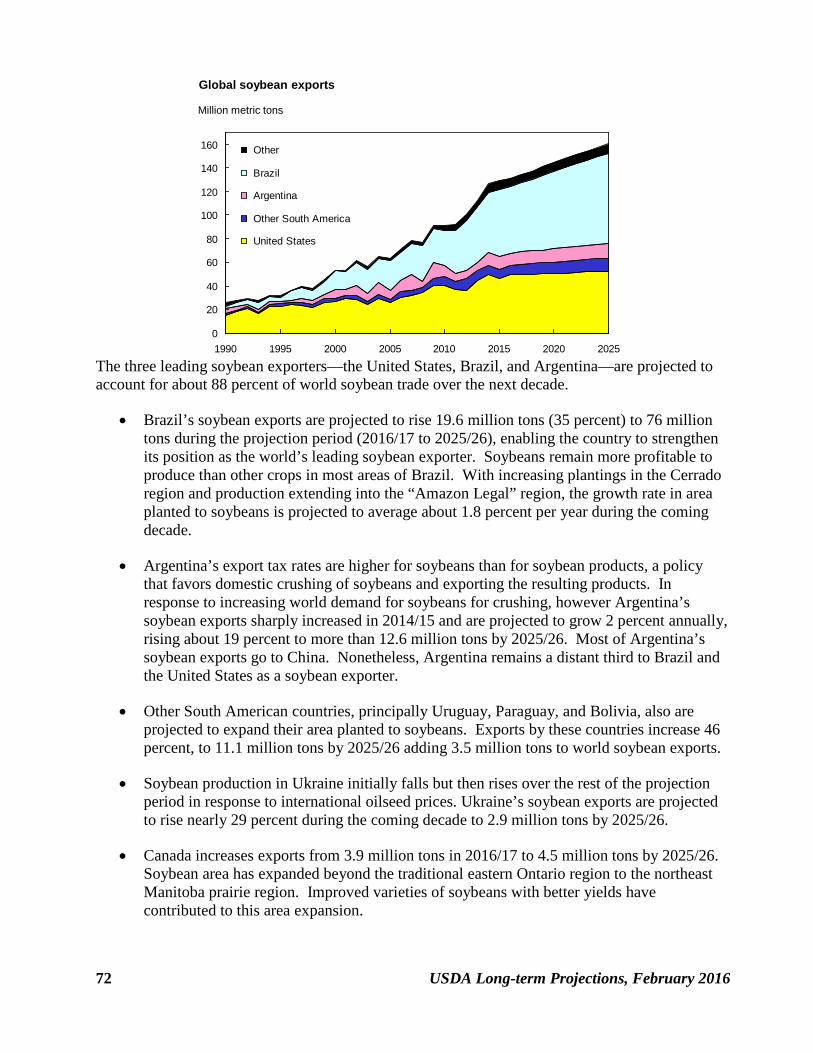
72 USDA Long-term Projections, February 2016
The three leading soybean exporters—the United States, Brazil, and Argentina—are projected to account for about 88 percent of world soybean trade over the next decade.
• Brazil’s soybean exports are projected to rise 19.6 million tons (35 percent) to 76 million tons during the projection period (2016/17 to 2025/26), enabling the country to strengthen its position as the world’s leading soybean exporter. Soybeans remain more profitable to produce than other crops in most areas of Brazil. With increasing plantings in the Cerrado region and production extending into the “Amazon Legal” region, the growth rate in area planted to soybeans is projected to average about 1.8 percent per year during the coming decade.
• Argentina’s export tax rates are higher for soybeans than for soybean products, a policy that favors domestic crushing of soybeans and exporting the resulting products. In response to increasing world demand for soybeans for crushing, however Argentina’s soybean exports sharply increased in 2014/15 and are projected to grow 2 percent annually, rising about 19 percent to more than 12.6 million tons by 2025/26. Most of Argentina’s soybean exports go to China. Nonetheless, Argentina remains a distant third to Brazil and the United States as a soybean exporter.
• Other South American countries, principally Uruguay, Paraguay, and Bolivia, also are projected to expand their area planted to soybeans. Exports by these countries increase 46 percent, to 11.1 million tons by 2025/26 adding 3.5 million tons to world soybean exports.
• Soybean production in Ukraine initially falls but then rises over the rest of the projection period in response to international oilseed prices. Ukraine’s soybean exports are projected to rise nearly 29 percent during the coming decade to 2.9 million tons by 2025/26.
• Canada increases exports from 3.9 million tons in 2016/17 to 4.5 million tons by 2025/26. Soybean area has expanded beyond the traditional eastern Ontario region to the northeast Manitoba prairie region. Improved varieties of soybeans with better yields have contributed to this area expansion.
0
20
40
60
80
100
120
140
160
1990 1995 2000 2005 2010 2015 2020 2025
Other
Brazil
Argentina
Other South America
United States
Global soybean exports
Million metric tons
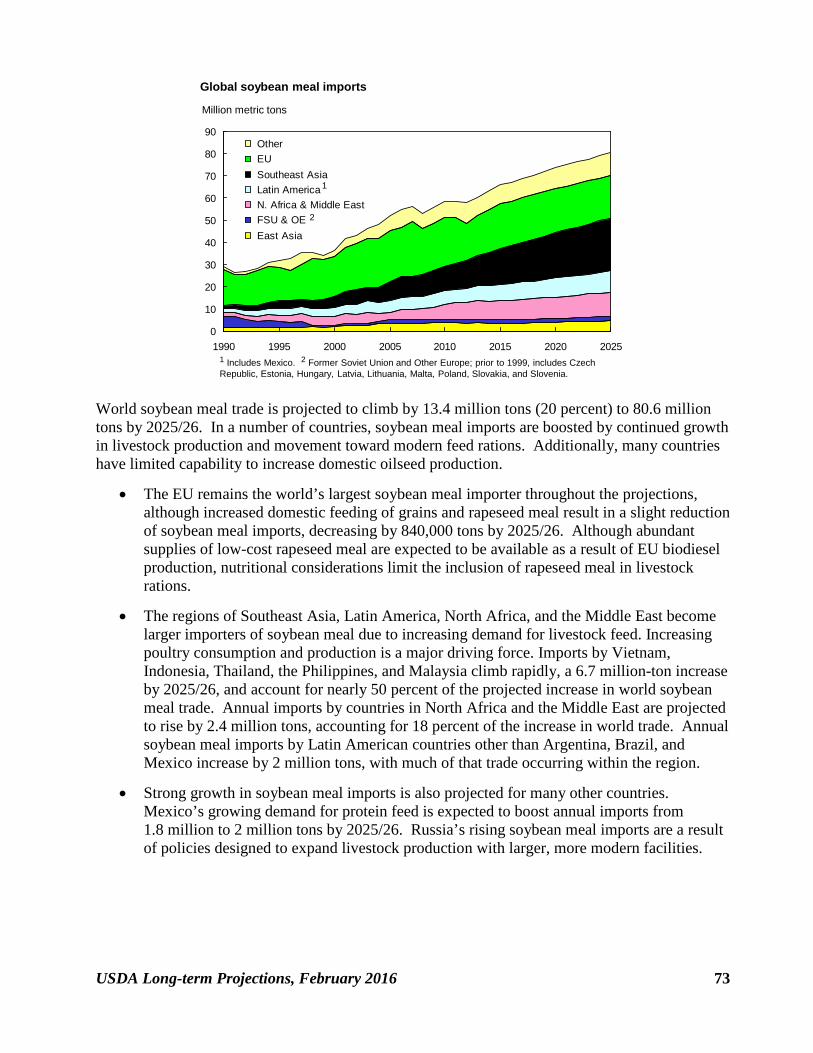
USDA Long-term Projections, February 2016 73
World soybean meal trade is projected to climb by 13.4 million tons (20 percent) to 80.6 million tons by 2025/26. In a number of countries, soybean meal imports are boosted by continued growth in livestock production and movement toward modern feed rations. Additionally, many countries have limited capability to increase domestic oilseed production.
• The EU remains the world’s largest soybean meal importer throughout the projections, although increased domestic feeding of grains and rapeseed meal result in a slight reduction of soybean meal imports, decreasing by 840,000 tons by 2025/26. Although abundant supplies of low-cost rapeseed meal are expected to be available as a result of EU biodiesel production, nutritional considerations limit the inclusion of rapeseed meal in livestock rations.
• The regions of Southeast Asia, Latin America, North Africa, and the Middle East become larger importers of soybean meal due to increasing demand for livestock feed. Increasing poultry consumption and production is a major driving force. Imports by Vietnam, Indonesia, Thailand, the Philippines, and Malaysia climb rapidly, a 6.7 million-ton increase by 2025/26, and account for nearly 50 percent of the projected increase in world soybean meal trade. Annual imports by countries in North Africa and the Middle East are projected to rise by 2.4 million tons, accounting for 18 percent of the increase in world trade. Annual soybean meal imports by Latin American countries other than Argentina, Brazil, and Mexico increase by 2 million tons, with much of that trade occurring within the region.
• Strong growth in soybean meal imports is also projected for many other countries. Mexico’s growing demand for protein feed is expected to boost annual imports from 1.8 million to 2 million tons by 2025/26. Russia’s rising soybean meal imports are a result of policies designed to expand livestock production with larger, more modern facilities.
0
10
20
30
40
50
60
70
80
90
1990 1995 2000 2005 2010 2015 2020 2025
Other EU Southeast Asia Latin America N. Africa & Middle East FSU & OE East Asia
Global soybean meal imports
Million metric tons
1 Includes Mexico. 2 Former Soviet Union and Other Europe; prior to 1999, includes Czech Republic, Estonia, Hungary, Latvia, Lithuania, Malta, Poland, Slovakia, and Slovenia.
1
2

74 USDA Long-term Projections, February 2016
Argentina, Brazil, and the United States remain the three largest exporters of soybean meal. Together, their share of world exports rises to 88 percent over the next 10 years. Argentina, the world’s largest soybean meal exporter, increases its share of the world market from about 46 percent in 2016/17 to 51 percent in 2025/26.
• Argentina has lower export taxes on soybean products than on soybeans, a policy that encouraged the development of a large oilseed-crushing capacity. With Argentina’s low costs of production for soybeans and its export incentives for soybean products, the country’s soybean meal exports are projected to continue their robust growth at 3.2 percent per year. Argentina’s annual soybean meal exports are projected to rise by almost 10 million tons over the next decade, reaching 40.9 million tons by 2025/26.
• In Brazil, the rapid expansion of poultry and pork production boosts domestic soybean meal consumption and limits increases in soybean meal exports. Nonetheless, exports of soybean meal increase by 4.6 million tons (31 percent) over the projected decade. Brazil’s soybean-crushing capacity is expected to expand at a slower rate due to strong competition from Argentina in the international soybean meal market. As a result, Brazil’s share of world soybean meal exports remains in the 22-24 percent range.
• U.S. soybean meal exports are projected to increase slightly to 10.7 million tons by 2025/26. The U.S. share of world soybean meal exports declines from 16 percent in 2016/17 to slightly more than 13 percent by 2025/26.
• India’s soybean meal exports are projected to decline as domestic use strengthens and export competition from South America intensifies. Exports recover to around 2.3 million tons in 2016/17, but decline to less than 1.0 million tons in 2025/26, as use for poultry, egg, and milk production grow more rapidly than India’s domestic soybean meal production.
• The EU continues to be a small but steady exporter of soybean meal to Russia and other Eastern European countries, where livestock production is expected to increase significantly. The EU’s annual soybean meal exports hold steady at 400,000 tons through 2025/26.
0
10
20
30
40
50
60
70
80
90
1990 1995 2000 2005 2010 2015 2020 2025
Other
Argentina
Brazil
United States
Global soybean meal exports
Million metric tons

USDA Long-term Projections, February 2016 75
World soybean oil imports are projected to climb by 3.3 million tons (30 percent) to 14.5 million tons over the 2016/17 to 2025/26 projection period, bolstered by rising food and industrial use. Growth in world soybean oil trade is expected to continue to be constrained by competition with palm oil, which is the leading vegetable oil traded internationally.
• Although palm oil continues to account for the largest share of India’s vegetable oil imports, India surpassed China in 2013/14 to become the world’s largest soybean oil importing country. In the projections, India’s soybean oil imports climb 39 percent to 3.9 million tons in 2025/26. Factors contributing to the continued growth of India’s soybean oil imports include burgeoning demand for vegetable oils and limited area for expanding oilseed production. Low yields, associated with variable rainfall and low input use, also inhibit growth of oilseed production.
• A rapid increase in China’s soybean imports for crushing in recent years caused soybean oil imports to decline to about 773,000 tons in 2014/15, but subsequently rebounded. These imports are projected to further rebound in 2016/17 and to rise gradually to 1.4 million tons by 2025/26.
• Income and population growth in North Africa, the Middle East, and Latin America contribute to gains in soybean oil demand and imports. Combined, North Africa and the Middle East is projected to remain the largest importing region, followed by Latin America, with the imports of these two regions climbing to 2.9 million and 2.8 million tons, respectively, by 2025/26.
0
2
4
6
8
10
12
14
1990 1995 2000 2005 2010 2015 2020 2025
Other N. Africa & Middle East China EU, FSU, & OE India Latin America Other Asia
Global soybean oil imports
Million metric tons
1 European Union, former Soviet Union, and Other Europe. 2 Includes Mexico. 3 Asia excluding India and China.
1
3
2
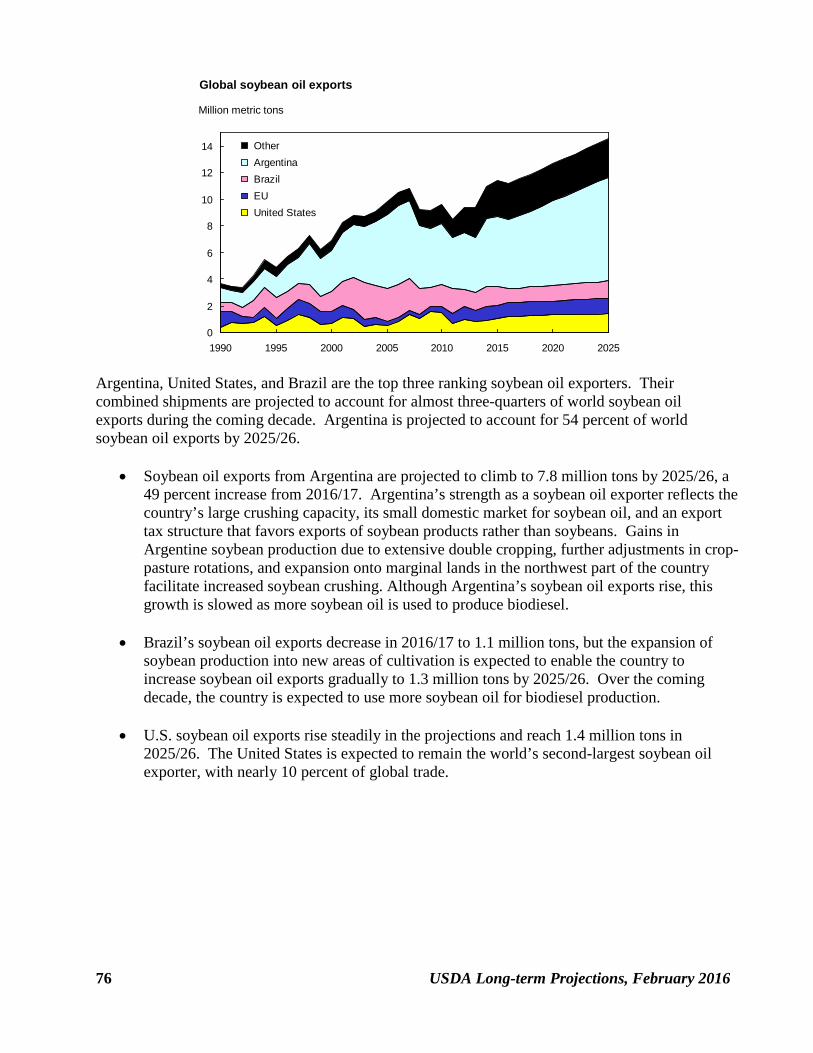
76 USDA Long-term Projections, February 2016
Argentina, United States, and Brazil are the top three ranking soybean oil exporters. Their combined shipments are projected to account for almost three-quarters of world soybean oil exports during the coming decade. Argentina is projected to account for 54 percent of world soybean oil exports by 2025/26.
• Soybean oil exports from Argentina are projected to climb to 7.8 million tons by 2025/26, a
49 percent increase from 2016/17. Argentina’s strength as a soybean oil exporter reflects the country’s large crushing capacity, its small domestic market for soybean oil, and an export tax structure that favors exports of soybean products rather than soybeans. Gains in Argentine soybean production due to extensive double cropping, further adjustments in crop-pasture rotations, and expansion onto marginal lands in the northwest part of the country facilitate increased soybean crushing. Although Argentina’s soybean oil exports rise, this growth is slowed as more soybean oil is used to produce biodiesel.
• Brazil’s soybean oil exports decrease in 2016/17 to 1.1 million tons, but the expansion of soybean production into new areas of cultivation is expected to enable the country to increase soybean oil exports gradually to 1.3 million tons by 2025/26. Over the coming decade, the country is expected to use more soybean oil for biodiesel production.
• U.S. soybean oil exports rise steadily in the projections and reach 1.4 million tons in 2025/26. The United States is expected to remain the world’s second-largest soybean oil exporter, with nearly 10 percent of global trade.
0
2
4
6
8
10
12
14
1990 1995 2000 2005 2010 2015 2020 2025
Other Argentina Brazil EU United States
Global soybean oil exports
Million metric tons

USDA Long-term Projections, February 2016 77
World cotton trade is projected to trend upward at a 3-percent annual growth rate between 2016/17 and 2025/26 as it recovers from a sharp decline during the period 2013/14-2015/16 that reflected reduced imports by China. World cotton trade rises throughout the decade as China’s trade policy evolves in response to changing levels of reserve stocks. World cotton trade is expected to reach 45.6 million bales in 2025/26, short of the record high of 46.4 million bales set in 2012/13.
• China’s cotton imports are expected to increase throughout the next decade, with stronger growth in the second half of the projection period. After a sharp decline in recent years, China’s cotton imports are expected to resume growth in 2017/18, with an average annual increase of 11.4 percent to 2025/26. China increases imports by about 9.4 million bales with imports at 15.2 million bales in 2025/26.
• In 2014, China eliminated its cotton price supports and began drawing down large cotton stocks. By allowing domestic cotton prices to fall, China is expected to recover part of the share of world cotton consumption it lost between 2009 and 2013. Some textile production shifted from China to other countries during those years. India, Pakistan, and Vietnam have been major beneficiaries of this shift. Bangladesh became the world’s second-largest cotton importer in 2010/11 and is projected to maintain this position as its textile industry continues growing rapidly.
• Vietnam, Indonesia and Turkey are expected to be the third-, fourth-, and fifth-largest cotton importers throughout the projection period. Vietnam’s cotton imports increased more than six fold over the past decade and are projected to account for 13 percent of the world’s increased imports to 2025/26. Vietnam’s textile sector and cotton imports are expected to grow 3 percent annually in the coming decade. Turkey’s share of world consumption has weakened recently, and imports are expected to decline slightly at 1.8 percent per year through the projection period.
• Indonesia surpasses Turkey to become the fourth largest cotton importer in the world in 2019/20. Indonesia’s imports are projected to grow at an annual average rate of 1.6 percent. Pakistan’s cotton imports are projected to decrease by more than half by 2025/26. Pakistan’s new Bacillus thuringiensis (Bt) cotton varieties specific to Pakistan’s cotton-growing conditions stimulate additional production.
0
10
20
30
40
50
60
1990 1995 2000 2005 2010 2015 2020 2025
Other China South Asia Southeast Asia EU, FSU, & OE Latin America East Asia
Global cotton imports
Million bales
1 Bangladesh, India, and Pakistan. 2 Malaysia, Indonesia, Philippines, Thailand, and Vietnam. 3 European Union, former Soviet Union, and Other Europe. 4 Includes Mexico.
12
34

78 USDA Long-term Projections, February 2016
Raw cotton production is expected to continue moving to countries with favorable resource endowments and advanced production technologies. Expanded cotton output is projected for traditional producers with large amounts of land suitable for cotton production, including the United States, Brazil, and Sub-Saharan Africa, as well as for the traditional low-cost producers and newly emergent exporter, India.
• The U.S. share of world cotton production has fallen sharply with the spread of new technology around the world—its share is expected to continue falling. Nonetheless, even with production lower than historical levels, the United States remains the world’s leading cotton exporter, rising marginally (0.9 percent annually) to 11 million bales by 2025/26. However, the U.S. share of world cotton trade fall to 24 percent by 2025/26, compared with 44 percent in 2008/09.
• India’s cotton exports grow by 3.5 percent annually, reaching 6.4 million bales in 2025/26. Improved yields in India, in part due to the adoption of Bt cotton, have raised India’s production and exports. Projected yield growth in India reflects continuing improvement in cultivation practices. But even with a 1.7-billion-bale increase in its output by 2025/26, India is expected to fall to being the world’s third largest cotton exporter.
• Area planted to cotton in Brazil is projected to expand. Brazil’s cotton exports are projected to increase by 3.7 million bales by 2025/26, corresponding to a 7.5-percent annual growth rate, which is the largest projected rate of growth among the world’s exporters. By 2021/22, Brazil overtakes India as the world’s second-ranking cotton exporter.
• Exports from the 15 countries of the Economic Community of West African States are projected to experience sustained growth in the next decade. Improvements in technical and financial infrastructure and the adoption of Bt cotton will help boost production and exports. Exports from the other countries in Sub-Saharan Africa also are projected to increase. In total, Sub-Saharan Africa is expected to account for about 16 to 17 percent of world trade, compared with 12 percent during 2010-14.
• Government policies in the major cotton-producing countries in the Central Asian FSU countries are promoting investment in textile industries and contributing to exports of textile products rather than exports of raw cotton. Lower grain prices will provide incentives to shift some land back to cotton in these countries, leading to a gradual increase in their cotton exports. Exports grow by 1.4 percent annually to 4 million bales by 2025/26, which is far below the peak exports of 7.3 million bales in 2005/06.
0
10
20
30
40
50
60
1990 1995 2000 2005 2010 2015 2020 2025
Other
India
South America
Australia
Sub-Saharan Africa
FSU
United States
Global cotton exports
Million bales
1 Former Soviet Union.
1

USDA Long-term Projections, February 2016 79
Growth in global meat consumption is projected to continue. Poultry consumption rises fastest, with a projected annual growth rate of 1.8 percent, while beef and pork each grow at a 0.9 percent rate. Increasing meat demand is driven primarily by rising incomes and population in developing countries, which typically lead to increased urbanization and diet diversification. Meat shipments by the major exporting countries rise by 2.3 percent per year, an increase of 5.7 million tons by 2025. Beef exports are projected to rise by 2.3 million tons (2.7 percent annually), pork exports by 1.2 million tons (1.8 percent annually), and poultry exports by 2.2 million tons (2.3 percent annually).
• India became the world’s largest beef exporter in 2014, following a half decade of rapid export growth. Demand in the developing countries for India’s lower priced beef is projected to continue rising rapidly. India’s annual beef exports increase by 651,000 tons from 2016 to 2025, an increase of 30 percent.
• Historically, Australia has been among the world’s largest beef exporters. Australia’s beef herd will move into the rebuilding phase in the projection period under the assumption of normal weather. Australia’s beef exports are projected to initially drop as herds are rebuilt and then increase to 1.7 million tons by 2025. Australia is the third-largest exporter after India and Brazil. Australia beef exports were surpassed by India’s exports in 2012. The United States remains the fourth-largest exporter of beef throughout the projection.
• Brazil’s beef exports increase by 4.2 percent annually, adding 806,000 tons by 2025. The projections assume no changes in Brazil’s foot-and-mouth-disease (FMD) status. Brazil’s pork exports are projected to rise 4.0 percent annually, remaining competitive in price-sensitive markets such as Russia, China, and Hong Kong. Brazil is projected to remain the largest exporter of poultry products due to competitive production costs, adding almost 1.3 million tons in poultry exports over the projection period, a 32 percent increase.
• Argentina’s beef production is projected to increase moderately over the next decade. Exports are expected to rise 5.3 percent annually, adding 158,000 tons by 2025.
• Canada’s cow herd contracted significantly in recent years but is projected to increase as producers rebuild herds in response to improved expected returns. With increased production, Canada’s beef exports are projected to gradually rise after 2016, but not surpass levels of the previous decade.
0
2
4
6
8
10
12
14
16
1990 1995 2000 2005 2010 2015 2020 2025
Meat exports 1
Million metric tons
1 Major exporters (see tables 36-38).
Beef and veal
Pork
Poultry

80 USDA Long-term Projections, February 2016
Between 2016 and 2025, beef imports by the major beef importing countries are projected to increase by 1.7 million tons, reaching 9.2 million tons in 2025. Exports of lower-priced beef from India and Brazil, mostly to low- and middle-income countries, account for almost two-thirds of the projected increase in exports by the major beef exporters.
• Russian beef imports are projected to decrease from 892,000 tons in 2016 to 771,000 tons by 2025. The United States and EU beef exports to Russia are expected to resume once the country lifts its import ban. After an initial rise, Russian beef imports fall over the projection period due to declining consumption and policies supporting beef production.
• Beef imports by China and Hong Kong combined are projected to increase almost 64 percent in the coming decade, increasing to almost 2 million tons by 2025, due to rising demand for beef which outpaces growth in production. This increase accounts for the largest growth in imports among major beef importing countries.
• Imports of grain-fed beef, mainly by higher-income countries, are projected to rise steadily. U.S. beef exports increase by 40 percent from 2016 to 2025, adding 442,000 tons.
• U.S. beef imports, primarily of grass-fed, lean beef for use in ground beef and processed products, rise slowly during the projection period. The United States is projected to remain the world’s largest beef importer, with beef imports up by 8.4 percent over the next decade.
• The Middle East and North Africa region, with fast population and income growth, is projected to increase beef imports from 1 million tons in 2016 to over 1.5 million by 2025, which is an average annual growth rate of 4.5 percent annually.
• Growth in Mexican beef imports is projected to resume in 2018. Much of Mexico’s imports consist of higher valued, grain-fed beef from the United States. Mexico’s beef imports will increase by 3.5 percent annually to about 224,000 tons by 2025.
• Countries of Southeast Asia maintain strong income growth, leading to a 35-percent increase in their beef imports from 2016 to 2025.
0
1
2
3
4
5
6
7
8
9
1990 1995 2000 2005 2010 2015 2020 2025
China
Hong Kong
Canada & Mexico
N. Africa & Middle East
United States
Russia
East Asia
EU
Million metric tons
Beef imports 1
1 Selected importers. 2 Japan, Korea, & Taiwan.
2

USDA Long-term Projections, February 2016 81
Imports by major pork importing countries are projected to continue to rise, increasing by slightly over 774,000 tons (15 percent) from 2016 to 2025. China and Mexico exhibit the strongest growth in pork imports over the projection period.
• China’s annual pork imports have risen sharply since 2009 and are projected to increase by about 34 percent from 2016 to 2025, to more than 1.1 million tons. China is projected to continue as the world’s third largest pork importer throughout the projection period. China and Hong Kong combined increase pork imports by about 400,000 tons over the decade.
• Japan is projected to be the largest pork importer through most of the next decade. However, Mexico surpasses Japan toward the end of the projection period. Increases in income and population are the primary drivers of Mexico’s increasing pork demand. Mexico became the second largest pork importer in 2014, surpassing Russia.
• Russia’s pork imports are assumed to not rebound following their ban on imports from some countries and are projected to decline steadily, falling 43 percent from 2016 to 2025. This decline partly reflects policies to stimulate domestic meat production and reduce reliance on imports.
• South Korea increases pork imports to satisfy demand for selected cuts, with imports rising by 12 percent over the projection period, adding 73,000 tons to annual pork imports. Japan’s imports decline 3.2 percent by 2025, due to an aging and declining population. By 2025, Japan’s annual pork imports have decreased by 40,000 tons.
• Increasing income and population growth drive strong pork import growth in Central America and the Caribbean. Imports rise at annual rate of 2.5 percent over the coming decade, increasing annual pork imports by 47,000 tons by 2025.
0
1
2
3
4
5
6
7
1990 1995 2000 2005 2010 2015 2020 2025
China Hong Kong Mexico Russia East Asia Australia United States
Million metric tons
1 Selected importers. 2 Japan, Korea, & Taiwan.
Pork imports 1
2

82 USDA Long-term Projections, February 2016
Annual poultry meat imports by the major importing countries are projected to increase by 2.5 million tons (29 percent) by 2025, reaching just over 11 million tons by 2025. Strong import growth is projected for much of the world, most notably Mexico and Saudi Arabia. However, Russia poultry imports decline and Japan and Canada have slow growth.
• Poultry meat imports by the regions of Africa and the Middle East are projected to grow by 46 percent and 31 percent, respectively, over the coming decade. By 2025, these regions combined increase their poultry meat imports by more than 1.5 million tons. Projected gains in income and population boost demand, while ongoing animal-disease concerns in a number of countries are expected to limit production growth, thus leading to increased imports.
• Rising projected incomes in Mexico and the Central America/Caribbean region lead to growing poultry meat demand and imports for those regions. Imported poultry products remain less expensive than beef or pork, further stimulating demand. Mexico’s poultry production continues to grow through the projection period, but at a slower rate than consumption, resulting in imports rising by about 402,000 tons (43 percent). Poultry imports by the Central America/Caribbean region rise by 258,000 tons (39 percent).
• Following the import ban imposed on some countries in 2014, Russia’s poultry imports fell and are projected to continue to fall steadily over the projection period to 104,000 tons, (20 percent decrease from 2016). The projections assume that Russian policies will stimulate domestic production, which will limit imports. Slower income growth will further inhibit growth in per capita poultry consumption.
• China’s rising consumption of poultry meat is met primarily by domestic production, with imports accounting for only about 2 percent of consumption. China’s poultry exports and imports increase by 8 percent and 13 percent, respectively, with the country being a net exporter through 2025.
• Fully cooked products are projected to account for most poultry exports from China and Thailand. With higher costs, these products tend to be marketed to higher income countries in Asia, Europe, and the Middle East. Thailand’s poultry meat exports to the EU and Japan are expected to rise because of the reopening of those markets to importing uncooked chicken from Thailand. Thailand poultry exports increase from 570,000 tons in 2016 to 823,000 tons by 2025.
01
23
45
67
89
1011
1990 1995 2000 2005 2010 2015 2020 2025
Russia
Other N Afr. & M. East
Sub-Saharan Africa
Mexico
Saudi Arabia
European Union
East Asia
Hong Kong
China
Poultry imports 1
Million metric tons
1 Selected importers.

USDA Long-term Projections, February 2016 83
Table 26. Coarse grains trade long-term projections2014/15 2015/16 2016/17 2017/18 2018/19 2019/20 2020/21 2021/22 2022/23 2023/24 2024/25 2025/26
Importers
Former Soviet Union1 0.8 0.8 0.9 0.9 1.0 1.0 1.0 1.1 1.1 1.1 1.2 1.2 Other Europe 0.8 0.9 0.9 0.9 0.9 1.0 1.0 1.0 1.0 1.0 1.0 1.0
European Union 9.0 16.4 12.3 11.3 11.0 10.6 10.3 10.1 9.9 9.6 9.2 8.8 Middle East 28.8 24.9 26.2 26.9 27.8 28.5 29.0 29.4 29.8 30.3 30.7 31.1 North Africa 18.8 18.3 19.4 19.9 20.5 21.2 21.8 22.2 22.9 23.4 24.1 24.7
Sub-Saharan Africa2 4.1 4.0 4.4 4.8 5.3 5.8 6.3 6.8 7.4 7.8 8.3 8.8 Japan 16.7 17.0 17.1 17.1 17.2 17.2 17.2 17.3 17.3 17.3 17.3 17.3 South Korea 10.3 10.1 10.1 10.2 10.3 10.4 10.5 10.5 10.6 10.7 10.7 10.7 Taiwan 4.3 4.4 4.4 4.4 4.4 4.3 4.4 4.3 4.3 4.3 4.3 4.2 China 25.7 17.3 13.1 11.6 11.1 10.8 10.5 10.5 10.5 10.7 10.9 11.1 Other Asia & Oceania 12.0 11.3 11.7 12.0 12.4 12.9 13.4 13.8 14.2 14.7 15.1 15.6 Mexico 11.5 11.2 12.3 13.1 13.5 13.9 14.2 14.6 15.0 15.4 15.9 16.4 Central America & Caribbean 5.7 5.8 5.9 6.0 6.1 6.2 6.2 6.3 6.4 6.5 6.6 6.7 Brazil 0.9 1.0 0.9 0.9 0.9 0.9 0.9 0.9 0.9 0.9 0.9 0.9 Other South America 11.8 11.8 12.3 12.6 13.0 13.3 13.7 14.1 14.4 14.7 15.2 15.7
Other foreign3 15.6 2.6 7.4 7.2 7.2 6.8 6.9 6.9 6.9 6.8 6.8 6.8
United States 3.4 3.2 3.1 3.1 3.1 3.1 3.1 3.1 3.1 3.1 3.1 3.1
Total trade 180.2 160.9 162.5 163.0 165.5 167.8 170.4 172.8 175.7 178.3 181.3 184.2
Exporters
European Union 14.0 9.8 8.5 8.2 8.3 8.6 8.7 8.8 8.9 9.0 9.2 9.4 Argentina 19.6 19.6 22.0 22.0 22.6 22.7 23.0 23.3 23.6 24.1 24.4 24.6 Australia 7.4 7.3 7.4 7.5 7.5 7.3 7.4 7.3 7.2 7.2 7.1 7.0 Brazil 31.0 25.0 25.4 25.7 26.1 26.7 27.4 28.5 29.2 29.8 30.6 31.1 Canada 3.8 3.7 3.9 4.0 3.9 3.9 3.8 3.8 3.9 3.9 3.9 3.9 South Africa 0.6 1.3 1.4 1.5 1.4 1.4 1.5 1.5 1.5 1.5 1.6 1.6 Other Europe 3.0 1.7 2.4 2.5 2.5 2.4 2.5 2.5 2.5 2.5 2.6 2.6 Russia 8.7 7.8 7.8 7.9 8.0 8.1 8.0 8.2 8.2 8.2 8.1 8.1 Ukraine 24.5 19.7 20.0 19.9 20.1 20.0 20.2 20.4 20.9 21.6 22.0 22.4
Other Former Soviet Union4 0.9 0.7 0.8 0.9 1.0 1.0 1.1 1.2 1.3 1.4 1.5 1.6 Other foreign 10.1 9.9 9.1 9.3 9.4 9.8 10.0 9.9 9.8 9.7 9.7 9.8
United States 56.7 54.3 53.7 53.7 54.7 55.9 57.0 57.5 58.8 59.4 60.7 62.0
Percent
U.S. trade share 31.4 33.7 33.1 32.9 33.1 33.3 33.5 33.3 33.5 33.3 33.5 33.61FSU-12. Includes intra-FSU trade.2Includes South Africa.3Includes unaccounted, which can be negative.4FSU-12 except for Russia and Ukraine. Includes intra-FSU trade.The projections were completed in November 2015.
Imports, million metric tons
Exports, million metric tons

84 USDA Long-term Projections, February 2016
Table 27. Corn trade long-term projections2014/15 2015/16 2016/17 2017/18 2018/19 2019/20 2020/21 2021/22 2022/23 2023/24 2024/25 2025/26
Importers
European Union 8.7 16.0 12.0 11.0 10.6 10.3 10.0 9.7 9.5 9.2 8.8 8.4 Former Soviet Union1 0.5 0.5 0.5 0.5 0.5 0.6 0.6 0.6 0.6 0.6 0.6 0.6 Egypt 7.8 8.0 8.4 8.6 9.0 9.5 9.9 10.1 10.5 10.8 11.2 11.5 Morocco 2.2 2.1 2.3 2.4 2.5 2.5 2.6 2.6 2.7 2.7 2.8 2.8 Other North Africa 6.1 6.1 6.3 6.4 6.5 6.6 6.7 6.8 7.0 7.1 7.3 7.5 Iran 6.2 4.5 5.1 5.4 5.8 6.0 6.2 6.3 6.5 6.7 6.9 7.0 Saudi Arabia 3.0 4.0 3.7 3.8 3.9 4.0 4.0 4.1 4.2 4.3 4.3 4.4 Turkey 2.2 0.9 1.0 1.1 1.3 1.3 1.3 1.3 1.4 1.4 1.4 1.4 Other Middle East 3.7 4.0 4.0 4.0 4.1 4.1 4.1 4.1 4.1 4.1 4.1 4.1 Japan 14.7 14.7 14.8 14.8 14.8 14.8 14.8 14.8 14.8 14.8 14.8 14.8 South Korea 10.2 10.0 10.0 10.1 10.2 10.3 10.4 10.4 10.5 10.5 10.6 10.6 Taiwan 4.2 4.3 4.3 4.3 4.2 4.2 4.2 4.2 4.2 4.1 4.1 4.1 China 5.5 3.0 3.2 3.5 3.9 4.2 4.5 4.8 5.2 5.6 5.9 6.3 Indonesia 3.2 3.0 3.2 3.4 3.5 3.6 3.7 3.8 3.9 4.0 4.1 4.1 Malaysia 3.4 3.6 3.7 3.8 3.9 3.9 4.0 4.1 4.2 4.3 4.4 4.5 Other Asia & Oceania 5.3 4.6 4.7 4.8 5.0 5.3 5.5 5.8 6.0 6.3 6.6 6.8 Canada 1.5 1.5 1.5 1.4 1.4 1.4 1.4 1.4 1.4 1.4 1.4 1.4 Mexico 11.3 10.5 10.9 11.2 11.4 11.7 12.0 12.3 12.6 13.0 13.4 13.8 Central America & Caribbean 5.7 5.8 5.9 6.0 6.1 6.2 6.2 6.3 6.4 6.5 6.6 6.7 Brazil 0.6 0.6 0.5 0.5 0.5 0.5 0.5 0.5 0.5 0.5 0.5 0.5 Other South America 10.9 11.0 11.3 11.5 11.8 12.1 12.5 12.8 13.1 13.3 13.8 14.2
Sub-Saharan Africa2 3.5 3.6 3.9 4.3 4.7 5.2 5.7 6.2 6.8 7.2 7.7 8.2
Other foreign3 14.8 -3.6 4.6 4.5 4.5 4.2 4.2 4.2 4.2 4.2 4.2 4.2
United States 0.8 0.8 0.8 0.8 0.8 0.8 0.8 0.8 0.8 0.8 0.8 0.8
Total trade 135.7 119.3 126.6 128.2 130.7 133.1 135.7 138.1 140.9 143.3 146.1 148.7
Exporters
European Union 4.0 1.0 2.3 2.3 2.3 2.4 2.4 2.4 2.4 2.5 2.5 2.5 Argentina 17.0 16.0 18.0 18.0 18.5 18.6 18.8 19.1 19.4 19.8 20.1 20.3 Brazil 31.0 25.0 25.4 25.7 26.0 26.7 27.4 28.4 29.2 29.8 30.6 31.1 South Africa 0.6 1.3 1.4 1.4 1.4 1.4 1.4 1.4 1.5 1.5 1.5 1.6 Other Europe 3.0 1.7 2.4 2.5 2.4 2.4 2.4 2.5 2.5 2.5 2.5 2.6 Former Soviet Union1 23.3 19.1 20.1 20.3 20.8 20.7 20.9 21.3 21.8 22.6 23.0 23.4 Other foreign 9.5 9.4 8.8 9.0 9.1 9.5 9.7 9.6 9.5 9.4 9.4 9.4
United States 47.4 45.7 48.3 48.9 50.2 51.4 52.7 53.3 54.6 55.2 56.5 57.8
Percent
U.S. trade share 34.9 38.3 38.1 38.2 38.4 38.6 38.8 38.6 38.8 38.6 38.7 38.91FSU-12. Includes intra-FSU trade. 2Includes South Africa.3Includes unaccounted, which can be negative.The projections were completed in November 2015.
Imports, million metric tons
Exports, million metric tons

USDA Long-term Projections, February 2016 85
Table 28. Sorghum trade long-term projections2014/15 2015/16 2016/17 2017/18 2018/19 2019/20 2020/21 2021/22 2022/23 2023/24 2024/25 2025/26
Importers Japan 0.9 1.0 1.0 1.0 1.1 1.1 1.1 1.2 1.2 1.2 1.3 1.3 Mexico 0.0 0.5 1.1 1.6 1.8 1.9 1.9 2.0 2.1 2.2 2.3 2.3 North Africa & Middle East 0.2 0.1 0.1 0.1 0.1 0.1 0.1 0.1 0.2 0.2 0.2 0.2 South America 0.2 0.2 0.4 0.5 0.5 0.5 0.5 0.6 0.6 0.6 0.6 0.6
Sub-Saharan Africa1 0.5 0.4 0.4 0.4 0.4 0.4 0.4 0.4 0.4 0.4 0.4 0.4 China 10.2 7.0 4.4 3.1 2.6 2.2 1.9 1.7 1.5 1.3 1.2 1.0
Other2 0.2 2.1 0.9 0.9 0.9 1.0 1.0 1.0 1.0 1.0 1.0 1.0
Total trade 12.1 11.2 8.4 7.7 7.4 7.2 7.1 7.0 6.9 6.9 6.9 6.9
Exporters Argentina 1.1 1.6 2.0 1.9 1.9 1.9 1.9 2.0 2.0 2.0 2.0 2.0 Australia 1.5 0.9 0.8 0.8 0.8 0.7 0.7 0.7 0.7 0.6 0.6 0.6 Other foreign 0.6 0.5 0.5 0.5 0.5 0.5 0.5 0.5 0.5 0.5 0.5 0.5
United States 9.0 8.3 5.1 4.4 4.2 4.1 3.9 3.8 3.8 3.8 3.8 3.8Percent
U.S. trade share 73.9 73.4 60.8 57.9 56.5 56.4 55.7 54.7 54.8 55.0 55.0 54.81Includes South Africa.2Includes unaccounted.The projections were completed in November 2015.
Imports, million metric tons
Exports, million metric tons
Table 29. Barley trade long-term projections2014/15 2015/16 2016/17 2017/18 2018/19 2019/20 2020/21 2021/22 2022/23 2023/24 2024/25 2025/26
Importers
Former Soviet Union1 0.4 0.3 0.3 0.4 0.4 0.4 0.4 0.5 0.5 0.5 0.6 0.6 Japan 1.1 1.2 1.2 1.2 1.2 1.2 1.2 1.2 1.2 1.2 1.2 1.2 China 9.9 7.0 5.2 4.7 4.4 4.1 3.8 3.7 3.5 3.4 3.4 3.4
Latin America2 1.2 1.1 1.1 1.2 1.2 1.2 1.3 1.3 1.3 1.3 1.3 1.3 Saudi Arabia 8.2 8.0 8.3 8.3 8.4 8.4 8.4 8.5 8.5 8.5 8.5 8.5 Iran 2.2 1.3 1.5 1.6 1.7 1.8 1.9 2.0 2.0 2.1 2.1 2.1 Other Middle East 2.2 2.1 2.2 2.3 2.3 2.4 2.4 2.5 2.5 2.5 2.6 2.6 Morocco 0.4 0.2 0.3 0.3 0.3 0.3 0.3 0.3 0.3 0.3 0.3 0.3 Other North Africa 2.2 1.8 2.0 2.1 2.1 2.1 2.2 2.2 2.3 2.3 2.4 2.4
Other foreign3 1.2 3.9 1.9 1.9 2.0 2.0 2.1 2.2 2.2 2.3 2.4 2.4
United States 0.5 0.5 0.4 0.4 0.4 0.4 0.4 0.4 0.4 0.4 0.4 0.4
Total trade 29.4 27.5 24.6 24.2 24.3 24.5 24.6 24.7 24.8 24.9 25.1 25.4
Exporters
European Union 9.5 8.5 5.9 5.5 5.6 5.8 5.8 5.9 6.0 6.1 6.3 6.5
Argentina 1.5 2.0 2.0 2.1 2.2 2.2 2.2 2.2 2.3 2.3 2.3 2.4 Australia 5.6 6.0 6.2 6.2 6.3 6.2 6.2 6.2 6.1 6.1 6.0 5.9 Canada 1.5 1.5 1.6 1.6 1.6 1.6 1.6 1.6 1.6 1.6 1.6 1.6 Russia 5.3 3.7 3.6 3.6 3.7 3.8 3.8 3.9 3.8 3.8 3.8 3.7 Ukraine 4.5 4.5 4.2 4.0 3.8 3.7 3.7 3.6 3.6 3.5 3.5 3.5
Other Former Soviet Union4 0.6 0.6 0.4 0.4 0.5 0.5 0.5 0.6 0.7 0.8 0.9 1.0 Turkey 0.0 0.0 0.1 0.0 0.0 0.1 0.1 0.1 0.1 0.1 0.1 0.1 Other foreign 0.6 0.5 0.3 0.3 0.3 0.3 0.3 0.3 0.3 0.3 0.3 0.3
United States 0.3 0.3 0.3 0.3 0.3 0.3 0.3 0.3 0.3 0.3 0.3 0.3
Percent
U.S. trade share 1.1 0.9 1.3 1.3 1.3 1.3 1.3 1.3 1.3 1.3 1.3 1.31FSU-12. Includes intra-FSU trade.2Includes Mexico.3Includes unaccounted.4FSU-12 except Russia and Ukraine. Includes intra-FSU trade.The projections were completed in November 2015.
Exports, million metric tons
Imports, million metric tons

86 USDA Long-term Projections, February 2016
Table 30. Wheat trade long-term projections2014/15 2015/16 2016/17 2017/18 2018/19 2019/20 2020/21 2021/22 2022/23 2023/24 2024/25 2025/26
Importers Morocco 4.1 2.8 3.8 3.8 3.8 3.8 3.8 3.8 3.8 3.8 3.7 3.7 Egypt 11.1 11.5 11.7 11.7 11.7 11.8 11.8 11.9 12.1 12.3 12.4 12.6 Other North Africa 10.0 11.3 10.6 10.7 10.8 10.9 11.1 11.1 11.3 11.4 11.4 11.5 Saudi Arabia 3.5 3.8 3.5 3.6 3.8 3.8 4.0 4.1 4.2 4.3 4.4 4.5 Iran 6.3 4.0 5.0 5.0 5.0 5.0 5.0 5.0 5.0 5.0 5.0 5.0 Iraq 2.3 3.2 3.2 3.3 3.5 3.6 3.8 3.9 4.1 4.3 4.5 4.6 Other Middle East 10.2 10.7 10.7 11.0 11.3 11.5 11.7 11.8 12.0 12.1 12.2 12.4 West African Community1 7.4 7.8 7.9 8.2 8.5 8.8 9.1 9.5 9.8 10.1 10.5 10.8
Other Sub-Saharan Africa2 13.2 14.4 14.7 15.4 16.0 16.6 17.1 17.7 18.3 18.9 19.5 20.1 Mexico 4.4 4.4 4.7 4.7 4.8 4.8 4.8 4.9 4.9 5.0 5.0 5.0 Central America & Caribbean 3.9 3.9 3.8 3.9 3.9 3.9 3.9 3.9 3.9 3.9 3.9 3.9 Brazil 5.4 6.3 6.7 6.7 6.8 6.9 6.9 6.9 7.0 7.0 7.0 7.0 Other South America 7.4 7.2 7.4 7.6 7.7 7.8 8.0 8.1 8.3 8.4 8.6 8.8
European Union 6.0 6.0 5.5 5.4 5.4 5.4 5.3 5.3 5.2 5.2 5.1 5.0 Other Europe 1.7 1.9 1.9 1.9 1.8 1.8 1.8 1.8 1.7 1.7 1.7 1.8
Former Soviet Union3 7.7 7.1 7.5 7.6 7.7 7.8 7.9 8.1 8.2 8.3 8.5 8.7 Japan 5.9 5.8 5.7 5.7 5.7 5.7 5.6 5.6 5.6 5.6 5.6 5.6 South Korea 3.9 4.2 4.0 4.0 4.0 4.1 4.1 4.1 4.1 4.1 4.1 4.1 Philippines 5.1 4.8 4.8 5.0 5.2 5.2 5.4 5.4 5.5 5.6 5.7 5.8 Indonesia 7.5 7.8 8.0 8.3 8.5 8.8 9.0 9.3 9.5 9.7 9.9 10.1 China 1.9 2.0 1.0 1.2 1.2 1.2 1.3 1.3 1.3 1.3 1.4 1.4 Bangladesh 3.8 3.6 3.5 3.6 3.7 3.8 3.9 4.0 4.1 4.2 4.3 4.4 Malaysia 1.5 1.6 1.6 1.7 1.7 1.7 1.8 1.8 1.8 1.9 1.9 1.9 Thailand 3.5 3.2 3.1 3.2 3.3 3.4 3.5 3.6 3.7 3.8 3.8 3.9 Vietnam 2.3 2.6 2.6 2.7 2.7 2.8 2.9 2.9 3.0 3.1 3.2 3.2 Other Asia & Oceania 8.2 8.1 7.6 7.8 8.0 8.1 8.3 8.4 8.6 8.7 8.9 9.0
Other foreign4 12.0 6.8 7.2 7.3 7.3 7.4 7.5 7.5 7.6 7.7 7.7 7.8
United States 4.1 3.4 3.4 3.5 3.7 3.8 3.9 4.1 4.2 4.3 4.5 4.6
Total trade 164.2 160.4 161.4 164.6 167.4 170.3 173.1 175.7 178.6 181.6 184.5 187.3
Exporters
European Union 35.4 33.5 33.0 33.5 34.3 34.9 35.4 35.8 36.3 36.7 37.3 37.7 Canada 24.1 20.0 21.1 21.3 21.4 21.6 22.0 22.3 22.7 22.9 23.2 23.5 Australia 16.6 18.0 19.0 18.9 19.2 19.4 19.5 19.6 19.6 19.6 19.7 19.7 Argentina 5.5 5.0 6.3 6.5 6.7 6.7 6.8 6.9 7.0 7.2 7.3 7.3 Russia 22.8 23.5 20.9 21.1 21.6 22.6 23.6 24.4 25.4 26.7 27.6 28.5 Ukraine 11.3 15.0 11.5 11.7 11.9 12.0 12.2 12.3 12.4 12.6 12.8 12.9
Other Former Soviet Union5 6.1 7.0 7.5 7.9 8.2 8.3 8.5 8.6 8.8 9.0 9.2 9.4 Other Europe 0.7 1.1 1.1 1.1 1.1 1.1 1.1 1.1 1.1 1.1 1.1 1.1 India 3.4 0.8 0.8 0.8 0.8 0.8 0.8 0.8 0.8 0.8 0.8 0.8 China 0.8 1.0 1.0 1.1 1.1 1.1 1.1 1.2 1.2 1.2 1.2 1.2 Turkey 4.1 4.0 4.4 4.5 4.6 4.6 4.7 4.8 4.9 5.0 5.0 5.1 Other foreign 10.2 9.8 10.2 10.3 10.5 10.7 10.8 11.0 11.2 11.4 11.6 11.9
United States 23.2 21.8 24.5 25.8 26.1 26.4 26.7 26.9 27.2 27.5 27.8 28.0
Percent
U.S. trade share 14.2 13.6 15.2 15.7 15.6 15.5 15.4 15.3 15.2 15.1 15.0 15.01Economic Community of West African States.2Includes South Africa.3FSU-12. Includes intra-FSU trade.4Includes unaccounted, which can be negative.5FSU-12 except for Russia and Ukraine. Includes intra-FSU trade.The projections were completed in November 2015.
Imports, million metric tons
Exports, million metric tons

USDA Long-term Projections, February 2016 87
Table 31. Rice trade long-term projections2014/15 2015/16 2016/17 2017/18 2018/19 2019/20 2020/21 2021/22 2022/23 2023/24 2024/25 2025/26
Importers Canada 0.35 0.36 0.36 0.37 0.37 0.37 0.38 0.38 0.39 0.39 0.39 0.40 Mexico 0.69 0.70 0.75 0.76 0.77 0.77 0.78 0.79 0.80 0.81 0.82 0.83 Central America/Caribbean 1.58 1.61 1.64 1.60 1.55 1.52 1.49 1.49 1.49 1.49 1.49 1.49 Brazil 0.45 0.70 0.70 0.70 0.70 0.70 0.70 0.70 0.70 0.70 0.70 0.70 Other South America 1.23 1.20 1.28 1.30 1.33 1.33 1.34 1.35 1.37 1.39 1.40 1.42 European Union 1.71 1.50 1.61 1.60 1.60 1.59 1.59 1.59 1.59 1.59 1.58 1.58 Former Soviet Union1 0.42 0.48 0.43 0.40 0.40 0.39 0.38 0.38 0.39 0.39 0.40 0.40 Other Europe 0.13 0.13 0.12 0.13 0.13 0.13 0.13 0.13 0.14 0.14 0.14 0.14 Bangladesh 1.22 0.60 0.64 0.69 0.74 0.80 0.86 0.91 0.96 1.00 1.05 1.10 China 4.32 4.70 4.57 4.57 4.50 4.46 4.32 4.25 4.22 4.13 4.10 4.06 Japan 0.65 0.70 0.70 0.70 0.70 0.70 0.70 0.70 0.70 0.70 0.70 0.70 South Korea 0.47 0.41 0.41 0.41 0.41 0.41 0.41 0.41 0.41 0.41 0.41 0.41 Indonesia 1.40 1.60 1.60 1.65 1.70 1.75 1.77 1.80 1.86 1.94 2.04 2.14 Malaysia 0.95 1.00 1.03 1.03 1.04 1.04 1.04 1.05 1.05 1.06 1.06 1.07 Philippines 1.80 1.70 1.57 1.58 1.54 1.56 1.53 1.57 1.57 1.57 1.59 1.61 Other Asia & Oceania 2.99 2.36 2.31 2.31 2.30 2.30 2.30 2.30 2.32 2.33 2.34 2.35 Iraq 1.10 1.20 1.22 1.26 1.31 1.35 1.39 1.44 1.48 1.53 1.58 1.64 Iran 1.40 1.60 1.56 1.56 1.60 1.64 1.68 1.74 1.79 1.84 1.89 1.94 Saudi Arabia 1.46 1.55 1.53 1.55 1.58 1.61 1.63 1.66 1.69 1.72 1.75 1.77 Other N. Africa & M. East 2.69 2.73 2.83 2.89 2.95 3.01 3.07 3.12 3.17 3.22 3.26 3.31 West African Community2 9.45 7.92 8.87 9.28 9.70 9.95 10.27 10.49 10.80 11.17 11.49 11.80 Other Sub-Saharan Africa3 2.75 2.80 2.88 3.01 3.22 3.50 3.92 4.25 4.43 4.66 4.85 5.05 South Africa 0.98 0.95 0.99 1.03 1.06 1.08 1.11 1.13 1.16 1.18 1.21 1.23 Other foreign4 1.84 2.04 2.32 2.34 2.36 2.38 2.41 2.43 2.45 2.47 2.49 2.52
United States 0.78 0.81 0.83 0.84 0.86 0.87 0.89 0.91 0.93 0.94 0.96 0.98
Total imports 42.81 41.33 42.74 43.56 44.39 45.23 46.08 46.97 47.85 48.77 49.70 50.65
Exporters Australia 0.37 0.33 0.32 0.37 0.43 0.49 0.51 0.52 0.54 0.56 0.58 0.61 Argentina 0.40 0.48 0.49 0.52 0.54 0.55 0.56 0.58 0.59 0.61 0.62 0.63 Other South America 3.09 3.12 3.30 3.42 3.51 3.63 3.70 3.79 3.87 3.94 4.02 4.10 European Union 0.27 0.26 0.26 0.26 0.26 0.26 0.26 0.26 0.26 0.26 0.26 0.26 China 0.43 0.40 0.43 0.40 0.37 0.37 0.40 0.42 0.41 0.39 0.39 0.40 India 11.80 9.00 9.13 9.28 9.52 9.63 9.74 9.87 10.01 10.17 10.34 10.50 Pakistan 4.00 4.50 4.45 4.41 4.33 4.23 4.18 4.18 4.16 4.14 4.12 4.10 Thailand 9.00 9.50 9.75 10.00 10.35 10.68 11.08 11.45 11.80 12.15 12.50 12.90 Vietnam 6.20 7.00 6.97 7.05 7.15 7.30 7.40 7.50 7.62 7.77 7.93 8.08 Burma 2.00 1.80 2.19 2.24 2.28 2.32 2.38 2.42 2.48 2.54 2.60 2.65 Cambodia 1.10 0.80 0.95 1.02 1.05 1.10 1.18 1.25 1.31 1.37 1.42 1.47 Egypt 0.25 0.40 0.38 0.37 0.32 0.31 0.30 0.29 0.28 0.27 0.27 0.26 Other foreign 0.70 0.63 0.63 0.65 0.66 0.68 0.69 0.70 0.72 0.73 0.74 0.75
United States 3.21 3.11 3.49 3.57 3.64 3.67 3.70 3.75 3.81 3.86 3.91 3.94
Total exports 42.81 41.33 42.74 43.56 44.39 45.23 46.08 46.97 47.85 48.77 49.70 50.65Percent
U.S. trade share 7.5 7.5 8.2 8.2 8.2 8.1 8.0 8.0 8.0 7.9 7.9 7.81FSU-12. Includes intra-FSU trade. 2Economic Community of West African States.3Excludes South Africa.4Includes unaccounted.The projections were completed in November 2015.
Imports, million metric tons
Exports, million metric tons

88 USDA Long-term Projections, February 2016
Table 32. Soybean trade long-term projections2014/15 2015/16 2016/17 2017/18 2018/19 2019/20 2020/21 2021/22 2022/23 2023/24 2024/25 2025/26
Importers European Union 13.6 13.7 13.7 13.7 13.7 13.7 13.7 13.8 13.7 13.7 13.7 13.7 Japan 3.0 2.9 2.8 2.8 2.8 2.7 2.7 2.6 2.6 2.6 2.5 2.5 South Korea 1.2 1.3 1.3 1.3 1.3 1.3 1.3 1.3 1.3 1.3 1.4 1.4 Taiwan 2.4 2.4 2.4 2.4 2.4 2.4 2.4 2.4 2.4 2.4 2.4 2.4 Mexico 4.0 4.1 4.1 4.2 4.3 4.3 4.4 4.5 4.5 4.6 4.7 4.8 Former Soviet Union1 2.0 2.1 2.0 2.0 1.9 1.9 1.8 1.8 1.7 1.6 1.6 1.5 N. Africa & Middle East 5.7 6.0 6.3 6.4 6.5 6.6 6.7 6.8 6.9 7.0 7.1 7.3 China 78.4 80.5 83.0 86.2 88.4 92.0 95.0 97.9 101.1 103.8 106.5 109.5 Malaysia 0.6 0.6 0.6 0.6 0.6 0.7 0.7 0.7 0.7 0.7 0.7 0.7 Indonesia 2.1 2.3 2.4 2.5 2.5 2.6 2.6 2.7 2.7 2.8 2.9 2.9 Other 13.8 13.2 12.9 13.1 13.2 13.4 13.5 13.6 13.8 13.9 14.1 14.2
Total imports 126.6 129.1 131.5 135.1 137.7 141.5 144.8 148.1 151.6 154.5 157.5 160.7
Exporters Argentina 10.6 10.8 10.6 10.6 10.9 11.2 11.4 11.6 11.9 12.1 12.3 12.6 Brazil 51.1 57.0 56.7 59.3 60.7 63.6 65.8 68.2 70.6 72.3 74.2 76.4 Other South America 7.5 7.8 7.6 8.3 8.6 8.9 9.3 9.6 10.0 10.4 10.7 11.1 Ukraine 2.4 2.0 2.2 2.3 2.4 2.4 2.5 2.5 2.6 2.7 2.8 2.9 Other foreign 4.8 4.9 4.6 4.7 4.7 4.8 4.9 5.0 5.1 5.2 5.3 5.4
United States 50.2 46.7 49.7 49.9 50.3 50.6 50.9 51.0 51.3 51.8 52.1 52.4
Total exports 126.6 129.1 131.5 135.1 137.7 141.5 144.8 148.1 151.6 154.5 157.5 160.7
Percent
U.S. trade share 39.6 36.2 37.8 37.0 36.6 35.8 35.1 34.5 33.8 33.6 33.1 32.61FSU-12. Includes intra-FSU trade.The projections were completed in November 2015.
Imports, million metric tons
Exports, million metric tons

USDA Long-term Projections, February 2016 89
Table 33. Soybean meal trade long-term projections2014/15 2015/16 2016/17 2017/18 2018/19 2019/20 2020/21 2021/22 2022/23 2023/24 2024/25 2025/26
Importers
European Union 19.7 20.3 20.2 20.1 20.0 19.9 19.9 19.8 19.6 19.5 19.5 19.4
Former Soviet Union1 1.1 1.2 1.1 1.1 1.1 1.2 1.2 1.3 1.3 1.4 1.5 1.5 Other Europe 0.5 0.5 0.5 0.5 0.5 0.5 0.5 0.5 0.5 0.5 0.5 0.5 Canada 1.0 1.1 1.0 1.0 1.0 1.0 1.1 1.1 1.1 1.1 1.1 1.1 Japan 1.7 1.9 1.9 1.9 2.0 2.0 2.1 2.2 2.2 2.3 2.3 2.4 Southeast Asia 15.0 16.3 17.1 18.1 18.9 19.6 20.4 21.1 21.8 22.4 23.1 23.8 Mexico 1.7 1.9 1.8 1.8 1.9 1.9 1.9 1.9 2.0 2.0 2.0 2.0 Other Latin America 7.2 7.4 7.6 7.8 8.0 8.2 8.5 8.7 8.9 9.1 9.3 9.6 North Africa & Middle East 8.1 8.4 8.6 8.9 9.1 9.4 9.7 9.9 10.2 10.4 10.7 10.9 Other 7.8 7.4 7.4 7.6 7.9 8.1 8.3 8.5 8.7 8.9 9.1 9.3
Total imports 63.6 66.2 67.2 68.8 70.4 71.9 73.5 74.9 76.3 77.7 79.2 80.6
Exporters Argentina 28.5 30.6 30.9 32.9 34.0 35.3 36.6 37.4 38.2 39.0 40.0 40.9 Brazil 14.4 15.6 15.0 15.1 15.8 16.1 16.6 17.2 17.8 18.4 19.0 19.6 Other South America 4.1 4.5 4.6 4.7 4.7 4.8 4.8 4.9 4.9 5.0 5.0 5.1 China 1.6 1.9 1.9 1.8 1.8 1.8 1.8 1.7 1.7 1.7 1.6 1.6 India 1.1 0.7 2.3 2.1 1.9 1.7 1.4 1.3 1.2 1.1 1.0 0.9
European Union 0.4 0.4 0.4 0.4 0.4 0.4 0.4 0.4 0.4 0.4 0.4 0.4 Other foreign 1.7 1.7 1.5 1.5 1.5 1.5 1.5 1.5 1.5 1.5 1.5 1.5
United States 11.9 10.8 10.6 10.3 10.3 10.4 10.4 10.5 10.5 10.6 10.6 10.7
Total exports 63.6 66.2 67.2 68.8 70.4 71.9 73.5 74.9 76.3 77.7 79.2 80.6
Percent
U.S. trade share 18.7 16.3 15.7 15.0 14.7 14.4 14.2 14.0 13.8 13.6 13.4 13.21FSU-12. Includes intra-FSU trade. The projections were completed in November 2015.
Imports, million metric tons
Exports, million metric tons
Table 34. Soybean oil trade long-term projections
2014/15 2015/16 2016/17 2017/18 2018/19 2019/20 2020/21 2021/22 2022/23 2023/24 2024/25 2025/26
Importers China 0.8 0.9 1.0 1.0 1.0 1.1 1.2 1.2 1.3 1.3 1.4 1.4 India 2.8 3.2 2.8 3.0 3.1 3.2 3.3 3.4 3.5 3.7 3.8 3.9 Other Asia & Oceania 1.4 1.4 1.5 1.5 1.6 1.6 1.7 1.7 1.8 1.9 1.9 2.0 Latin America 2.1 2.2 2.2 2.3 2.3 2.4 2.5 2.5 2.6 2.6 2.7 2.8 North Africa & Middle East 2.2 2.2 2.3 2.4 2.4 2.5 2.5 2.6 2.7 2.8 2.8 2.9 European Union 0.3 0.2 0.3 0.3 0.3 0.3 0.3 0.3 0.3 0.3 0.3 0.3 Other 1.4 1.5 1.1 1.1 1.1 1.2 1.2 1.2 1.3 1.3 1.3 1.3
Total imports 11.0 11.4 11.2 11.5 11.8 12.2 12.6 13.0 13.4 13.8 14.2 14.5
Exporters Argentina 5.1 5.4 5.2 5.5 5.7 6.0 6.3 6.6 6.9 7.2 7.5 7.8 Brazil 1.5 1.4 1.1 1.0 1.1 1.1 1.2 1.2 1.2 1.3 1.3 1.3 European Union 1.0 1.0 1.0 1.1 1.1 1.1 1.1 1.1 1.1 1.1 1.1 1.1 Other foreign 2.4 2.6 2.7 2.7 2.8 2.8 2.8 2.8 2.8 2.8 2.8 2.9
United States 0.9 1.0 1.2 1.2 1.2 1.3 1.3 1.3 1.3 1.4 1.4 1.4
Total exports 11.0 11.4 11.2 11.5 11.8 12.2 12.6 13.0 13.4 13.8 14.2 14.5
Percent
U.S. trade share 8.3 9.2 10.5 10.5 10.4 10.4 10.2 10.1 10.0 9.9 9.8 9.7
The projections were completed in November 2015.
Imports, million metric tons
Exports, million metric tons

90 USDA Long-term Projections, February 2016
Table 35. All cotton trade long-term projections2014/15 2015/16 2016/17 2017/18 2018/19 2019/20 2020/21 2021/22 2022/23 2023/24 2024/25 2025/26
Importers European Union 0.9 0.9 0.8 0.8 0.8 0.8 0.8 0.8 0.7 0.7 0.7 0.7
Former Soviet Union1 0.4 0.4 0.4 0.4 0.4 0.4 0.4 0.4 0.3 0.3 0.3 0.3 Mexico 0.8 1.0 1.0 0.9 0.9 0.8 0.8 0.6 0.6 0.5 0.4 0.4 Japan 0.3 0.3 0.3 0.3 0.3 0.3 0.3 0.3 0.3 0.2 0.2 0.2 South Korea 1.3 1.3 1.3 1.3 1.3 1.3 1.3 1.3 1.3 1.3 1.3 1.3 China 8.3 5.7 5.7 6.4 6.5 6.9 7.9 9.7 11.0 12.5 13.7 15.2 Indonesia 3.3 3.1 3.3 3.3 3.4 3.4 3.4 3.5 3.6 3.6 3.7 3.8 Vietnam 4.4 4.9 4.9 4.9 5.1 5.3 5.5 5.6 5.8 5.9 6.1 6.3 Thailand 1.5 1.5 1.4 1.4 1.4 1.3 1.3 1.2 1.2 1.2 1.2 1.1 Pakistan 0.8 1.3 1.5 1.2 1.0 0.9 0.9 0.8 0.8 0.7 0.7 0.6 India 1.2 1.0 1.1 1.1 1.1 1.1 1.1 1.1 1.1 1.2 1.2 1.2 Bangladesh 5.4 5.6 5.7 5.8 6.1 6.3 6.5 6.7 6.9 7.1 7.3 7.6 Taiwan 0.9 0.9 0.9 0.8 0.8 0.8 0.8 0.8 0.7 0.7 0.7 0.7 Other Asia & Oceania 0.5 0.5 0.5 0.5 0.5 0.5 0.5 0.4 0.4 0.4 0.5 0.5 Turkey 3.7 3.8 3.7 3.5 3.4 3.4 3.3 3.3 3.2 3.2 3.2 3.1 Other 1.6 2.4 2.5 2.4 2.4 2.4 2.4 2.4 2.5 2.5 2.6 2.6
Total imports 35.3 34.4 34.8 35.0 35.4 35.8 37.0 38.9 40.5 42.3 43.9 45.6
Exporters
Former Soviet Union1 4.7 3.9 3.5 3.5 3.4 3.4 3.5 3.6 3.7 3.8 3.9 4.0 Australia 2.4 2.5 3.0 3.3 3.4 3.4 3.5 3.7 3.8 3.9 4.1 4.2 Argentina 0.4 0.4 0.4 0.4 0.4 0.4 0.4 0.5 0.5 0.5 0.5 0.6 Brazil 3.9 4.0 4.0 3.8 4.1 4.3 4.7 5.5 6.1 6.6 7.1 7.7 Other Latin America 0.2 0.2 0.2 0.2 0.2 0.2 0.2 0.2 0.2 0.2 0.2 0.2 Pakistan 0.5 0.5 0.5 0.5 0.6 0.6 0.6 0.7 0.7 0.8 0.8 0.9 India 4.2 4.4 4.7 4.7 4.6 4.7 4.8 5.2 5.5 5.9 6.1 6.4 Egypt 0.2 0.2 0.2 0.2 0.2 0.2 0.2 0.2 0.2 0.2 0.2 0.2 West African Community2 3.7 4.2 4.2 4.2 4.2 4.3 4.5 4.6 4.8 5.1 5.3 5.5 Other Sub-Saharan Africa3 1.6 1.8 1.7 1.7 1.7 1.7 1.7 1.8 1.8 1.9 2.0 2.0 Other foreign 2.4 2.1 2.2 2.2 2.2 2.2 2.3 2.4 2.5 2.6 2.8 3.0
United States 11.2 10.2 10.2 10.3 10.4 10.5 10.6 10.6 10.7 10.8 10.9 11.0
Total exports 35.3 34.4 34.8 35.0 35.4 35.8 37.0 38.9 40.5 42.3 43.9 45.6
Percent
U.S. trade share 31.8 29.7 29.3 29.4 29.5 29.2 28.6 27.3 26.5 25.6 24.9 24.21FSU-12. Includes intra-FSU trade.2Economic Community of West African States.3Includes South Africa.The projections were completed in November 2015.
Imports, million bales
Exports, million bales

USDA Long-term Projections, February 2016 91
Table 36. Beef trade long-term projections2014 2015 2016 2017 2018 2019 2020 2021 2022 2023 2024 2025
Importers Japan 739 740 741 742 742 743 744 745 746 747 749 750 South Korea 392 400 454 462 472 476 482 491 504 515 526 538 Taiwan 138 130 123 131 135 138 141 144 147 150 152 155 Philippines 165 150 160 166 170 173 179 185 191 196 201 207 China 417 600 700 802 853 909 951 1,005 1,049 1,102 1,143 1,190 Hong Kong 646 450 500 539 570 590 621 652 684 717 745 773 Other Asia 409 454 480 517 540 557 578 598 624 647 668 691 European Union 372 370 370 372 363 360 357 354 351 347 344 341 Russia 929 700 892 878 864 850 836 823 810 797 784 771 Other Europe 109 114 118 121 124 126 127 129 130 130 130 131 Egypt 270 270 285 320 331 348 360 375 392 406 420 434 Other N. Africa & M. East 750 738 785 837 887 933 979 1,026 1,074 1,116 1,153 1,195 Mexico 206 165 165 152 159 162 177 185 198 208 218 224 Canada 284 290 295 301 302 298 296 296 298 301 303 303
United States 1,337 1,557 1,381 1,338 1,349 1,361 1,383 1,406 1,429 1,451 1,474 1,497
Major importers 7,163 7,128 7,449 7,676 7,860 8,024 8,212 8,414 8,626 8,831 9,011 9,200
Exporters Australia 1,851 1,815 1,625 1,512 1,501 1,553 1,585 1,597 1,625 1,650 1,680 1,704 New Zealand 579 590 598 601 605 609 613 618 621 625 627 629 India 2,082 2,000 2,175 2,272 2,350 2,408 2,469 2,531 2,592 2,667 2,742 2,826 Other Asia 179 183 199 213 223 237 249 252 257 261 266 272 European Union 300 300 310 306 309 312 314 315 319 318 324 324 Argentina 197 230 265 381 384 396 405 416 418 420 419 423 Brazil 1,909 1,625 1,800 1,971 2,130 2,187 2,241 2,284 2,353 2,435 2,518 2,606 Canada 378 375 374 383 393 395 400 400 407 411 419 429
United States 1,167 1,008 1,100 1,134 1,202 1,270 1,327 1,383 1,429 1,474 1,508 1,542
Major exporters 8,642 8,126 8,446 8,771 9,097 9,367 9,601 9,796 10,022 10,260 10,503 10,754The projections were completed in November 2015.
Imports, thousand metric tons, carcass weight
Exports, thousand metric tons, carcass weight

92 USDA Long-term Projections, February 2016
Table 37. Pork trade long-term projections2014 2015 2016 2017 2018 2019 2020 2021 2022 2023 2024 2025
Importers Japan 1,332 1,270 1,250 1,245 1,240 1,235 1,230 1,225 1,220 1,215 1,215 1,210 China 761 845 850 895 921 947 986 1,023 1,050 1,083 1,114 1,139 Hong Kong 347 380 400 420 427 439 450 460 471 483 494 505 South Korea 480 600 625 635 644 654 662 672 677 684 691 698 Russia 515 300 200 180 162 154 146 139 132 125 119 113 Mexico 818 920 960 1,000 1,030 1,061 1,093 1,126 1,159 1,194 1,230 1,269 Central America/Caribbean 147 171 189 210 213 216 218 220 224 227 231 236 Canada 214 220 210 209 213 218 223 228 233 237 242 246
United States 457 502 454 460 465 469 474 479 483 488 492 497
Major importers 5,071 5,208 5,138 5,254 5,314 5,393 5,482 5,573 5,648 5,735 5,828 5,912
Exporters Brazil 556 565 580 624 645 671 696 720 745 772 801 829 Canada 1,218 1,210 1,210 1,222 1,234 1,247 1,259 1,272 1,284 1,297 1,310 1,323 Mexico 117 130 150 154 158 162 166 171 175 179 184 188 European Union 2,166 2,350 2,330 2,365 2,398 2,430 2,454 2,482 2,506 2,533 2,554 2,582 China 277 250 250 253 260 264 273 279 285 292 298 305
United States 2,203 2,266 2,370 2,415 2,472 2,529 2,585 2,631 2,676 2,727 2,778 2,835
Major exporters 6,537 6,771 6,890 7,033 7,168 7,303 7,433 7,554 7,672 7,801 7,924 8,062 The projections were completed in November 2015.
Imports, thousand metric tons, carcass weight
Exports, thousand metric tons, carcass weight
Table 38. Poultry trade long-term projections1
2014 2015 2016 2017 2018 2019 2020 2021 2022 2023 2024 2025
Importers Russia 470 260 130 127 126 124 121 116 111 108 106 104 European Union 772 811 823 839 851 861 867 878 889 898 906 914 Canada 158 168 178 179 181 183 184 186 188 190 192 193 Mexico 872 932 944 999 1,043 1,096 1,139 1,183 1,232 1,270 1,311 1,346 Central America/Caribbean 543 611 656 693 717 747 776 804 831 858 887 914 Japan 889 901 876 889 908 914 919 917 918 917 915 911 Hong Kong 303 363 382 395 404 412 421 429 437 444 451 458 China 282 284 294 299 305 312 318 321 323 326 329 331 South Korea 141 115 135 140 145 149 152 157 161 165 168 171 Saudi Arabia 815 943 895 920 945 974 999 1,026 1,053 1,081 1,109 1,134 Other Middle East 1,427 1,432 1,503 1,579 1,632 1,691 1,732 1,792 1,837 1,890 1,944 1,997 North Africa 83 87 92 99 117 136 154 169 181 188 193 196 West African Community2 426 455 487 521 549 574 597 625 651 675 698 719 Other Sub-Saharan Africa 1,142 1,095 1,166 1,226 1,276 1,341 1,391 1,448 1,495 1,541 1,589 1,632
Major importers 8,323 8,457 8,561 8,905 9,198 9,512 9,771 10,049 10,307 10,549 10,797 11,021
Exporters European Union 1,268 1,267 1,303 1,293 1,291 1,294 1,292 1,289 1,289 1,293 1,300 1,305 Brazil 3,678 3,937 4,085 4,188 4,300 4,445 4,571 4,712 4,854 5,024 5,214 5,393 China 430 395 375 334 329 329 335 346 358 370 386 404 Thailand 546 580 570 575 598 626 658 693 724 756 791 823
United States 3,677 3,158 3,499 3,683 3,775 3,849 3,924 3,980 4,018 4,050 4,080 4,095
Major exporters 9,599 9,337 9,832 10,074 10,294 10,542 10,780 11,019 11,243 11,493 11,771 12,0201Broilers and turkeys only.2Economic Community of West African States.The projections were completed in November 2015.
Imports, thousand metric tons, ready to cook
Exports, thousand metric tons, ready to cook

USDA Long-term Projections, February 2016 93
List of Tables Page
Table 1. U.S. macroeconomic assumptions ........................................................................................... 16 Table 2. Global real GDP growth assumptions ..................................................................................... 17 Table 3. Population growth assumptions ............................................................................................... 18 Table 4. Acreage for major field crops and Conservation Reserve Program assumptions ................... 28 Table 5. U.S. corn long-term projections .............................................................................................. 29 Table 6. U.S. sorghum long-term projections ....................................................................................... 30 Table 7. U.S. barley long-term projections ........................................................................................... 31 Table 8. U.S. oats long-term projections ............................................................................................... 32 Table 9. U.S. wheat long-term projections ............................................................................................ 33 Table 10. U.S. soybeans and products, long-term projections ................................................................ 34 Table 11. U.S. rice long-term projections, total rice, rough basis ........................................................... 35 Table 12. U.S. rice long-term projections, long-grain rice, rough basis .................................................. 36 Table 13. U.S. rice long-term projections, medium- and short-grain rice, rough basis........................... 36 Table 14. U.S. upland cotton long-term projections................................................................................ 37 Table 15. U.S. sugar long-term projections ............................................................................................. 38 Table 16. Fruit, nuts, and vegetables long-term projections.................................................................... 38 Table 17. Per capita meat consumption, retail weight ............................................................................ 44 Table 18. Beef long-term projections ..................................................................................................... 44 Table 19. Pork long-term projections ...................................................................................................... 45 Table 20. Young chicken long-term projections ..................................................................................... 45 Table 21. Turkey long-term projections .................................................................................................. 46 Table 22. Egg long-term projections ....................................................................................................... 46 Table 23. Dairy long-term projections .................................................................................................... 47 Table 24. Farm receipts, expenses, and income, long-term projections .................................................. 52 Table 25. U.S. agricultural trade long-term projections, fiscal years ...................................................... 59 Table 26. Coarse grains trade long-term projections ............................................................................... 83 Table 27. Corn trade long-term projections............................................................................................. 84 Table 28. Sorghum trade long-term projections ...................................................................................... 85 Table 29. Barley trade long-term projections .......................................................................................... 85 Table 30. Wheat trade long-term projections .......................................................................................... 86 Table 31. Rice trade long-term projections ............................................................................................. 87 Table 32. Soybean trade long-term projections ....................................................................................... 88 Table 33. Soybean meal trade long-term projections .............................................................................. 89 Table 34. Soybean oil trade long-term projections.................................................................................. 89 Table 35. All cotton trade long-term projections .................................................................................... 90 Table 36. Beef trade long-term projections ............................................................................................. 91 Table 37. Pork trade long-term projections ............................................................................................. 92 Table 38. Poultry trade long-term projections ......................................................................................... 92


![Population Projections - States by Age, Sex, Race, … Projections - States by Age, Sex, Race, and Hispanic Origin: 1995 to 2025 (PPL47) 4/25/2012 4:14:40 PM] Population Projections](https://static.fdocuments.us/doc/165x107/5aca22077f8b9acb7c8e0687/population-projections-states-by-age-sex-race-projections-states-by-age.jpg)