USD 1.00 = 515.86 CRC (as of August 2006)
77
Transcript of USD 1.00 = 515.86 CRC (as of August 2006)


The following foreign exchange rates are applied in the Project: USD 1.00 = 116.91 JPY (as of August 2006) USD 1.00 = 515.86 CRC (as of August 2006) ※ CRC: Costa Rica Colon

PREFACE
In response to the request from the Government of the Republic of Costa Rica, the
Government of Japan decided to conduct the Study on Capacity Development in Bridge
Rehabilitation Planning, Maintenance and Management based on 29 Bridges of National
Highway Network and entrusted to study to the Japan International Cooperation Agency
(JICA).
JICA selected and dispatched a study team headed by Dr. Masaaki TATSUMI of Oriental
Consultants Co., Ltd. and consist of Oriental Consultants Co., Ltd. in association with
Chodai Co., Ltd. to Costa Rica, between September 2005 and January 2007.
The team held discussions with the officials concerned of the Government of Costa Rica and
conducted the technical assistance for Capacity Development in bridge maintenance and
rehabilitation as well as reinforcement and rehabilitation design for 10 selected bridges at
the study area. Upon returning to Japan, the team conducted further studies and prepared
this final report in February 2007.
I hope that this report will contribute to develop their capacity in bridge maintenance and
rehabilitation of Costa Rica, and to the enhancement of friendly relationship between our
two countries.
Finally, I wish to express my sincere appreciation to the officials concerned of the
Government of Costa Rica for their close cooperation extended to the study.
February 2007
Kazuhisa MATSUOKA
Vice President
Japan International Cooperation Agency
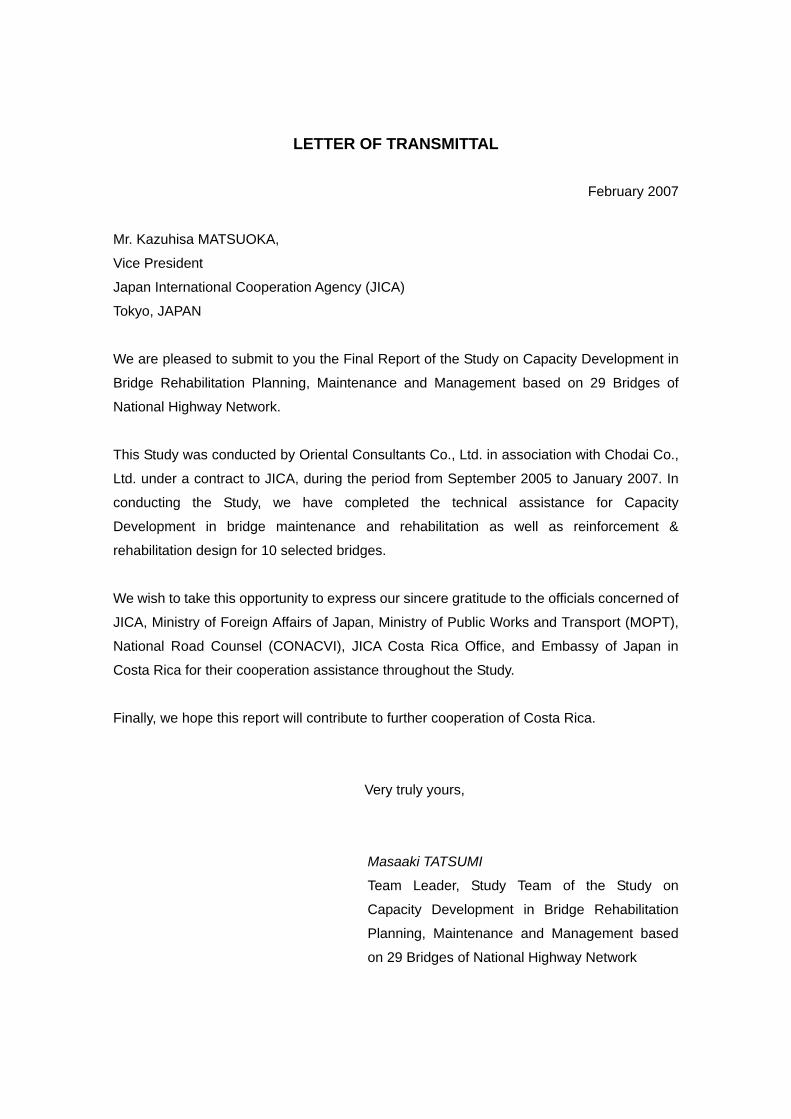
LETTER OF TRANSMITTAL
February 2007
Mr. Kazuhisa MATSUOKA,
Vice President
Japan International Cooperation Agency (JICA)
Tokyo, JAPAN
We are pleased to submit to you the Final Report of the Study on Capacity Development in
Bridge Rehabilitation Planning, Maintenance and Management based on 29 Bridges of
National Highway Network.
This Study was conducted by Oriental Consultants Co., Ltd. in association with Chodai Co.,
Ltd. under a contract to JICA, during the period from September 2005 to January 2007. In
conducting the Study, we have completed the technical assistance for Capacity
Development in bridge maintenance and rehabilitation as well as reinforcement &
rehabilitation design for 10 selected bridges.
We wish to take this opportunity to express our sincere gratitude to the officials concerned of
JICA, Ministry of Foreign Affairs of Japan, Ministry of Public Works and Transport (MOPT),
National Road Counsel (CONACVI), JICA Costa Rica Office, and Embassy of Japan in
Costa Rica for their cooperation assistance throughout the Study.
Finally, we hope this report will contribute to further cooperation of Costa Rica.
Very truly yours,
Masaaki TATSUMI
Team Leader, Study Team of the Study on
Capacity Development in Bridge Rehabilitation
Planning, Maintenance and Management based
on 29 Bridges of National Highway Network

Project Location Map
1
32
2
4
Caribbean Sea
Pacific Ocean
Republic of Costa Rica
20 1
2 3
4 5 6 7
8
910
12
14
16
1718
2122232425 26
27
28
Project Bridge : 29 BridgeRoute1 : 8 Bridge Route2 : 8 Bridge Route4 : 3 Bridge Route32 : 9 Bridge Route218 : 1 Bridge
Route2
Route1
Route4
Route32 Route218 San José
19
11
15
13
29
29 targeted bridges Location
Nicaragua
Panama
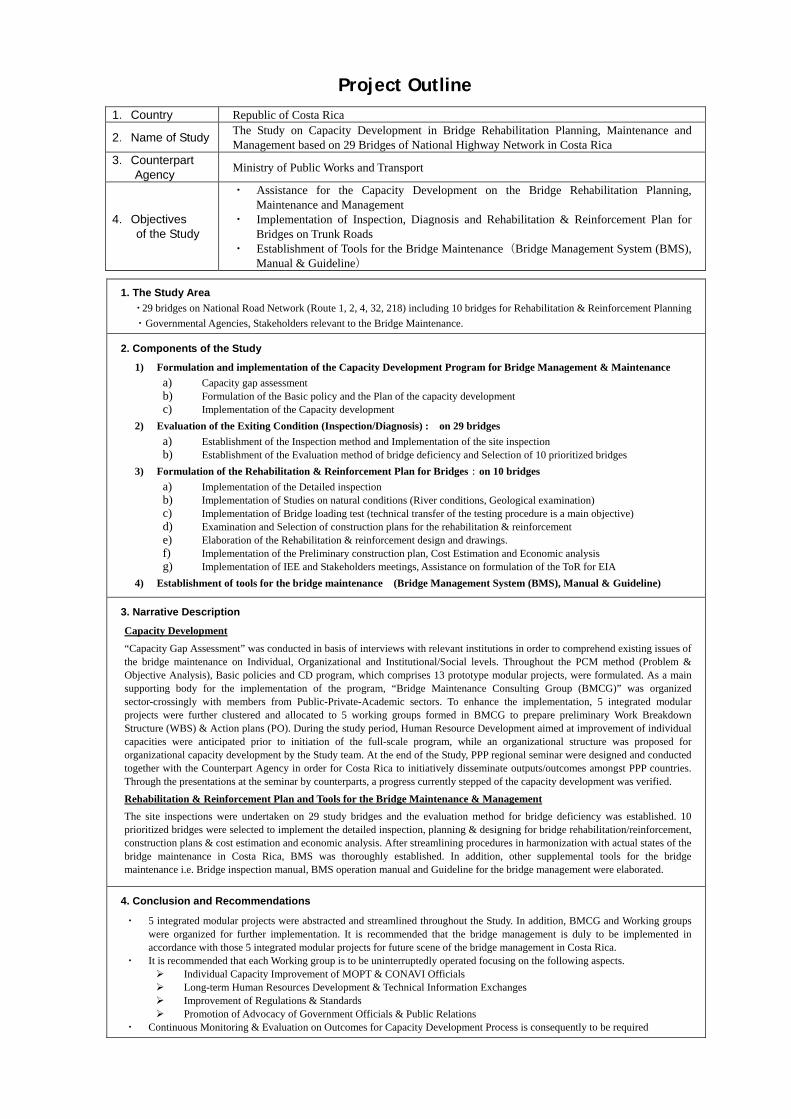
Project Outline 1.Country Republic of Costa Rica
2.Name of Study The Study on Capacity Development in Bridge Rehabilitation Planning, Maintenance and Management based on 29 Bridges of National Highway Network in Costa Rica
3.Counterpart Agency Ministry of Public Works and Transport
4.Objectives of the Study
・ Assistance for the Capacity Development on the Bridge Rehabilitation Planning, Maintenance and Management
・ Implementation of Inspection, Diagnosis and Rehabilitation & Reinforcement Plan for Bridges on Trunk Roads
・ Establishment of Tools for the Bridge Maintenance(Bridge Management System (BMS), Manual & Guideline)
1. The Study Area ・29 bridges on National Road Network (Route 1, 2, 4, 32, 218) including 10 bridges for Rehabilitation & Reinforcement Planning ・Governmental Agencies, Stakeholders relevant to the Bridge Maintenance.
2. Components of the Study
1) Formulation and implementation of the Capacity Development Program for Bridge Management & Maintenance a) Capacity gap assessment b) Formulation of the Basic policy and the Plan of the capacity development c) Implementation of the Capacity development
2) Evaluation of the Exiting Condition (Inspection/Diagnosis) : on 29 bridges a) Establishment of the Inspection method and Implementation of the site inspection b) Establishment of the Evaluation method of bridge deficiency and Selection of 10 prioritized bridges
3) Formulation of the Rehabilitation & Reinforcement Plan for Bridges:on 10 bridges a) Implementation of the Detailed inspection b) Implementation of Studies on natural conditions (River conditions, Geological examination) c) Implementation of Bridge loading test (technical transfer of the testing procedure is a main objective) d) Examination and Selection of construction plans for the rehabilitation & reinforcement e) Elaboration of the Rehabilitation & reinforcement design and drawings. f) Implementation of the Preliminary construction plan, Cost Estimation and Economic analysis g) Implementation of IEE and Stakeholders meetings, Assistance on formulation of the ToR for EIA
4) Establishment of tools for the bridge maintenance (Bridge Management System (BMS), Manual & Guideline)
3. Narrative Description
Capacity Development
“Capacity Gap Assessment” was conducted in basis of interviews with relevant institutions in order to comprehend existing issues of the bridge maintenance on Individual, Organizational and Institutional/Social levels. Throughout the PCM method (Problem & Objective Analysis), Basic policies and CD program, which comprises 13 prototype modular projects, were formulated. As a main supporting body for the implementation of the program, “Bridge Maintenance Consulting Group (BMCG)” was organized sector-crossingly with members from Public-Private-Academic sectors. To enhance the implementation, 5 integrated modular projects were further clustered and allocated to 5 working groups formed in BMCG to prepare preliminary Work Breakdown Structure (WBS) & Action plans (PO). During the study period, Human Resource Development aimed at improvement of individual capacities were anticipated prior to initiation of the full-scale program, while an organizational structure was proposed for organizational capacity development by the Study team. At the end of the Study, PPP regional seminar were designed and conducted together with the Counterpart Agency in order for Costa Rica to initiatively disseminate outputs/outcomes amongst PPP countries. Through the presentations at the seminar by counterparts, a progress currently stepped of the capacity development was verified.
Rehabilitation & Reinforcement Plan and Tools for the Bridge Maintenance & Management The site inspections were undertaken on 29 study bridges and the evaluation method for bridge deficiency was established. 10 prioritized bridges were selected to implement the detailed inspection, planning & designing for bridge rehabilitation/reinforcement, construction plans & cost estimation and economic analysis. After streamlining procedures in harmonization with actual states of the bridge maintenance in Costa Rica, BMS was thoroughly established. In addition, other supplemental tools for the bridge maintenance i.e. Bridge inspection manual, BMS operation manual and Guideline for the bridge management were elaborated.
4. Conclusion and Recommendations
・ 5 integrated modular projects were abstracted and streamlined throughout the Study. In addition, BMCG and Working groups were organized for further implementation. It is recommended that the bridge management is duly to be implemented in accordance with those 5 integrated modular projects for future scene of the bridge management in Costa Rica.
・ It is recommended that each Working group is to be uninterruptedly operated focusing on the following aspects. Individual Capacity Improvement of MOPT & CONAVI Officials Long-term Human Resources Development & Technical Information Exchanges Improvement of Regulations & Standards Promotion of Advocacy of Government Officials & Public Relations
・ Continuous Monitoring & Evaluation on Outcomes for Capacity Development Process is consequently to be required
THE STUDY ON CAPACITY DEVELOPMENT IN BRIDGE REHABILITATION FINAL REPORT PLANNING, MAINTENANCE AND MANAGEMENT BASED ON 29 BRIDGES FEBRUARY 2007 OF NATIONAL HIGHWAY NETWORK IN COSTA RICA
JICA STUDY TEAM ORIENTAL CONSULTANTS CO., LTD. CHODAI CO., LTD
S-1
SUMMARY OF PROJECT
Study Period: From September, 2005 to February, 2007 Counterpart Agency: Ministry of Public Works and Transports, National Road Counsel
S.1 Background and Objectives of the Study
The road network in Costa Rica reaches over 35,000 km of total length and comprises international trunk roads named Pan-American Highway. Since the overland mode is the most predominant transportation in the Central America comparing with the air or the marine transportation mode, improvement of the road network is a key factor on developing and integrating economy in the region. Consequently, it is a common understanding that deficiency on the road maintenance shall socio-economically produce immense and regional-wide impacts in the Central America.
Under the circumstances that most of 1,330 bridges on the national highway suffer from severe deteriorations caused by earthquakes, river flowing and increasing traffic volume, deficiency on the road maintenance has allowed those deteriorations to reach more critical levels. The National Development Plan of Costa Rica states that the bridge rehabilitation on trunk roads is particularly key tractions to accelerate the economic growth in the country.
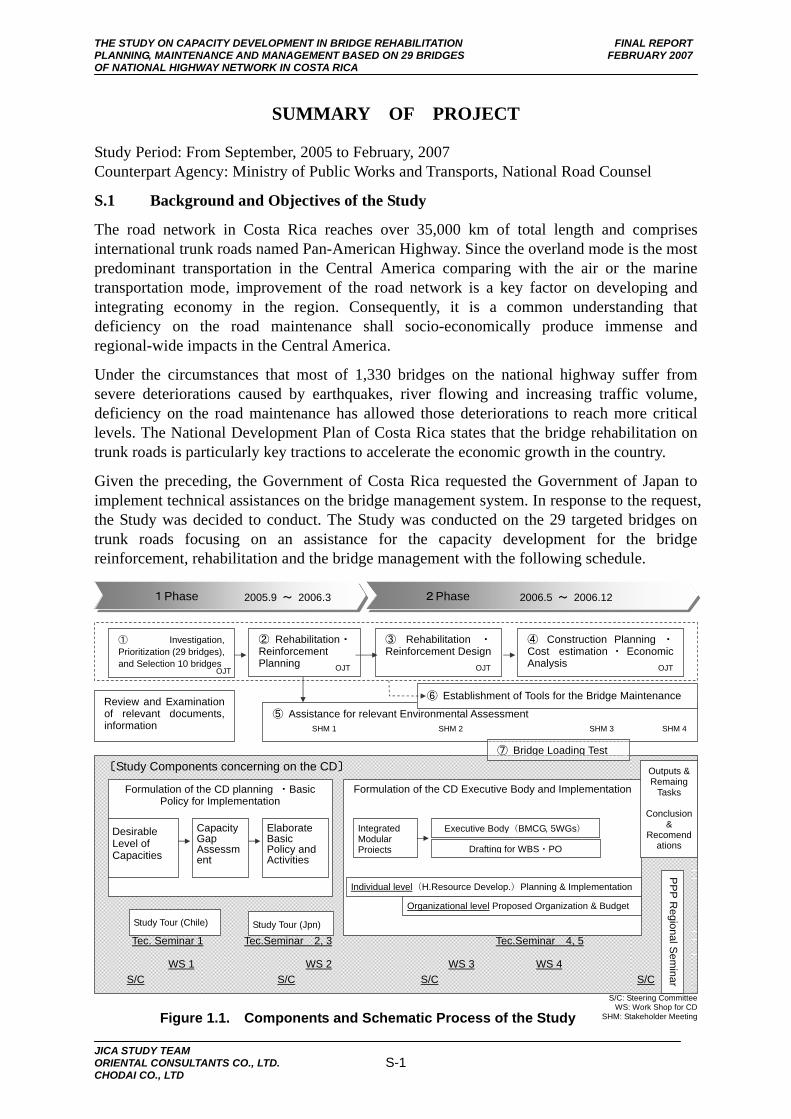
Given the preceding, the Government of Costa Rica requested the Government of Japan to implement technical assistances on the bridge management system. In response to the request, the Study was decided to conduct. The Study was conducted on the 29 targeted bridges on trunk roads focusing on an assistance for the capacity development for the bridge reinforcement, rehabilitation and the bridge management with the following schedule.
S/C: Steering Committee WS: Work Shop for CD
SHM: Stakeholder Meeting
1Phase 2Phase
① Investigation, Prioritization (29 bridges), and Selection 10 bridges
② Rehabilitation・Reinforcement Planning
③ Rehabilitation ・Reinforcement Design
④ Construction Planning ・Cost estimation ・ Economic Analysis OJT OJT OJT
⑤ Assistance for relevant Environmental Assessment Review and Examination of relevant documents, information
⑥ Establishment of Tools for the Bridge Maintenance
〔Study Components concerning on the CD〕
Formulation of the CD planning ・Basic Policy for Implementation
Desirable Level of Capacities
Capacity Gap Assessment
Elaborate Basic Policy and Activities
Study Tour (Chile)
⑦ Bridge Loading Test
Study Tour (Jpn)
Formulation of the CD Executive Body and Implementation
Outputs & Remaing
Tasks
Conclusion&
Recomendations
S/C
2005.9 ~ 2006.3 2006.5 ~ 2006.12
PP
P Regional S
eminar S/C
SHM 1 SHM 2 SHM 4
Integrated Modular Projects
Executive Body(BMCG, 5WGs)
Individual level(H.Resource Develop.)Planning & Implementation
Organizational level Proposed Organization & Budget
Drafting for WBS・PO
Tec. Seminar 1 Tec.Seminar 2, 3 Tec.Seminar 4, 5
WS 1 WS 2 WS 3 WS 4 S/C S/C
SHM 3
Figure 1.1. Components and Schematic Process of the Study
OJT

THE STUDY ON CAPACITY DEVELOPMENT IN BRIDGE REHABILITATION FINAL REPORT PLANNING, MAINTENANCE AND MANAGEMENT BASED ON 29 BRIDGES FEBRUARY 2007 OF NATIONAL HIGHWAY NETWORK IN COSTA RICA
JICA STUDY TEAM ORIENTAL CONSULTANTS CO., LTD. CHODAI CO., LTD
S-2
S.2 Review and Examination of Relevant Documents and Data
National and Socio-economic conditions were reviewed on the following items. • Natural condition: geography, climate, seismic
• Socio-economic state: Land use, Population data/Social index, Economy and Industry
• Present state of the road network
• Present state of the road maintenance S.3 Existing Condition of Bridges and Status of Bridge Maintenance
In order to comprehend a present state of bridges and the bridge maintenance, the following items are examined. • Existing condition of bridges in Costa Rica
• Bridge Design Standards
• Bridge Maintenance (Executive organization, Bridge maintenance system)
S.4 Capacity Gap Assessment
The full-scale capacity gap assessment was jointly conducted with counterpart officials of MOPT and CONAVI in order to evaluate capacities at “Individual”, “ Organizational” and “Institutional and Social” levels in terms of the bridge maintenance, and thereby to identify existing problems. The assessment was implemented throughout interviews with relevant institutions as follows:
a) MOPT, its related departments and regional offices b) CONAVI, its related departments and regional offices c) Other relevant government ministries and agencies such as MOH, MIDEPLAN,
CNC, MINAE, SETENA and etc. d) University of Costa Rica and its related research institutes such as LANAMME e) Costa Rica Architect and Engineering Association f) Private sector such as contractors and design companies g) Users such as truckers, passengers and citizens
The procedures for the capacity gap assessment include the following steps. 1) Designing capacity gap assessment score sheets, 2) Interviews and collection of data/information from relevant stakeholders, 3) Preliminary assessment of capacity gaps as well as Full-scale assessment of capacity gaps. PCM (Project Cycle Management) analysis including the problem analysis and the objective analysis were employed to solve the bottleneck against the ideal bridge management.
Upon the problem analysis, the core problem of “Inappropriate Bridge Maintenance” was derived from i) insufficient bridge maintenance capacity, ii) weak organizational structure on bridge maintenance, iii) insufficient budget for bridge maintenance, iv) insufficient enforcement of laws, regulations and standards, and v) insufficient knowledge management on bridge maintenance.

THE STUDY ON CAPACITY DEVELOPMENT IN BRIDGE REHABILITATION FINAL REPORT PLANNING, MAINTENANCE AND MANAGEMENT BASED ON 29 BRIDGES FEBRUARY 2007 OF NATIONAL HIGHWAY NETWORK IN COSTA RICA
JICA STUDY TEAM ORIENTAL CONSULTANTS CO., LTD. CHODAI CO., LTD
S-3
S.5 Basic Policies For Capacity Development
In order to solve problems identified by the problem analysis, the program for the total management of the bridge maintenance and rehabilitation, which is composed of the cluster of 13 proto-type modular projects, is consequently proposed throughout the objective analysis and the alternative analysis.
S.6 Implementation of Capacity Development for Comprehensive Bridge Maintenance Program
13 proto-type modular projects identified were integrated into 5 full-scale modular projects. Throughout formulation of PDM (Project Design Matrix), the cluster of 5 integrated full-scale modular projects is regarded as the bridge maintenance program.
Integrated Modular Project 1 (MP-1): Individual Capacity Building Project for MOPT and COMAVI
1 Individual Capacity Improvement Project for Inspection and Diagnosis “Individual” level 2 Individual Capacity Improvement Project for BMS Operation, Priority Selection and
Rehabilitation Planning of Bridges “Individual” level
3 Individual Capacity Improvement Project for Implementation of Rehabilitation of Bridges “Individual” level Integrated Modular Project 2 (MP-2): Institutional Building Project for MOPT and CONAVI
1 Organization Strengthening Project for Direction of Bridges of MOPT “Organizational” level 2 Organization Strengthening Project for New Bridge-related Department of CONAVI “Organizational” level
Integrated Modular Project 3 (MP-3): Long-term Human Resources Development and Technical Exchange Project
1 Long-term Human Resources Development Project “Individual” level 2 Public-Private-Academic Technical Exchange Project “Organizational” level
3 PPP Countries Technical Exchange Project “Social” level Integrated Modular Project 4 (MP-4): Regulation and Standards Improvement Project
1 Technical Regulations and Design Standards Improvement Project “Institutional” level 2 Procurement Regulations and Procedures Improvement Project “Institutional” level
Integrated Modular Project 5 (MP-5): Promotion of Public Relations and Advocacy Project
1 Asset Management Advocacy Project for Financial and Planning Authorities “Institutional” level 2 Bridge Users Public Relations and Advocacy Project “Social” level
3 Tax Payers Public Relations and Advocacy Project “Social” level
As a main body for the implementation of the capacity development program, “Bridge Maintenance Consulting Group (BMCG)” which consists of representatives from various organizations was established to form 5 working groups. In order to concrete the program implementation, the preliminary WBSs as well as POs are drafted. The full-scale WBSs and POs will be formulated as the 5 years plan in the course of a series of the BMCG meetings held in the financial year 2007 in order for the plan to be initiated from the financial year 2008.
As a part of assistances for the organizational capacity development, the study team proposed both an organizational structure and a budgetary arrangement for the bridge maintenance.
In order to realize further dissemination toward PPP countries, PPP Regional Seminar was held at the end of the study, which allowed to introduce the outline and to extend outputs/outcomes of the study to neighboring countries on the bridge management.
THE STUDY ON CAPACITY DEVELOPMENT IN BRIDGE REHABILITATION FINAL REPORT PLANNING, MAINTENANCE AND MANAGEMENT BASED ON 29 BRIDGES FEBRUARY 2007 OF NATIONAL HIGHWAY NETWORK IN COSTA RICA
JICA STUDY TEAM ORIENTAL CONSULTANTS CO., LTD. CHODAI CO., LTD
S-4
S.7 Human Resource Development
The Human Resource Development plays a part of roles of the capacity development program upon the individual level, which comprises mainly technical training activities for the bridge management. These activities were anticipated to the initiation of the program development and regarded as inputs for the Program (integrated modular project 1, 3).
Technical training activities have been introduced and initiated essentially aiming upon the counter-parts technical staff at the beginning of the study. The activities were thoroughly practiced in manner of both On-the-Job (OJT) and Technical Seminar basis to aim an enhancement of Knowledge, Skill & Attitude. In addition, it is remarked that an Overseas Study Tour was applied for the study, which was aimed to obtain supplementary effects and amplify effectiveness on both the technical training and dissemination.
S.8 Existing Condition and Site Inspection of the Study Bridges
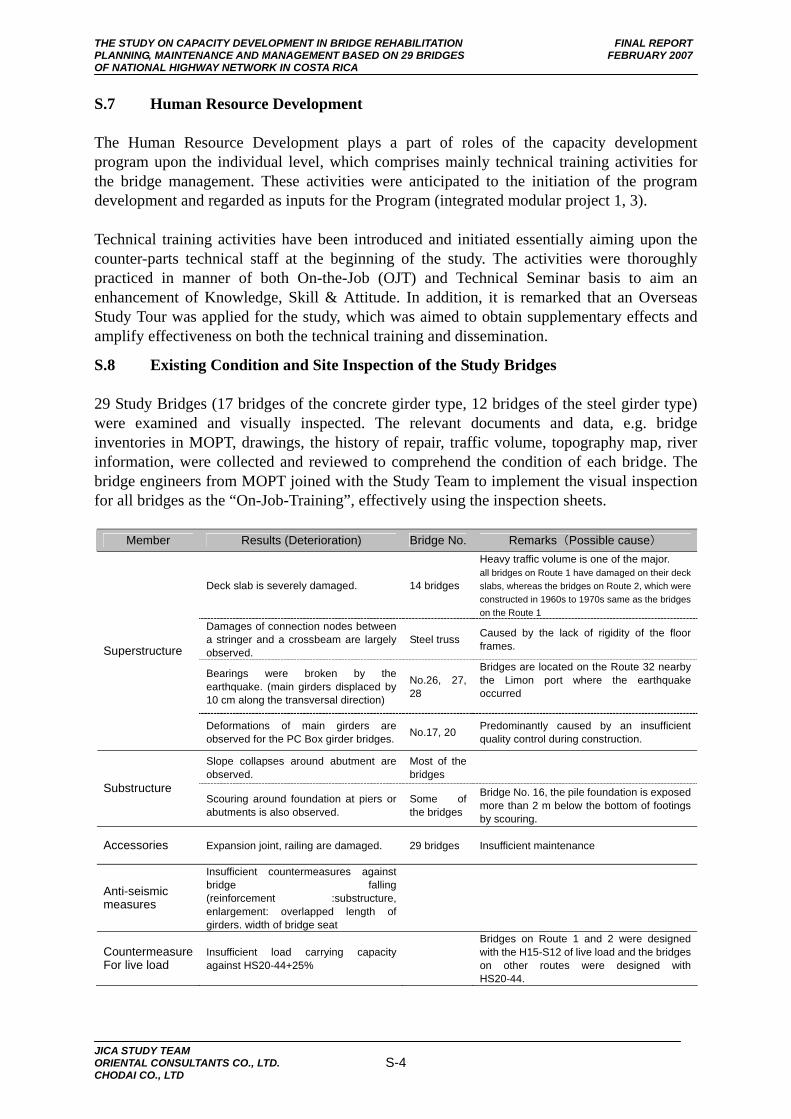
29 Study Bridges (17 bridges of the concrete girder type, 12 bridges of the steel girder type) were examined and visually inspected. The relevant documents and data, e.g. bridge inventories in MOPT, drawings, the history of repair, traffic volume, topography map, river information, were collected and reviewed to comprehend the condition of each bridge. The bridge engineers from MOPT joined with the Study Team to implement the visual inspection for all bridges as the “On-Job-Training”, effectively using the inspection sheets.
Member Results (Deterioration) Bridge No. Remarks(Possible cause)
Deck slab is severely damaged. 14 bridges
Heavy traffic volume is one of the major. all bridges on Route 1 have damaged on their deck slabs, whereas the bridges on Route 2, which were constructed in 1960s to 1970s same as the bridges on the Route 1
Damages of connection nodes between a stringer and a crossbeam are largely observed.
Steel truss Caused by the lack of rigidity of the floor frames.
Bearings were broken by the earthquake. (main girders displaced by 10 cm along the transversal direction)
No.26, 27, 28
Bridges are located on the Route 32 nearby the Limon port where the earthquake occurred
Superstructure
Deformations of main girders are observed for the PC Box girder bridges. No.17, 20 Predominantly caused by an insufficient
quality control during construction.
Slope collapses around abutment are observed.
Most of the bridges
Substructure Scouring around foundation at piers or abutments is also observed.
Some of the bridges
Bridge No. 16, the pile foundation is exposed more than 2 m below the bottom of footings by scouring.
Accessories Expansion joint, railing are damaged. 29 bridges Insufficient maintenance
Anti-seismic measures
Insufficient countermeasures against bridge falling (reinforcement :substructure, enlargement: overlapped length of girders. width of bridge seat
Countermeasure For live load
Insufficient load carrying capacity against HS20-44+25%
Bridges on Route 1 and 2 were designed with the H15-S12 of live load and the bridges on other routes were designed with HS20-44.

THE STUDY ON CAPACITY DEVELOPMENT IN BRIDGE REHABILITATION FINAL REPORT PLANNING, MAINTENANCE AND MANAGEMENT BASED ON 29 BRIDGES FEBRUARY 2007 OF NATIONAL HIGHWAY NETWORK IN COSTA RICA
JICA STUDY TEAM ORIENTAL CONSULTANTS CO., LTD. CHODAI CO., LTD
S-5
S.9 Selection of 10 Bridges for Rehabilitation, Reinforcement
Under collaboration between MOPT bridge engineers and the Study team, selection of prioritized bridges for rehabilitation were processed and finalized in accordance with the comprehensive deficiency evaluation of bridges whose criteria consists of a degree of deterioration observed, a weight determined by the functional importance as structural parts as well as a weight determined by the potential negative impact that those damages presenting may affect structural parts of bridges. In the Study, the Analytic Hierarchy Process (AHP), a decision support method was to be utilized for the evaluation of bridge deficiency.
10 bridges for rehabilitation, reinforcement shall be selected not only based on results of the evaluation of the bridge deficiency, but also other points of view, which it will be indeed a purpose of the Study, that outputs of the study are to be widely applicable and expandable for the bridge maintenance in Costa Rica.
S.10 Plan for Rehabilitation, Reinforcement and Improvement of 10 Selected Bridges
The plan for rehabilitation, reinforcement was formulated throughout an evaluation of results from both the detailed design (Visual Inspection, Concrete core sampling test, Schmidt hummer test, Phenolphthalein test, Detection of R-bar position, Measurement of steel plate thickness) and the structural analysis.
In this particular case of the Study, since it is required to completely re-check and secure both the load carrying capacity satisfying HS20-44+25% and quake-resistibility satisfying the local anti-seismic codes, a structural analysis with computed structural models were applied for verifying sectional forces or stresses at each members in order to determine a necessity as well as specific conditions to reinforce.
Bridge Loading Test was conducted mainly aiming at the technical transfer to MOPT engineers. Based on the results of the stress frequency measuring at the steel deck beam bridge, fatigue failure was evaluated to estimate the residual life.

THE STUDY ON CAPACITY DEVELOPMENT IN BRIDGE REHABILITATION FINAL REPORT PLANNING, MAINTENANCE AND MANAGEMENT BASED ON 29 BRIDGES FEBRUARY 2007 OF NATIONAL HIGHWAY NETWORK IN COSTA RICA
JICA STUDY TEAM ORIENTAL CONSULTANTS CO., LTD. CHODAI CO., LTD
S-6
S.11 Detailed Design for selected 10 bridges
Methods of the rehabilitation, the reinforcement for 10 bridges were summarized as follows.
Table 11.1 Superstructure ( “O”: Applicable method) R1 R2 R4 R32 R216
2 3 7 12 16 17 19 20 26 29 Member Methods ST ST RI SI RI RI PB SI PB SI PI
Slab thickness increasing (upper side)
○ ○
FRP bonding ○ ○ ○ ○ Deck Slab
Replacement: PC deck ○ ○
Replacement: frames ○ ○ N/A N/A N/A N/A N/A N/A
Steel plate thickness increasing ○ N/A N/A N/A N/A ○ N/A N/A
Additional members ○ N/A N/A N/A N/A N/A N/A
Replacement: steel plate N/A N/A N/A N/A ○ N/A N/A
Floor frame Main girder: Steel
Out cable N/A ○ N/A N/A N/A ○ N/A N/A
Girder height increasing
N/A N/A ○ N/A N/A N/A FRP bonding N/A N/A N/A ○ N/A N/A ○
Main girder: RC, PC
Steel plate bonding N/A N/A ○ N/A ○ N/A N/A Replacement: Expansion joint ○ ○ ○ ○ ○ ○ ○ ○ ○ ○ ○ Bearing repair ○ ○ Accessories
Replacement: railing ○ ○ Asphalt paving ○ ○ ○ ○ ○ ○ ○ ○ ○ ○ ○
Pavement Waterproofing ○ ○ ○ ○ ○ ○ ○ ○ ○ ○ ○
Table 11.2 Substructure ( “O”: Applicable method)
R1 R2 R4 R32 R2162 3 7 12 16 17 19 20 26 29 Member Methods
ST ST RI SI,RI RI PB SI PB SI PI Beam section increasing ○ ○ ○ ○
Concrete Jacketing ○ ○ ○ ○ ○ Substructure
Concrete protection ○ ○
Footing widening ○ ○ ○ ○ ○ ○ ○ ○ ○ Foundation
Additional piles N/A N/A N/A N/A ○ N/A ○ N/A N/A
Bridge seat widening, Displacement limitation system
○ ○ ○ ○ ○ ○ ○ Anti- Falling-down Connection system
(chain) ○ ○ ○ ○
Slope protection (Masonry) ○ ○ ○
Protections Riverbed protection (Gabion) ○ ○ ○ ○ ○ ○
THE STUDY ON CAPACITY DEVELOPMENT IN BRIDGE REHABILITATION FINAL REPORT PLANNING, MAINTENANCE AND MANAGEMENT BASED ON 29 BRIDGES FEBRUARY 2007 OF NATIONAL HIGHWAY NETWORK IN COSTA RICA
JICA STUDY TEAM ORIENTAL CONSULTANTS CO., LTD. CHODAI CO., LTD
S-7
S.12 Preliminary Construction Planning and Cost Estimate
Work execution for the Project without entire traffic closure is crucial considering social and economic aspects because those bridges are located at highly important trunk roads in Costa Rica. It shall be a plan that construction works are basically to be executed on one side of the bridge in order to secure one-way traffic on the other side all the time. Consequently, the construction period is to be estimated 60 to 190 days. Estimated cost for the Project counts 360,000 to 3,270,000 USD (42,088,000 to 382,300,000 JPY) including contingency which is equivalent to 5% of the total direct costs.
S.13 Economic Analysis
The aim of this economic analysis includes subjects such as: 1) consideration of the suitable economic analysis method for bridge rehabilitation & reinforcement, 2) trial this analysis against the 10 selected bridge, and 3) systemized this method to be extended to another bridge.
Based on the “with case” and “without case” for bridge rehabilitation & reinforcement, project costs & benefits are examined. The project benefits are evaluated as the reduction costs which are the costs in the case of “without case”.
Project costs, which are described in the chapter12, were converted as the economic cost to be employed. Operation & maintenance costs were calculated taking into account cots for the periodical and detailed inspections, replacement of the paving and reinforcement of members in accordance with the bridge type and material aging etc. Social costs were calculated based on “Detour Cost” & “Waiting Cost” due to traffic closure & restriction. Detour Cost is raised when the bridge falls down and there are detour route. Waiting Cost is raised when the traffic restriction for one-direction during the construction work etc.. “Future scenario”, which is a basis for the analysis, was determined for each bridge under the engineering judgment based upon results of the inspections and age of bridge. The analysis results that there are 8 bridges whose EIRR exceeds to 20% and that the highest NPV (discount rate=12%) appears at Chirripo bridge (No.26) on the Route 32, which means that the rehabilitation and the reinforcement is to be quite effective.

THE STUDY ON CAPACITY DEVELOPMENT IN BRIDGE REHABILITATION FINAL REPORT PLANNING, MAINTENANCE AND MANAGEMENT BASED ON 29 BRIDGES FEBRUARY 2007 OF NATIONAL HIGHWAY NETWORK IN COSTA RICA
JICA STUDY TEAM ORIENTAL CONSULTANTS CO., LTD. CHODAI CO., LTD
S-8
S.14 Bridge Management System (BMS)
The study team researched the condition of the existing information systems for roads & bridges to grasp present issues, prior to formulation of the bridge management system.
The Bridge Management System (BMS) was established as a supporting tool for the technical judgment to be taken upon implementation of inspections, evaluation & analysis and maintenance of the bridge structural components. The functions of the system are as follows;
• Function for the registration and the renewal of the data
• Function for the administration of data such as evaluation of deficiency,
prioritization of repair and cost estimation
• Function for the retrieval of data including bridge inventory and bridge inspection
data and display for a location of a bridge.
• Function for output of bridge inventory
The System administrates all relevant data unified in the sole server.
S.15 Tools for the Bridge Maintenance Management
As supporting tools for the Bridge Maintenance, 1) the Inspection Manual, 2) the Operation Manual for Bridge Management System and 3) the Guideline for the Bridge Management were elaborated.
The inspection manual is prepared mainly for the bridge inspectors and bridge engineers, which comprises how to implement the inventory survey, the procedures of the routine inspection and the methods to evaluate the bridge deteriorations. The operation manual is prepared mainly for the system administrator and bridge engineers, which instructs the methods of operation and maintain Bridge Management System. The guideline is prepared mainly for the bridge engineers who engage in the bridge maintenance activities, and instructs the concept of the bridge maintenance, cause of the deterioration of the bridge, the method of the detailed inspection, the method of the loading test and the bridge repair methods.
S.16 Technical Support for the Environmental Examination
Within this study, the field investigation was carried out for 10 selected bridges while the information collection such as literature reviews and interviews with competent environmental agencies/or organizations such as SETENA were conducted. Based on those collected environmental information, the IEE of the proposed project was conducted. From the IEE, it is found that no significant potential environmental impacts are recognized since the proposed project is a rehabilitation/maintenance-oriented project. However, potential environmental impacts of following environmental factors such as the temporal water quality degradation, traffic jams, noise/vibration, the treatment of the construction waste, the set-up of the construction yards, infectious diseases such as dengue and malaria to the construction workers during the construction period would not be negligible. Several bridge sites may be

THE STUDY ON CAPACITY DEVELOPMENT IN BRIDGE REHABILITATION FINAL REPORT PLANNING, MAINTENANCE AND MANAGEMENT BASED ON 29 BRIDGES FEBRUARY 2007 OF NATIONAL HIGHWAY NETWORK IN COSTA RICA
JICA STUDY TEAM ORIENTAL CONSULTANTS CO., LTD. CHODAI CO., LTD
S-9
located in adjacent areas of the important ecological and/or cultural sites or inside of the national parks. Also, it is likely that several illegal squatters stay at two bridge sites.
Since the environmental licenses are to be required for implementation of the proposed bridge rehabilitation plans, suitable ways of the environmental license approach abiding by both Costa Rican EIA Law and JICA Guideline were discussed based on the potential negative impacts to be associated with this rehabilitation plan. Key directions and concepts for ToR development of environmental studies as well as the environmental management program were summarized.
It can be said that all selected 10 rehabilitation plans are categorized into “Category B1” by Costa Rican EIA Law while “Category B” by JICA Guideline.
During the Study, stakeholder meetings were held 4 times in order for relevant information to be disclosed to the public, which their questions & answers arisen were reported on the MOPT’s web site.
S.17 Conclusion & Recommendation
Throughout the Study, “Capacity Development in Bridge Rehabilitation Planning, Maintenance and Management Based on 29 Bridges of National Highway Network” has commenced and efficaciously expanded on strengthening capability of the maintenance of bridge in Costa Rica. Along with a technical examination for the rehabilitation of 29 bridges inclusively the design for repair works of the 10 selected bridges, which represent structural features of totality, as well as multiple advocacy activities for the Asset Management, awareness and comprehension on the concept of Capacity Development have been extensively rewarded with positive results and efficacy.
Recommendations based on the Study are summarized as follows.
1) Implementation of Comprehensive Bridge Maintenance Program via Formulation of Full-scale Work Breakdown Structures & Operation Plans for 5 Integrated Modular Projects, which are to be finalized in the financial year 2007 and to be commenced from the year 2008 for 5 years rolling.
2) Smooth Continuous Operation of BMCG & 5 Working Groups on the following tasks.
• Individual Capacity Improvement of MOPT & CONAVI Officials
• Strengthen New Strategy for MOPT Bridges & Create Proposed Bridge Conservation
Department for CONA
• Long-term Human Resources Development & Technical Information Exchanges
• Improvement of Regulations & Standards
• Promotion of Advocacy of Government Officials & Public Relations
3) Continuous Monitoring & Evaluation on Outcomes for Capacity Development Process
THE STUDY ON CAPACITY DEVELOPMENT IN BRIDGE REHABILITATION FINAL REPORT PLANNING, MAINTENANCE AND MANAGEMENT BASED ON 29 BRIDGES FEBRUARY 2007 OF NATIONAL HIGHWAY NETWORK IN COSTA RICA
JICA STUDY TEAM ORIENTAL CONSULTANTS CO., LTD. CHODAI CO., LTD i
THE STUDY ON CAPACITY DEVELOPMENT IN BRIDGE REHABILITATION PLANNING, MAINTENANCE AND MANAGEMENT BASED ON 29 BRIDGES
OF NATIONAL HIGHWAY NETWORK IN COSTA RICA
FINAL REPORT
Table of Contents
■ 1 OF 2: EXECUTIVE SUMMARY
■ 2 OF 2: MAIN TEXT Project Location Map Project Outline Summary of Project Table of Contents List of Tables List of Figures Abbreviations
CHAPTER 1 Outline of the Study··········································································· 1-1
1.1 Background of the Study ·············································································· 1-1 1.2 Objectives of the Study ················································································ 1-2 1.3 Components and Process of the Study ························································· 1-3
CHAPTER 2 Existing Situation In Costa Rica························································ 2-1
2.1 National Condition ····················································································· 2-1 2.1.1 Geography ···························································································· 2-1 2.1.2 Climate ································································································· 2-2 2.1.3 Seismic ································································································· 2-5
2.2 Socio-Economic Condition ·········································································· 2-7 2.2.1 Land Use ······························································································ 2-7 2.2.2 Population and Social Index ································································· 2-9 2.2.3 Economy and Industry ········································································· 2-13 2.2.4 Motorization ························································································ 2-16
2.3 Road Network Configuration and Condition ·············································· 2-17 2.3.1 Road Classification ·············································································· 2-17 2.3.2 Traffic Volume ····················································································· 2-22 2.3.3 Road maintenance ················································································ 2-25
CHAPTER 3 Existing Condition of Bridges and Status of Bridge Maintenance····· 3-1
3.1 Outline of Bridges in Costa Rica ·································································· 3-1 3.2 Bridge Design Standards ·············································································· 3-3
3.2.1 Design Load ························································································· 3-3 3.2.2 Other Condition ··················································································· 3-6

THE STUDY ON CAPACITY DEVELOPMENT IN BRIDGE REHABILITATION FINAL REPORT PLANNING, MAINTENANCE AND MANAGEMENT BASED ON 29 BRIDGES FEBRUARY 2007 OF NATIONAL HIGHWAY NETWORK IN COSTA RICA
JICA STUDY TEAM ORIENTAL CONSULTANTS CO., LTD. CHODAI CO., LTD ii
3.3 Bridge Maintenance ······················································································· 3-9 3.3.1 Organization for Construction and Maintenance of Bridges ················ 3-9 3.3.2 Bridge Maintenance System in Costa Rica ·········································· 3-10
CHAPTER 4 Capacity Gap Assessment ································································ 4-1
4.1 Objectives and Procedures of Capacity Gap Assessment ····························· 4-1 4.2 Results of Full-scale Capacity Gap Assessment ··········································· 4-4
4.2.1 Governmental Organizations ································································· 4-4 4.2.2 Academic and Research Organizations ·················································· 4-12 4.2.3 Private Sector························································································· 4-14 4.2.4 International Framework········································································ 4-16
4.3 Summary of Results of Full-scale Capacity gap Assessment ······················· 4-18 4.4 Core Problem and Problems Analysis ·························································· 4-22
CHAPTER 5 Basic Policies For Capacity Development ······································· 5-1 5.1 Basic Approaches and Policies for Capacity Development ·························· 5-1 5.2 Proto-type Modular Projects for Capacity Development ····························· 5-7
CHAPTER 6 Implementation of Capacity Development for Comprehensive Bridge
Maintenance Program ····································································· 6-1 6.1 Basic Methodologies and Procedures ··························································· 6-1 6.1.1 Program Approach as Basic Methodology for Implementation of Capacity
Development ························································································· 6-1 6.1.2 Integration of Modular Projects for Capacity Development ·················· 6-1 6.1.3 Establishment of BMCG and Working Groups ····································· 6-2 6.1.4 Basic Schedule for Capacity Development ··········································· 6-3 6.1.5 Key Drivers for Capacity Development ················································ 6-4 6.2 Project Design Matrix, Work Breakdown Structure and Plan of Operation · 6-4 6.2.1 Project Design Matrix ··········································································· 6-4 6.2.2 WBS for Integrated Modular Projects ··················································· 6-7 6.2.3 Plan of Operations ················································································· 6-12 6.3 Institutional Reform and Budgetary Arrangement as Pre-conditions for Capacity Design ····················································································· 6-19 6.3.1 Basic Concepts for Institutional Reform ··············································· 6-19 6.3.2 Institutional Reform of Bridge-related Organizations of MOPT and CONAVI ························································································· 6-19 6.3.3 Institutional Building of BMCG ···························································· 6-24 6.3.4 Budgetary Arrangement ········································································ 6-25 6.4 Monitoring and Evaluation of Capacity Development ································· 6-27 6.4.1 Basic Concepts for Monitoring and Evaluation ····································· 6-27 6.4.2 Monitoring for Activities during the Study Period ································ 6-27 6.4.3 Monitoring for Institutional Level during the Study Period ·················· 6-28 6.4.4 Monitoring during Implementation of Capacity Development················ 6-30 6.5 Public Relations for Capacity Development ················································ 6-32 6.5.1 Domestic Public Relations ···································································· 6-32 6.5.2 Extension to PPP Member Countries ···················································· 6-33 6.6 Exit Strategy after the Termination of the Study ·········································· 6-34
THE STUDY ON CAPACITY DEVELOPMENT IN BRIDGE REHABILITATION FINAL REPORT PLANNING, MAINTENANCE AND MANAGEMENT BASED ON 29 BRIDGES FEBRUARY 2007 OF NATIONAL HIGHWAY NETWORK IN COSTA RICA
JICA STUDY TEAM ORIENTAL CONSULTANTS CO., LTD. CHODAI CO., LTD iii
CHAPTER 7 Human Resource Development ······················································· 7-1
7.1 Basic Concept ································································································ 7-1 7.2 Implementation Plan for Human Resource Development ···························· 7-1 7.2.1 Basic Plan ····························································································· 7-1 7.2.2 Modular Projects for Individual Competence Improvement ················· 7-5 7.3 Implemented Activities for Human Resource Development ························ 7-6 7.3.1 Technical Pillar-1 ·················································································· 7-6 7.3.2 Technical Pillar-2 ·················································································· 7-6 7.3.3 Technical Pillar-3 ·················································································· 7-15 7.3.4 Technical Pillar-4 ·················································································· 7-18
7.3.5 Overseas Study Tour: Fact -finding Study of Bridge Management System in Chile ····················································································· 7-20
7.3.6 Overseas Study Tour: JICA Counterpart Training Program in Japan ···· 7-25 7.3.7 Puebla-Panama Plan International Seminar ·········································· 7-27
CHAPTER 8 Existing Conditions and Site Inspection of the Study Bridges··········· 8-1
8.1 Existing Condition of the Bridges ································································ 8-1 8.1.1 Condition of Study Route ······································································ 8-1 8.1.2 Condition of Study Bridge ···································································· 8-4 8.2 Method of the Inspection ············································································· 8-6 8.3 Results of Inspections ·················································································· 8-11 8.3.1 Bridge Damage ······················································································· 8-11 8.3.2 Rive Condition in Bridge Site ······························································· 8-19 8.3.3 Other Relevant Condition with Respected to Bridge Maintenance ········· 8-24
CHAPTER 9 Selection of 10 Bridges for Rehabilitation, Reinforcement ············· 9-1
9.1 Introduction ·································································································· 9-1 9.2 Evaluation Method of Bridge Deficiency ····················································· 9-1 9.2.1 Format for Bridge Inspection ·································································· 9-1 9.2.2 Steps for Evaluation of Bridge Deficiency ············································ 9-2 9.2.3 Entire Hierarchy of Bridge Component ················································ 9-3 9.2.4 Evaluation of Bridge Deficiency ··························································· 9-4 9.3 Results of the Calculation ············································································ 9-8 9.3.1 Weight of the Evaluation Items ····························································· 9-8 9.3.2 Summery of the Deficiency Rate of 29 Bridges ···································· 9-10 9.4 Selection of 10 Bridges for Further Detailed Study ··································· 9-11
CHAPTER 10 Plan for Rehabilitation, Reinforcement and Improvement ·············· of 10 Selected Bridges ···································································· 10-1
10.1 Identification of Deterioration in 10 Bridges ············································· 10-1 10.1.1 Method to Identify Deterioration Mechanism ······································· 10-1 10.1.2 Type and Cause of Deterioration ························································· 10-4 10.1.3 Detailed Inspection Method ································································ 10-10 10.1.4 Results of Detailed Inspection ····························································· 10-18 10.1.5 Analysis of Load Carrying Capacity of Bridge ··································· 10-33
THE STUDY ON CAPACITY DEVELOPMENT IN BRIDGE REHABILITATION FINAL REPORT PLANNING, MAINTENANCE AND MANAGEMENT BASED ON 29 BRIDGES FEBRUARY 2007 OF NATIONAL HIGHWAY NETWORK IN COSTA RICA
JICA STUDY TEAM ORIENTAL CONSULTANTS CO., LTD. CHODAI CO., LTD iv
10.1.6 Identification of Deterioration and Damage Mechanism of 10 Bridges ······················································································· 10-42 10.2 Bridge Loading Test ··················································································· 10-46 10.2.1 General ································································································ 10-46 10.2.2 Purpose of Test ···················································································· 10-46 10.2.3 Outline of Loading Test········································································· 10-46 10.2.4 Objective Bridges and Loading Test Items ·········································· 10-47 10.2.5 Loading Test Flow ··············································································· 10-50 10.2.6 Loading Test Schedule ········································································ 10-51 10.2.7 Loading Test for No.17 Chirripo Bridge ············································· 10-52 10.2.8 Loading Test for No.26 Chirripo Bridge ············································· 10-59 10.2.9 Results and Conclusion for Loading Test on No.17 Chirripo Bridge ·· 10-73 10.2.10 Results and Conclusion for Loading Test on No.26 Chirripo Bridge ··· 10-74 10.3 Natural Condition Survey ·········································································· 10-88 10.3.1 River Condition Survey ······································································· 10-88 10.3.2 Geological Survey ··············································································· 10-90 10.4 Selection of Rehabilitation, Reinforcement and Improvement Method ····· 10-94 10.4.1 General ································································································ 10-94 10.4.2 Types of Remedial Measure ································································ 10-94 10.4.3 Target Level of Performance of Bridge ··············································· 10-98 10.4.4 Evaluation of Rehabilitation, Reinforcement and Improvement Method
··············································································································· 10-100 10.4.5 Evaluation of Rehabilitation, Reinforcement and Improvement Method
for 10 Bridges ······················································································ 10-102
CHAPTER 11 Design for Rehabilitation, Reinforcement and Improvement of 10 Selected Bridges ·································································· 11-1
11.1 Deck Slab ··································································································· 11-1 11.1.1 Reinforce Method for Deck Slab ························································· 11-1 11.1.2 Selection of Reinforcement Method for Deck Slab ····························· 11-4 11.1.3 Methodology of Design for Slab Reinforced by FRP Sheet ················ 11-8 11.1.4 Methodology of Design for Slab Reinforced by Slab Thickness Increase
··············································································································· 11-11 11.1.5 Existing Condition and Condition after Reinforcement ······················ 11-14 11.2 Deck Support System ··············································································· 11-15 11.2.1 Method for Reinforcing Deck Support System ··································· 11-15 11.2.2 Selection of Reinforcement Method for Deck Support System ··········· 11-16 11.2.3 Methodology of Design for Reinforcing Deck Support System ·········· 11-17 11.2.4 Existing Condition and Condition after Reinforcement ······················ 11-21 11.3 Main Girder ····························································································· 11-22 11.3.1 Method for Reinforcement for Main Girder ········································ 11-22 11.3.2 Selection of Reinforcement for Main Girder ······································· 11-25 11.3.3 Methodology of Design for Reinforcing Main Girder ························· 11-35 11.3.4 Existing Condition and Condition after Reinforcement ······················ 11-48 11.4 Accessory ································································································ 11-51 11.5 Prevention System for Bridge Collapse ······················································· 11-57 11.5.1 Seismic Performance ·········································································· 11-57

THE STUDY ON CAPACITY DEVELOPMENT IN BRIDGE REHABILITATION FINAL REPORT PLANNING, MAINTENANCE AND MANAGEMENT BASED ON 29 BRIDGES FEBRUARY 2007 OF NATIONAL HIGHWAY NETWORK IN COSTA RICA
JICA STUDY TEAM ORIENTAL CONSULTANTS CO., LTD. CHODAI CO., LTD v
11.5.2 Basic Concept of Prevention System for Bridge Collapse ·················· 11-57 11.5.3 Methodology of Design for Prevention System for Bridge Collapse ·· 11-58 11.5.4 Existing Conditions and Required Measures ······································ 11-66 11.6 Substructure ································································································· 11-71 11.6.1 Method for Reinforcing Substructure ·················································· 11-71 11.6.2 Selection of Reinforcement Method for Substructure ························· 11-72 11.6.3 Methodology of Design for Reinforcing of Beam and Pier ················ 11-74 11.6.4 Existing Condition and Condition after Reinforcement ······················ 11-75 11.7 Foundation··································································································· 11-80 11.7.1 Method for Reinforcement for Foundation ········································· 11-80 11.7.2 Selection of Reinforcement Method for Foundation ··························· 11-81 11.7.3 Methodology of Design for Reinforcing of Foundation ······················ 11-84 11.7.4 Existing Condition and Condition after Reinforcement ······················ 11-86 11.7.5 Scouring ······························································································ 11-91 11.8 Summary of Design for Rehabilitation, Reinforcement and Improvement
of 10 Selected Bridges ················································································ 11-95 CHAPTER 12 Preliminary Construction Planning and Cost ································· 12-1
12.1 Preliminary Construction Planning ···························································· 12-1 12.1.1 General ······························································································· 12-1 12.1.2 Contents of Rehabilitation Works for Selected 10 Bridges ················· 12-1 12.1.3 Working Space under Girder ······························································ 12-5 12.1.4 Temporary Cofferdam ········································································· 12-7 12.1.5 Traffic Control ···················································································· 12-8 12.1.6 Temporary Construction Yard ····························································· 12-8 12.1.7 Construction Schedule ········································································ 12-11 12.2 Preliminary Cost Estimate ······································································· 12-12 12.2.1 General ······························································································· 12-12 12.2.2 Conditions for the Cost Estimate ························································ 12-12 12.2.3 Project Cost Estimate ·········································································· 12-21
CHAPTER 13 Economic Analysis ········································································ 13-1 13.1 Introduction ······························································································· 13-1 13.1.1 Objective & Condition ········································································ 13-1 13.1.2 The Concept of Economic Analysis for Bridge Rehabilitation &
Reinforcement ····················································································· 13-1 13.1.3 Project Costs & Benefits for Bridges Rehabilitation & Reinforcement
··············································································································· 13-1 13.2 Social Costs & Benefits ············································································· 13-3 13.2.1 Work Flow for Estimation of Social Costs & Benefits ······················· 13-3 13.2.2 Trial Results of Social Costs & Benefits ············································· 13-6 13.3 Scenario Setting ························································································· 13-8 13.4 Results of Social Cost & Benefits in Each Bridge ····································· 13-10 13.5 Works Cost for Each Bridge ······································································ 13-15 13.5.1 Assumptions for Economic Evaluation················································· 13-15 13.5.2 Results of Work Cost for 10 Selected Bridges ···································· 13-15 13.6 Economic Evaluation ················································································· 13-16

THE STUDY ON CAPACITY DEVELOPMENT IN BRIDGE REHABILITATION FINAL REPORT PLANNING, MAINTENANCE AND MANAGEMENT BASED ON 29 BRIDGES FEBRUARY 2007 OF NATIONAL HIGHWAY NETWORK IN COSTA RICA
JICA STUDY TEAM ORIENTAL CONSULTANTS CO., LTD. CHODAI CO., LTD vi
13.6.1 Economic Internal Rate of Return (EIRR) and Net Present Value (NPV) ························································································ 13-16
13.6.2 Sensitivity Analysis ············································································ 13-19 CHAPTER 14 Management and Development of Information System ················· 14-1
14.1 Existing Information System for Roads and Bridges ································· 14-1 14.1.1 Existing Organization for Information Management····························· 14-1 14.1.2 System Administration and Development ··········································· 14-2 14.1.3 Summery of the Existing System ························································ 14-3 14.2 Information System Development ···························································· 14-6 14.2.1 Environments of the Information System Development ····················· 14-6 14.2.2 Network Environment ········································································· 14-7 14.2.3 Road and Bridge Management System ··············································· 14-9 14.2.4 System Development ·········································································· 14-10 14.3 Bridge Management System (BMS) ························································· 14-13 14.3.1 Objective of the System ······································································ 14-13 14.3.2 Concept of the System ········································································ 14-13 14.3.3 System Component ············································································· 14-15 14.3.4 Tools for the System Development ····················································· 14-15 14.3.5 Environment for the System Operation ··············································· 14-16 14.3.6 System Operation ················································································ 14-16 14.3.7 Process of a Data Registration ···························································· 14-19 14.4 Operation for the System ·········································································· 14-22 14.4.1 Movement of the Display ···································································· 14-22 14.4.2 Flow of the System Operation ····························································· 14-24 14.5 Bridge Report System ·············································································· 14-26 14.5.1 Introduction ························································································· 14-22 14.5.2 Forms ·································································································· 14-22
CHAPTER 15 Tools for Bridge Maintenance Management ·································· 15-1
15.1 Introduction ······························································································ 15-1 15.2 Bridge Inspection Manuals ······································································ 15-2 15.3 Operation Manual for Bridge Management System ································· 15-3 15.4 Guideline for Bridge Maintenance ··························································· 15-4
CHAPTER 16 Technical Support for Environmental and Social Considerations···· 16-1 16.1 Technical Support for the Implementation of Initial Environmental
Examination ······························································································ 16-1 16.1.1 Introduction ························································································· 16-1 16.1.2 Brief Summary of Baseline Environment ··········································· 16-3 16.1.3 Environmental Scoping and Screening ··············································· 16-9 16.1.4 Environmental Organizations and Laws ·············································· 16-24 16.2 Technical Support for ToR Development of Environmental Study ············ 16-32 16.2.1 ToR of Relevant Environmental Study ················································ 16-32 16.2.2 Selected Mitigation Measures ····························································· 16-45 16.2.3 Environmental Management Plan (EMP) ············································ 16-48
THE STUDY ON CAPACITY DEVELOPMENT IN BRIDGE REHABILITATION FINAL REPORT PLANNING, MAINTENANCE AND MANAGEMENT BASED ON 29 BRIDGES FEBRUARY 2007 OF NATIONAL HIGHWAY NETWORK IN COSTA RICA
JICA STUDY TEAM ORIENTAL CONSULTANTS CO., LTD. CHODAI CO., LTD vii
16.2.4 Environmental Monitoring ·································································· 16-48 16.2.5 Conclusion ·························································································· 16-49 16.3 Stakeholder Meeting ···················································································· 16-50 16.3.1 Introduction ························································································· 16-50 16.3.2 Summary of Stakeholder Meeting························································· 16-51
CHAPTER 17 Conclusions and Recommendations ·············································· 17-1 17.1 Conclusions ································································································ 17-1 17.1.1 Study Recap ························································································ 17-1 17.1.2 General Descriptions ··········································································· 17-2 17.2 Recommendations ······················································································ 17-2 17.2.1 Overview of the Study ········································································ 17-2 17.2.2 Deflection of Pre-stressed Concrete Box Girder Bridges ······················ 17-5
17.2.3 Ensuring Sufficient Funding for Bridge Rehabilitation &
Reinforcement ····················································································· 17-6 17.2.4 Environmental and Social Considerations············································· 17-6
■ APPENDIX
APPENDIX 1 DRAWINGS ················································································ A1-1
APPENDIX 2 ENVIRONMENTAL STANDARDS (NOISE / VIBRATION) IMPLEMENTED IN OTHER COUNTRIES ···························· A2-1
APPENDIX 3 CONSTRUCTION PLANNING AND COST ESTIMATE ··········· A3-1
3.1 CONSTRUCTION SCHEDULE ················································· A3-1
3.2 PROJECT COST ········································································· A3-9
APPENDIX 4 ECONOMIC ANALYSIS ···························································· A4-1
4.1 RESULTS OF TRAFFIC ESTIMATION ···································· A4-1
4.2 VOC PARAMETER ···································································· A4-3
4.3 DETOUR ROUTE & BRIDGE LOCATION ······························· A4-4
4.4 SCENARIO FOR 10 SELECTED BRIDGE ······························· A4-14
4.5 RESULTS OF WORK COSTS FOR 10 SELECTED BRIDGE ···· A4-24
4.6 EIRR & NPV AT 12% FOR 10 SELECTED BRIDGE ··············· A4-25
THE STUDY ON CAPACITY DEVELOPMENT IN BRIDGE REHABILITATION FINAL REPORT PLANNING, MAINTENANCE AND MANAGEMENT BASED ON 29 BRIDGES FEBRUARY 2007 OF NATIONAL HIGHWAY NETWORK IN COSTA RICA
JICA STUDY TEAM ORIENTAL CONSULTANTS CO., LTD. CHODAI CO., LTD viii
TABLES LIST Table 2.1.1. Time Difference between Maximum and Minimum Temperature ·· 2-4 Table 2.2.1. Land Use (1972, 1999) ··································································· 2-7 Table 2.2.2. Provincial Data ··············································································· 2-12 Table 2.2.3. Index for Social Condition with Neighbor Country························ 2-12 Table 2.2.4. Change of GDP and GDP per capita in 1991-2004························· 2-14 Table 2.2.5. Index for Economical Condition with Neighbor Country ··············· 2-14 Table 2.2.6. Exports FOB by Main Products······················································ 2-14 Table 2.2.7. Exports FOB by Main Countries ···················································· 2-15 Table 2.2.8. Vehicle Registration in 1994-2004·················································· 2-16 Table 2.3.1. Road Classification Definition and its Length ································ 2-17 Table 2.3.2. Traffic Volume for Each Class of National Road···························· 2-23 Table 2.3.3. Traffic Volume on Each Route························································ 2-24 Table 2.3.4. Tones of Goods Deal with the Port ················································· 2-25 Table 2.3.5. Human Resource for Road Pavement Rehabilitation Plan in MOPT················································································· 2-27 Table 3.1.1. Number of Bridges in Study Route················································· 3-2 Table 3.2.1. Dead Load ······················································································ 3-3 Table 3.2.2. Table of Coefficients γ and β (AASHTO :Table 3.22.1A) ·············· 3-6 Table 3.2.3. Standard of Steel············································································· 3-7 Table 3.2.4. Standard of Concrete ······································································ 3-7 Table 3.3.1. Inspection Item ··············································································· 3-11 Table 3.3.2. Number of Evaluation and Condition of Members ························· 3-12 Table 3.3.3.(1) Item of Detailed Inspection····························································· 3-13 Table 3.3.3.(2) Item of Detailed Inspection····························································· 3-13 Table 4.1.1. Capacity Gap Assessment Score Sheet (Individual Level) ············· 4-2 Table 4.1.2. Capacity Gap Assessment Score Sheet (Organizational Level) ······ 4-3 Table 4.1.3. Capacity Gap Assessment Score Sheet (Institutional and Social Level) ············································································ 4-3 Table 4.2.1. List of Staff in Bridge Department ················································· 4-4 Table 4.2.2. Budget of MOPT for FY 2005 ························································ 4-5 Table 4.2.3. Budget of Bridge Department Budget for FY 2005 ························ 4-5 Table 4.2.4. Level of Salaries for MOPT Officials (FY 2005)···························· 4-5 Table 4.2.5. Road-related Training Programme by MOPT (2005) ····················· 4-5 Table 4.2.6. Availability of Intellectual Assets for Bridge Maintenance and Understanding of Preventive Maintenance by Officials of Bridge Department of MOPT ································· 4-6 Table 4.2.7. Direction of Road Conservation of CONAVI ································· 4-6 Table 4.2.8. Direction of Engineering of CONAVI ············································ 4-7 Table 4.2.9. Direction of Works of CONAVI ····················································· 4-7 Table 4.2.10. Budget of CONAVI for FY 2006 ···················································· 4-8 Table 4.2.11. Level of Salaries for CONAVI Officials (FY 2005)························ 4-8 Table 4.2.12. Training Programme by CONAVI (2005)······································· 4-9 Table 4.2.13. Understanding of Preventive Maintenance by

THE STUDY ON CAPACITY DEVELOPMENT IN BRIDGE REHABILITATION FINAL REPORT PLANNING, MAINTENANCE AND MANAGEMENT BASED ON 29 BRIDGES FEBRUARY 2007 OF NATIONAL HIGHWAY NETWORK IN COSTA RICA
JICA STUDY TEAM ORIENTAL CONSULTANTS CO., LTD. CHODAI CO., LTD ix
Officials of CONAVI ······································································ 4-9 Table 4.2.14. Institutional Framework for Road and Bridge Maintenance ··········· 4-9 Table 4.2.15. Institutional Framework for Road Design······································· 4-10 Table 4.2.16. Institutional Framework for Bridge Design ···································· 4-10 Table 4.2.17. Institutional Framework for Procurement Regulations ··················· 4-10 Table 4.2.18. Regulations on Public Bidding and Direct Contract by CONAVI··· 4-11 Table 4.2.19. Understanding of Preventive Maintenance by Officials of MOF and MIDEPLAN······························································· 4-12 Table 4.2.20. Training Programme by LANNAME (2005) ·································· 4-13 Table 4.2.21. Availability of Intellectual Assets for Bridge Maintenance and Understanding of Preventive Maintenance by LANNAME Bridge Engineers··················································· 4-13 Table 4.2.22. Availability of Intellectual Assets for Bridge Maintenance and Understanding of Preventive Maintenance by CFIA Member Engineers······································ 4-14 Table 4.2.23. Availability of Intellectual Assets for Bridge Maintenance and Understanding of Preventive Maintenance by Domestic and Foreign Contractors ······················· 4-15 Table 4.2.24. Institutional Framework for Traffic Regulations····························· 4-15 Table 4.2.25. Maximum Allowable Weight and Lengths for Trucks ···················· 4-16 Table 4.3.1. Results of Capacity Gap Assessment Score Sheet (Individual Level) ································································· 4-18 Table 4.3.2. Results of Capacity Gap Assessment Score Sheet (Organizational Level)···································································· 4-19 Table 4.3.3. Results of Capacity Gap Assessment Score Sheet (Institutional and Social Level)······················································· 4-21 Table 5.1.1. Alternative Basic Approaches for Bridge Maintenance ·················· 5-2 Table 5.2.1. Preliminary List of Modular Projects (Individual Level)················ 5-7 Table 5.2.2. Preliminary List of Modular Projects (Organizational Level)········· 5-7 Table 5.2.3. Preliminary List of Modular Projects (Institutional and Social Level)······················································· 5-8 Table 6.1.1. List of 5 Integrated Modular Projects ············································· 6-2 Table 6.1.2. 5 Groups for BMCG and Related Modular Projects ······················· 6-3 Table 6.1.3. Proposed Responsibility Assignment for Working Groups of BMCG ··········································································· 6-3 Table 6.1.4. Incentives for BMCG Members······················································ 6-4 Table 6.2.1. Preliminary Project Design Matrix (Modular Project 1) ················· 6-5 Table 6.2.2. Preliminary Project Design Matrix (Modular Project 2) ················· 6-5 Table 6.2.3. Preliminary Project Design Matrix (Modular Project 3) ················· 6-6 Table 6.2.4. Preliminary Project Design Matrix (Modular Project 4) ················· 6-6 Table 6.2.5. Preliminary Project Design Matrix (Modular Project 5) ················· 6-7 Table 6.2.6. Preliminary WBS for Modular Project 1 (Task 1)··························· 6-8 Table 6.2.7. Preliminary WBS for Modular Project 1 (Task 2)··························· 6-8 Table 6.2.8. Preliminary WBS for Modular Project 1 (Task 3)··························· 6-8 Table 6.2.9. Preliminary WBS for Modular Project 1 (Task 4)··························· 6-9

THE STUDY ON CAPACITY DEVELOPMENT IN BRIDGE REHABILITATION FINAL REPORT PLANNING, MAINTENANCE AND MANAGEMENT BASED ON 29 BRIDGES FEBRUARY 2007 OF NATIONAL HIGHWAY NETWORK IN COSTA RICA
JICA STUDY TEAM ORIENTAL CONSULTANTS CO., LTD. CHODAI CO., LTD x
Table 6.2.10. Preliminary WBS for Modular Project 2 (Task 1)··························· 6-9 Table 6.2.11. Preliminary WBS for Modular Project 2 (Task 2)··························· 6-9 Table 6.2.12. Preliminary WBS for Modular Project 3 (Task 1)··························· 6-10 Table 6.2.13. Preliminary WBS for Modular Project 3 (Task 2)··························· 6-10 Table 6.2.14. Preliminary WBS for Modular Project 3 (Task 3)··························· 6-10 Table 6.2.15. Preliminary WBS for Modular Project 4 (Task 1)··························· 6-11 Table 6.2.16. Preliminary WBS for Modular Project 4 (Task 2)··························· 6-11 Table 6.2.17. Preliminary WBS for Modular Project 4 (Task 3)··························· 6-11 Table 6.2.18. Preliminary WBS for Modular Project 5 (Task 1)··························· 6-12 Table 6.2.19. Preliminary WBS for Modular Project 5 (Task 1)··························· 6-12 Table 6.3.1. Staff Required for Direction of Bridges of MOPT·························· 6-21 Table 6.3.2. Staff Required for Department of Bridge Construction of CONAVI ······························································· 6-23 Table 6.3.3. Requirements of Budget for Organizational Cost for Bridge Maintenance········································································ 6-25 Table 6.3.4. Requirements of Budget for Total Cost for Bridge Maintenance···· 6-25 Table 6.3.5. Requested Budget for Direction of Bridges of MOPT for Financial Year 2007··································································· 6-26 Table 6.3.6. Requested Budget for CONAVI for Financial Year 2007 ··············· 6-26 Table 6.4.1. Performance Indicators in Monitoring············································ 6-28 Table 6.4.2. Monitoring Plan for Modular Project 1··········································· 6-30 Table 6.4.3. Monitoring Plan for Modular Project 2··········································· 6-30 Table 6.4.4. Monitoring Plan for Modular Project 3··········································· 6-31 Table 6.4.5. Monitoring Plan for Modular Project 4··········································· 6-31 Table 6.4.6. Monitoring Plan for Modular Project 5··········································· 6-32 Table 6.5.1. Varieties of Domestic Public Relations Activities··························· 6-33 Table 7.2.1. Technical Training Program···························································· 7-3 Table 7.2.2. Schedule for Technical Training Program······································· 7-4 Table 7.2.3. Links with Modules and Integrated Projects··································· 7-5 Table 7.3.1. Participation: Seminar1-1 ······························································· 7-7 Table 7.3.2. Participation: Seminar1-2 ······························································· 7-8 Table 7.3.3. Participation: Seminar2-1 ······························································· 7-10 Table 7.3.4. Participation: Seminar2-2 ······························································· 7-11 Table 7.3.5. Participation: Seminar3 ·································································· 7-11 Table 7.3.6. Participation: Seminar4-1 ······························································· 7-12 Table 7.3.7. Participation: Seminar4-2 ······························································· 7-12 Table 7.3.8. Participation: Seminar5 ·································································· 7-15 Table 7.3.9. Schedule of Study in Chile ····························································· 7-19 Table 7.3.10. Participants from Costa Rica for BMS Study in Chile···················· 7-19 Table 7.3.11. Counterpart from Chile for BMS Study·········································· 7-19 Table 7.3.12. JICA Counterpart Training Program··············································· 7-25 Table 7.3.13. Participants in PPP seminar ···························································· 7-26 Table 7.3.14. PPP International Seminar Program················································ 7-27

THE STUDY ON CAPACITY DEVELOPMENT IN BRIDGE REHABILITATION FINAL REPORT PLANNING, MAINTENANCE AND MANAGEMENT BASED ON 29 BRIDGES FEBRUARY 2007 OF NATIONAL HIGHWAY NETWORK IN COSTA RICA
JICA STUDY TEAM ORIENTAL CONSULTANTS CO., LTD. CHODAI CO., LTD xi
Table 8.1.1. Outline of Study Route ··································································· 8-1 Table 8.1.2. Bridge Type of Study Bridges························································· 8-4 Table 8.1.3. Inventory of 29 Study Bridges ························································ 8-5 Table 8.2.1. Bridge Inspection Sheet ·································································· 8-8 Table 8.3.1. Inspection Result of 29 Bridges······················································ 8-12 Table 8.3.2. Evaluation of Inspection Result of Each Inspection Item ··············· 8-13 Table 8.3.3. Evaluation of Inspection Result in Each Route······························· 8-15 Table 8.3.4. Evaluation of Inspection Result on Type of Bridge ························ 8-16 Table 8.3.5. Cause of Damage and Condition of Damage ·································· 8-18 Table 8.3.6. Present Condition of River in 29 Bridge Sites ································ 8-19 Table 8.3.7.(1) Evaluation of Stability of River Bed (Route 1)······························· 8-20 Table 8.3.7.(2) Evaluation of Stability of River Bed (Route 2)······························· 8-20 Table 8.3.7.(3) Evaluation of Stability of River Bed (Route 4&218)······················ 8-21 Table 8.3.7.(4) Evaluation of Stability of River Bed (Route 32)····························· 8-21 Table 8.3.8. Equations of Calculation of Maximum Flow Volume and Flow Velocity ··········································································· 8-22 Table 8.3.9. Required Free Space ······································································· 8-23 Table 8.3.10. Performance Specification of 29 Study Bridges ····························· 8-24 Table 8.3.11. Type of Pier and Foundation of 29 Study Bridges ·························· 8-26 Table 9.2.1. Scale of Relative Importance ·························································· 9-4 Table 9.2.2. Calculation Method for Weight······················································· 9-5 Table 9.2.3. Weight of Damage for Pavement ···················································· 9-5 Table 9.2.4. Weight of Damage for Barrier ························································ 9-5 Table 9.2.5. Weight of the Parts in the Group of Accessories····························· 9-6 Table 9.2.6. Weight of the Parts in the Group of Super Structure of Steel Bridge································································· 9-6 Table 9.2.7. Weight of the Bridge Component ··················································· 9-6 Table 9.3.1. Weight of Evaluation Items for Steel Bridge ·································· 9-8 Table 9.3.2. Weight of Evaluation Items for Concrete Bridge ···························· 9-9 Table 9.3.3. Deficiency Rate of 29 Bridges························································ 9-10 Table 9.4.1. Bridges Selected for Further Rehabilitation Studies ······················· 9-11 Table 10.1.1. Correlation between Deteriorating Mechanism and Peripheral Factor······································································ 10-3 Table 10.1.2. Correlation between Mechanism, Factors, Indicators
and Characteristics of Deterioration ·············································· 10-3 Table 10.1.3. General Types of Concrete Deterioration ······································· 10-4 Table 10.1.4. Deterioration System for Concrete Member ··································· 10-5 Table 10.1.5. Deterioration System and Its Suitable Inspection Method ·············· 10-10 Table 10.1.6. Summary of Results of Visual Inspection for 10 Bridges ··············· 10-18 Table 10.1.7. Results of Visual Inspection for Rio Aranjuez Bridge (Route No.1 Bridge No.2)······························································· 10-19 Table 10.1.8. Results of Visual Inspection for Rio Abangares Bridge (Route No.1, Bridge No.3······························································· 10-20 Table 10.1.9. Results of Visual Inspection for Rio Azufrado Bridge (Route No.1, Bridge No.7······························································· 10-21
THE STUDY ON CAPACITY DEVELOPMENT IN BRIDGE REHABILITATION FINAL REPORT PLANNING, MAINTENANCE AND MANAGEMENT BASED ON 29 BRIDGES FEBRUARY 2007 OF NATIONAL HIGHWAY NETWORK IN COSTA RICA
JICA STUDY TEAM ORIENTAL CONSULTANTS CO., LTD. CHODAI CO., LTD xii
Table 10.1.10. Results of Visual Inspection for Rio Puerto Nuevo Bridge (Route No.2 Bridge No.12······························································ 10-22 Table 10.1.11. Results of Visual Inspection for Rio Nuevo Bridge (Route No.2, Bridge No.16····························································· 10-23 Table 10.1.12. Results of visual inspection for Rio Chirripo Bridge (Route No.4, Bridge No.17)···························································· 10-24 Table 10.1.13. Results of Visual Inspection for Rio Sarapiqui Bridge (Route No.4, Bridge No.19····························································· 10-25 Table 10.1.14. Results of Visual Inspection for Rio Sucio Bridge (Route No.32, Bridge No.20··························································· 10-26 Table 10.1.15. Results of Visual Inspection for Rio Chirripo Bridge (Route No.32, Bridge No.26)·························································· 10-27 Table 10.1.16. Results of Visual Inspection for Rio Torres Bridge (Route No.218, Bridge No.29)························································ 10-28 Table 10.1.17. Static Modulus of Elasticity Tests of Concrete in Compression ····· 10-30 Table 10.1.18. Result of Carbonation Test······························································ 10-31 Table 10.1.19. Outline of Analysis and Method of Evaluation······························· 10-33 Table 10.1.20. Analysis Results of Deck Slab························································ 10-34 Table 10.1.21. Analysis Result of Superstructure (Truss Frame) ··························· 10-35 Table 10.1.22. Analysis Result of Superstructure (Steel I Beam Girder)················ 10-36 Table 10.1.23. Analysis Result of Superstructure (Concrete Girder)······················ 10-37 Table 10.1.24. Working Stress of PC Box Girder in Rio Chirripo Bridge ( No.17) 10-38 Table 10.1.25. Analysis Result of Substructure (1) ················································ 10-39 Table 10.1.26. Analysis Result of Substructure (2)) ··············································· 10-40 Table 10.1.27. Analysis Result of Stability of Foundation (Spread Foundation)···· 10-41 Table 10.1.28. Analysis Result of Stability of Foundation (Pile Foundation) ········ 10-42 Table 10.2.1. Contents of Loading Test ································································ 10-47 Table 10.2.2. Loading Test Item··········································································· 10-48 Table 10.2.3. Schedule of Bridge Loading Tests ·················································· 10-51 Table 10.2.4. Static Load Case for No.17 Bridge ················································· 10-55 Table 10.2.5. Detailed Time Schedule of Static Load Test ··································· 10-56 Table 10.2.6. Truck Dimensions and Weight Used for Loading ··························· 10-57 Table 10.2.7. Measurement Points for Stress························································ 10-62 Table 10.2.8. Static Load Case for No.26 Chirripo Bridge··································· 10-67 Table 10.2.9. Classification of vehicles for Traffic Survey··································· 10-69 Table 10.2.10. Detailed Time Schedule of Test ······················································ 10-70 Table 10.2.11. Truck Dimensions and Weight Used for Loading ··························· 10-71 Table 10.2.12. Comparison of Deflection on No.17 Chirripo Bridge ····················· 10-73 Table 10.2.13. Comparison of Deflection at Center of Span ·································· 10-75 Table 10.2.14. Comparison of Stress at Lower Flange at Center of Span··············· 10-75 Table 10.2.15. Comparison of Deflection for Running Speed································ 10-77 Table 10.2.16. Frequency of Stress at Connection part of Sole Plate ················· 10-82 Table 10.2.17. Frequency of Stress at Connection part of Sway Bracing 1 ············ 10-83 Table 10.2.18. Frequency of Stress at Connection part of Sway Bracing 2 ············ 10-83 Table 10.2.19. Frequency of Stress at Connection part of Lateral ······················ 10-83 Table 10.2.20. Traffic Volume during Test (Both Sides) ········································ 10-84 Table 10.2.21. Cumulated Vehicle Number Occurs Damage·································· 10-86
THE STUDY ON CAPACITY DEVELOPMENT IN BRIDGE REHABILITATION FINAL REPORT PLANNING, MAINTENANCE AND MANAGEMENT BASED ON 29 BRIDGES FEBRUARY 2007 OF NATIONAL HIGHWAY NETWORK IN COSTA RICA
JICA STUDY TEAM ORIENTAL CONSULTANTS CO., LTD. CHODAI CO., LTD xiii
Table 10.2.22. Cumulated Vehicle Number Occurs Damage·································· 10-87 Table 10.3.1. River Conditions of 10 Bridges ······················································ 10-89 Table 10.3.2. Bridge Sites and Geological Survey Companies····························· 10-90 Table 10.4.1. Deterioration Mechanisms and Repair Plan···································· 10-95 Table 10.4.2. Major Reinforcement Methods ······················································· 10-97 Table 10.4.3. Remedial Measure Classified by Target Performance Level··········· 10-98 Table 10.4.4. Target level of Performance of Bridge············································ 10-99 Table 10.4.5. Evaluation System for Select Method············································· 10-100 Table 10.4.6. Evaluation Results for Each Method ·············································· 10-101 Table 10.4.7. Summary of Proposed Methods for 10 Bridges ······························ 10-102 Table 10.4.8. Rehabilitation Methods for Main Girder ········································ 10-103 Table 10.4.9. Substructures Required for Reinforcement ····································· 10-103 Table 10.4.10. Rehabilitation, Reinforcement and Improvement Plan for Rio Aranjuez Bridge (No.2) ······················································ 10-105 Table 10.4.11. Rehabilitation, Reinforcement and Improvement Plan for Rio Abangares Bridge (No.3)···················································· 10-106 Table 10.4.12. Rehabilitation, Reinforcement and Improvement Plan for Rio Azufrado Bridge (No.7)······················································ 10-107 Table 10.4.13. Rehabilitation, Reinforcement and Improvement Plan for Rio Puerto Nuevo Bridge (No.12)············································· 10-108 Table 10.4.14. Rehabilitation, Reinforcement and Improvement Plan for Rio Nuevo Bridge (No.16) ························································ 10-109 Table 10.4.15. Rehabilitation, Reinforcement and Improvement Plan for Rio Chirripo Bridge (No.17) ····················································· 10-110 Table 10.4.16. Rehabilitation, Reinforcement and Improvement Plan for Rio Sarapiqui Bridge (No.19) ··················································· 10-111 Table 10.4.17. Rehabilitation, Reinforcement and Improvement Plan for Rio Sucio Bridge (No.20) ························································· 10-112 Table 10.4.18. Rehabilitation, Reinforcement and Improvement Plan for Rio Chirripo Bridge (No.26) ····················································· 10-113 Table 10.4.19. Rehabilitation, Reinforcement and Improvement Plan for Rio Torres Bridge (No.29) ························································ 10-114 Table 11.1.1. Remedial Methods for Deck Slab ··················································· 11-1 Table 11.1.2. Repair Methods for Deck Slab························································ 11-2 Table 11.1.3. Reinforce Methods for Deck Slab··················································· 11-3 Table 11.1.4. Comparison of Applicable Method ········································· 11-5 Table 11.1.5. Characteristics of Typical Carbon Fiber Sheet································ 11-8 Table 11.1.6. Comparison of Slab Conditions ······················································ 11-14 Table 11.2.1. Reinforcement Method for Floor System ······································· 11-15 Table 11.2.2. Reinforcement Method for Floor System ······································· 11-15 Table 11.2.3. Comparison of Stringer··································································· 11-21 Table 11.2.4. Comparison of Cross Beam ···························································· 11-21 Table 11.3.1. Reinforcement Method for Main Girder ········································· 11-22 Table 11.3.2. Reinforce Methods for RC Deck Bridge········································· 11-23 Table 11.3.3. Reinforce Methods for PC I Beam Bridge······································ 11-24 Table 11.3.4. Reinforce Methods for PC Box Bridge··········································· 11-24

THE STUDY ON CAPACITY DEVELOPMENT IN BRIDGE REHABILITATION FINAL REPORT PLANNING, MAINTENANCE AND MANAGEMENT BASED ON 29 BRIDGES FEBRUARY 2007 OF NATIONAL HIGHWAY NETWORK IN COSTA RICA
JICA STUDY TEAM ORIENTAL CONSULTANTS CO., LTD. CHODAI CO., LTD xiv
Table 11.3.5. Reinforce Methods for Steel Bridge ··············································· 11-25 Table 11.3.6. Comparison of Reinforcement for Deck slab of No.7 Azufrado Bridge····································································· 11-27 Table 11.3.7. Preliminary Comparison of Reinforcement for Main Girder of No.7 Azufrado Bridge ································································ 11-27 Table 11.3.8. Comparison of Reinforcement for Main Girder of No.7 Azufrado Bridge ································································ 11-28 Table 11.3.9. Comparison of Reinforcement for Main Girder of No.12 Puerto Nuevo Bridge ······················································· 11-29 Table 11.3.10. Comparison of Reinforcement for Main Girder of No.16 Nuevo Bridge··································································· 11-30 Table 11.3.11. Comparison of Reinforcement Method for PC I Beam ······················· 11-30 Table 11.3.12. Result of Stress by FRP Bonding Method for Main Beam of No. 29 Torres Bridge ·································································· 11-30 Table 11.3.13. Stress for PC Box Girders of No.17 Chirripo Bridge and No.20 Sucio Bridge························· 11-31 Table 11.3.14 Deflections at Center due to Several Forces ··································· 11-32 Table 11.3.15 Comparison of Main Structure Conditions for Truss Bridges ········· 11-48 Table 11.3.16. Comparison of Main Structure Conditions for Steel I Beam Bridges ······································································ 11-48 Table 11.3.17. Comparison of Main Structure Conditions for RC Deck Bridges ············································································ 11-49 Table 11.3.18. Comparison of Main Structure Conditions for PC I Beam Bridges ········································································· 11-50 Table 11.4.1. Purpose of Accessories ··································································· 11-51 Table 11.4.2. Open Joint (Drain type Expansion Joint) ········································ 11-54 Table 11.4.3. Closed Joint (Un-Drain type)·························································· 11-55 Table 11.5.1. Seismic Performance Level ···························································· 11-57 Table 11.5.2. Component of Prevention System for Bridge Collapse ·················· 11-57 Table 11.5.3. Protuberant Structure ······································································ 11-61 Table 11.5.4. Structure Connecting Girder and Substructure ······························· 11-62 Table 11.5.5. Structure Connecting Two Girders·················································· 11-63 Table 11.5.6. Structure limiting Excessive Displacement····································· 11-64 Table 11.5.7. Reinforcement of Hinge of Cantilever Bridge ································ 11-65 Table 11.5.8. Existing Condition and Required Seat Length································ 11-67 Table 11.5.9. Selected Girder Connection ···························································· 11-68 Table 11.5.10. Type of Unseating Prevention Structure ········································· 11-69 Table 11.6.1. Reinforcement Methods for Transversal Beam······························· 11-71 Table 11.6.2. Reinforcement Methods for Pier····················································· 11-72 Table 11.6.2. Reinforcement Methods for Pier····················································· 11-72 Table 11.6.3. Comparison of Method of Reinforcement Method for Beam ········· 11-73 Table 11.6.4. Comparison of Method of Reinforcement Method for Pier ············ 11-74 Table 11.6.5. The Load Carrying Capacity of Transversal Beam························· 11-75 Table 11.6.6. The Load Carrying Capacity of Transversal Beam
after reinforcing ··········································································· 11-75 Table 11.6.7(a). The Load Carrying Capacity of Pier at Existing Condition ············ 11-76 Table 11.6.7(b). The Load Carrying Capacity of Pier at Existing Condition ············ 11-77
THE STUDY ON CAPACITY DEVELOPMENT IN BRIDGE REHABILITATION FINAL REPORT PLANNING, MAINTENANCE AND MANAGEMENT BASED ON 29 BRIDGES FEBRUARY 2007 OF NATIONAL HIGHWAY NETWORK IN COSTA RICA
JICA STUDY TEAM ORIENTAL CONSULTANTS CO., LTD. CHODAI CO., LTD xv
Table 11.6.7(c). The Load Carrying Capacity of Pier at Existing Condition ············ 11-78 Table 11.6.8. Load Carrying Capacity of Pier after reinforce······························· 11-79 Table 11.7.1. Reinforce Methods for Footing······················································· 11-80 Table 11.7.2. Existing Condition of Spread Foundation
and Required Size of Footing ························································ 11-87 Table 11.7.3. Load Carrying Capacity of the Footing at Existing Condition
and after Reinforcement ································································ 11-88 Table 11.7.4. Axial Reaction Force of Piles and Required Number of Piles ········ 11-89 Table 11.7.5. Condition of Load Carrying Capacity of Footing ··························· 11-89 Table 11.7.6. Method for Riverbed Protection ····················································· 11-92 Table 11.7.7. Relation between the Weight of Concrete Block and the Velocity ·· 11-93 Table 11.7.8. Condition of Scouring and Countermeasures·································· 11-94 Table 11.8.1. Sumamry of Rehabilitation, reinforcement and Improvement
Method for Superstructures of 10 selected Bridges ······················· 11-95 Table 11.8.2. Sumamry of Rehabilitation, reinforcement and Improvement
Method for Substructures of 10 selected Bridges ·························· 11-95 Table 12.1.1. Bridge No.2 Rio Aranjuez (R.1) ·················································· 12-1 Table 12.1.2. Bridge No. 3 Rio Abangares (R.1)·················································· 12-2 Table 12.1.3. Bridge No. 7 Rio Azufrado (R.1)················································· 12-2 Table 12.1.4. Puente Bridge No. 12 Rio Puerto Nuevo (R.2) ···························· 12-3 Table 12.1.5. Bridge No. 16 Rio Nuevo (R.2) ··················································· 12-3 Table 12.1.6. Bridge No. 17 Rio Chirripo (R.4) ················································ 12-4 Table 12.1.7. Bridge No. 19 Rio Sarapiqui (R.4) ·············································· 12-4 Table 12.1.8. Bridge No. 20 Rio Sucio (R.32)··················································· 12-4 Table 12.1.9. Bridge No. 26 Rio Chirripo (R.32) ·············································· 12-4 Table 12.1.10. Bridge No. 29 Rio Torres (R.218)··················································· 12-5 Table 12.1.11. Construction Period of 10 Bridges·················································· 12-11 Table 12.2.1. Unit Hourly Salaries of Labors ······················································· 12-13 Table 12.2.2. Unit Prices of Major Materials ······················································· 12-14 Table 12.2.3. Price Comparison of Major Materials between Costa Rica & Japan········································································· 12-14 Table 12.2.4. Unit Hourly Cost of Major Equipment ··········································· 12-16 Table 12.2.5. Modification Coefficient of Number of Labor································ 12-18 Table 12.2.6. Comparison of Unit Hourly Salary between Costa Rica & Japan··· 12-18 Table 12.2.7. Unit Costs of Major Work Items····················································· 12-19 Table 12.2.8. Breakdown of Work Item “Removal of Expansion Joint” ·············· 12-20 Table 12.2.9. Percentage of Transportation Costs among Sample Projects ·········· 12-21 Table 12.2.10. Rent Cost for Temporary Construction Yard··································· 12-22 Table 13.1.1. Basic Concepts of Costs & Benefits ··············································· 13-2 Table 13.2.1. The Results of estimation formula of traffic volume ······················ 13-4 Table 13.4.1. The Scenario in without case for Rio Sucio···································· 13-10 Table 13.4.2. Results of Social Costs/Benefits for Rio Sucio······························· 13-11 Table 13.4.3. The Scenario in without case for Rio Aranjuez······························· 13-13 Table 13.4.4. Results of Social Costs/Benefits for Rio Aranjuez·························· 13-13 Table 13.5.1. Project Economic Cost Evaluation Assumptions ···························· 13-15
THE STUDY ON CAPACITY DEVELOPMENT IN BRIDGE REHABILITATION FINAL REPORT PLANNING, MAINTENANCE AND MANAGEMENT BASED ON 29 BRIDGES FEBRUARY 2007 OF NATIONAL HIGHWAY NETWORK IN COSTA RICA
JICA STUDY TEAM ORIENTAL CONSULTANTS CO., LTD. CHODAI CO., LTD xvi
Table 13.5.2. Rough Costs of each Items ····························································· 13-16 Table 13.6.1. Scenario for Chirripo Bridge (NO.26) ············································ 13-17 Table 13.6.2. Cost/Benefit for Chirripo Bridge (NO.26) ······································ 13-18 Table 13.6.3. Scenario for Chirripo Bridge (NO.26) ············································ 13-19 Table 13.6.4. Scenario for Aranjuez Bridge (NO.2) ············································· 13-19 Table 13.6.5. Scenario for Azufrado Bridge (NO.7)············································· 13-19 Table 14.1.1. System Inventory of the Public Works Division in MOPT ············· 14-4 Table 14.1.2. System Inventory in CONAVI ························································ 14-5 Table 14.2.1. Environment of the System Development ······································ 14-6 Table 14.2.2. Existing Systems for Road Management ········································ 14-9 Table 14.2.3. Total Road Management System (SIGVI) (1/2)······························ 14-10 Table 14.2.3. Total Road Management System (SIGVI) (2/2)······························ 14-11 Table 14.3.1. Required Image File Size································································ 14-16 Table 16.1.1. Selected 10 Bridges ········································································ 16-2 Table 16.1.2. Registered Indian Reserves in Costa Rica ······································ 16-7 Table 16.1.3. Annual Number of Dengue Cases reported to the Ministry of Health ·········································································· 16-8 Table 16.1.4. Initial Environmental Examination (Site 2: Aranjuez River Bridge) ······················································ 16-10 Table 16.1.5. Initial Environmental Examination (Site 3: Abangares River Bridge) ···················································· 16-11 Table 16.1.6. Initial Environmental Examination (Site 7: Azufrazo River Bridge) ······················································ 16-12 Table 16.1.7. Initial Environmental Examination (Site 12: Puerto Nuevo River Bridge)············································· 16-14 Table 16.1.8. Initial Environmental Examination (Site 16: Nuevo River Bridge) ························································ 16-15 Table 16.1.9. Initial Environmental Examination (Site 17: Chirripo River Bridge) ····················································· 16-16 Table 16.1.10. Initial Environmental Examination (Site 19: Sarapiqui River Bridge) ··················································· 16-17 Table 16.1.11. Initial Environmental Examination (Site 20: Sucio River Bridge)·························································· 16-19 Table 16.1.12. Initial Environmental Examination (Site 26: Chirripo River-R32 Bridge) ············································· 16-20 Table 16.1.13. Initial Environmental Examination (Site 29: Torres River Bridge)························································· 16-21 Table 16.1.14. Summary of Potential Negative Impacts········································· 16-23 Table 16.1.15. Breakdown of Each Potential Impacts ············································ 16-23 Table 16.1.16 Noise Environmental Standard in Costa Rica (dBA) ······················ 16-26 Table 16.1.17 Environmental Standard (Air Quality, ug/m3)································· 16-27 Table 16.1.18 Water Quality Standard for Level 1 purpose··································· 16-27 Table 16.2.1. Rehabilitation Policy for Selected 10 Bridges ································ 16-34 Table 16.2.2. Summary of Major Construction Activities ···································· 16-36

THE STUDY ON CAPACITY DEVELOPMENT IN BRIDGE REHABILITATION FINAL REPORT PLANNING, MAINTENANCE AND MANAGEMENT BASED ON 29 BRIDGES FEBRUARY 2007 OF NATIONAL HIGHWAY NETWORK IN COSTA RICA
JICA STUDY TEAM ORIENTAL CONSULTANTS CO., LTD. CHODAI CO., LTD xvii
Table 16.2.3. Categorization of Rehabilitation Measures by Construction Activity Type ························································ 16-36 Table 16.2.4 Major Environmental Tasks to be required for the Environmental Study··························································· 16-39 Table 16.2.5. Descriptions of Current Environment Condition ···························· 16-39 Table 16.2.6. Field Environmental Survey (Bio-Physical) ··································· 16-40 Table 16.2.7. Field Environmental Survey (Socio-Cultural) ································ 16-40 Table 16.2.8. Impact Assessment Study ······························································· 16-40 Table 16.2.9. Project Categorization (tentative) ··················································· 16-41 Table 16.2.10. Project-Specific Mitigation Measures for Air Quality ···················· 16-45 Table 16.2.11. Water-Resources Protection-related Mitigative Measures ·············· 16-45 Table 16.2.12. Soil Protection related Mitigative Measures ··································· 16-46 Table 16.2.13. Noise Mitigation Measures····························································· 16-46 Table 16.2.14. Mitigation Measures for the Protection of Flora/Fauna ·················· 16-47 Table 16.3.1. Schedule of Stakeholder Meeting ··················································· 16-50 Table 16.3.2. Homepage for Stakeholder Meeting ··············································· 16-50 Table 16.3.3. Outline of 1st Stakeholder Meeting ················································ 16-51 Table 16.3.4. Categorization of Questions···························································· 16-51 Table 16.3.5. Outline of combined 2nd Stakeholder Meeting ······························ 16-52 Table 16.3.6. Outline of combined 3rd Stakeholder Meeting ······························· 16-52
THE STUDY ON CAPACITY DEVELOPMENT IN BRIDGE REHABILITATION FINAL REPORT PLANNING, MAINTENANCE AND MANAGEMENT BASED ON 29 BRIDGES FEBRUARY 2007 OF NATIONAL HIGHWAY NETWORK IN COSTA RICA
JICA STUDY TEAM ORIENTAL CONSULTANTS CO., LTD. CHODAI CO., LTD xviii
FIGURES LIST Figure 1.1. Location of the Targeted Bridged (29 Bridges)···························· 1-2 Figure 1.2. Objectives and Components of the Study ······································· 1-3 Figure 1.3. Schematic of the Components and Process of the Study················· 1-4 Figure 1.4. Study Workflow and Schedule························································ 1-7 Figure 2.1.1. Location Map of Costa Rica ··························································· 2-1 Figure 2.1.2. River Profile of Major River in Costa Rica ···································· 2-2 Figure 2.1.3. Annual Medium Temperatures Distribution Map ··························· 2-3 Figure 2.1.4. Annual Average Precipitation Map ················································· 2-4 Figure 2.1.5. Fault Line Map of Costa Rica························································· 2-5 Figure 2.1.6. Map of the Earthquake on April 22, 1991. Centered on the Caribbean Side······················································ 2-6 Figure 2.2.1. Overview of Land in Costa Rica····················································· 2-7 Figure 2.2.2. Land Use Map in Costa Rica in 1992 ············································· 2-8 Figure 2.2.3. Population Change since 1980························································ 2-9 Figure 2.2.4. Province in Costa Rica and Bridge Location ·································· 2-9 Figure 2.2.5. Cantons in Costa Rica····································································· 2-10 Figure 2.2.6. Population Share in Each Province················································· 2-11 Figure 2.2.7. Population Density ········································································· 2-11 Figure 2.2.8. Population Change in Each Province based on 1974 ······················ 2-11 Figure 2.2.9. Change of GDP and GDP per capita in 1991-2004························· 2-13 Figure 2.2.10. Relationship between Car Owner Ship and GDP per capita ··········· 2-16 Figure 2.3.1. Road Network (Each Category) in Costa Rica································ 2-19 Figure 2.3.2. Road Network (Each Category) in the Great Metropolitan Area ···· 2-20 Figure 2.3.3. Road Network in San Jose Province ··············································· 2-20 Figure 2.3.4. Road Network in Cartago Province ················································ 2-20 Figure 2.3.5. Road Network in Alajuela Province················································ 2-21 Figure 2.3.6. Road Network in Guanacaste Province··········································· 2-21 Figure 2.3.7. Road Network in Heredia Province ················································ 2-21 Figure 2.3.8. Road Network in Limon Province ·················································· 2-21 Figure 2.3.9. Road Network in Puntarenas Province ··········································· 2-22 Figure 2.3.10. Traffic Volume on Each Route in Costa Rica·································· 2-23 Figure 2.3.11. Traffic Volume on Each Route························································ 2-24 Figure 2.3.12. Outline of Stream for National Road Maintenance························· 2-26 Figure 2.3.13. Outline of Stream for Rural Road Maintenance······························ 2-26 Figure 2.3.14 Road Pavement Condition in National Road ·································· 2-27 Figure 3.1.1. Distribution of Bridge Width ·························································· 3-2 Figure 3.1.2. Distribution of Bridge Length························································· 3-3 Figure 3.2.1. Standard HS Trucks (Costa Rica) ··················································· 3-4 Figure 3.2.2. Standard H Trucks (Costa Rica) ····················································· 3-4 Figure 3.2.3. Lane Loading (AASHTO) ······························································ 3-4 Figure 3.2.4. Road Width····················································································· 3-6
THE STUDY ON CAPACITY DEVELOPMENT IN BRIDGE REHABILITATION FINAL REPORT PLANNING, MAINTENANCE AND MANAGEMENT BASED ON 29 BRIDGES FEBRUARY 2007 OF NATIONAL HIGHWAY NETWORK IN COSTA RICA
JICA STUDY TEAM ORIENTAL CONSULTANTS CO., LTD. CHODAI CO., LTD xix
Figure 3.2.5. Structure Clearance········································································· 3-7 Figure 3.2.6. Clearance under the Girder ····························································· 3-7 Figure 3.2.7. PCI Standard Bridge Beams (Costa Rica) ····································· 3-8 Figure 4.1.1. Image Illustration of Capacity Gap Assessment (Individual Level) ········································································· 4-1 Figure 4.2.1. Possible Career Development for Bridge Engineers ······················· 4-14 Figure 4.3.1. Rader Chart for Individual-level Capacity (1) ································ 4-18 Figure 4.3.2. Rader Chart for Individual-level Capacity (2) ································ 4-18 Figure 4.3.3. Rader Chart for Organizational-level Capacity (1) ························· 4-20 Figure 4.3.4. Rader Chart for Organizational-level Capacity (2) ························· 4-20 Figure 4.3.5. Rader Chart for Organizational-level Capacity (3) ························· 4-20 Figure 4.3.6. Rader Chart for Institutional-level Capacity ··································· 4-21 Figure 4.3.7. Rader Chart for Social-level Capacity ············································ 4-21 Figure 4.4.1. Overall Problem Tree······································································ 4-22 Figure 4.4.2. Problem Tree for Insufficient Bridge Maintenance Capacity·········· 4-23 Figure 4.4.3. Problem Tree for Weak Organizational Structure on Bridge Maintenance········································································ 4-23 Figure 4.4.4. Problem Tree for Insufficient Budget for Bridge Maintenance······· 4-24 Figure 4.4.5. Problem Tree for Enforcement of Laws, Regulations and Standards·················································································· 4-24 Figure 4.4.6. Problem Tree for Insufficient Knowledge Management on Bridge Maintenance··································································· 4-25 Figure 5.1.1. Overall Problem Tree and Alternative Approaches························· 5-4 Figure 6.2.1. Preliminary Plan of Operations for Modular Project 1 ··················· 6-14 Figure 6.2.2. Preliminary Plan of Operations for Modular Project 2 ··················· 6-15 Figure 6.2.3. Preliminary Plan of Operations for Modular Project 3 ··················· 6-16 Figure 6.2.4. Preliminary Plan of Operations for Modular Project 4 ··················· 6-17 Figure 6.2.5. Preliminary Plan of Operations for Modular Project 5 ··················· 6-18 Figure 6.3.1. Target Number of Bridges to be Periodically Inspected·················· 6-20 Figure 6.3.2. Organizational Structure of Current Bridge Design Department of MOPT in 2006 ························································ 6-22 Figure 6.3.3. Organizational Structure of Upgraded Direction of Bridges of MOPT in 2007 ·························································· 6-22 Figure 6.3.4. Proposed Organizational Structure of Direction of Bridges of MOPT ······································································· 6-22 Figure 6.3.5. Organizational Structure of Current CONAVI in 2006 ··················· 6-23 Figure 6.3.6. Organizational Structure of CONAVI in 2007 ································ 6-23 Figure 6.3.7. Proposed Organizational Structure of New Department of Bridge Conservation of CONAVI ··························· 6-23 Figure 6.3.8. Image of Position of BMCG··························································· 6-24 Figure 6.4.1. Target Institutional Level of Capacity Development ······················ 6-29 Figure 7.3.1. Outline of Key Activities : Pillar-1 ················································· 7-6 Figure 7.3.2. Outline of Key Activities : Pillar-2 ················································· 7-9
THE STUDY ON CAPACITY DEVELOPMENT IN BRIDGE REHABILITATION FINAL REPORT PLANNING, MAINTENANCE AND MANAGEMENT BASED ON 29 BRIDGES FEBRUARY 2007 OF NATIONAL HIGHWAY NETWORK IN COSTA RICA
JICA STUDY TEAM ORIENTAL CONSULTANTS CO., LTD. CHODAI CO., LTD xx
Figure 7.3.3. Outline of Key Activities : Pillar-3 ················································· 7-15 Figure 7.3.4. Outline of Key Activities : Pillar-4 ················································· 7-18 Figure 7.3.5. Condition of Road Network in Chile ·············································· 7-22 Figure 7.3.6. Bridge Classification by Material in Chile······································ 7-22 Figure 7.3.7. Visual Output of BMS in Chile······················································· 7-24 Figure 8.1.1. Location of Study Bridge (Route 1)················································ 8-2 Figure 8.1.2. Location of Study Bridge (Route 2)················································ 8-2 Figure 8.1.3. Location of Study Bridge (Route 32)·············································· 8-3 Figure 8.1.4. Location of Study Bridge (Route 4,218)········································· 8-3 Figure 8.2.1. Example of Measurement Sheet for Dimensions of Bridge ············ 8-9 Figure 8.2.2. Standard of Viewpoint ···································································· 8-10 Figure 8.3.1. Minimum Span Length ··································································· 8-22 Figure 8.3.2. Required Minimum Span Length···················································· 8-23 Figure 8.3.3. Seat Length····················································································· 8-25 Figure 8.3.4. Distance between Anchor Bolt of Bearing and Substructure Top Edge························································································· 8-25 Figure 8.3.5. Traffic Volume at Location of 29 Study Bridges····························· 8-27 Figure 9.2.1. Hierarchies of Bridge Components················································· 9-3 Figure 10.1.1. Process of Inspection and Repair/Reinforcement Work·················· 10-1 Figure 10.1.2. Work-Breakdown and Flow for Identification of Deteriorating Mechanism ······························································· 10-2 Figure 10.1.3. Deterioration System Chart for Concrete Member ························· 10-6 Figure 10.1.4. Schematic of Representation Biggest Impact Point of River ·········· 10-9 Figure 10.1.5. Result of Compression Test ···························································· 10-30 Figure 10.1.6. Result of Carbonation Test······························································ 10-32 Figure 10.1.7. Deformation of Box Girder in Rio Chirripo Bridge (No.17) ·········· 10-32 Figure 10.2.1. Location Map of Bridges ································································ 10-47 Figure 10.2.2. No.17 Chirripó Bridge ···································································· 10-48 Figure 10.2.3. No.26Chirripó Bridge ····································································· 10-49 Figure 10.2.4. Loading Test Flow ·········································································· 10-50 Figure 10.2.5. Evaluation Sequence for Load Carrying Capacity ·························· 10-52 Figure 10.2.6. Deflection Measurement Points for No.17 Chirripó Bridge············ 10-53 Figure 10.2.7. Deflection Measurement Equipment ·············································· 10-53 Figure 10.2.8. Deflection Measurement Method for No.17 Bridge ······················· 10-54 Figure 10.2.9. Deflection Measurement tool for No.17 Bridge······························ 10-54 Figure 10.2.10. Static Load Case for No.17 Bridge ················································· 10-55 Figure 10.2.11. Situation of Loading Test on No.17 Bridge ···································· 10-58 Figure 10.2.12. Evaluation Sequence for Durability for Fatigue ····························· 10-59 Figure 10.2.13. Deflection Measurement Points for No.26 Chirripo Bridge············ 10-60 Figure 10.2.14. Deflection Measurement Tool for No.26 Chirripo Bridge ·············· 10-60 Figure 10.2.15. Easy Affected Parts by Fatigue for Steel Bridge ····························· 10-61 Figure 10.2.16. Gauge Setting Point on No.26 Chirripo Bridge ······························ 10-63 Figure 10.2.17. Hot Spot Stress ··············································································· 10-64 Figure 10.2.18. Stress and Strain ············································································· 10-64
THE STUDY ON CAPACITY DEVELOPMENT IN BRIDGE REHABILITATION FINAL REPORT PLANNING, MAINTENANCE AND MANAGEMENT BASED ON 29 BRIDGES FEBRUARY 2007 OF NATIONAL HIGHWAY NETWORK IN COSTA RICA
JICA STUDY TEAM ORIENTAL CONSULTANTS CO., LTD. CHODAI CO., LTD xxi
Figure 10.2.19. Strain Gauge ··················································································· 10-65 Figure 10.2.20. Detail of Strain Gauge ···································································· 10-65 Figure 10.2.21. Data Recording System ·································································· 10-65 Figure 10.2.22. Scaffolding for Working Stage························································ 10-66 Figure 10.2.23. Strain Gauge Setting ······································································· 10-66 Figure 10.2.24. Strain Gauge Setting ······································································· 10-67 Figure 10.2.25. Static Load Cases for Bridge No. 26··············································· 10-68 Figure 10.2.26. Image of Moving Load Test on No.27 Chirripo Bridge ·················· 10-69 Figure 10.2.27. Situation of Loading Test on No.26 Bridge ···································· 10-72 Figure 10.2.28. Comparison of Deflection on No.17 Chirripo Bridge ····················· 10-73 Figure 10.2.29. Static Load Case for No.26 Chirripo Bridge··································· 10-74 Figure 10.2.30. Comparison of Deflections Between Actual and Models················ 10-76 Figure 10.2.31. Comparison of Stress Between Actual and Models ························ 10-76 Figure 10.2.32. Stress and Deflection for HS20+25% by Revised··························· 10-77 Figure 10.2.33. Stress Measurement Point for Evaluation of Fatigue ······················ 10-78 Figure 10.2.34. Evaluation Sequence of Durability for Fatigue······························· 10-79 Figure 10.2.35. Image of Rain Flow Method··························································· 10-80 Figure 10.2.36. Cumulated Repeated Number ························································· 10-81 Figure 10.2.37. Image of Cumulated Degree of Fatigue ·········································· 10-82 Figure 10.2.38. Traffic Volume during Test (Both Sides) ········································ 10-85 Figure 10.2.39. Life Expectancy and Cumulated Traffic Volume ···························· 10-85 Figure 10.2.40. Growth and Cumulated Traffic Volume for 5 axles Truck ·············· 10-86 Figure 10.3.1. Scoring of Riverbed on No.16 Nuevo Bridge ································· 10-88 Figure 10.3.2. Erosion of Backfill on No.12 Puerto Nuevo Bridge ······················· 10-88 Figure 10.3.3. Large Rock Deposit on No.17 Chirripo River Bridge····················· 10-89 Figure 10.3.4. Large Rock Deposit on No.20 Sucio River Bridge ························· 10-89 Figure 10.3.5. Drilling in Bridge Sites ··································································· 10-90 Figure 10.3.6. Soil Samples of Boring by Geological Survey································ 10-91 Figure 11.1.1. Selection Flow for Repair or Reinforcement for Deck Slab ··········· 11-4 Figure 11.1.2. Damages on Deck Slab of Truss Bridge ········································· 11-6 Figure 11.1.3. Crack on Deck Slab of No.19 Sarapiqui Bridge ····························· 11-6 Figure 11.1.4. Stress/Strain Curve for Carbon Fiber Sheet ···································· 11-8 Figure 11.1.5. Design Flow for FRP Bonding on Deck Slab ································· 11-9 Figure 11.1.6. Moment and Stress due to Dead Load ············································ 11-10 Figure 11.1.7. Moment and Stress due to Live Load ············································· 11-10 Figure 11.1.8. Stress due to Dead and Live Loads ················································· 11-11 Figure 11.1.9. Design Flow for Increasing Slab Thickness···································· 11-12 Figure 11.1.10. Moment and Stress due to Dead Load ············································ 11-13 Figure 11.1.11. Moment and Stress due to Live Load ············································· 11-13 Figure 11.1.12. Stress due to Dead and Live Loads ················································· 11-14 Figure 11.2.1. Design Flow for stringer by Beam Continuation Method ··············· 11-17 Figure 11.2.2. Bending Moment ············································································ 11-18 Figure 11.2.3. Stress due to Dead Load and Live Loads········································ 11-18 Figure 11.2.4. Design Flow for the Cross Beam by Member Section Increase································································ 11-19

THE STUDY ON CAPACITY DEVELOPMENT IN BRIDGE REHABILITATION FINAL REPORT PLANNING, MAINTENANCE AND MANAGEMENT BASED ON 29 BRIDGES FEBRUARY 2007 OF NATIONAL HIGHWAY NETWORK IN COSTA RICA
JICA STUDY TEAM ORIENTAL CONSULTANTS CO., LTD. CHODAI CO., LTD xxii
Figure 11.2.5. Stress due to Dead Load and Live Loads········································ 11-20 Figure 11.3.1. Additional Member for Reinforcement of Aranjues Bridge············ 11-26 Figure 11.3.2 Deflection of No.17 Chirripo Bridge ·············································· 11-31 Figure 11.3.3 Deflection of No.20 Sucio Bridge ·················································· 11-32 Figure 11.3.4 Comparison of Deflection for No.20 Sucio Bridge························· 11-33 Figure 11.3.5 Comparison of Deflection for No.20 Sucio Bridge························· 11-33 Figure 11.3.6. Design Flow for Steel Truss Bridge Reinforced by Diagonal Member Addition ······················································· 11-35 Figure 11.3.7. Design Flow for Steel Truss Bridge Reinforced by Member Section Increase··························································· 11-36 Figure 11.3.8. Stress due to Dead Load and Live Loads········································ 11-37 Figure 11.3.9. Stress due to Dead Load and Live Loads········································ 11-38 Figure 11.3.10 Design Flow for Steel I Beam Bridge Reinforced by External Cable Addition ··························································· 11-39 Figure 11.3.11. Stress due to Dead Load, Live Load and Prestress ························· 11-40 Figure 11.3.12. Design Flow for RC Girder Reinforced by FRP Bonding and Steel Plate Bonding······································· 11-41 Figure 11.3.13. Design Flow for RC Girder Reinforced by Section Increasing······· 11-42 Figure 11.3.14. Design Flow for RC Girder, which Required Deck Slab Increase, by FRP or Steel Plate Bonding ································ 11-43 Figure 11.3.15. Stress due to Dead Load ································································· 11-44 Figure 11.3.16. Stress due to Live Load ·································································· 11-44 Figure 11.3.17. Composite Stress due to Dead and Live Loads······························· 11-45 Figure 11.3.18. Reinforcing Area of Girder ····························································· 11-45 Figure 11.3.19. Design Flow for PC I Beam Reinforced by FRP Bonding·············· 11-46 Figure 11.3.20. Image of Tensile Stress of PC I······················································· 11-47 Figure 11.4.1. The detail of waterproofing ···························································· 11-53 Figure 11.4.2. Condition of Expansion Joint ························································· 11-53 Figure 11.4.3. Example of Method for Fixing New Expansion Joint····················· 11-56 Figure 11.5.1. Seat Length of Girder ····································································· 11-58 Figure 11.5.2. Distance to Calculate the Seat Length ············································ 11-59 Figure 11.5.3. Seat Length for Skewed Bridge ···················································· 11-59 Figure 11.5.4. Required Dimensions for Concrete Bracket ··································· 11-60 Figure 11.5.5. Minimum Height of Bracket··························································· 11-60 Figure 11.5.6. Required Dimensions for Concrete Bracket ··································· 11-65 Figure 11.5.7. Reinforcement for Hinge of Cantilever Bridge······························· 11-66 Figure 11.7.1. Design Process of Expanding of Footing········································ 11-82 Figure 11.7.2. Design Process of Increased Number of Pile ·································· 11-83 Figure 11.7.3. Judgment of Bearing Capacity························································ 11-84 Figure 11.7.4. Scouring of Riverbed around Pier··················································· 11-91 Figure 11.7.5. Relation between Size of Stone for Protection and Velocity··········· 11-93 Figure 12.1.1. Scaffold Type-A·············································································· 12-5 Figure 12.1.2. Scaffold Type-B·············································································· 12-6 Figure 12.1.3. Scaffold Type-C·············································································· 12-6 Figure 12.1.4. Scaffold Type-D·············································································· 12-7 Figure 12.1.5. Structure Model of Cofferdam························································ 12-7
THE STUDY ON CAPACITY DEVELOPMENT IN BRIDGE REHABILITATION FINAL REPORT PLANNING, MAINTENANCE AND MANAGEMENT BASED ON 29 BRIDGES FEBRUARY 2007 OF NATIONAL HIGHWAY NETWORK IN COSTA RICA
JICA STUDY TEAM ORIENTAL CONSULTANTS CO., LTD. CHODAI CO., LTD xxiii
Figure 12.1.6. General Layout of Traffic Control ·················································· 12-8 Figure 12.1.7. Layout of Standard Type Construction Yard ··································· 12-9 Figure 12.1.8. Model Layout of Storage Area on No. 20 Bridge (Rio Sucio) ········ 12-10 Figure 12.1.9. Model Layout of Storage Area on No. 29 Bridge (Rio Torres) ······· 12-10 Figure 13.1.1. Image of Costs & Benefits Appearance ·········································· 13-2 Figure 13.2.1. Estimation Sequence of Social Costs & Benefits···························· 13-3 Figure 13.2.2. VOC Results··················································································· 13-4 Figure 13.2.3. TTC Results···················································································· 13-5 Figure 13.2.4. Detour Route for Rio Sucio (R.32) ················································· 13-5 Figure 13.2.5. The Results of Social Loss of 1 day Traffic Closure in Rio Sucio (R.32)···························································· 13-7 Figure 13.2.6. Social Loss of 1 day Traffic Closure for 10 Bridges ······················· 13-7 Figure 13.2.7. Location of Rio Toress (R.218)······················································· 13-8 Figure 13.1.9. Social Loss of 1-dir Traffic Restriction in 1 day for 10 Bridges ················································································· 13-8 Figure 13.3.1. Considerable Types of Scenario······················································ 13-9 Figure 13.4.1. Rio Sucio (R.32) ············································································· 13-10 Figure 13.4.2. Appearance of Social Cost & Benefits for Rio Sucio (R.32) ·········· 13-11 Figure 13.4.3. Rio Aranjuez (R.2)·········································································· 13-12 Figure 13.4.4. Detour Route for Rio Aranjuez (R.2)·············································· 13-12 Figure 13.4.5. Appearance of Social Cost & Benefits for Rio Sucio (R.32) ·········· 13-14 Figure 13.4.6. Results of Net Social Benefits for 10 selected Bridge ···················· 13-14 Figure 13.6.1. Results of EIRR·············································································· 13-17 Figure 13.6.2. Results of NPV, Beneficial Rank for Rehabilitation & Reinforcement ············································································ 13-17 Figure 14.1.1. Management of Road Information·················································· 14-1 Figure 14.1.2. Flow of Information in the Bridge Department ······························ 14-1 Figure 14.1.3. Organization for System Development and Administration············ 14-2 Figure 14.1.4. Organization of the CONAVI ························································· 14-3 Figure 14.2.1. Network in the Public Works Division ··········································· 14-7 Figure 14.2.2. Network Connection between the MOPT, the CONAVI and the Local Governments ·························································· 14-8 Figure 14.2.3. Existing System of the MOPT, the CONAVI and the Local Governments and System Development Plan ······················· 14-12 Figure 14.3.1. Concept of the BMS ······································································· 14-13 Figure 14.3.2. Hardware Components of the System············································· 14-15 Figure 14.3.3. Concept of the Bridge Management System··································· 14-17 Figure 14.3.4. Organization for the construction of the Data Base ························ 14-18 Figure 14.3.5. Process of the Inventory Data Registration····································· 14-19 Figure 14.3.6. Process of the Inspection Data Registration···································· 14-20 Figure 14.3.7. Process of the relevant data registration ········································· 14-20 Figure 14.4.1. Movement of the Display (1/2)······················································· 14-22 Figure 14.4.1. Movement of the Display (2/2)······················································· 14-23 Figure 14.4.2. Retrieval of the Bridge Inventory Data··········································· 14-24 Figure 14.4.3. Retrieval of the Bridge Inspection Data·········································· 14-24

THE STUDY ON CAPACITY DEVELOPMENT IN BRIDGE REHABILITATION FINAL REPORT PLANNING, MAINTENANCE AND MANAGEMENT BASED ON 29 BRIDGES FEBRUARY 2007 OF NATIONAL HIGHWAY NETWORK IN COSTA RICA
JICA STUDY TEAM ORIENTAL CONSULTANTS CO., LTD. CHODAI CO., LTD xxiv
Figure 14.4.4. Evaluation of the Bridge Deficiency··············································· 14-25 Figure 14.4.5. Prioritization for Bridge Repair ······················································ 14-25 Figure 14.4.6. Cost Estimation for the Bridge Repair ············································ 14-25 Figure 15.2.1. Items supported by the Inspection Manual ····································· 15-2 Figure 15.3.1. Items supported by the Operation Manual for BMS ······················· 15-3 Figure 15.4.1. Items described the Guideline for the Bridge Maintenance ············ 15-4 Figure 16.1.1. Nationwide Environmental Protected Areas in Costa Rica ············· 16-5 Figure 16.1.2. Nationwide Traffic Accidents (1996 - 2004)··································· 16-6 Figure 16.1.3. Time Variation of CO2 Emission Loading from Costa Rica············ 16-6 Figure 16.2.1. Noise Measurement Results (East Side of Neak Loeung, June/03/05)········································· 16-41 Figure 16.2.2. Traffic Volume Count (East Side of Neak Loeung, East Side, June/03/05)······················ 16-41 Figure 16.2.3. Environmental Field Survey Selection Flowchart··························· 16-42 Figure 16.2.4. Noise Prediction Study Result ························································ 16-42 Figure 16.2.5. Environmental Impact Assessment Study Selection Diagram········· 16-43 Figure 16.2.6. Flowchart of Environmental Scoping/Screening Process ··············· 16-44
THE STUDY ON CAPACITY DEVELOPMENT IN BRIDGE REHABILITATION FINAL REPORT PLANNING, MAINTENANCE AND MANAGEMENT BASED ON 29 BRIDGES FEBRUARY 2007 OF NATIONAL HIGHWAY NETWORK IN COSTA RICA
JICA STUDY TEAM ORIENTAL CONSULTANTS CO., LTD. CHODAI CO., LTD xxv
ABBREVIATIONS AASHTO: American Association of State Highway and Transportation Officials AHP: Analytic of Hierarchy Process ASTM: American Standard for Testing and Materials BBS: Budget Breakdown Structure BCIE: Banco Centroamericano de Integración Económica (Central American Bank for Economic Integration) BID: Banco Interamericano de Desarrollo (Interamerican Development Bank) BMCG: Bridge Management Consulting Group BMS: Bridge Management System CABEI: Central America Bank of Economic Integration CAD: Computer-Aided Design CAFTA: Central American Free Trade Agreement CB: Capacity Building CBS: Cost Breakdown Structure CCTU: Costa Rican Chamber of United Transporters CD: Capacity Development CFIA: Costa Rica Federation of Engineers and Architects CGA: Capacity Gap Assessment CIC: Civil Engineers’ Association CIDA: Canadian International Development Agency CNC: Consejo Nacional de Concesiones (National Concession Counsel) CONAVI: Consejo Nacional de Vialidad (National Road Counsel) CRC: Costa Rica Colone C/P: Counter Part EIA: Environmental Impact Assessment EIRR: Economic Internal Rate of Return FOB: Free on Board FRP: Fiber Reinforced Plastic FS: Feasibility Study FTAA: Free Trade of the American Agreement FY: Financial Year GDP: Gross Domestic Product GIS: Geographic Information System GPS: Global Positioning System GTZ: Gesellschaft f r Technische Zusammenarbeit (The German Agency for Technical Co-operation) HDM-III: Highway Design and Maintenance Standard Model version III HWL: High Water Level ICE: Instituto Costarricense de Electricidad (Costa Rican Institute of Electricity) IDB: Inter-American Development Bank IEE: Initial Environmental Examination
THE STUDY ON CAPACITY DEVELOPMENT IN BRIDGE REHABILITATION FINAL REPORT PLANNING, MAINTENANCE AND MANAGEMENT BASED ON 29 BRIDGES FEBRUARY 2007 OF NATIONAL HIGHWAY NETWORK IN COSTA RICA
JICA STUDY TEAM ORIENTAL CONSULTANTS CO., LTD. CHODAI CO., LTD xxvi
JBIC: Japan Bank for International Cooperation JICA: Japan International Cooperation Agency JPY: Japanese Yen KfW: Kreditanstalt fur Wiederaufbau LAN: Local Area Network LANAMME: Laboratorío Nacional de Materiales y Modelos Estructurales (National Laboratory of Materials and Structural Models) LWL: Low Water Level MIDEPLAN: Ministerio de Planificación Nacional y Política Ecónomica (Ministry of National Planning and Economic Politics) MINAE: Ministerio del Ambiente y Energía (Ministry of Environment and Energy) M/M: Minutes of Meeting MOF: Ministry of Finance MOH: Ministry of Health MOPT: Ministerio de Obras Publicas y Transportes
(Ministry of Public Works and Transport) MOPTT: Ministry of Public Works, Transport and Telecommunications (Chile) NPV: Net Present Value O&M: Operation and Maintenance OD: Origin and Destination OJT: On-the-Job Training PC: Prestressed Concrete PCM: Project Cycle Management PDM: Project Design Matrix PO: Plan of Operation PPP: Plan Puebla Panamá RAM: Responsibility Assignment Matrix RC: Reinforced Concrete RICAM: International Mesoamerica Road Network ROW: Right of Way SCF: Standard Conversion Factor SETENA: Secretaría Técnica del Ambiente (Technical Secretary of the Environment) SICA: Sistema de la Integración Centroamericana (System of the Central American Integration) SIECA: Secretaría de Integración Económica Centroamericana (Economic Integration Secretary of Central American) SIGVI: Sistema Integrado de Gestión Vial (Integrated System of Administration Vial) SINA: Ministry of Environment and National System of Environmental
Organizations SINAC : Sistema Nacional de Áreas de Conservación (The National System of Conservation Areas) SOP: Secretary of Publics Works (Mexico) SPEM: Sistema de Programacion y Ejecucion del Mantenimiento Vial (System of Programming and Execution of the Maintenance Vial)
THE STUDY ON CAPACITY DEVELOPMENT IN BRIDGE REHABILITATION FINAL REPORT PLANNING, MAINTENANCE AND MANAGEMENT BASED ON 29 BRIDGES FEBRUARY 2007 OF NATIONAL HIGHWAY NETWORK IN COSTA RICA
JICA STUDY TEAM ORIENTAL CONSULTANTS CO., LTD. CHODAI CO., LTD xxvii
STP: Standard Penetration Test SWRF: Shadow Wage Rate Factor TA: Technical Assistance TOR: Terms of Reference TPD: Traffic per Day TTC: Time Travel Cost UNDP: United Nations Development Program USD: US Dollar VOC: Vehicle Operation Cost WAN: Wide Area Network WBS: Work Breakdown Structure WS: Workshop Costa Rica Colones (¢): Unit of Costa Rica Currency: $US 1 approx.¢516 as of August 2006
THE STUDY ON CAPACITY DEVELOPMENT IN BRIDGE REHABILITATION FINAL REPORT PLANNING, MAINTENANCE AND MANAGEMENT BASED ON 29 BRIDGES FEBRUARY 2007 OF NATIONAL HIGHWAY NETWORK IN COSTA RICA
JICA STUDY TEAM ORIENTAL CONSULTANTS CO., LTD. CHODAI CO., LTD xxviii

THE STUDY ON CAPACITY DEVELOPMENT IN BRIDGE REHABILITATION FINAL REPORT PLANNING, MAINTENANCE AND MANAGEMENT BASED ON 29 BRIDGES FEBRUARY 2007 OF NATIONAL HIGHWAY NETWORK IN COSTA RICA
JICA STUDY TEAM ORIENTAL CONSULTANTS CO., LTD. CHODAI CO., LTD
1-1
CHAPTER 1 OUTLINE OF THE STUDY
1.1 Background of the Study
Costa Rica is approximately 51,100 km2 in area with a population of 430,000 people. It is bordered by Nicaragua to the north, Panama to the south, the Caribbean Sea to the east, and the Pacific Ocean to the west.
Costa Rica is one of the member countries of “the System of Central American Integration (SICA)” and is expected to play an important role in developing and integrating the economy in region. In order to extend the economic integration, it is essential to support the improvement of the infrastructures in the transport sector. In particular, improvement of the road network is selectively listed in the prioritized subjects in the Puebla-Panama Plan (PPP) which is a region-wide economic-development program ratified in Mesoamerica. The PPP allows that overland transportation would be promoted because it is advantageous in Central America in terms of its cost effectiveness when compared with other transportation modes such as by-air or by-ship.
It is clearly stated in the National Development Plan (2002-2006) of Costa Rica that the “acceleration of the economic growth” is an integral component of the plan and that bridge construction and the rehabilitation of trunk roads are particularly key elements to be strategically prioritized in the construction and conservation of the road network.
The road network in Costa Rica has a total length of over 37,300 km and comprises international trunk roads running through the country, which geographically link Central America. Most of the 1,330 bridges on the national highway (7,775km) suffer from severe deterioration due to material aging. Insufficient and inadequate maintenance works have accelerated this damage and have led to the decline in bridge performance. The PPP’s regional code requires a particular load carrying capacity for international trunk roads. This is not achieved satisfactorily to sustain the necessary capacity for land transportation as a main commercial route. In addition, due to the fact that the country is geologically situated right on the volcanic belt, it is critical for the bridge maintenance in Costa Rica to take into account disaster prevention measures which are aimed at protecting the road infrastructure from natural disasters such as eruptions and earthquakes. Accordingly, it is essential that an assistance program be rendered for improving the capacity of the bridge management, which comprises comprehensively inspection, the diagnosis of deterioration of existing bridges as well as the planning for reinforcement and rehabilitation of bridges.
Given the preceding, the Government of Costa Rica has requested the Government of Japan to execute a feasibility study for the implementation of a bridge management system, and to select 30 bridges as a part of the Feasibility Study. In response to the above request, it has been decided to conduct “The Study on Capacity Development in Bridge Rehabilitation Planning, Maintenance and Management” based on 29 bridges on National Highway Network in Costa Rica.
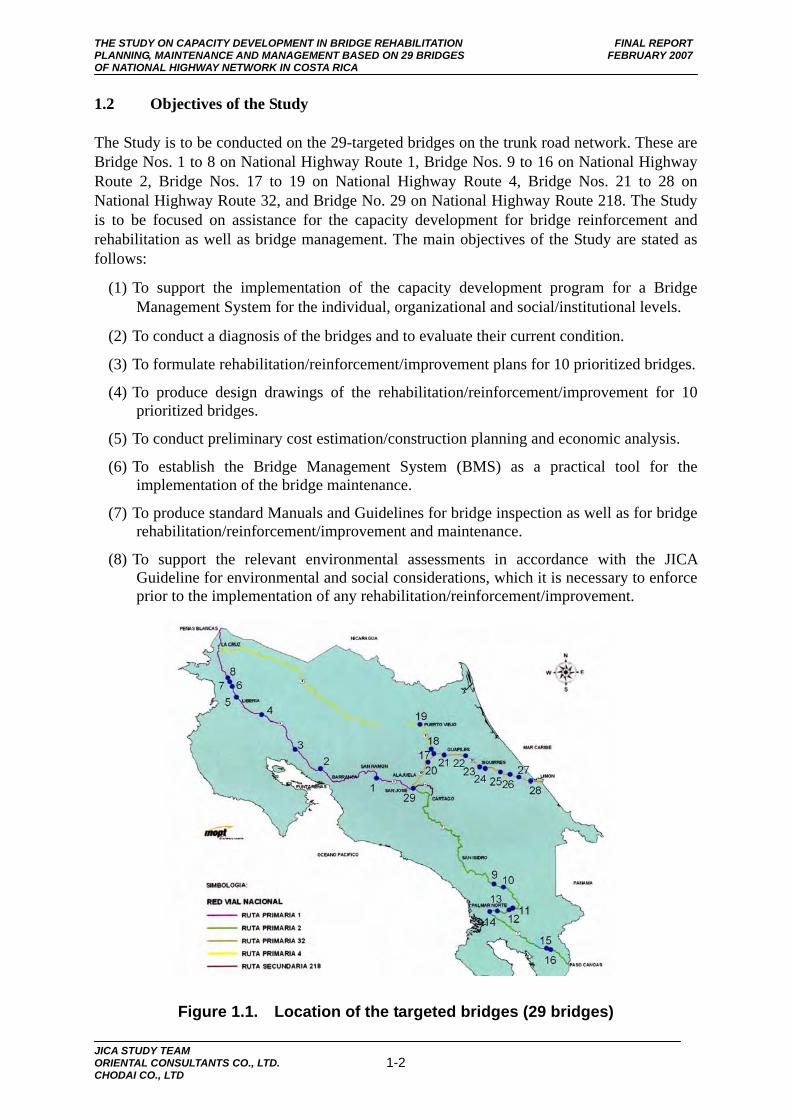
THE STUDY ON CAPACITY DEVELOPMENT IN BRIDGE REHABILITATION FINAL REPORT PLANNING, MAINTENANCE AND MANAGEMENT BASED ON 29 BRIDGES FEBRUARY 2007 OF NATIONAL HIGHWAY NETWORK IN COSTA RICA
JICA STUDY TEAM ORIENTAL CONSULTANTS CO., LTD. CHODAI CO., LTD
1-2
1.2 Objectives of the Study
The Study is to be conducted on the 29-targeted bridges on the trunk road network. These are Bridge Nos. 1 to 8 on National Highway Route 1, Bridge Nos. 9 to 16 on National Highway Route 2, Bridge Nos. 17 to 19 on National Highway Route 4, Bridge Nos. 21 to 28 on National Highway Route 32, and Bridge No. 29 on National Highway Route 218. The Study is to be focused on assistance for the capacity development for bridge reinforcement and rehabilitation as well as bridge management. The main objectives of the Study are stated as follows:
(1) To support the implementation of the capacity development program for a Bridge Management System for the individual, organizational and social/institutional levels.
(2) To conduct a diagnosis of the bridges and to evaluate their current condition.
(3) To formulate rehabilitation/reinforcement/improvement plans for 10 prioritized bridges.
(4) To produce design drawings of the rehabilitation/reinforcement/improvement for 10 prioritized bridges.
(5) To conduct preliminary cost estimation/construction planning and economic analysis.
(6) To establish the Bridge Management System (BMS) as a practical tool for the implementation of the bridge maintenance.
(7) To produce standard Manuals and Guidelines for bridge inspection as well as for bridge rehabilitation/reinforcement/improvement and maintenance.
(8) To support the relevant environmental assessments in accordance with the JICA Guideline for environmental and social considerations, which it is necessary to enforce prior to the implementation of any rehabilitation/reinforcement/improvement.
Figure 1.1. Location of the targeted bridges (29 bridges)

THE STUDY ON CAPACITY DEVELOPMENT IN BRIDGE REHABILITATION FINAL REPORT PLANNING, MAINTENANCE AND MANAGEMENT BASED ON 29 BRIDGES FEBRUARY 2007 OF NATIONAL HIGHWAY NETWORK IN COSTA RICA
JICA STUDY TEAM ORIENTAL CONSULTANTS CO., LTD. CHODAI CO., LTD
1-3
1.3 Components and Process of the Study
Figure 1.2 shows the comprehensive components of the study to embody the objectives mentioned earlier. The counterpart agency is the Planning Direction and the Bridge Design Department of the Ministry of Public Works and Transport (hereinafter described as “MOPT”) as well as the Planning Direction of the National Council of Roads (hereinafter described as “CONAVI”).
The Capacity Development (hereinafter described as “CD”) for Costa Rica shall focus on the improvement of capacities on the “Individual”,” Organizational” and “Institutional/Social” levels. In addition, the Study shall highlight assistance to the establishment of the Bridge Conservation Department in CONAVI, which are institutionally planned to.
Figure 1.2. Objectives and Components of the Study
Figure 1.3 shows a schematic of the study process. The upper section concerns the technical components of the Study and the lower section concerns the CD.
Capacity Development of Bridge Management in Costa Rica
Throughout the Organizational Structuring, Human Resource Development etc., assistance for the improvement of “Problem-Solving Competence” in bridge maintenance is to be achieved
MOPT (Ministry of Public Works and Transport)Bridge Design Department CONAVI(National Council of Roads) Bridge Conservation Department(planned to station in 2007)
Individual Organizational Institutional & Social
Assistance for Human Resource Distribution,
Allocation
Human Resource Development.
OJT, Technical seminars Workshop, Study tours etc.
Assistance for Organizational Structuring
Bridge Management System (BMS)
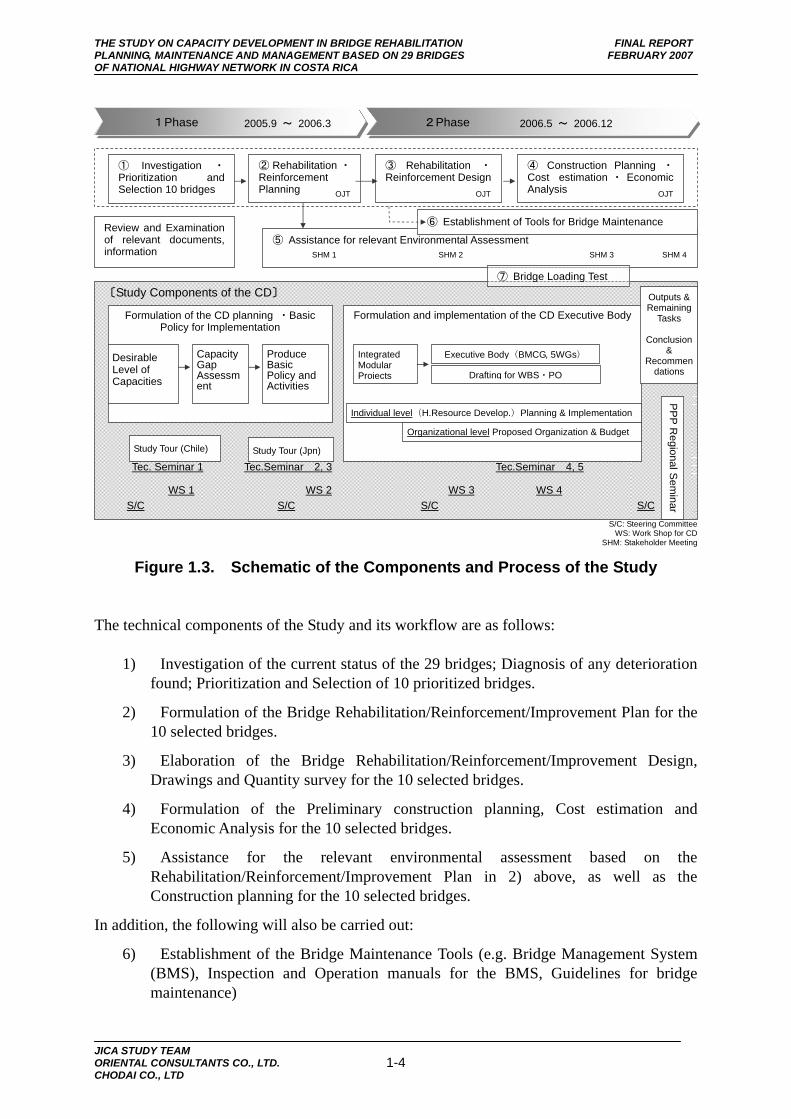
THE STUDY ON CAPACITY DEVELOPMENT IN BRIDGE REHABILITATION FINAL REPORT PLANNING, MAINTENANCE AND MANAGEMENT BASED ON 29 BRIDGES FEBRUARY 2007 OF NATIONAL HIGHWAY NETWORK IN COSTA RICA
JICA STUDY TEAM ORIENTAL CONSULTANTS CO., LTD. CHODAI CO., LTD
1-4
S/C: Steering Committee WS: Work Shop for CD
SHM: Stakeholder Meeting
Figure 1.3. Schematic of the Components and Process of the Study
The technical components of the Study and its workflow are as follows:
1) Investigation of the current status of the 29 bridges; Diagnosis of any deterioration found; Prioritization and Selection of 10 prioritized bridges.
2) Formulation of the Bridge Rehabilitation/Reinforcement/Improvement Plan for the 10 selected bridges.
3) Elaboration of the Bridge Rehabilitation/Reinforcement/Improvement Design, Drawings and Quantity survey for the 10 selected bridges.
4) Formulation of the Preliminary construction planning, Cost estimation and Economic Analysis for the 10 selected bridges.
5) Assistance for the relevant environmental assessment based on the Rehabilitation/Reinforcement/Improvement Plan in 2) above, as well as the Construction planning for the 10 selected bridges.
In addition, the following will also be carried out:
6) Establishment of the Bridge Maintenance Tools (e.g. Bridge Management System (BMS), Inspection and Operation manuals for the BMS, Guidelines for bridge maintenance)
1Phase 2Phase
① Investigation ・Prioritization and Selection 10 bridges
② Rehabilitation ・Reinforcement Planning
③ Rehabilitation ・Reinforcement Design
④ Construction Planning ・Cost estimation ・ Economic Analysis OJT OJT OJT
⑤ Assistance for relevant Environmental Assessment Review and Examination of relevant documents, information
⑥ Establishment of Tools for Bridge Maintenance
〔Study Components of the CD〕
Formulation of the CD planning ・Basic Policy for Implementation
Desirable Level of Capacities
Capacity Gap Assessment
Produce Basic Policy and Activities
Study Tour (Chile)
⑦ Bridge Loading Test
Study Tour (Jpn)
Formulation and implementation of the CD Executive Body
Outputs & Remaining
Tasks
Conclusion&
Recommendations
S/C
2005.9 ~ 2006.3 2006.5 ~ 2006.12 P
PP R
egional Sem
inarS/C
SHM 1 SHM 2 SHM 4
Integrated Modular Projects
Executive Body(BMCG, 5WGs)
Individual level(H.Resource Develop.)Planning & Implementation
Organizational level Proposed Organization & Budget
Drafting for WBS・PO
Tec. Seminar 1 Tec.Seminar 2, 3 Tec.Seminar 4, 5
WS 1 WS 2 WS 3 WS 4 S/C S/C
SHM 3
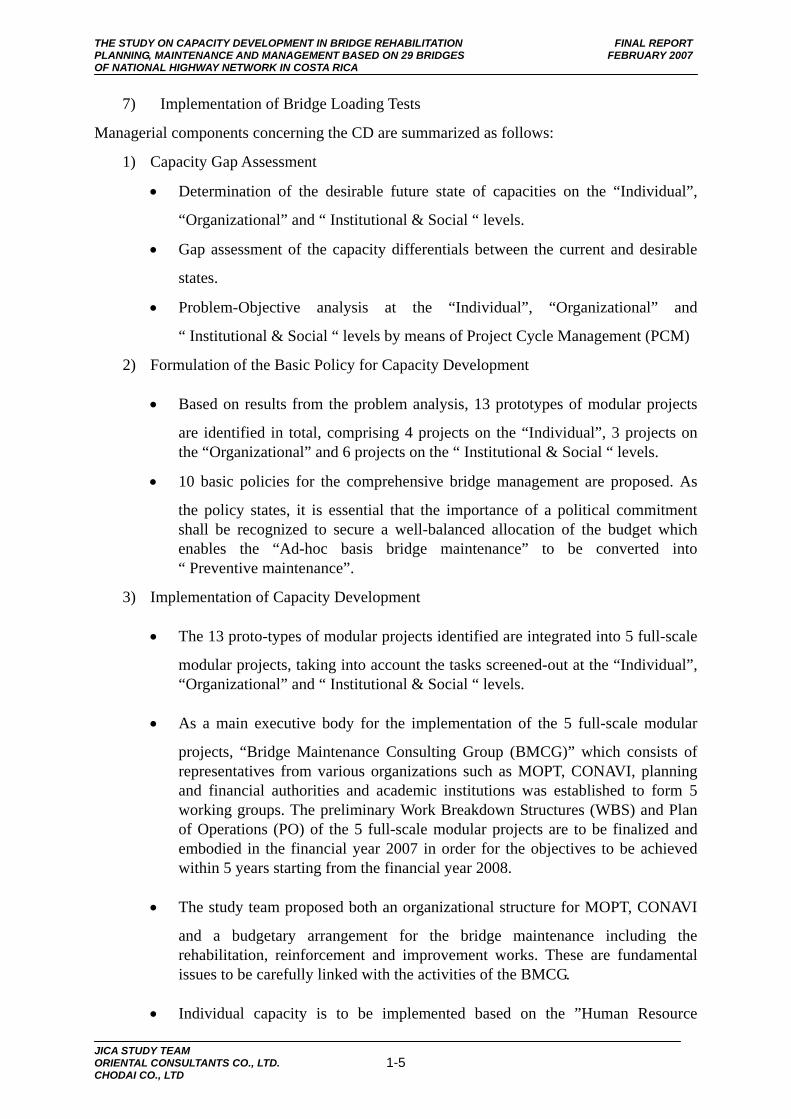
THE STUDY ON CAPACITY DEVELOPMENT IN BRIDGE REHABILITATION FINAL REPORT PLANNING, MAINTENANCE AND MANAGEMENT BASED ON 29 BRIDGES FEBRUARY 2007 OF NATIONAL HIGHWAY NETWORK IN COSTA RICA
JICA STUDY TEAM ORIENTAL CONSULTANTS CO., LTD. CHODAI CO., LTD
1-5
7) Implementation of Bridge Loading Tests
Managerial components concerning the CD are summarized as follows:
1) Capacity Gap Assessment
• Determination of the desirable future state of capacities on the “Individual”,
“Organizational” and “ Institutional & Social “ levels.
• Gap assessment of the capacity differentials between the current and desirable
states.
• Problem-Objective analysis at the “Individual”, “Organizational” and
“ Institutional & Social “ levels by means of Project Cycle Management (PCM)
2) Formulation of the Basic Policy for Capacity Development
• Based on results from the problem analysis, 13 prototypes of modular projects
are identified in total, comprising 4 projects on the “Individual”, 3 projects on the “Organizational” and 6 projects on the “ Institutional & Social “ levels.
• 10 basic policies for the comprehensive bridge management are proposed. As
the policy states, it is essential that the importance of a political commitment shall be recognized to secure a well-balanced allocation of the budget which enables the “Ad-hoc basis bridge maintenance” to be converted into “ Preventive maintenance”.
3) Implementation of Capacity Development
• The 13 proto-types of modular projects identified are integrated into 5 full-scale
modular projects, taking into account the tasks screened-out at the “Individual”, “Organizational” and “ Institutional & Social “ levels.
• As a main executive body for the implementation of the 5 full-scale modular
projects, “Bridge Maintenance Consulting Group (BMCG)” which consists of representatives from various organizations such as MOPT, CONAVI, planning and financial authorities and academic institutions was established to form 5 working groups. The preliminary Work Breakdown Structures (WBS) and Plan of Operations (PO) of the 5 full-scale modular projects are to be finalized and embodied in the financial year 2007 in order for the objectives to be achieved within 5 years starting from the financial year 2008.
• The study team proposed both an organizational structure for MOPT, CONAVI
and a budgetary arrangement for the bridge maintenance including the rehabilitation, reinforcement and improvement works. These are fundamental issues to be carefully linked with the activities of the BMCG.
• Individual capacity is to be implemented based on the ”Human Resource
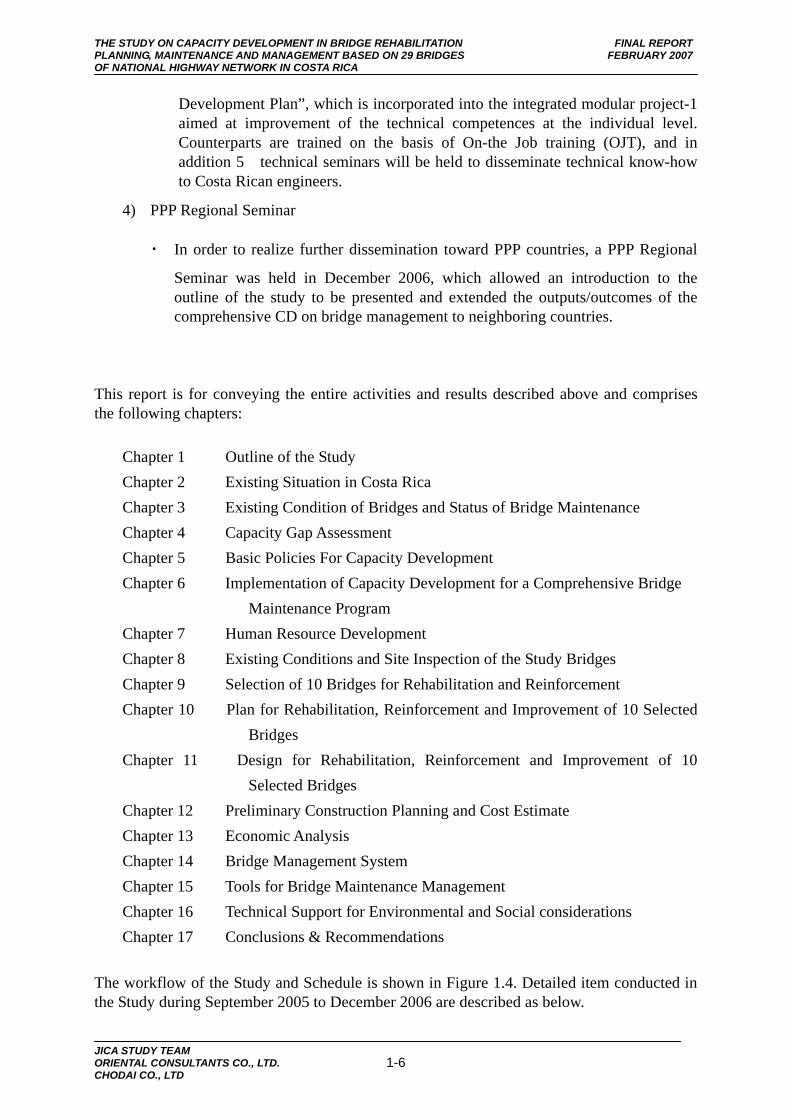
THE STUDY ON CAPACITY DEVELOPMENT IN BRIDGE REHABILITATION FINAL REPORT PLANNING, MAINTENANCE AND MANAGEMENT BASED ON 29 BRIDGES FEBRUARY 2007 OF NATIONAL HIGHWAY NETWORK IN COSTA RICA
JICA STUDY TEAM ORIENTAL CONSULTANTS CO., LTD. CHODAI CO., LTD
1-6
Development Plan”, which is incorporated into the integrated modular project-1 aimed at improvement of the technical competences at the individual level. Counterparts are trained on the basis of On-the Job training (OJT), and in addition 5 technical seminars will be held to disseminate technical know-how to Costa Rican engineers.
4) PPP Regional Seminar
・ In order to realize further dissemination toward PPP countries, a PPP Regional
Seminar was held in December 2006, which allowed an introduction to the outline of the study to be presented and extended the outputs/outcomes of the comprehensive CD on bridge management to neighboring countries.
This report is for conveying the entire activities and results described above and comprises the following chapters:
Chapter 1 Outline of the Study Chapter 2 Existing Situation in Costa Rica Chapter 3 Existing Condition of Bridges and Status of Bridge Maintenance Chapter 4 Capacity Gap Assessment Chapter 5 Basic Policies For Capacity Development Chapter 6 Implementation of Capacity Development for a Comprehensive Bridge
Maintenance Program Chapter 7 Human Resource Development Chapter 8 Existing Conditions and Site Inspection of the Study Bridges Chapter 9 Selection of 10 Bridges for Rehabilitation and Reinforcement Chapter 10 Plan for Rehabilitation, Reinforcement and Improvement of 10 Selected
Bridges Chapter 11 Design for Rehabilitation, Reinforcement and Improvement of 10
Selected Bridges Chapter 12 Preliminary Construction Planning and Cost Estimate Chapter 13 Economic Analysis Chapter 14 Bridge Management System Chapter 15 Tools for Bridge Maintenance Management Chapter 16 Technical Support for Environmental and Social considerations Chapter 17 Conclusions & Recommendations
The workflow of the Study and Schedule is shown in Figure 1.4. Detailed item conducted in the Study during September 2005 to December 2006 are described as below.
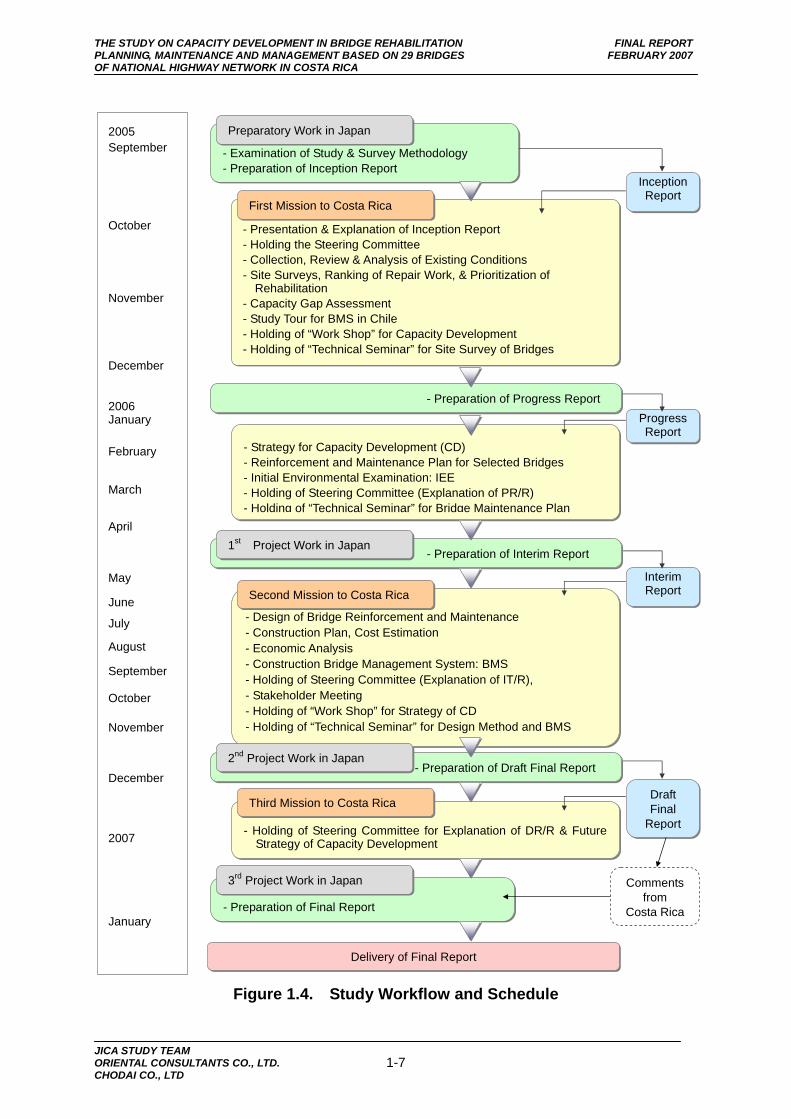
THE STUDY ON CAPACITY DEVELOPMENT IN BRIDGE REHABILITATION FINAL REPORT PLANNING, MAINTENANCE AND MANAGEMENT BASED ON 29 BRIDGES FEBRUARY 2007 OF NATIONAL HIGHWAY NETWORK IN COSTA RICA
JICA STUDY TEAM ORIENTAL CONSULTANTS CO., LTD. CHODAI CO., LTD
1-7
Figure 1.4. Study Workflow and Schedule
December
- Examination of Study & Survey Methodology - Preparation of Inception Report
Preparatory Work in Japan
- Presentation & Explanation of Inception Report - Holding the Steering Committee - Collection, Review & Analysis of Existing Conditions - Site Surveys, Ranking of Repair Work, & Prioritization of
Rehabilitation - Capacity Gap Assessment - Study Tour for BMS in Chile - Holding of “Work Shop” for Capacity Development - Holding of “Technical Seminar” for Site Survey of Bridges
First Mission to Costa Rica
InceptionReport
- Preparation of Progress Report
- Strategy for Capacity Development (CD) - Reinforcement and Maintenance Plan for Selected Bridges - Initial Environmental Examination: IEE - Holding of Steering Committee (Explanation of PR/R) - Holding of “Technical Seminar” for Bridge Maintenance Plan
- Design of Bridge Reinforcement and Maintenance - Construction Plan, Cost Estimation - Economic Analysis - Construction Bridge Management System: BMS - Holding of Steering Committee (Explanation of IT/R), - Stakeholder Meeting - Holding of “Work Shop” for Strategy of CD - Holding of “Technical Seminar” for Design Method and BMS
Second Mission to Costa Rica
- Holding of Steering Committee for Explanation of DR/R & Future Strategy of Capacity Development
Third Mission to Costa Rica
- Preparation of Interim Report 1st Project Work in Japan
- Preparation of Draft Final Report 2nd Project Work in Japan
- Preparation of Final Report
3rd Project Work in Japan
Progress Report
InterimReport
Draft Final
Report
Comments from
Costa Rica
Delivery of Final Report
January
April
May
November
December
January
2007
2006
February
March
June
July
August
September
October
November
October
2005 September
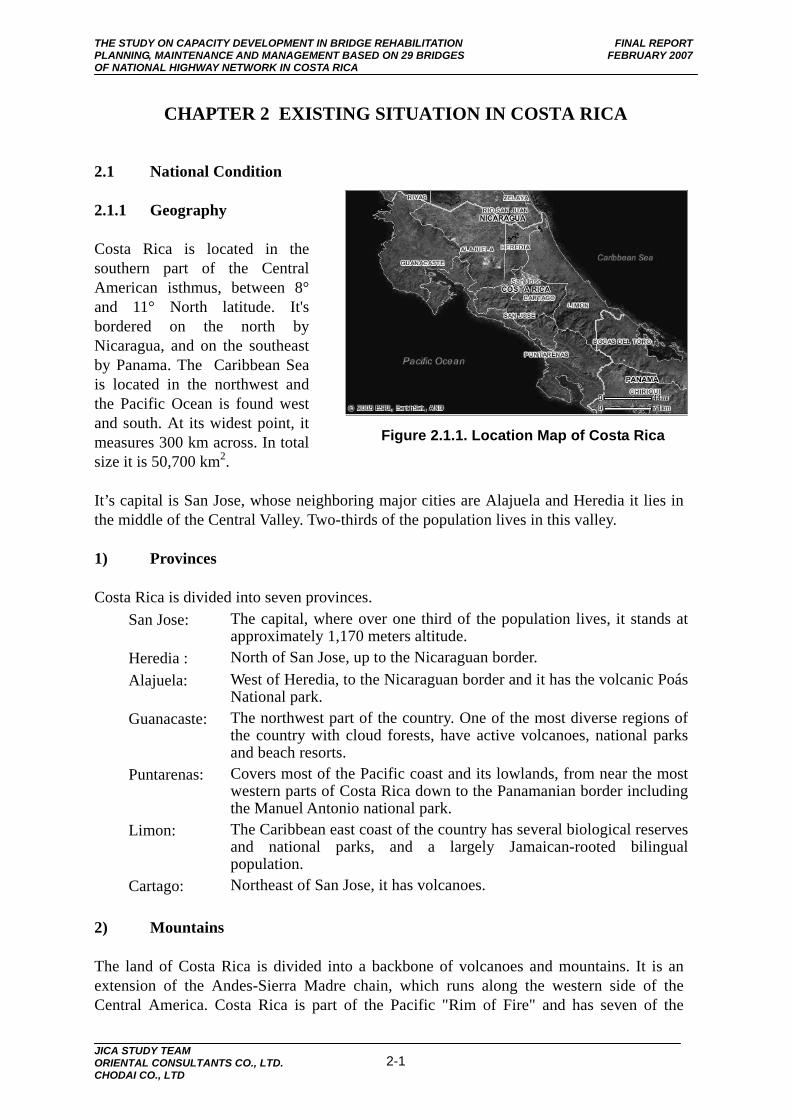
THE STUDY ON CAPACITY DEVELOPMENT IN BRIDGE REHABILITATION FINAL REPORT PLANNING, MAINTENANCE AND MANAGEMENT BASED ON 29 BRIDGES FEBRUARY 2007 OF NATIONAL HIGHWAY NETWORK IN COSTA RICA
JICA STUDY TEAM ORIENTAL CONSULTANTS CO., LTD. CHODAI CO., LTD
2-1
CHAPTER 2 EXISTING SITUATION IN COSTA RICA
2.1 National Condition
2.1.1 Geography
Costa Rica is located in the southern part of the Central American isthmus, between 8° and 11° North latitude. It's bordered on the north by Nicaragua, and on the southeast by Panama. The Caribbean Sea is located in the northwest and the Pacific Ocean is found west and south. At its widest point, it measures 300 km across. In total size it is 50,700 km2.
It’s capital is San Jose, whose neighboring major cities are Alajuela and Heredia it lies in the middle of the Central Valley. Two-thirds of the population lives in this valley.
1) Provinces
Costa Rica is divided into seven provinces. San Jose: The capital, where over one third of the population lives, it stands at
approximately 1,170 meters altitude. Heredia : North of San Jose, up to the Nicaraguan border. Alajuela: West of Heredia, to the Nicaraguan border and it has the volcanic Poás
National park. Guanacaste: The northwest part of the country. One of the most diverse regions of
the country with cloud forests, have active volcanoes, national parks and beach resorts.
Puntarenas: Covers most of the Pacific coast and its lowlands, from near the most western parts of Costa Rica down to the Panamanian border including the Manuel Antonio national park.
Limon: The Caribbean east coast of the country has several biological reserves and national parks, and a largely Jamaican-rooted bilingual population.
Cartago: Northeast of San Jose, it has volcanoes. 2) Mountains
The land of Costa Rica is divided into a backbone of volcanoes and mountains. It is an extension of the Andes-Sierra Madre chain, which runs along the western side of the Central America. Costa Rica is part of the Pacific "Rim of Fire" and has seven of the
Figure 2.1.1. Location Map of Costa Rica

THE STUDY ON CAPACITY DEVELOPMENT IN BRIDGE REHABILITATION FINAL REPORT PLANNING, MAINTENANCE AND MANAGEMENT BASED ON 29 BRIDGES FEBRUARY 2007 OF NATIONAL HIGHWAY NETWORK IN COSTA RICA
JICA STUDY TEAM ORIENTAL CONSULTANTS CO., LTD. CHODAI CO., LTD
2-2
isthmus's 42 active volcanoes plus dozens of dormant or extinct cones.
The Cordillera de Talamanca, the country's oldest and southernmost range, includes Mt. Chirripó, Costa Rica's highest mountain at 3,820 m. The Central Volcanic Range features the volcanoes Turrialba, Irazú, Barva and Poás. In the northwest is the Tilarán Range, whose altitude reaches 1,700 m at the Monteverde Cloud Forest. Northwest is the Guanacaste Range. Near the Nicaraguan border, this range includes five active volcanoes, Rincon de la Vieja, and Miravalles, which is being used to generate geothermal energy.
3) River
The rivers of Costa Rica are characterized by steep slopes of riverbeds. The major typical rivers of Costa Rica are shown in Figure 2.1.2 which have less than 200 km of river length. The starting point of rivers is located at an altitude that goes from 3,820 m to 1,600 m. From its section to an altitude of 600 m there are steep slopes of riverbeds, and then the river flows with a slow flood down to Pacific Ocean or Caribbean Sea.
The substructure of many bridges has been exhausted by natural disasters which are localized torrential downpours by a tropical cyclone, volcanic activity, and slope collapse by the earthquake and sediment and flood damage
2.1.2 Climate
1) Meteorology
Costa Rica’s climate is divided into two seasons, which are rainy and dry. The dry season runs from January through May, and the rainy season from May to November and December.
The topography of Costa Rica has an influence on weather patterns. The dry and rainy seasons are shown on each slope of the mountain ranges which are the Pacific slope and the Caribbean slope.
Altitude
(m
)
3,000
2,000
1,000
0 100 200
Distance from the mouth of a river(km)
①
②
③ ④
⑤Rio
Par
rita
Rio
Tarc
oles Ri
o Si
xaol
aRi
o Te
rrab
a
Rio Te
mpisqu
eAltitude
(m
)
3,000
2,000
1,000
0 100 200
Distance from the mouth of a river(km)
①
②
③ ④
⑤Rio
Par
rita
Rio
Tarc
oles Ri
o Si
xaol
aRi
o Te
rrab
a
Rio Te
mpisqu
eFigure 2.1.2. River Profile of Major River in
Costa Rica
Source: JICA Study Team
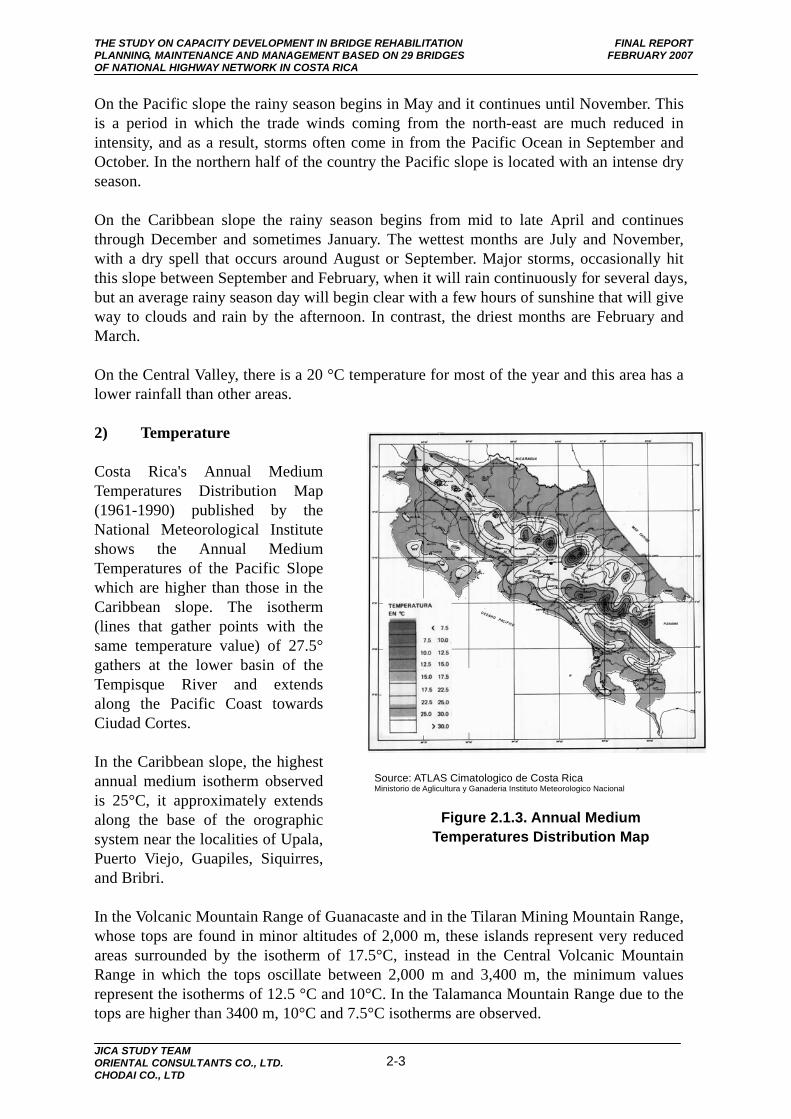
THE STUDY ON CAPACITY DEVELOPMENT IN BRIDGE REHABILITATION FINAL REPORT PLANNING, MAINTENANCE AND MANAGEMENT BASED ON 29 BRIDGES FEBRUARY 2007 OF NATIONAL HIGHWAY NETWORK IN COSTA RICA
JICA STUDY TEAM ORIENTAL CONSULTANTS CO., LTD. CHODAI CO., LTD
2-3
On the Pacific slope the rainy season begins in May and it continues until November. This is a period in which the trade winds coming from the north-east are much reduced in intensity, and as a result, storms often come in from the Pacific Ocean in September and October. In the northern half of the country the Pacific slope is located with an intense dry season.
On the Caribbean slope the rainy season begins from mid to late April and continues through December and sometimes January. The wettest months are July and November, with a dry spell that occurs around August or September. Major storms, occasionally hit this slope between September and February, when it will rain continuously for several days, but an average rainy season day will begin clear with a few hours of sunshine that will give way to clouds and rain by the afternoon. In contrast, the driest months are February and March.
On the Central Valley, there is a 20 °C temperature for most of the year and this area has a lower rainfall than other areas.
2) Temperature
Costa Rica's Annual Medium Temperatures Distribution Map (1961-1990) published by the National Meteorological Institute shows the Annual Medium Temperatures of the Pacific Slope which are higher than those in the Caribbean slope. The isotherm (lines that gather points with the same temperature value) of 27.5° gathers at the lower basin of the Tempisque River and extends along the Pacific Coast towards Ciudad Cortes.
In the Caribbean slope, the highest annual medium isotherm observed is 25°C, it approximately extends along the base of the orographic system near the localities of Upala, Puerto Viejo, Guapiles, Siquirres, and Bribri.
In the Volcanic Mountain Range of Guanacaste and in the Tilaran Mining Mountain Range, whose tops are found in minor altitudes of 2,000 m, these islands represent very reduced areas surrounded by the isotherm of 17.5°C, instead in the Central Volcanic Mountain Range in which the tops oscillate between 2,000 m and 3,400 m, the minimum values represent the isotherms of 12.5 °C and 10°C. In the Talamanca Mountain Range due to the tops are higher than 3400 m, 10°C and 7.5°C isotherms are observed.
Figure 2.1.3. Annual Medium Temperatures Distribution Map
Source: ATLAS Cimatologico de Costa Rica Ministorio de Aglicultura y Ganaderia Instituto Meteorologico Nacional

THE STUDY ON CAPACITY DEVELOPMENT IN BRIDGE REHABILITATION FINAL REPORT PLANNING, MAINTENANCE AND MANAGEMENT BASED ON 29 BRIDGES FEBRUARY 2007 OF NATIONAL HIGHWAY NETWORK IN COSTA RICA
JICA STUDY TEAM ORIENTAL CONSULTANTS CO., LTD. CHODAI CO., LTD
2-4
Table 2.1.1 shows the difference of time temperature variation. Time temperature is modified by the altitude, in the lower lands the amplitude reaches higher values than in those places located in a higher altitude. The amplitude is lower in San Jose, Pavas, Alajuela, which are located over 900 m above sea level, than the amplitudes of Puntarenas and Liberia that are almost at sea level.
Table 2.1.1. Time Difference between Maximum and Minimum Temperature
Region Altitude (m)
Max °C Time Min
°C Time Difference°C
Puntarenas 3 33.5 13:00 23.0 05:40 10.5
Palmar Sur 16 31.0 13:20 24.0 01:40 7.0
Liberia(Llano Garnde) 85 34.0 13:00 20.5 03:00 13.5
Aeropto Juan Sta. Maria 921 27.4 13:40 18.6 02:30 8.8
Pavas 997 26.0 13:10 18.8 06:30 7.2
San Jose 1,172 23.1 11:00 17.5 03:00 5.6
3) Precipitation
Figure 2.1.4. shows the annual average precipitation map in Costa Rica published by the National Meteorological Institute based on the years 1961-1980. The areas of less than 1,500 mm of precipitation are distributed on four relative area in Costa Rica, the first is in the Northwest of the country in the Santa Elena Peninsula and the coast sector in front of the Papagayo Gulf, the second is Bagaces and Cañas including surrounding areas, the third is in the coast of the Nicoya Gulf, Costa de Pajaros, Chomes and extended to the mouth of the Aranjuez River, the fourth is the central region of the country and it includes the city of Cartago.
The maximums precipitations are dispersed out in the mountain area. Maximums of 5,500 and 6,500 mm are observed in the Caribbean slope in the coast sector between the Colorado River and the San Juan River, also in the basin of the Banano River, the Pacific slope Quepos, Savegre and the Naranjo River, and Osa Peninsula, which extends from Punta Llorona until Madrigal Beach. The highest precipitation areas are located in the Basin of Pejibaye River and the Grande de Orosi River; the values are over 7,000 mm per
Figure 2.1.4. Annual Average Precipitation Map
Source: ATLAS Cimatologico de Costa Rica Ministorio de Aglicultura y Ganaderia Instituto Meteorologico Nacional
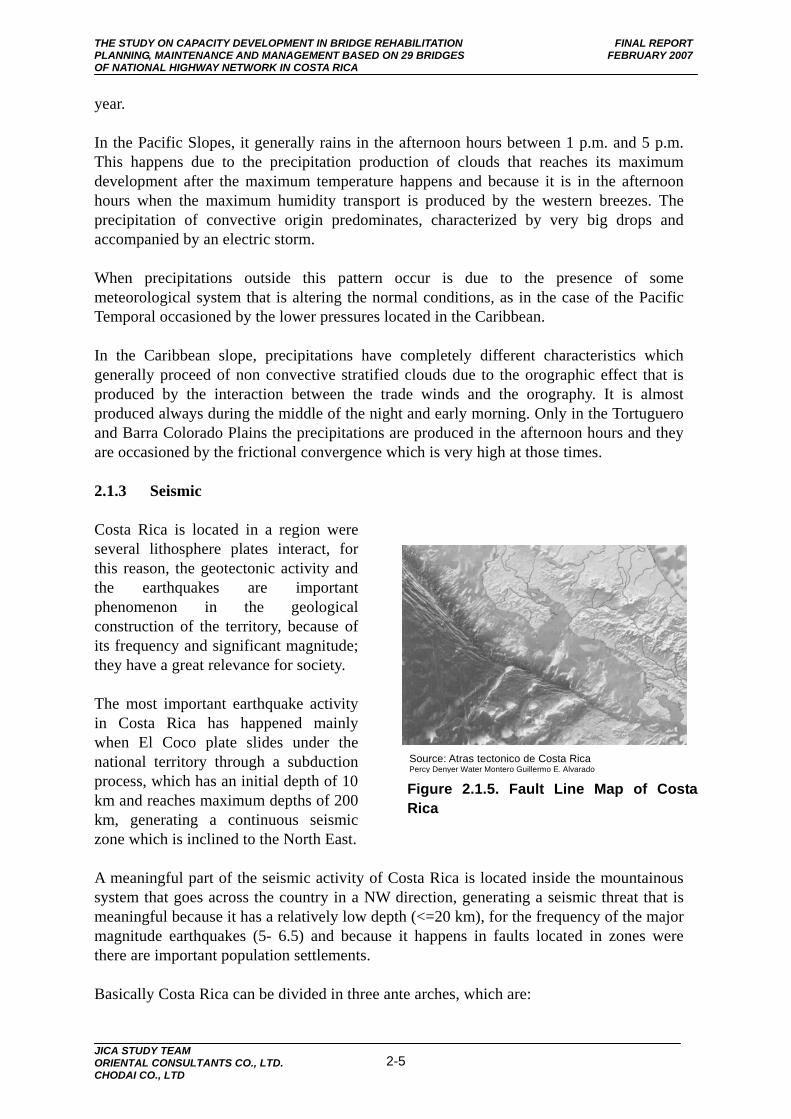
THE STUDY ON CAPACITY DEVELOPMENT IN BRIDGE REHABILITATION FINAL REPORT PLANNING, MAINTENANCE AND MANAGEMENT BASED ON 29 BRIDGES FEBRUARY 2007 OF NATIONAL HIGHWAY NETWORK IN COSTA RICA
JICA STUDY TEAM ORIENTAL CONSULTANTS CO., LTD. CHODAI CO., LTD
2-5
year.
In the Pacific Slopes, it generally rains in the afternoon hours between 1 p.m. and 5 p.m. This happens due to the precipitation production of clouds that reaches its maximum development after the maximum temperature happens and because it is in the afternoon hours when the maximum humidity transport is produced by the western breezes. The precipitation of convective origin predominates, characterized by very big drops and accompanied by an electric storm.
When precipitations outside this pattern occur is due to the presence of some meteorological system that is altering the normal conditions, as in the case of the Pacific Temporal occasioned by the lower pressures located in the Caribbean.
In the Caribbean slope, precipitations have completely different characteristics which generally proceed of non convective stratified clouds due to the orographic effect that is produced by the interaction between the trade winds and the orography. It is almost produced always during the middle of the night and early morning. Only in the Tortuguero and Barra Colorado Plains the precipitations are produced in the afternoon hours and they are occasioned by the frictional convergence which is very high at those times.
2.1.3 Seismic
Costa Rica is located in a region were several lithosphere plates interact, for this reason, the geotectonic activity and the earthquakes are important phenomenon in the geological construction of the territory, because of its frequency and significant magnitude; they have a great relevance for society.
The most important earthquake activity in Costa Rica has happened mainly when El Coco plate slides under the national territory through a subduction process, which has an initial depth of 10 km and reaches maximum depths of 200 km, generating a continuous seismic zone which is inclined to the North East.
A meaningful part of the seismic activity of Costa Rica is located inside the mountainous system that goes across the country in a NW direction, generating a seismic threat that is meaningful because it has a relatively low depth (<=20 km), for the frequency of the major magnitude earthquakes (5- 6.5) and because it happens in faults located in zones were there are important population settlements.
Basically Costa Rica can be divided in three ante arches, which are:
Figure 2.1.5. Fault Line Map of Costa Rica
Source: Atras tectonico de Costa Rica Percy Denyer Water Montero Guillermo E. Alvarado
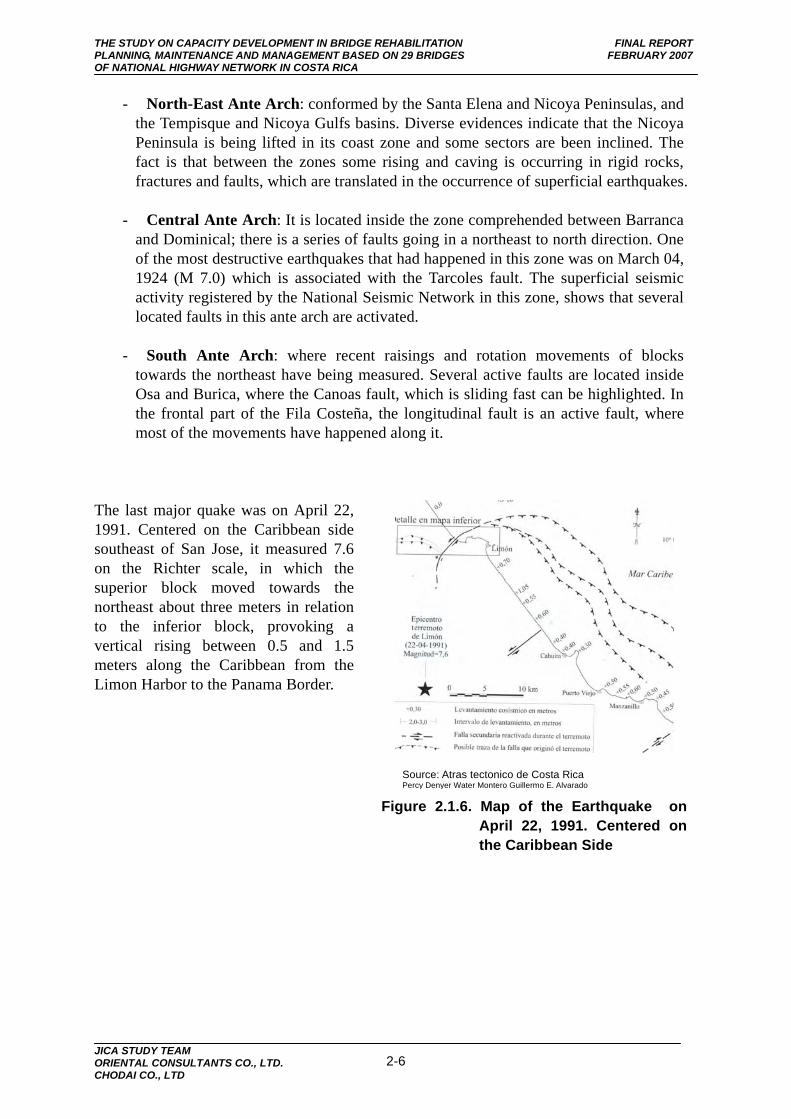
THE STUDY ON CAPACITY DEVELOPMENT IN BRIDGE REHABILITATION FINAL REPORT PLANNING, MAINTENANCE AND MANAGEMENT BASED ON 29 BRIDGES FEBRUARY 2007 OF NATIONAL HIGHWAY NETWORK IN COSTA RICA
JICA STUDY TEAM ORIENTAL CONSULTANTS CO., LTD. CHODAI CO., LTD
2-6
- North-East Ante Arch: conformed by the Santa Elena and Nicoya Peninsulas, and the Tempisque and Nicoya Gulfs basins. Diverse evidences indicate that the Nicoya Peninsula is being lifted in its coast zone and some sectors are been inclined. The fact is that between the zones some rising and caving is occurring in rigid rocks, fractures and faults, which are translated in the occurrence of superficial earthquakes.
- Central Ante Arch: It is located inside the zone comprehended between Barranca and Dominical; there is a series of faults going in a northeast to north direction. One of the most destructive earthquakes that had happened in this zone was on March 04, 1924 (M 7.0) which is associated with the Tarcoles fault. The superficial seismic activity registered by the National Seismic Network in this zone, shows that several located faults in this ante arch are activated.
- South Ante Arch: where recent raisings and rotation movements of blocks towards the northeast have being measured. Several active faults are located inside Osa and Burica, where the Canoas fault, which is sliding fast can be highlighted. In the frontal part of the Fila Costeña, the longitudinal fault is an active fault, where most of the movements have happened along it.
The last major quake was on April 22, 1991. Centered on the Caribbean side southeast of San Jose, it measured 7.6 on the Richter scale, in which the superior block moved towards the northeast about three meters in relation to the inferior block, provoking a vertical rising between 0.5 and 1.5 meters along the Caribbean from the Limon Harbor to the Panama Border.
Figure 2.1.6. Map of the Earthquake on April 22, 1991. Centered on the Caribbean Side
Source: Atras tectonico de Costa Rica Percy Denyer Water Montero Guillermo E. Alvarado

THE STUDY ON CAPACITY DEVELOPMENT IN BRIDGE REHABILITATION FINAL REPORT PLANNING, MAINTENANCE AND MANAGEMENT BASED ON 29 BRIDGES FEBRUARY 2007 OF NATIONAL HIGHWAY NETWORK IN COSTA RICA
JICA STUDY TEAM ORIENTAL CONSULTANTS CO., LTD. CHODAI CO., LTD
2-7
2.2 Socio-Economic Condition
The following section is described as the socio-economic condition in Costa Rica. 2.2.1 Land Use
The total land area is 51,100 km2 which is composed with by land: 50,660 km2 and by water: 440 km2. For the details for cropland, the area of “arable land” that is cultivated for crops like wheat, maize, and rice that are replanted after each harvest is 4.41%, the area of “permanent crops land” that is cultivated for crops like coffee that are not replanted after each harvest is 5.88% (source: World Factbook; CIA).
The National reservation area is covered by 12,800 km2 (25.6%) (Source: Estado de la Nacion 2004).
Since 1972, urban area has been increased about 80,000 hectares and its share of total land is only 0.4% in 1999. Table 2.2.1 shows the area of each land use category. Figure 2.2.2 shows land use map colored by same category of Table 2.2.1.
Table 2.2.1. Land Use (1972, 1999) 1972 1999 Category hectares % hectares %
Urban Use 14,792.00 0.3 22,599.20 0.4 Cultivate area
Seasonal Crops 101,355.00 2.0 132,955.20 2.6 Permanent Crops 246,278.60 4.8 369,209.80 7.2 Pastures 820,557.00 16.1 1,565,076.30 30.7 Pasture with Agriculture 66,430.30 1.3 101,459.90 1.9 Mangle 66,523.10 1.3 49,374.30 0.9
Forest Natural Forest 2,085,906.00 40.7 1,286,456.30 25.2 Intervened Natural Forest 367,090.10 7.2 484,071.40 9.5 Secondary Forest 882,164.30 17.3 695,903.10 13.6
Marginal Rocky Terrain 15,292.10 0.3 8,567.10 0.2 Discovered Soil 0 0 26,469.20 0.5 Wet Lands and Swaps 113,267.00 2.2 106,058.30 2.1
Lakes and Reservoirs 18,432.00 0.4 9,797.00 0.2 Weed Land 292,287.40 5.7 228,444.60 4.5 Bleak Plateau 19,625.10 0.4 13,495.30 0.3 Burnt Areas 0 0 10,063.00 0.2 Total 5,110,000.00 100.0 5,110,000.00 100.0
Source: Ministry of Agriculture and Cattle (MAG)
Figure 2.2.1. Overview of Land in Costa Rica
Source: Google Earth
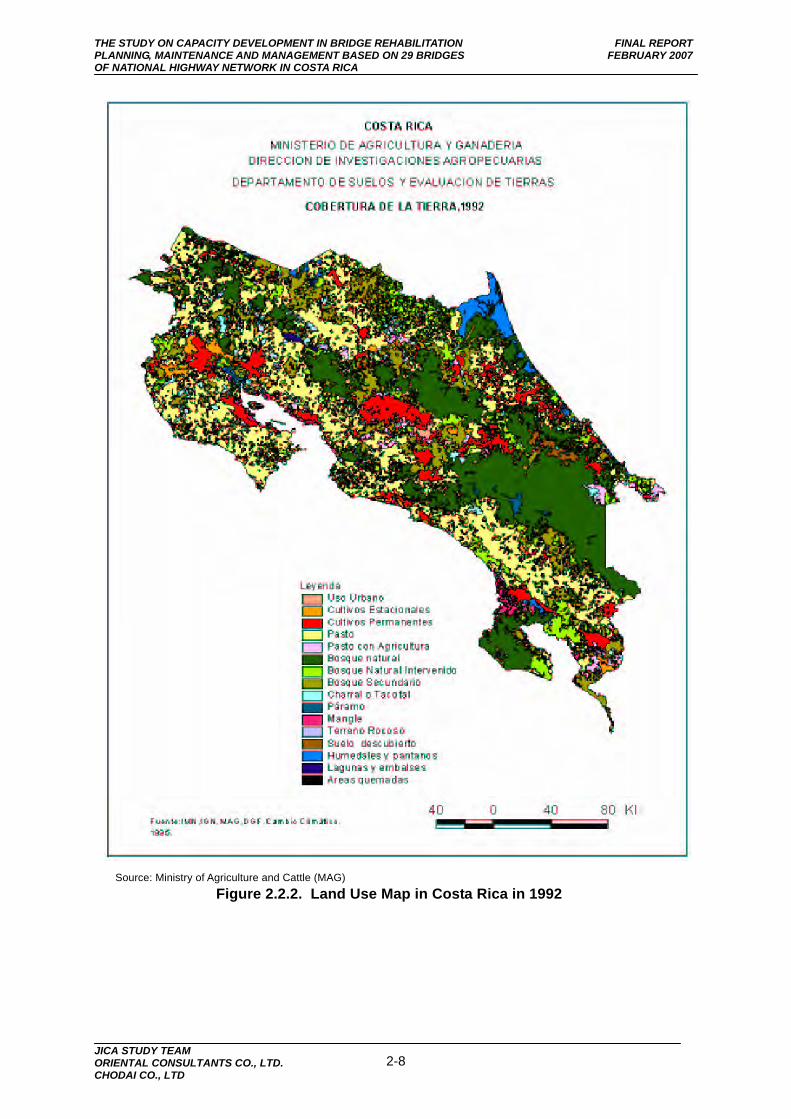
THE STUDY ON CAPACITY DEVELOPMENT IN BRIDGE REHABILITATION FINAL REPORT PLANNING, MAINTENANCE AND MANAGEMENT BASED ON 29 BRIDGES FEBRUARY 2007 OF NATIONAL HIGHWAY NETWORK IN COSTA RICA
JICA STUDY TEAM ORIENTAL CONSULTANTS CO., LTD. CHODAI CO., LTD
2-8
Source: Ministry of Agriculture and Cattle (MAG)
Figure 2.2.2. Land Use Map in Costa Rica in 1992

THE STUDY ON CAPACITY DEVELOPMENT IN BRIDGE REHABILITATION FINAL REPORT PLANNING, MAINTENANCE AND MANAGEMENT BASED ON 29 BRIDGES FEBRUARY 2007 OF NATIONAL HIGHWAY NETWORK IN COSTA RICA
JICA STUDY TEAM ORIENTAL CONSULTANTS CO., LTD. CHODAI CO., LTD
2-9
2.2.2 Population and Social Index
In 2004, population in Costa Rica was 4,178,755 habitants and the annual increase ratio is about 2 or 3 %. For two decades, population has increased approximately 1.7 times. The following figure (Figure 2.2.3) shows the tendency of population change since 1980.
0.0
500,000.0
1,000,000.0
1,500,000.0
2,000,000.0
2,500,000.0
3,000,000.0
3,500,000.0
4,000,000.0
4,500,000.0
1980
1981
1982
1983
1984
1985
1986
1987
1988
1989
1990
1991
1992
1993
1994
1995
1996
1997
1998
1999
2000
2001
2002
2003
2004
Source: Banco Central de Costa Rica HP, National Institute of Statistics and Censuses (INEC)
Figure 2.2.3. Population Change since 1980
In Costa Rica, local organization is divided by “Provincia”, “Canton” and “Distrito”. There are 7 Provinces and 81 Cantons shown in Figure 2.2.4. and 2.2.5.
Source: National Institute of Statistics and Censuses (INEC)
Figure 2.2.4. Province in Costa Rica and Bridge Location
No.17 to
No.19
No.21 to
No.28
No.29
No. 9to
No.16
No. 2 to
No. 8
No. 1
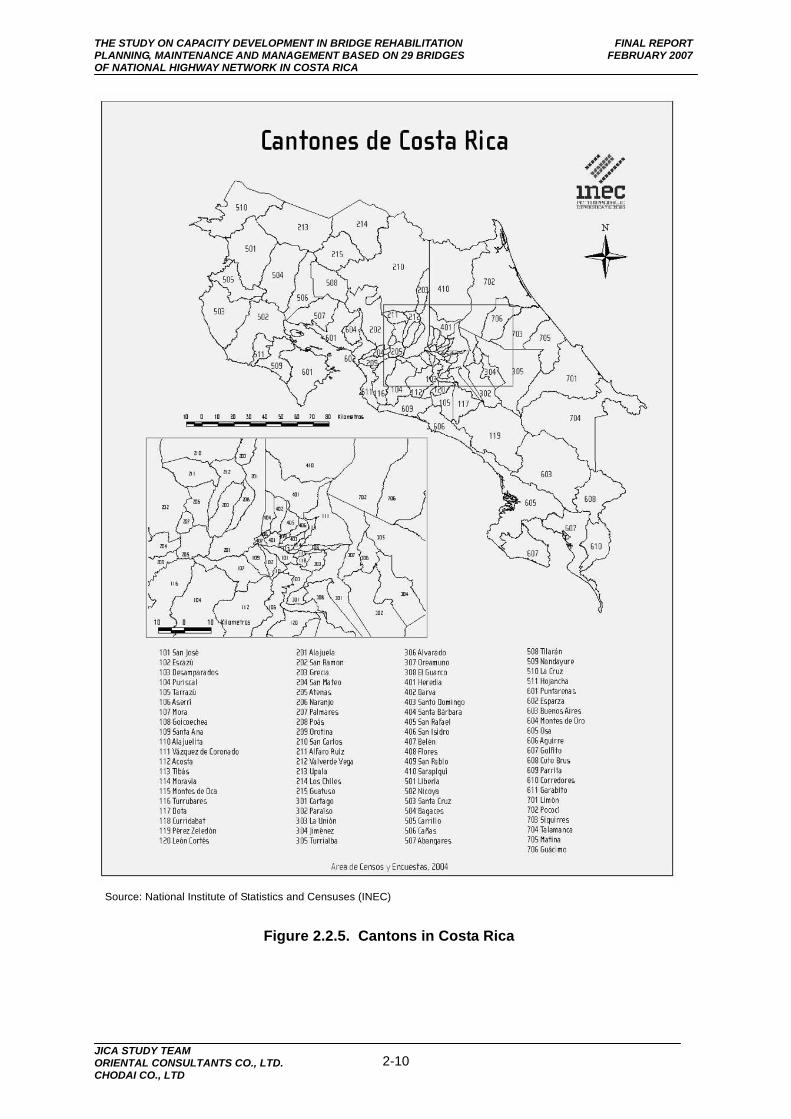
THE STUDY ON CAPACITY DEVELOPMENT IN BRIDGE REHABILITATION FINAL REPORT PLANNING, MAINTENANCE AND MANAGEMENT BASED ON 29 BRIDGES FEBRUARY 2007 OF NATIONAL HIGHWAY NETWORK IN COSTA RICA
JICA STUDY TEAM ORIENTAL CONSULTANTS CO., LTD. CHODAI CO., LTD
2-10
Source: National Institute of Statistics and Censuses (INEC)
Figure 2.2.5. Cantons in Costa Rica
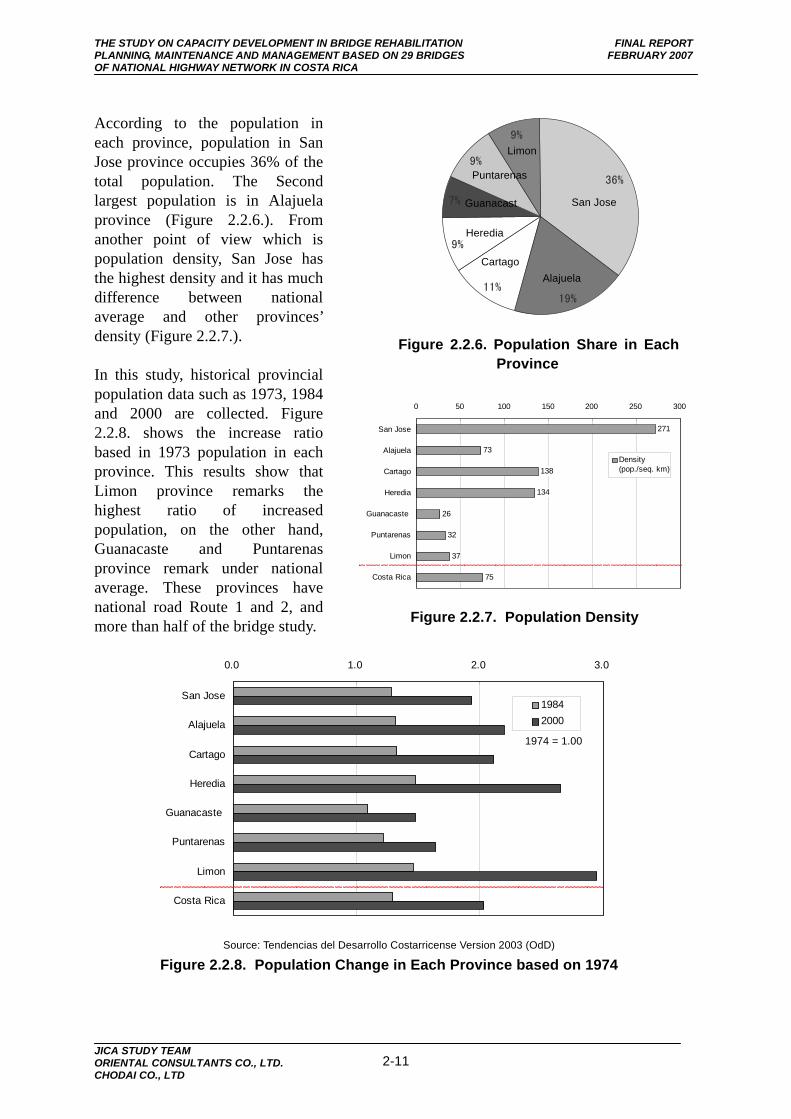
THE STUDY ON CAPACITY DEVELOPMENT IN BRIDGE REHABILITATION FINAL REPORT PLANNING, MAINTENANCE AND MANAGEMENT BASED ON 29 BRIDGES FEBRUARY 2007 OF NATIONAL HIGHWAY NETWORK IN COSTA RICA
JICA STUDY TEAM ORIENTAL CONSULTANTS CO., LTD. CHODAI CO., LTD
2-11
According to the population in each province, population in San Jose province occupies 36% of the total population. The Second largest population is in Alajuela province (Figure 2.2.6.). From another point of view which is population density, San Jose has the highest density and it has much difference between national average and other provinces’ density (Figure 2.2.7.).
In this study, historical provincial population data such as 1973, 1984 and 2000 are collected. Figure 2.2.8. shows the increase ratio based in 1973 population in each province. This results show that Limon province remarks the highest ratio of increased population, on the other hand, Guanacaste and Puntarenas province remark under national average. These provinces have national road Route 1 and 2, and more than half of the bridge study.
0.0 1.0 2.0 3.0
San Jose
Alajuela
Cartago
Heredia
Guanacaste
Puntarenas
Limon
Costa Rica
19842000
Source: Tendencias del Desarrollo Costarricense Version 2003 (OdD)
Figure 2.2.8. Population Change in Each Province based on 1974
36%
19%11%
9%
7%
9%
9%
San Jose
Alajuela Cartago
Heredia
Guanacast
Puntarenas
Limon
Figure 2.2.6. Population Share in Each Province
271
73
138
134
26
32
37
75
0 50 100 150 200 250 300
San Jose
Alajuela
Cartago
Heredia
Guanacaste
Puntarenas
Limon
Costa Rica
Density(pop./seq. km)
Figure 2.2.7. Population Density
1974 = 1.00
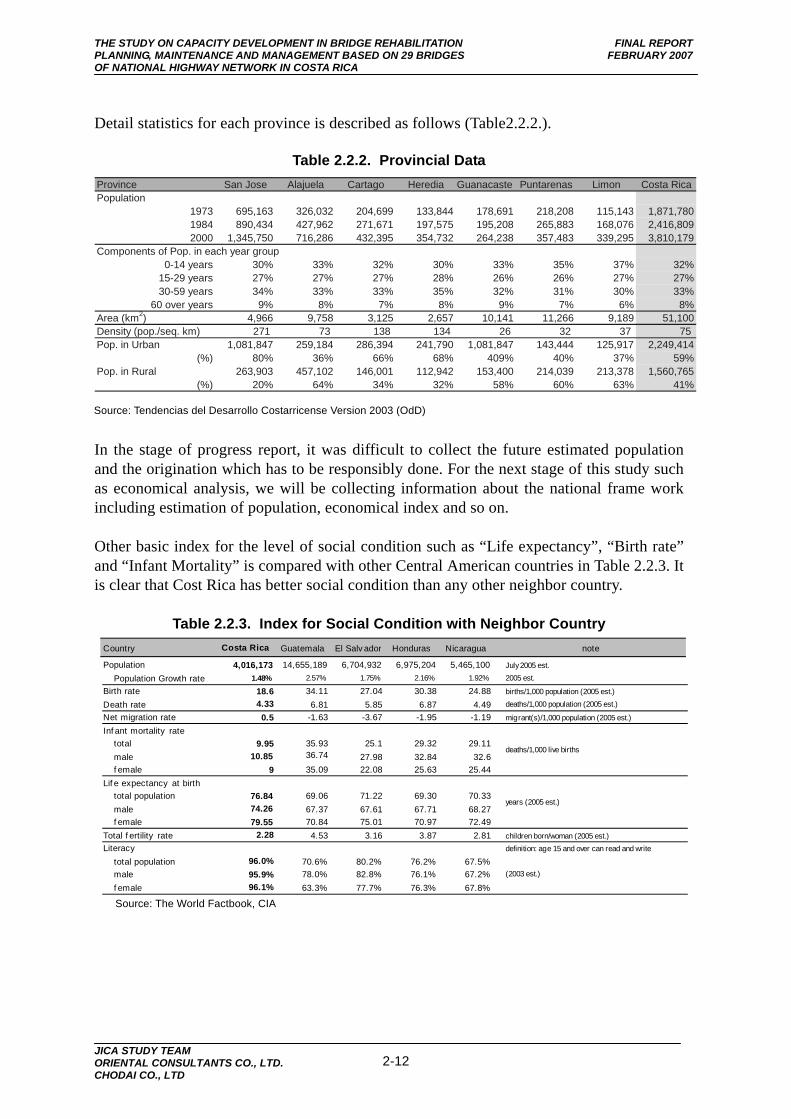
THE STUDY ON CAPACITY DEVELOPMENT IN BRIDGE REHABILITATION FINAL REPORT PLANNING, MAINTENANCE AND MANAGEMENT BASED ON 29 BRIDGES FEBRUARY 2007 OF NATIONAL HIGHWAY NETWORK IN COSTA RICA
JICA STUDY TEAM ORIENTAL CONSULTANTS CO., LTD. CHODAI CO., LTD
2-12
Detail statistics for each province is described as follows (Table2.2.2.).
Table 2.2.2. Provincial Data Province San Jose Alajuela Cartago Heredia Guanacaste Puntarenas Limon Costa RicaPopulation
1973 695,163 326,032 204,699 133,844 178,691 218,208 115,143 1,871,7801984 890,434 427,962 271,671 197,575 195,208 265,883 168,076 2,416,8092000 1,345,750 716,286 432,395 354,732 264,238 357,483 339,295 3,810,179
Components of Pop. in each year group 0-14 years 30% 33% 32% 30% 33% 35% 37% 32%
15-29 years 27% 27% 27% 28% 26% 26% 27% 27%30-59 years 34% 33% 33% 35% 32% 31% 30% 33%
60 over years 9% 8% 7% 8% 9% 7% 6% 8%Area (km2) 4,966 9,758 3,125 2,657 10,141 11,266 9,189 51,100Density (pop./seq. km) 271 73 138 134 26 32 37 75Pop. in Urban 1,081,847 259,184 286,394 241,790 1,081,847 143,444 125,917 2,249,414
(%) 80% 36% 66% 68% 409% 40% 37% 59%Pop. in Rural 263,903 457,102 146,001 112,942 153,400 214,039 213,378 1,560,765
(%) 20% 64% 34% 32% 58% 60% 63% 41% Source: Tendencias del Desarrollo Costarricense Version 2003 (OdD)
In the stage of progress report, it was difficult to collect the future estimated population and the origination which has to be responsibly done. For the next stage of this study such as economical analysis, we will be collecting information about the national frame work including estimation of population, economical index and so on.
Other basic index for the level of social condition such as “Life expectancy”, “Birth rate” and “Infant Mortality” is compared with other Central American countries in Table 2.2.3. It is clear that Cost Rica has better social condition than any other neighbor country.
Table 2.2.3. Index for Social Condition with Neighbor Country
Source: The World Factbook, CIA
Country Costa Rica Guatemala El Salv ador Honduras Nicaragua note
Population 4,016,173 14,655,189 6,704,932 6,975,204 5,465,100 July 2005 est.
Population Growth rate 1.48% 2.57% 1.75% 2.16% 1.92% 2005 est.
Birth rate 18.6 34.11 27.04 30.38 24.88 births/1,000 population (2005 est.)
Death rate 4.33 6.81 5.85 6.87 4.49 deaths/1,000 population (2005 est.)
Net migration rate 0.5 -1.63 -3.67 -1.95 -1.19 migrant(s)/1,000 population (2005 est.)
Inf ant mortality ratetotal 9.95 35.93 25.1 29.32 29.11male 10.85 36.74 27.98 32.84 32.6f emale 9 35.09 22.08 25.63 25.44
Lif e expectancy at birthtotal population 76.84 69.06 71.22 69.30 70.33male 74.26 67.37 67.61 67.71 68.27f emale 79.55 70.84 75.01 70.97 72.49
Total f ertility rate 2.28 4.53 3.16 3.87 2.81 children born/woman (2005 est.)Literacy definition: age 15 and over can read and write
total population 96.0% 70.6% 80.2% 76.2% 67.5%male 95.9% 78.0% 82.8% 76.1% 67.2%f emale 96.1% 63.3% 77.7% 76.3% 67.8%
years (2005 est.)
(2003 est.)
deaths/1,000 live births
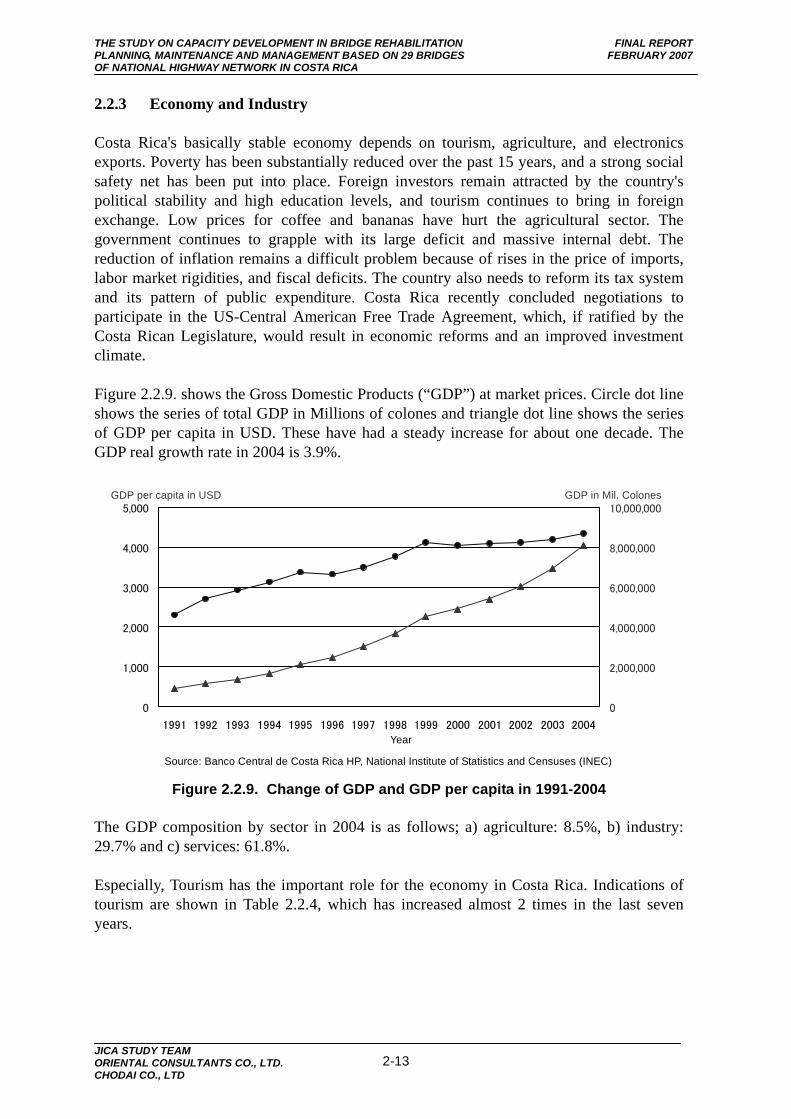
THE STUDY ON CAPACITY DEVELOPMENT IN BRIDGE REHABILITATION FINAL REPORT PLANNING, MAINTENANCE AND MANAGEMENT BASED ON 29 BRIDGES FEBRUARY 2007 OF NATIONAL HIGHWAY NETWORK IN COSTA RICA
JICA STUDY TEAM ORIENTAL CONSULTANTS CO., LTD. CHODAI CO., LTD
2-13
2.2.3 Economy and Industry
Costa Rica's basically stable economy depends on tourism, agriculture, and electronics exports. Poverty has been substantially reduced over the past 15 years, and a strong social safety net has been put into place. Foreign investors remain attracted by the country's political stability and high education levels, and tourism continues to bring in foreign exchange. Low prices for coffee and bananas have hurt the agricultural sector. The government continues to grapple with its large deficit and massive internal debt. The reduction of inflation remains a difficult problem because of rises in the price of imports, labor market rigidities, and fiscal deficits. The country also needs to reform its tax system and its pattern of public expenditure. Costa Rica recently concluded negotiations to participate in the US-Central American Free Trade Agreement, which, if ratified by the Costa Rican Legislature, would result in economic reforms and an improved investment climate.
Figure 2.2.9. shows the Gross Domestic Products (“GDP”) at market prices. Circle dot line shows the series of total GDP in Millions of colones and triangle dot line shows the series of GDP per capita in USD. These have had a steady increase for about one decade. The GDP real growth rate in 2004 is 3.9%.
0
1,000
2,000
3,000
4,000
5,000
1991 1992 1993 1994 1995 1996 1997 1998 1999 2000 2001 2002 2003 2004
0
2,000,000
4,000,000
6,000,000
8,000,000
10,000,000
Source: Banco Central de Costa Rica HP, National Institute of Statistics and Censuses (INEC)
Figure 2.2.9. Change of GDP and GDP per capita in 1991-2004
The GDP composition by sector in 2004 is as follows; a) agriculture: 8.5%, b) industry: 29.7% and c) services: 61.8%.
Especially, Tourism has the important role for the economy in Costa Rica. Indications of tourism are shown in Table 2.2.4, which has increased almost 2 times in the last seven years.
GDP per capita in USD GDP in Mil. Colones
Year
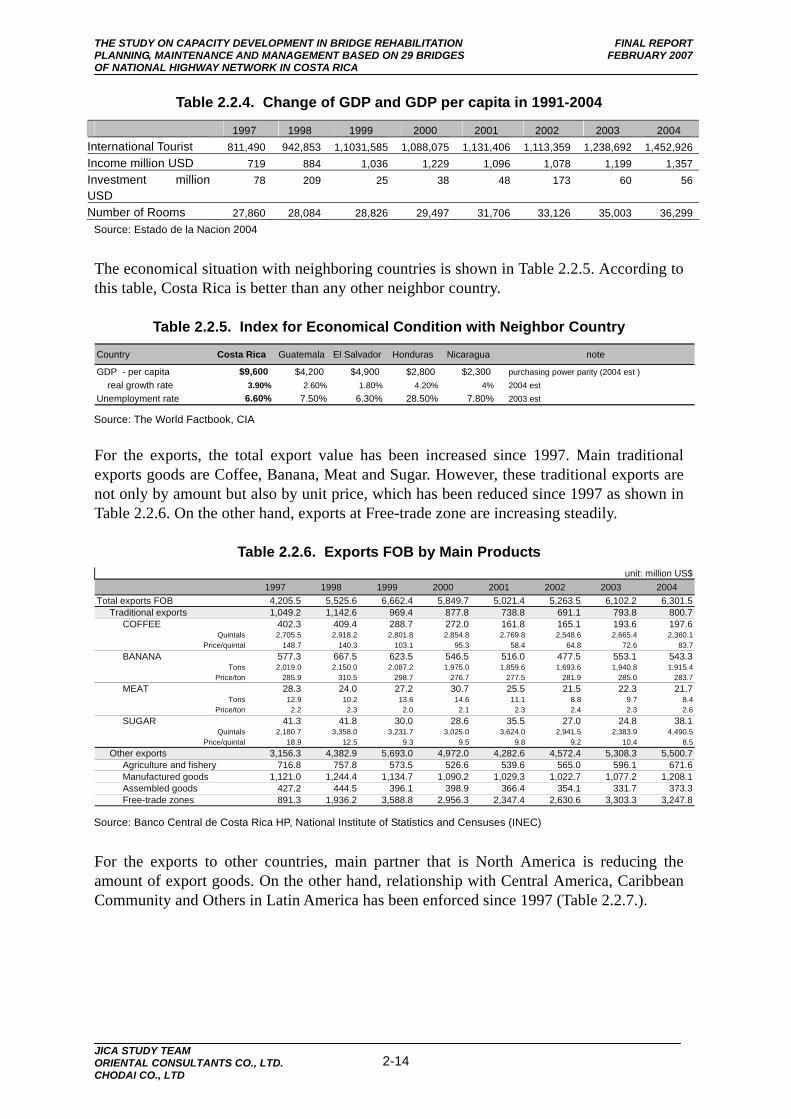
THE STUDY ON CAPACITY DEVELOPMENT IN BRIDGE REHABILITATION FINAL REPORT PLANNING, MAINTENANCE AND MANAGEMENT BASED ON 29 BRIDGES FEBRUARY 2007 OF NATIONAL HIGHWAY NETWORK IN COSTA RICA
JICA STUDY TEAM ORIENTAL CONSULTANTS CO., LTD. CHODAI CO., LTD
2-14
Table 2.2.4. Change of GDP and GDP per capita in 1991-2004
1997 1998 1999 2000 2001 2002 2003 2004 International Tourist 811,490 942,853 1,1031,585 1,088,075 1,131,406 1,113,359 1,238,692 1,452,926Income million USD 719 884 1,036 1,229 1,096 1,078 1,199 1,357Investment million USD
78 209 25 38 48 173 60 56
Number of Rooms 27,860 28,084 28,826 29,497 31,706 33,126 35,003 36,299Source: Estado de la Nacion 2004
The economical situation with neighboring countries is shown in Table 2.2.5. According to this table, Costa Rica is better than any other neighbor country.
Table 2.2.5. Index for Economical Condition with Neighbor Country
Country Costa Rica Guatemala El Salvador Honduras Nicaragua note
GDP - per capita $9,600 $4,200 $4,900 $2,800 $2,300 purchasing power parity (2004 est )real growth rate 3.90% 2.60% 1.80% 4.20% 4% 2004 est
Unemployment rate 6.60% 7.50% 6.30% 28.50% 7.80% 2003 est Source: The World Factbook, CIA For the exports, the total export value has been increased since 1997. Main traditional exports goods are Coffee, Banana, Meat and Sugar. However, these traditional exports are not only by amount but also by unit price, which has been reduced since 1997 as shown in Table 2.2.6. On the other hand, exports at Free-trade zone are increasing steadily.
Table 2.2.6. Exports FOB by Main Products unit: million US$
1997 1998 1999 2000 2001 2002 2003 2004Total exports FOB 4,205.5 5,525.6 6,662.4 5,849.7 5,021.4 5,263.5 6,102.2 6,301.5 Traditional exports 1,049.2 1,142.6 969.4 877.8 738.8 691.1 793.8 800.7 COFFEE 402.3 409.4 288.7 272.0 161.8 165.1 193.6 197.6
Quintals 2,705.5 2,918.2 2,801.8 2,854.8 2,769.8 2,548.6 2,665.4 2,360.1 Price/quintal 148.7 140.3 103.1 95.3 58.4 64.8 72.6 83.7
BANANA 577.3 667.5 623.5 546.5 516.0 477.5 553.1 543.3 Tons 2,019.0 2,150.0 2,087.2 1,975.0 1,859.6 1,693.6 1,940.8 1,915.4
Price/ton 285.9 310.5 298.7 276.7 277.5 281.9 285.0 283.7 MEAT 28.3 24.0 27.2 30.7 25.5 21.5 22.3 21.7
Tons 12.9 10.2 13.6 14.6 11.1 8.8 9.7 8.4 Price/ton 2.2 2.3 2.0 2.1 2.3 2.4 2.3 2.6
SUGAR 41.3 41.8 30.0 28.6 35.5 27.0 24.8 38.1 Quintals 2,180.7 3,358.0 3,231.7 3,025.0 3,624.0 2,941.5 2,383.9 4,490.5
Price/quintal 18.9 12.5 9.3 9.5 9.8 9.2 10.4 8.5 Other exports 3,156.3 4,382.9 5,693.0 4,972.0 4,282.6 4,572.4 5,308.3 5,500.7 Agriculture and fishery 716.8 757.8 573.5 526.6 539.6 565.0 596.1 671.6 Manufactured goods 1,121.0 1,244.4 1,134.7 1,090.2 1,029.3 1,022.7 1,077.2 1,208.1 Assembled goods 427.2 444.5 396.1 398.9 366.4 354.1 331.7 373.3 Free-trade zones 891.3 1,936.2 3,588.8 2,956.3 2,347.4 2,630.6 3,303.3 3,247.8 Source: Banco Central de Costa Rica HP, National Institute of Statistics and Censuses (INEC)
For the exports to other countries, main partner that is North America is reducing the amount of export goods. On the other hand, relationship with Central America, Caribbean Community and Others in Latin America has been enforced since 1997 (Table 2.2.7.).
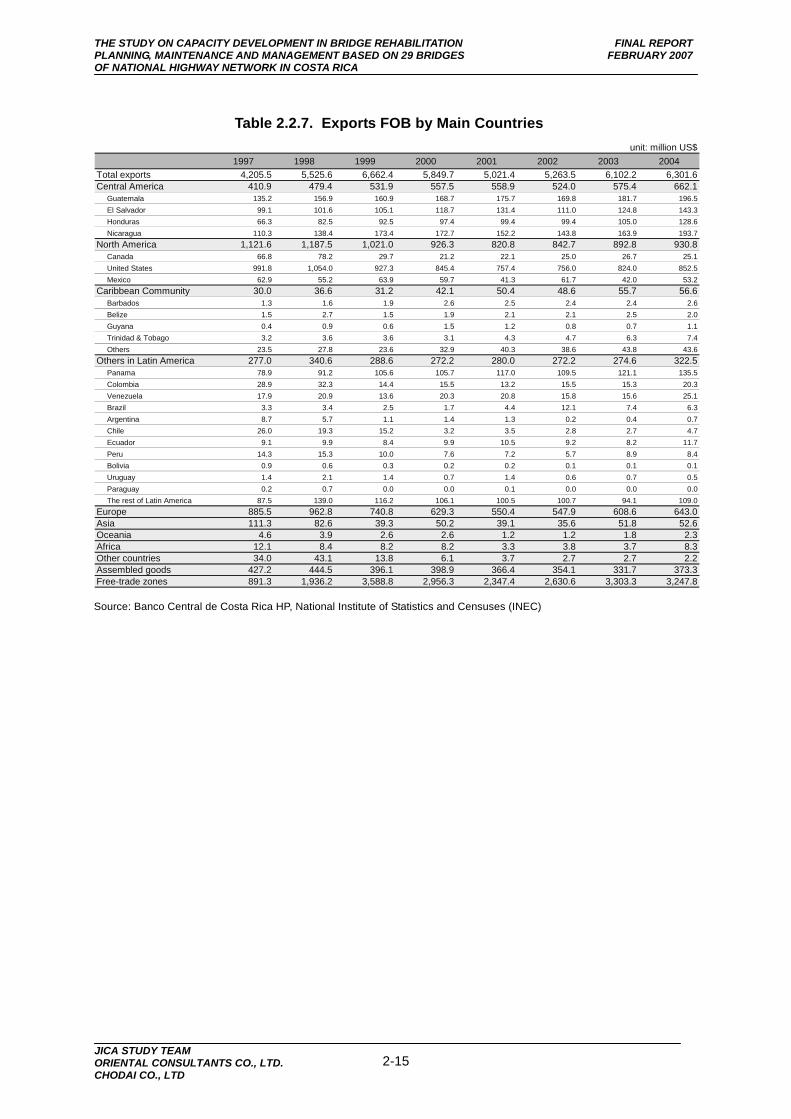
THE STUDY ON CAPACITY DEVELOPMENT IN BRIDGE REHABILITATION FINAL REPORT PLANNING, MAINTENANCE AND MANAGEMENT BASED ON 29 BRIDGES FEBRUARY 2007 OF NATIONAL HIGHWAY NETWORK IN COSTA RICA
JICA STUDY TEAM ORIENTAL CONSULTANTS CO., LTD. CHODAI CO., LTD
2-15
Table 2.2.7. Exports FOB by Main Countries
unit: million US$1997 1998 1999 2000 2001 2002 2003 2004
Total exports 4,205.5 5,525.6 6,662.4 5,849.7 5,021.4 5,263.5 6,102.2 6,301.6Central America 410.9 479.4 531.9 557.5 558.9 524.0 575.4 662.1 Guatemala 135.2 156.9 160.9 168.7 175.7 169.8 181.7 196.5 El Salvador 99.1 101.6 105.1 118.7 131.4 111.0 124.8 143.3 Honduras 66.3 82.5 92.5 97.4 99.4 99.4 105.0 128.6 Nicaragua 110.3 138.4 173.4 172.7 152.2 143.8 163.9 193.7North America 1,121.6 1,187.5 1,021.0 926.3 820.8 842.7 892.8 930.8 Canada 66.8 78.2 29.7 21.2 22.1 25.0 26.7 25.1 United States 991.8 1,054.0 927.3 845.4 757.4 756.0 824.0 852.5 Mexico 62.9 55.2 63.9 59.7 41.3 61.7 42.0 53.2Caribbean Community 30.0 36.6 31.2 42.1 50.4 48.6 55.7 56.6 Barbados 1.3 1.6 1.9 2.6 2.5 2.4 2.4 2.6 Belize 1.5 2.7 1.5 1.9 2.1 2.1 2.5 2.0 Guyana 0.4 0.9 0.6 1.5 1.2 0.8 0.7 1.1 Trinidad & Tobago 3.2 3.6 3.6 3.1 4.3 4.7 6.3 7.4 Others 23.5 27.8 23.6 32.9 40.3 38.6 43.8 43.6Others in Latin America 277.0 340.6 288.6 272.2 280.0 272.2 274.6 322.5 Panama 78.9 91.2 105.6 105.7 117.0 109.5 121.1 135.5 Colombia 28.9 32.3 14.4 15.5 13.2 15.5 15.3 20.3 Venezuela 17.9 20.9 13.6 20.3 20.8 15.8 15.6 25.1 Brazil 3.3 3.4 2.5 1.7 4.4 12.1 7.4 6.3 Argentina 8.7 5.7 1.1 1.4 1.3 0.2 0.4 0.7 Chile 26.0 19.3 15.2 3.2 3.5 2.8 2.7 4.7 Ecuador 9.1 9.9 8.4 9.9 10.5 9.2 8.2 11.7 Peru 14.3 15.3 10.0 7.6 7.2 5.7 8.9 8.4 Bolivia 0.9 0.6 0.3 0.2 0.2 0.1 0.1 0.1 Uruguay 1.4 2.1 1.4 0.7 1.4 0.6 0.7 0.5 Paraguay 0.2 0.7 0.0 0.0 0.1 0.0 0.0 0.0 The rest of Latin America 87.5 139.0 116.2 106.1 100.5 100.7 94.1 109.0Europe 885.5 962.8 740.8 629.3 550.4 547.9 608.6 643.0Asia 111.3 82.6 39.3 50.2 39.1 35.6 51.8 52.6Oceania 4.6 3.9 2.6 2.6 1.2 1.2 1.8 2.3Africa 12.1 8.4 8.2 8.2 3.3 3.8 3.7 8.3Other countries 34.0 43.1 13.8 6.1 3.7 2.7 2.7 2.2Assembled goods 427.2 444.5 396.1 398.9 366.4 354.1 331.7 373.3Free-trade zones 891.3 1,936.2 3,588.8 2,956.3 2,347.4 2,630.6 3,303.3 3,247.8 Source: Banco Central de Costa Rica HP, National Institute of Statistics and Censuses (INEC)
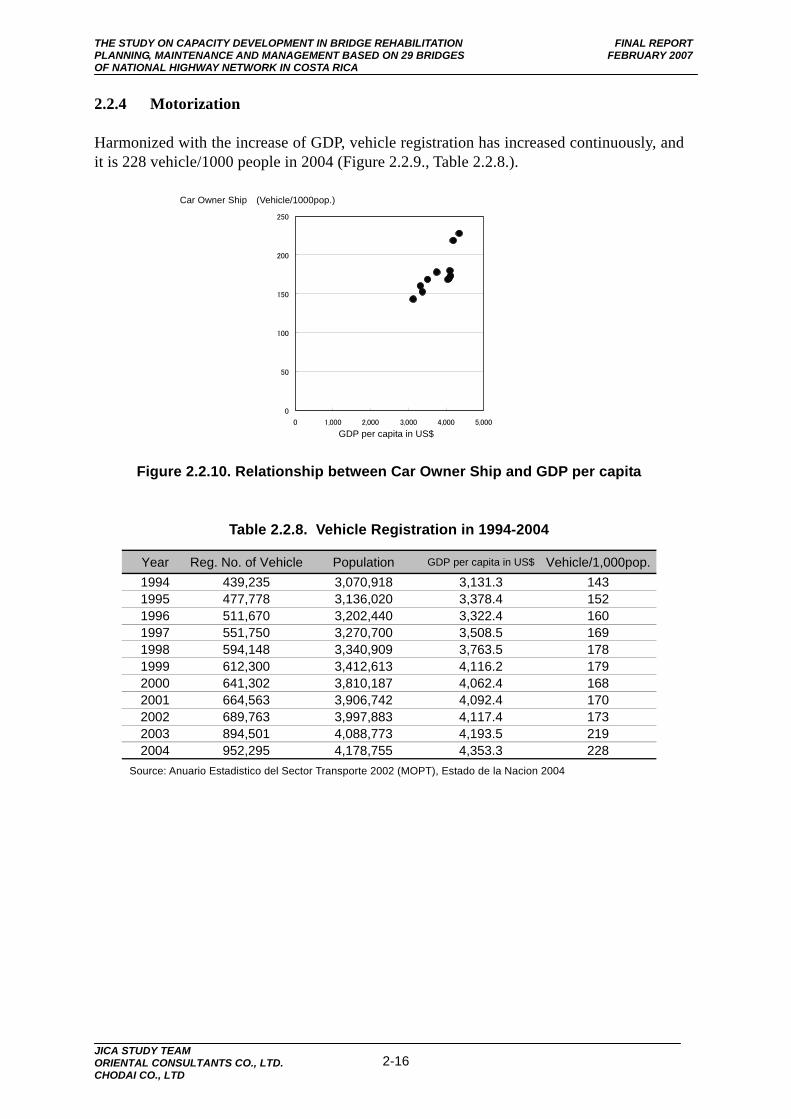
THE STUDY ON CAPACITY DEVELOPMENT IN BRIDGE REHABILITATION FINAL REPORT PLANNING, MAINTENANCE AND MANAGEMENT BASED ON 29 BRIDGES FEBRUARY 2007 OF NATIONAL HIGHWAY NETWORK IN COSTA RICA
JICA STUDY TEAM ORIENTAL CONSULTANTS CO., LTD. CHODAI CO., LTD
2-16
2.2.4 Motorization
Harmonized with the increase of GDP, vehicle registration has increased continuously, and it is 228 vehicle/1000 people in 2004 (Figure 2.2.9., Table 2.2.8.).
Figure 2.2.10. Relationship between Car Owner Ship and GDP per capita
Table 2.2.8. Vehicle Registration in 1994-2004
Year Reg. No. of Vehicle Population GDP per capita in US$ Vehicle/1,000pop.1994 439,235 3,070,918 3,131.3 1431995 477,778 3,136,020 3,378.4 1521996 511,670 3,202,440 3,322.4 1601997 551,750 3,270,700 3,508.5 1691998 594,148 3,340,909 3,763.5 1781999 612,300 3,412,613 4,116.2 1792000 641,302 3,810,187 4,062.4 1682001 664,563 3,906,742 4,092.4 1702002 689,763 3,997,883 4,117.4 1732003 894,501 4,088,773 4,193.5 2192004 952,295 4,178,755 4,353.3 228
Source: Anuario Estadistico del Sector Transporte 2002 (MOPT), Estado de la Nacion 2004
0
50
100
150
200
250
0 1,000 2,000 3,000 4,000 5,000
Car Owner Ship (Vehicle/1000pop.)
GDP per capita in US$
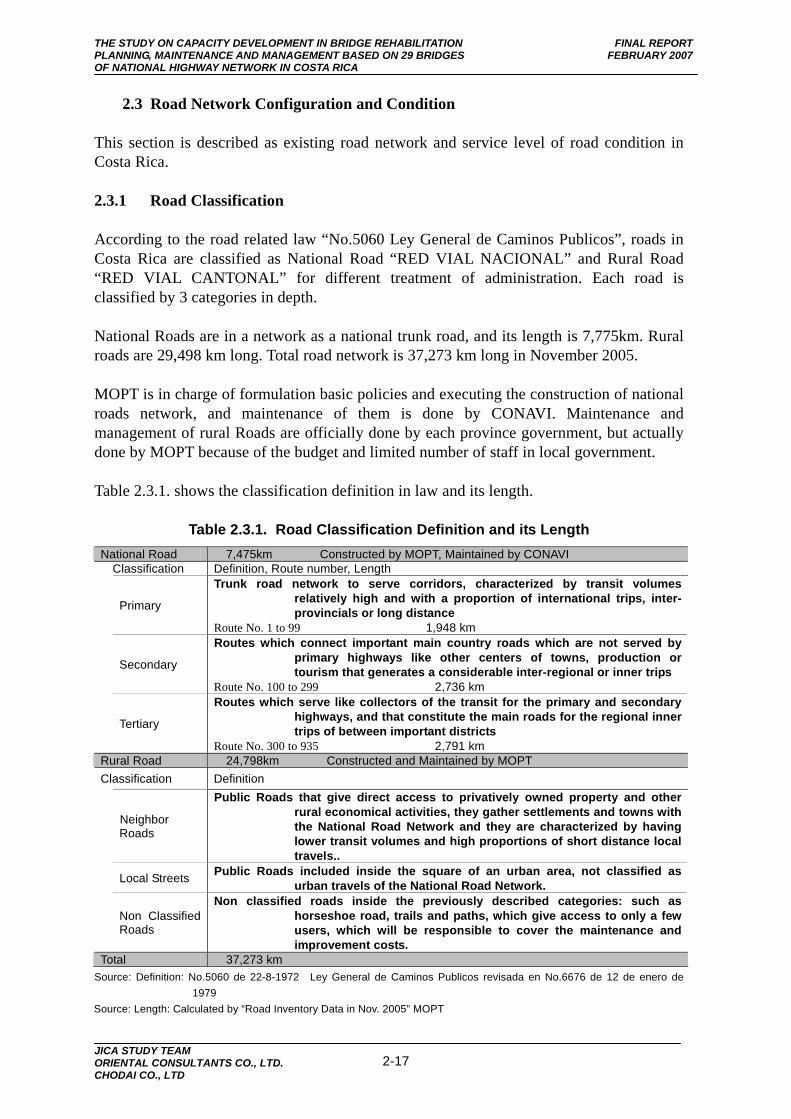
THE STUDY ON CAPACITY DEVELOPMENT IN BRIDGE REHABILITATION FINAL REPORT PLANNING, MAINTENANCE AND MANAGEMENT BASED ON 29 BRIDGES FEBRUARY 2007 OF NATIONAL HIGHWAY NETWORK IN COSTA RICA
JICA STUDY TEAM ORIENTAL CONSULTANTS CO., LTD. CHODAI CO., LTD
2-17
2.3 Road Network Configuration and Condition
This section is described as existing road network and service level of road condition in Costa Rica.
2.3.1 Road Classification
According to the road related law “No.5060 Ley General de Caminos Publicos”, roads in Costa Rica are classified as National Road “RED VIAL NACIONAL” and Rural Road “RED VIAL CANTONAL” for different treatment of administration. Each road is classified by 3 categories in depth.
National Roads are in a network as a national trunk road, and its length is 7,775km. Rural roads are 29,498 km long. Total road network is 37,273 km long in November 2005.
MOPT is in charge of formulation basic policies and executing the construction of national roads network, and maintenance of them is done by CONAVI. Maintenance and management of rural Roads are officially done by each province government, but actually done by MOPT because of the budget and limited number of staff in local government.
Table 2.3.1. shows the classification definition in law and its length.
Table 2.3.1. Road Classification Definition and its Length National Road 7,475km Constructed by MOPT, Maintained by CONAVI
Classification Definition, Route number, Length
Primary
Trunk road network to serve corridors, characterized by transit volumes relatively high and with a proportion of international trips, inter-provincials or long distance
Route No. 1 to 99 1,948 km
Secondary
Routes which connect important main country roads which are not served by primary highways like other centers of towns, production or tourism that generates a considerable inter-regional or inner trips
Route No. 100 to 299 2,736 km
Tertiary
Routes which serve like collectors of the transit for the primary and secondary highways, and that constitute the main roads for the regional inner trips of between important districts
Route No. 300 to 935 2,791 km Rural Road 24,798km Constructed and Maintained by MOPT Classification Definition
Neighbor Roads
Public Roads that give direct access to privatively owned property and other rural economical activities, they gather settlements and towns with the National Road Network and they are characterized by having lower transit volumes and high proportions of short distance local travels..
Local Streets Public Roads included inside the square of an urban area, not classified as urban travels of the National Road Network.
Non Classified Roads
Non classified roads inside the previously described categories: such as horseshoe road, trails and paths, which give access to only a few users, which will be responsible to cover the maintenance and improvement costs.
Total 37,273 km Source: Definition: No.5060 de 22-8-1972 Ley General de Caminos Publicos revisada en No.6676 de 12 de enero de
1979 Source: Length: Calculated by “Road Inventory Data in Nov. 2005” MOPT
THE STUDY ON CAPACITY DEVELOPMENT IN BRIDGE REHABILITATION FINAL REPORT PLANNING, MAINTENANCE AND MANAGEMENT BASED ON 29 BRIDGES FEBRUARY 2007 OF NATIONAL HIGHWAY NETWORK IN COSTA RICA
JICA STUDY TEAM ORIENTAL CONSULTANTS CO., LTD. CHODAI CO., LTD
2-18
Planning section in MOPT has the Geographic Information System ((hereafter referred to as “GIS”) data for road network and its property data, which is established by ARC-GIS software. GIS data had been digitalized on the screen using the geographical image map scaled 1:50,000 where most of the national road network is established and some of the property data such as pavement condition is already stored.
For the bridges, MOPT is developing its location in ARC-GIS. However many of its location data is stored in inventory data which has a deference in actual location. Therefore each location is checked one by one for about 1,300 bridges. Locations of traffic volume collection described in the next section are also in the same situation so that it is under construction now.
According to the category of national road, 29 study bridges are on the “Primary” road except No.29 Bridge on Route 218.
Figure 2.3.1. shows the network colored by 3 categories of road classification in the whole country of Costa Rica, Figure 2.3.2. shows the Metropolitan Area, Figure 2.3.3 to 2.3.9 show the network in each province in detail.
For the road design standard, the Department of Road Design in MOPT, uses a hybrid between the followings Standards as its elements of geometric design criteria:
- A Policy on Geometric Design of Highways and Streets (1994), AASHTO, U.S.A.
- Manual of Road Geometric Project (1995), SOP (Secretary of Publics Works), Mexico
- Rules for Geometric Design of Regional Roads (2004), SIECA (Secretaría de Integración Económica Centroamericana: Central American Secretary of the Economic Integration)
Actually they mix these three specifications for a specific design for national or rural road.
It is important to say for PPP (Plan Puebla Panamá), it is necessary to use the SIECA specifications.
In this moment, they are working in the elaboration of a National Manual for Cantonal Roads.

2-19
JICA
STUD
Y TEAM
OR
IENTA
L CO
NSU
LTAN
TS CO
., LTD.
CH
OD
AI C
O., LTD
THE STU
DY O
N C
APA
CITY D
EVELOPM
ENT IN
BR
IDG
E REH
AB
ILITATION
FIN
AL R
EPOR
T
PLAN
NIN
G, MA
INTEN
AN
CE A
ND
MA
NA
GEM
ENT B
ASED
ON
29 BR
IDG
ES FEB
RU
AR
Y 2007
OF N
ATION
AL H
IGH
WAY N
ETWO
RK
IN C
OSTA
RIC
A
Figure 2.3.1. Road Network (Each Category) in Costa Rica

THE STUDY ON CAPACITY DEVELOPMENT IN BRIDGE REHABILITATION FINAL REPORT PLANNING, MAINTENANCE AND MANAGEMENT BASED ON 29 BRIDGES FEBRUARY 2007 OF NATIONAL HIGHWAY NETWORK IN COSTA RICA
JICA STUDY TEAM ORIENTAL CONSULTANTS CO., LTD. CHODAI CO., LTD
2-20
Figure 2.3.2. Road Network (Each Category) in the Great Metropolitan Area
Figure 2.3.4. Road Network in Cartago Province
Figure 2.3.3. Road Network in San Jose Province

THE STUDY ON CAPACITY DEVELOPMENT IN BRIDGE REHABILITATION FINAL REPORT PLANNING, MAINTENANCE AND MANAGEMENT BASED ON 29 BRIDGES FEBRUARY 2007 OF NATIONAL HIGHWAY NETWORK IN COSTA RICA
JICA STUDY TEAM ORIENTAL CONSULTANTS CO., LTD. CHODAI CO., LTD
2-21
Figure 2.3.6. Road Network in Guanacaste Province
Figure 2.3.5. Road Network in Alajuela Province
Figure 2.3.8. Road Network in Limon Province
Figure 2.3.7. Road Network in Heredia Province

THE STUDY ON CAPACITY DEVELOPMENT IN BRIDGE REHABILITATION FINAL REPORT PLANNING, MAINTENANCE AND MANAGEMENT BASED ON 29 BRIDGES FEBRUARY 2007 OF NATIONAL HIGHWAY NETWORK IN COSTA RICA
JICA STUDY TEAM ORIENTAL CONSULTANTS CO., LTD. CHODAI CO., LTD
2-22
Figure 2.3.9. Road Network in Puntarenas Province 2.3.2 Traffic Volume
Traffic Volume in Costa Rica has been collected by Planning Section in MOPT since 1987. There are 533 stations on the national road. For example, route 1 has 22 stations, route 2 has 21 stations, route 4 has 15 stations, route 32 has 9 stations and route 218 has 9 stations.
Vehicles are divided by 5 classified categories for traffic volume, such as 1.Passenger Car, 2.Truck (2-axial), 3.Truck (3-axial), 4.Bus and 5.Ttuck (5-axial). Traffic per Day (TPD) is just summed up to the counted data of each category.
In the report of annual traffic volume, there is an estimated traffic volume in the sheet. This estimated data is calculated by the method of trends of the previous year (using the same ratio of annual increase ratio). It is not used for traffic planning but used just for estimation of number of enumerators.
According to the inventory data for the national road section, which includes traffic volumes, even on the primary road, there is 13% of its length in a range of more than 10,000 vehicles per day, 21% is in the range between 5,000 to 9,999 vehicle per day, 56% is in the range between 1,000 to 4,999. On the secondary class, about 85% of its length is in a range of less than 5,000 vehicle per day and on the tertiary class is 42% of its length is in a range of less than 500 vehicles per day.
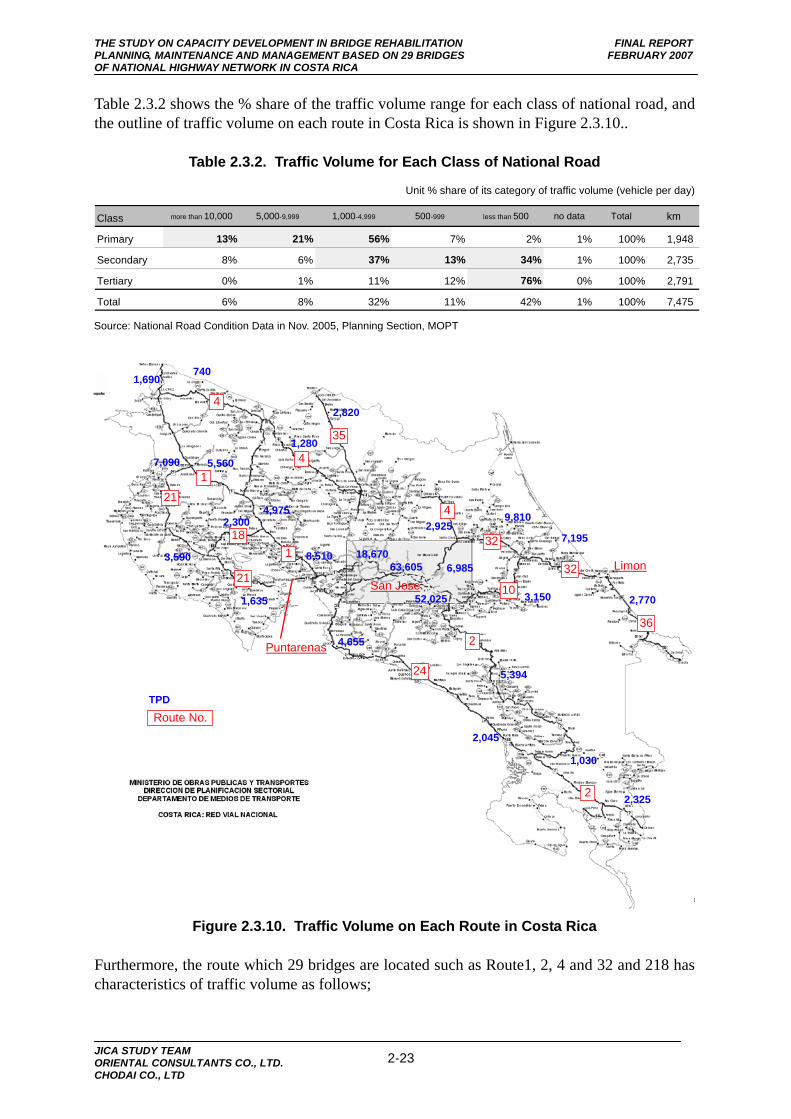
THE STUDY ON CAPACITY DEVELOPMENT IN BRIDGE REHABILITATION FINAL REPORT PLANNING, MAINTENANCE AND MANAGEMENT BASED ON 29 BRIDGES FEBRUARY 2007 OF NATIONAL HIGHWAY NETWORK IN COSTA RICA
JICA STUDY TEAM ORIENTAL CONSULTANTS CO., LTD. CHODAI CO., LTD
2-23
Table 2.3.2 shows the % share of the traffic volume range for each class of national road, and the outline of traffic volume on each route in Costa Rica is shown in Figure 2.3.10..
Table 2.3.2. Traffic Volume for Each Class of National Road
Unit % share of its category of traffic volume (vehicle per day)
Class more than 10,000 5,000-9,999 1,000-4,999 500-999 less than 500 no data Total km
Primary 13% 21% 56% 7% 2% 1% 100% 1,948
Secondary 8% 6% 37% 13% 34% 1% 100% 2,735
Tertiary 0% 1% 11% 12% 76% 0% 100% 2,791
Total 6% 8% 32% 11% 42% 1% 100% 7,475 Source: National Road Condition Data in Nov. 2005, Planning Section, MOPT
Figure 2.3.10. Traffic Volume on Each Route in Costa Rica
Furthermore, the route which 29 bridges are located such as Route1, 2, 4 and 32 and 218 has characteristics of traffic volume as follows;
San Jose
1
21
18
21
4
4
4
32
36
32
10
1
2
2
35
24
Limon
Puntarenas
1,690 740
1,280
2,820
2,9259,810
7,195
2,7703,150
5,394
1,030
2,325
2,045
4,655
7,090
3,590
2,300
1,635
6,985
52,025
63,60518,6708,510
4,975
5,560
TPD Route No.

THE STUDY ON CAPACITY DEVELOPMENT IN BRIDGE REHABILITATION FINAL REPORT PLANNING, MAINTENANCE AND MANAGEMENT BASED ON 29 BRIDGES FEBRUARY 2007 OF NATIONAL HIGHWAY NETWORK IN COSTA RICA
JICA STUDY TEAM ORIENTAL CONSULTANTS CO., LTD. CHODAI CO., LTD
2-24
- Traffic volume on more than 50km far from San Jose is, Route 1: 13,000 TPD Route 2: 5,000 TPD Route 32: 10,000 TPD
- Route 32 has more heavy vehicles on the roads than any other route. It seems to be caused by the goods transported to Limon port for export (and import).
- 29 study bridges are located on the road that has about 5,000-10,000 TPD except No.1 (60,000 TPD) and No.29 (45,000 TPD).
Traffic volume changes on each route are shown in Figure 2.3.11. and Table 2.3.3.
-
10,000
20,000
30,000
40,000
50,000
60,000
70,000
80,000
0 50 100 150 200 250 300 350
R1 R2 R4 R32
Source: Traffic Volume Data 2002-2003, Planning Section, MOPT
Figure 2.3.11. Traffic Volume on Each Route
Table 2.3.3. Traffic Volume on Each Route
Source: Planning Section, MOPT
Route Station Survey12/24Hr. Kp Light
Vehicles Two Axles Three Axles Buses Five Axles Total (24Hr./12Hr.) TPD Ratio of HeavyVehicle
Ratio ofFive axles
1 101 24 1.5 57.397 1.346 1.035 2.387 597 62.762 1.29 62.762 9% 1.0%1 106 12 3.0 52.145 1.247 828 2.118 1.284 57.622 77.552 10% 2.2%1 EP15 24 12.0 54.123 1.158 657 1.507 1.031 58.476 1.3 58.476 7% 1.8%1 122 12 26.4 12.119 382 218 738 647 14.104 18.982 14% 4.6%1 157 12 42.5 7.525 327 325 457 375 9.009 12.125 16% 1.2%1 513 24 87.5 5.448 334 246 596 594 7.218 1.45 7.218 25% 8.2%1 512 12 92.4 8.279 336 190 517 401 9.723 13.086 15% 4.1%1 506 12 94.0 5.996 218 119 245 129 6.707 9.027 11% 1.9%1 501 12 212.0 2.255 60 38 141 162 2.656 3.575 15% 6.1%1 755 12 270.0 1.402 57 52 141 128 1, 780 2.396 21% 7.2%2 EP10 24 5.0 34.972 830 494 1.032 689 38.017 1.41 38.017 8% 1.8%2 568 12 17.8 32.87 953 611 1.402 888 36.724 51.441 10% 2.4%2 165 12 20.9 23.058 544 285 574 479 24, 940 34.934 8% 1.9%2 166 12 27.6 6.748 180 94 192 99 7.313 10.244 8% 1.4%2 EP07 24 40.7 3.174 136 78 166 204 3.758 1.39 3.758 16% 5.4%2 572 12 45.5 1.842 78 39 111 96 2.166 3.034 15% 4.4%2 682 12 46.0 1.565 78 62 93 76 1.874 2.625 16% 4.1%2 741 12 110.0 1.165 64 47 97 95 1.468 2.056 21% 6.5%2 709 12 135.0 1.922 90 50 104 86 2.252 3.154 15% 3.8%2 223 12 257.0 1.039 36 26 48 68 1.217 1.705 15% 5.6%2 711 12 317.0 1.457 48 20 52 65 1.642 2.3 11% 4.0%2 EP04 12 350.0 264 11 4 1 10 290 406 9% 3.4%4 158 12 31.0 1.83 75 38 81 76 2, 100 2, 940 13% 3.6%4 182 12 37.0 1.671 144 64 83 119 2.081 2.913 20% 5.7%
32 174 12 6.7 15.428 322 217 660 561 17.188 24.063 10% 3.3%32 328 12 62.0 4.812 251 145 472 522 6.202 8.683 22% 8.4%32 247 12 123.0 3.795 308 208 376 391 5.078 7.109 25% 7.7%32 278 12 149.0 5.711 337 226 662 625 7.561 10.585 24% 8.3%
(Km) from San Jose
(TPD Vehicle/Day)
0%
5%
10%
15%
20%
25%
R1 R2 R4 R32
Goods
Vehicle
14%13%
16%
21%
4% 4% 5% 7%
Ratio of heavy vehicle (average on each route)
5 axis Truck
1
29
20 21
17,18 19
23 22 24 2 25 26 283
27
4
9 14
5 6 7 8
10 1112
13
15 16
R218

THE STUDY ON CAPACITY DEVELOPMENT IN BRIDGE REHABILITATION FINAL REPORT PLANNING, MAINTENANCE AND MANAGEMENT BASED ON 29 BRIDGES FEBRUARY 2007 OF NATIONAL HIGHWAY NETWORK IN COSTA RICA
JICA STUDY TEAM ORIENTAL CONSULTANTS CO., LTD. CHODAI CO., LTD
2-25
For the description of route 32, the percentage of heavy vehicles is higher than the other routes. Table 2.3.3. shows the statistics of the amount of trade in each port in Costa Rica in 2002 where Limon port is located at the end point of route 32 from San Jose, is the main port in this country.
Table 2.3.4. Tones of Goods Deal with the Port Unit: Tons in 2002
Caldera P. Morales Puntarenas Limon y Moin Total Export 200,723 201,118 2,510 3,298,387 3,702,738Import 2,105,481 34,203 70,927 3,857,165 6,067,776Total 2,306,204 235,321 73,437 7,155,552 9,770,514
Source: Anuario Estadistico del Sector Transporte 2002, MOPT Another traffic related survey such as “Axial Load Survey” is also conducted in MOPT.
2.3.3 Road Maintenance
The section is described as the Road maintenance especially maintenance and rehabilitation of road pavement in Costa Rica.
At first, it should be highlighted that there are different system for road maintenance between national road and rural road.
For the national road, CONAVI is in charge of making the budget and decision for maintenance and rehabilitation. Primary inspection, data entry to inventory database and priority plan for maintenance are conducted by MOPT. MOPT submit “ PROGRAMACION” to CONAVI in every year that contains the program list for the rehabilitation plan including the estimated cost used by HDM-III. For handling of HDM-III, the inspection system “DESY ROUTE” and database system “DESY VISAGE” are on action. DESY ROUTE is the special vehicle for the automatic inspection on the condition of pavement and road elements (note: there were tow vehicles in MOPT, but these were not in used because of troubles in the system, now DESYSEMI is acting on behalf of DESY ROUTE as a manual inspection data entry system) supported by French government. HDM-III is the international system which is introduced and enforced to use by IMF.
For the rural road, MOPT and local government are in charge of making the budget and the decision for maintenance and rehabilitation. The system for the pavement management system is named as “SPEM: Sistema de Programacion y Ejecucion del Mantenimiento Vital” which is established by MOPT’s engineers supported by GTZ in 1990’s. However, there are still rural roads wich condition has not been inspected yet.
Figure 2.3.12 shows the outline of the stream for pavement maintenance system of “National Road” and Figure 2.3.13 shows the outline of the stream for “Rural Road”. Both system treat the bridge only as the condition of pavement.

THE STUDY ON CAPACITY DEVELOPMENT IN BRIDGE REHABILITATION FINAL REPORT PLANNING, MAINTENANCE AND MANAGEMENT BASED ON 29 BRIDGES FEBRUARY 2007 OF NATIONAL HIGHWAY NETWORK IN COSTA RICA
JICA STUDY TEAM ORIENTAL CONSULTANTS CO., LTD. CHODAI CO., LTD
2-26
Source: Planning Section (MOPT), Planning and Control Department (CONAVI)
Figure 2.3.12. Outline of Stream for National Road Maintenance
Source: Planning Section (MOPT)
Figure 2.3.13. Outline of Stream for Rural Road Maintenance
Table 2.3.5. shows the human resource for inspector and planner for the planning of road pavement rehabilitation in MOPT.
MOPT
CONAVI Inspection
Data Entry
Cost Estimation Priority Plan
Maintenance Implementation
Road User’s Request Local Gov.’s Request
Inventory of Request
Budget Rest.
HDM III
DESY VISAGE
DESY ROUTE (DYSY SEMI)
2 Vehicles
PROGRAMMING
Details Inspection / Design / Cost Estimation
MOPT Regional Office (13 office)
Inspection
Engineer, Inspector
Data Entry Inventory Data
Cost Estimation / Priority Plan
Maintenance Implementation ( 3 Mode ) 1. Administration Mode (MOPT only),
2. Agreement Mode (joint with MOPT, Local Gov.) 3. Association Mode (Private Company)
Annual Plan of Road Conservation
Budget Rest.
SPEM
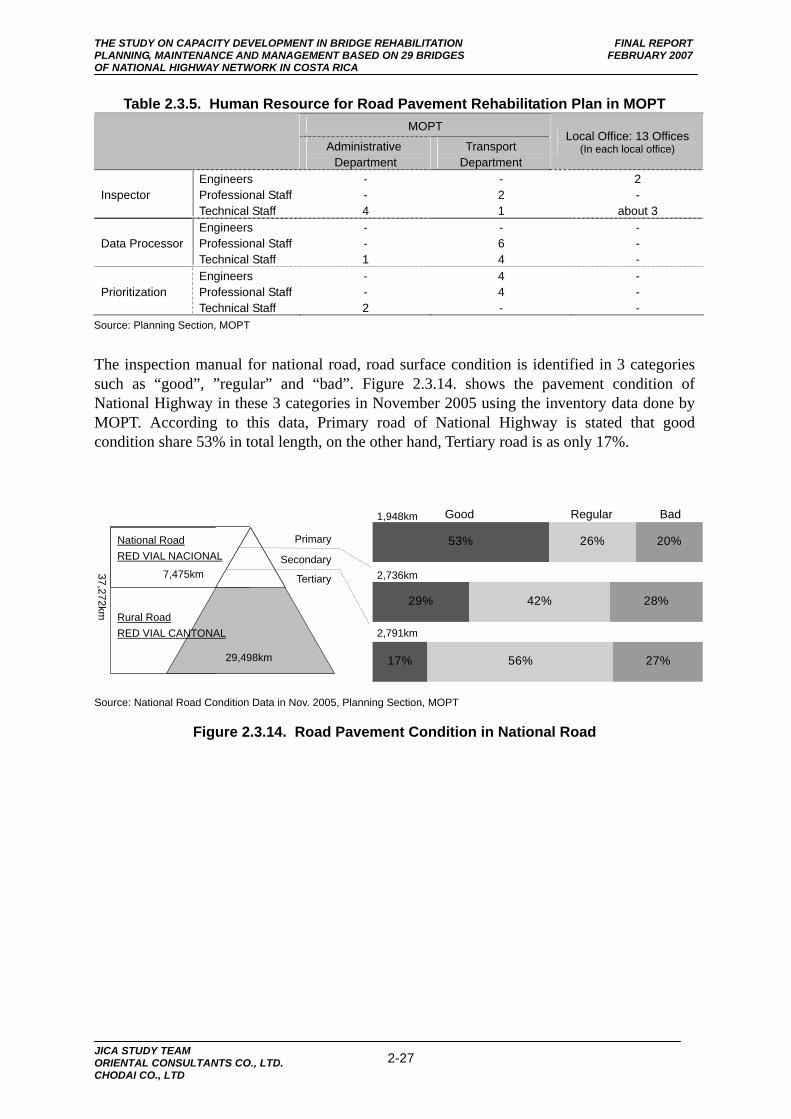
THE STUDY ON CAPACITY DEVELOPMENT IN BRIDGE REHABILITATION FINAL REPORT PLANNING, MAINTENANCE AND MANAGEMENT BASED ON 29 BRIDGES FEBRUARY 2007 OF NATIONAL HIGHWAY NETWORK IN COSTA RICA
JICA STUDY TEAM ORIENTAL CONSULTANTS CO., LTD. CHODAI CO., LTD
2-27
Table 2.3.5. Human Resource for Road Pavement Rehabilitation Plan in MOPT MOPT
Administrative Department
Transport Department
Local Office: 13 Offices (In each local office)
Inspector Engineers Professional Staff Technical Staff
- - 4
- 2 1
2 -
about 3
Data Processor Engineers Professional Staff Technical Staff
- - 1
- 6 4
- - -
Prioritization Engineers Professional Staff Technical Staff
- - 2
4 4 -
- - -
Source: Planning Section, MOPT
The inspection manual for national road, road surface condition is identified in 3 categories such as “good”, ”regular” and “bad”. Figure 2.3.14. shows the pavement condition of National Highway in these 3 categories in November 2005 using the inventory data done by MOPT. According to this data, Primary road of National Highway is stated that good condition share 53% in total length, on the other hand, Tertiary road is as only 17%.
Source: National Road Condition Data in Nov. 2005, Planning Section, MOPT
Figure 2.3.14. Road Pavement Condition in National Road
53%
29%
17%
26%
42%
56%
20%
28%
27%
National Road RED VIAL NACIONAL
37,272km
7,475km
29,498km
Rural Road RED VIAL CANTONAL
Primary
Secondary
Tertiary
1,948km
2,736km
2,791km
Good BadRegular