USCG Search and Rescue Final 5-10-2007
20
5/10/2007 I I O O O O S S a a n n d d U U n n i i t t e e d d S S t t a a t t e e s s C C o o a a s s t t G G u u a a r r d d S S e e a a r r c c h h a a n n d d R R e e s s c c u u e e R R e e s s p p o o n n s s i i b b i i l l i i t t i i e e s s What does IOOS do? IOOS (Integrated Ocean Observing System) is a multidisciplinary system designed to provide ocean and coastal data in the formats, rates, and scales required for decision-making, based initially on the integration of existing private, federal, state, and local systems. Consisting of three major subsystems (see figure at right), IOOS will constantly evolve according to user needs. Currently, numerous ocean and weather data collection systems are maintained by scores of federal, state, and non-governmental agencies and organizations. IOOS is gathering these useful but disparate and isolated data sources into integrated systems, giving users ready access to all ocean-related data gathered by all possible sources. In addition, IOOS will allow any compilation of data specified by the user to be manipulated using myriad existing forecasting models, thereby turning raw numbers into actionable information relevant to the user’s specific concerns. Finally, IOOS is seeking new research and enhancements to add to its already-extensive catalog of products. In this way, IOOS becomes a flexible, adaptable system capable of keeping up with new developments while maintaining the reliable delivery of data, analyses, and forecasting results. IOOS will focus initially on a series of high priorities. How can IOOS Help USCG Search and Rescue Operations? One of the activities for which the USCG is most publicly known is its search and rescue (SAR) program. The primary objectives of the USCG SAR program are fourfold: 1. Minimize loss of life, injury, and property loss and damage in the maritime environment; 2. Minimize crew risk during SAR missions; 3. Optimize use of resources in conducting SAR; and 4. Maintain a world leadership position in maritime SAR The USCG has also set quantifiable SAR goals for itself, including, after USCG notification and in waters over which the USCG has SAR responsibility, saving at least 93% of all people whose lives are in distress. Additionally, the USCG aims to prevent the loss of 80% of the property at risk of destruction. 1 In pursuit of these goals, the USCG has established several self-regulating standards that they strive to achieve and even surpass, including a maximum of a two-hour response time from notification to arrival on scene. The USCG has recently begun using a Search and Rescue Optimal Planning System (SAROPS). Using the Environmental Data Server (EDS) at the USCG’s Operational System Center in West Virginia, oceanographic conditions (e.g., wind and currents) are collected, converted into a compatible format, and uploaded to SAROPS, either by request or four times daily. Having access to real-time ocean current information is critical for numerous maritime-based activities, but the USCG’s SAR operations can especially benefit. Rutgers University’s Coastal Ocean Observation Lab (COOL) maintains the only operational high-frequency (HF) radar network in the eastern United States. Coastal Ocean Dynamics Application Radar (CODAR) consists of several pairs of antenna sites on the New Jersey coast. For each pair of sites, one remote site broadcasts radio waves across the ocean surface; the second remote site picks up the signal after it has been bounced back by the ocean waves. The measurements gathered from these two sites are used to determine the net movement of the water’s surface, and, therefore, the surface current speed in real-time. Presently, this CODAR system covers virtually 1 USCG. 2007. SAR Program Information. 2/2/07. http://www.uscg.mil/hq/g-o/g-opr/sar_program.htm . 1. OBSERVING SUBSYSTEM Gathers in situ and remote measurements and data telemetry 3. DATA ANALYSIS & MODELING SUBSYSTEM Develops and applies models for forecasting ocean conditions. 2. DATA MANAGEMENT & COMMUNICATIONS SUBSYSTEM Processes and standardizes data received from observing subsystem END USERS
Transcript of USCG Search and Rescue Final 5-10-2007
5/10/2007
IIOOOOSS aanndd UUnniitteedd SSttaatteess CCooaasstt GGuuaarrdd SSeeaarrcchh aanndd RReessccuuee RReessppoonnssiibbiilliittiieess
WWhhaatt ddooeess IIOOOOSS ddoo??
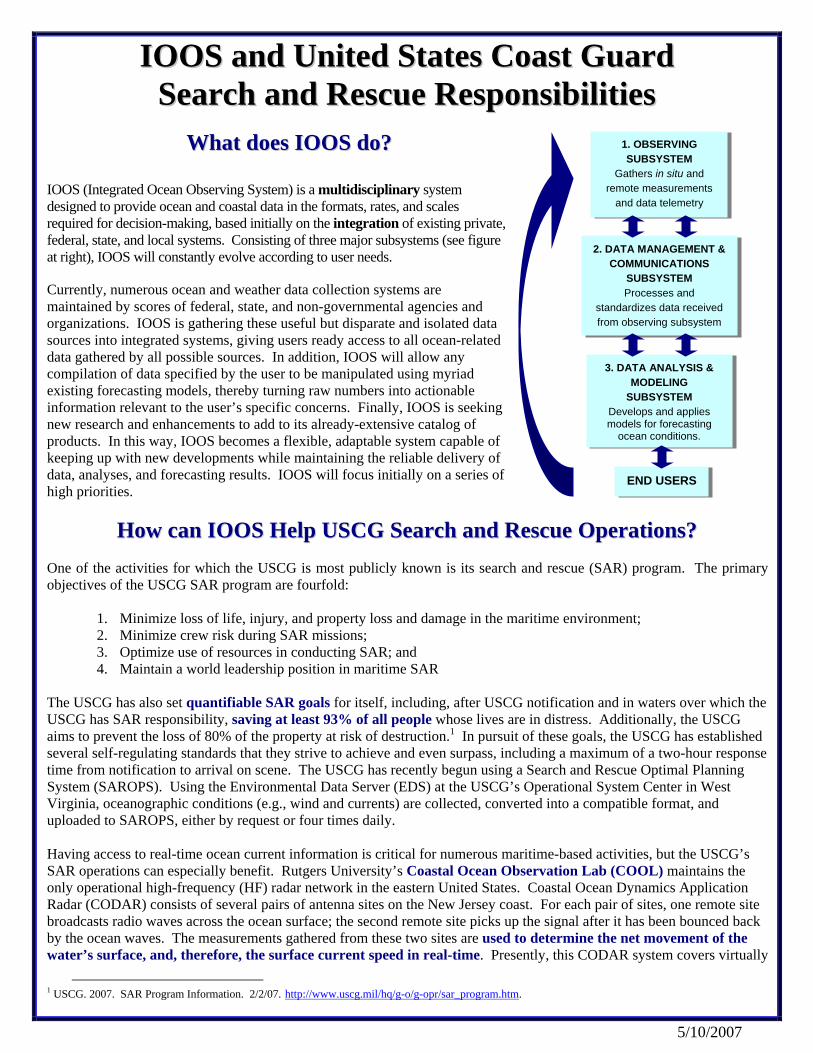
IOOS (Integrated Ocean Observing System) is a multidisciplinary system designed to provide ocean and coastal data in the formats, rates, and scales required for decision-making, based initially on the integration of existing private, federal, state, and local systems. Consisting of three major subsystems (see figure at right), IOOS will constantly evolve according to user needs. Currently, numerous ocean and weather data collection systems are maintained by scores of federal, state, and non-governmental agencies and organizations. IOOS is gathering these useful but disparate and isolated data sources into integrated systems, giving users ready access to all ocean-related data gathered by all possible sources. In addition, IOOS will allow any compilation of data specified by the user to be manipulated using myriad existing forecasting models, thereby turning raw numbers into actionable information relevant to the user’s specific concerns. Finally, IOOS is seeking new research and enhancements to add to its already-extensive catalog of products. In this way, IOOS becomes a flexible, adaptable system capable of keeping up with new developments while maintaining the reliable delivery of data, analyses, and forecasting results. IOOS will focus initially on a series of high priorities.
HHooww ccaann IIOOOOSS HHeellpp UUSSCCGG SSeeaarrcchh aanndd RReessccuuee OOppeerraattiioonnss??
One of the activities for which the USCG is most publicly known is its search and rescue (SAR) program. The primary objectives of the USCG SAR program are fourfold:
1. Minimize loss of life, injury, and property loss and damage in the maritime environment; 2. Minimize crew risk during SAR missions; 3. Optimize use of resources in conducting SAR; and 4. Maintain a world leadership position in maritime SAR
The USCG has also set quantifiable SAR goals for itself, including, after USCG notification and in waters over which the USCG has SAR responsibility, saving at least 93% of all people whose lives are in distress. Additionally, the USCG aims to prevent the loss of 80% of the property at risk of destruction.1 In pursuit of these goals, the USCG has established several self-regulating standards that they strive to achieve and even surpass, including a maximum of a two-hour response time from notification to arrival on scene. The USCG has recently begun using a Search and Rescue Optimal Planning System (SAROPS). Using the Environmental Data Server (EDS) at the USCG’s Operational System Center in West Virginia, oceanographic conditions (e.g., wind and currents) are collected, converted into a compatible format, and uploaded to SAROPS, either by request or four times daily. Having access to real-time ocean current information is critical for numerous maritime-based activities, but the USCG’s SAR operations can especially benefit. Rutgers University’s Coastal Ocean Observation Lab (COOL) maintains the only operational high-frequency (HF) radar network in the eastern United States. Coastal Ocean Dynamics Application Radar (CODAR) consists of several pairs of antenna sites on the New Jersey coast. For each pair of sites, one remote site broadcasts radio waves across the ocean surface; the second remote site picks up the signal after it has been bounced back by the ocean waves. The measurements gathered from these two sites are used to determine the net movement of the water’s surface, and, therefore, the surface current speed in real-time. Presently, this CODAR system covers virtually
1 USCG. 2007. SAR Program Information. 2/2/07. http://www.uscg.mil/hq/g-o/g-opr/sar_program.htm.
1. OBSERVING SUBSYSTEM
Gathers in situ and remote measurements
and data telemetry
3. DATA ANALYSIS & MODELING
SUBSYSTEM Develops and applies models for forecasting
ocean conditions.
2. DATA MANAGEMENT & COMMUNICATIONS
SUBSYSTEM Processes and
standardizes data received from observing subsystem
END USERS

5/10/2007
the entire offshore New Jersey region, out to 100 nautical miles (nm); the most high-resolution results (detected by shorter range radar), however, are detected out to 20 nm (see example map below).
In addition to this existing Rutgers system, the Mid-Atlantic Coastal Ocean Observing Regional Association (MACOORA) has formed a coalition of HF radar operators from southern New England to North Carolina as a pilot project for a future nationwide system. By combining and collating efforts, eleven long-range HF radar sites and three short-range (but higher resolution) sites in the Mid-Atlantic Bight (MAB) area will form a regional network that will measure real-time ocean currents for the majority of the MAB shelf. HF radar networks like the existing CODAR system and the planned MACOORA consortium provide high-resolution information about the state of the ocean, down to detailed accuracy of characteristics like coastal eddies, wave height, and other mesoscale features. As demonstrated by Rutgers COOL, sea surface temperatures and other relevant remotely sensed ocean data can be combined with
the real-time current information to provide critical decision-making tools to the USCG such as survival likelihood, search area planning and transect plotting, and the identification of the most likely location of the target, given the ocean and climate conditions. Users will be able to customize their data requests and use IOOS-based modeling tools to determine, for example, search radii based on currents, winds, wave information, and potential conditions that may compromise an effective search (e.g., fog). IOOS will allow formerly disparate sources of critical information to be collated and manipulated, augmenting the base of data currently utilized by the USCG and potentially improving SAR effectiveness. Research conducted by Arthur Allen2 at the USCG Office of Search and Rescue estimated the cost savings to the USCG of implementing HF radar capabilities into SAR operations. Allen assumes that approximately 1000 people annually either die or are unaccounted for after USCG case notification. He also places the value of a life at about $3 million, based on the Value of Statistical Life (VSL) estimates developed by the Department of Transportation. In conditions where the environmental conditions are highly uncertain (e.g., where currents and other oceanographic conditions are not known), the USCG experiences a 22% success rate. Using HF radar, the USCG has the potential to increase this success rate to 48-67%, thereby saving 26-45 additional people every year. In VSL terms, this translates to between a $78 and $135 million savings for the United States.
WWhhaatt CCaann UUSSCCGG aanndd OOtthheerr SSttaakkeehhoollddeerrss DDoo?? The value added from the integrating and sustaining power of IOOS will only be realized with regional association participation and data sharing. Participation: Stakeholders should get involved with an IOOS Regional Association (RA) (www.ocean.us/regional_associations). RAs are critical for engaging private and public user groups to identify regional data and information needs. Additionally, RAs can be high-value entry points for a user to get involved with specific IOOS pilot projects (many of which are happening right now) through which users help improve and refine IOOS. Pilot projects and RAs can facilitate data sharing, the cornerstone of IOOS, between previously unconnected parties. Even by sharing small amounts of data, users can reap significant benefits through invaluable forecasting results.
Data Sharing: Stakeholders should share data (e.g., weather information from vessel-based instruments or observations from offshore platforms) with federal, state, and local agencies. For instance, the data that enable search and rescue originate from a variety of state, local, and federal sources.
2 Allen, A. SAROPS: Environmental Data Sources and their Uncertainties. Powerpoint presentation.
Rutgers Coastal Ocean Observation Lab’s Short-Range HF radar network, showing the net movement of the
water (red arrow). Source: http://www.thecoolroom.org/instruments/instrument codar.htm

5/10/2007
IIOOOOSS aanndd UUnniitteedd SSttaatteess CCooaasstt GGuuaarrdd OOiill SSppiillll RReessppoonnssee
WWhhaatt ddooeess IIOOOOSS ddoo??
IOOS (Integrated Ocean Observing System) is a multidisciplinary system designed to provide ocean and coastal data in the formats, rates, and scales required for decision-making, based initially on the integration of existing private, federal, state, and local systems. For example, IOOS information on surface currents can help marine transportation in the oil and gas sector, and can be used to track the movement of oil spills. Consisting of three major subsystems (see figure at right), IOOS will constantly evolve according to user needs. Currently, numerous ocean and weather data collection systems are maintained by scores of federal, state, and non-governmental agencies and organizations. IOOS is gathering these useful but disparate and isolated data sources into integrated systems, giving users ready access to all ocean-related data gathered by all possible sources. In addition, IOOS will allow any compilation of data specified by the user to be manipulated using myriad existing forecasting models, thereby turning raw numbers into actionable information relevant to the user’s specific concerns. Finally, IOOS is seeking new research and enhancements to add to its already-extensive catalog of products. In this way, IOOS becomes a flexible, adaptable system capable of keeping up with new developments while maintaining the reliable delivery of data, analyses, and forecasting results. IOOS will focus initially on a series of high priorities.
HHooww ccaann IIOOOOSS HHeellpp IImmpprroovvee OOiill SSppiillll RReessppoonnssee?? In the aftermath of Hurricane Katrina in 2005, state and federal agencies alike were criticized across the board for their lack of preparedness and their unsatisfactory response to the disaster. However, the USCG was consistently praised by the media and Congress, and President George W. Bush awarded the entire service the Presidential Unit Citation for “gallantry, determination, and esprit de corps in accomplishing its mission under extremely difficult and hazardous conditions.”1 Among the actions of the USCG that earned such accolades were strategically positioning essential people and resources several days before landfall, activating hundreds of reservists and deploying about 5,300 personnel, rescuing over 30,000 stranded people, and assisting with the response to nine reported oil spills.2 Although a large part of any USCG disaster-response effort goes to search and rescue (SAR) activities, as demonstrated post-Katrina, the USCG must also find, repair, and/or replace aids to navigation (e.g., buoys, channel markers), locate and salvage damaged vessels, work with other agencies to re-establish safe and secure waterborne commerce, and help with the response to disaster-related pollution (e.g., oil spills). This last responsibility is one for which IOOS can be a beneficial enhancement for the USCG. Off the coast of Texas, an array of nine current-measuring buoys makes up the Texas Automated Buoy System (TABS). The primary mission of TABS is to facilitate oil spill response and trajectory forecasting by providing real-time, near-surface offshore current observations and forecasts. Originally deployed in 1995, TABS buoys report half-hourly observations every 3 hours under normal conditions and hourly during spill events. The buoys are also networked with hydrodynamic models, including the Princeton Ocean Model and the Regional Ocean Modeling System, which enable analysts to forecast the trajectory of the spill plume. This in turn enables the more accurate deployment of response
1 USCG. 2006. Award of the Presidential Unit Citation to the Coast Guard. All Coast Guard (ALCOAST) Message 317/06. http://www.cgaux.info/g_pcx/publications/alcoast/alcoast-317-06.html 2 USCG. 2007. Fact Card: Coast Guard Response to Hurricane Katrina. http://www.uscg.mil/hq/g-cp/comrel/factfile/Factcards/Hurricane_Katrina.htm
1. OBSERVING SUBSYSTEM
Gathers in situ and remote measurements
and data telemetry
3. DATA ANALYSIS & MODELING
SUBSYSTEM Develops and applies models for forecasting
ocean conditions.
2. DATA MANAGEMENT & COMMUNICATIONS
SUBSYSTEM Processes and standardizes data received from observing
subsystem
END USERS

5/10/2007
teams, thereby saving time and money. A public website provides easy access to real-time data as well as immediate data analysis (see example map below). Since 1995, the TABS network has provided critical data and analysis for more than 24 spill events, including the 1996 Buffalo Marine Barge spill near Galveston Bay. Due to prevailing wind and current patterns, the 3,000 barrels of spilled oil began moving originally to the southeast, then suddenly shifted to the northeast, putting Sabine Pass, Texas, in the bull’s-eye. While contingency plans were being enacted in Sabine Pass, the TABS network detected another current shift within 2 hours of its occurrence, which moved the slick southwest. Modelers determined that this current pattern would hold for several days, allowing planners to focus their efforts back to the Galveston area. Without TABS data, 24 hours would have passed before the southwesterly current shift was detected, potentially leaving Galveston vulnerable and Sabine Pass unnecessarily protected from the spill impact. Estimates have put the potential cost of unnecessary deployment to an area not at risk at $225,000.3
TABS is not a stand-alone system; it represents breakthroughs enabled by a collection of integration efforts. Currently, TABS, NOAA’s National Data Buoy Center (NDBC), oil platform operators, and sensor manufacturers cooperate to produce data and forecasts for emergency situations. Synergy occurred over time as Acoustic Doppler Current Profiler (ADCP) vendors, such as Teledyne RD Instruments, worked with oil industry representatives and government agencies to agree upon data reporting and exchange protocols that now achieve interoperability of recordings from a wide array of sites owned by different organizations. The General NOAA Oil Modeling Environment (GNOME) oil spill trajectory model used by NOAA’s Office of Response and Restoration (OR&R) Emergency Response Division (ERD) makes some of these same observations available to responders, benefiting their work.
WWhhaatt CCaann UUSSCCGG aanndd OOtthheerr MMaarriittiimmee OOppeerraattiioonnss SSttaakkeehhoollddeerrss DDoo?? The value added from the integrating and sustaining power of IOOS will only be realized with regional association participation and data sharing.
Participation: Maritime operators should get involved with an IOOS Regional Association (RA) (www.ocean.us/regional_associations). RAs are critical for engaging private and public user groups to identify regional data and information needs. Additionally, RAs can be high-value entry points for a user to get involved with specific IOOS pilot projects (many of which are happening right now) through which users help improve and refine IOOS. Pilot projects and RAs can facilitate data sharing, the cornerstone of IOOS, between previously unconnected parties. Even by sharing small amounts of data, users can reap significant benefits.
Data Sharing: Maritime operators should share data (e.g., weather information from vessel-based instruments or observations from offshore platforms) with federal, state, and local agencies. For instance, many oil platform operators already participate in sharing ADCP data in coordination with the NDBC and the TABS. These types of common data reporting and exchange protocols are key to helping IOOS achieve interoperability of data with broad utility without sacrificing protection of proprietary information.
3 Guinasso, N., Yip, J., Reid, R., Bender, L., Howard, M., Lee, L., Walpert, J., Brooks, D., Hetland, R., and R. Martin, 2001. Observing and Forecasting Coastal Currents: Texas Automated Buoy System (TABS). MTS/IEEE Oceans 2001 Conference Proceedings.
TABS Data from May 3, 2007 at 4:02pm, indicating wind speed and direction and current data.
Source: http://tabs.gerg.tamu.edu/Tglo/

5/10/2007
IIOOOOSS aanndd UUnniitteedd SSttaatteess CCooaasstt GGuuaarrdd VVeesssseell MMaannaaggeemmeenntt OOppeerraattiioonnss
WWhhaatt ddooeess IIOOOOSS ddoo??
IOOS (Integrated Ocean Observing System) is a multidisciplinary system designed to provide ocean and coastal data in the formats, rates, and scales required for decision-making, based initially on the integration of existing private, federal, state, and local systems. Consisting of three major subsystems (see figure at right), IOOS will constantly evolve according to user needs. Currently, numerous ocean and weather data collection systems are maintained by scores of federal, state, and non-governmental agencies and organizations. IOOS is gathering these useful but disparate and isolated data sources into integrated systems, giving users ready access to all ocean-related data gathered by all possible sources. In addition, IOOS will allow any compilation of data specified by the user to be manipulated using myriad existing forecasting models, thereby turning raw numbers into actionable information relevant to the user’s specific concerns. Finally, IOOS is seeking new research and enhancements to add to its already-extensive catalog of products. In this way, IOOS becomes a flexible, adaptable system capable of keeping up with new developments while maintaining the reliable delivery of data, analyses, and forecasting results.
HHooww CCaann IIOOOOSS HHeellpp IImmpprroovvee VVeesssseell MMaannaaggeemmeenntt??
The ports and harbors of the United States can have strong currents that can vary by depth. The navigational activities of many large, deep-draft vessels that frequent U.S. waterways can be compromised by these currents, particularly those close to the keel (which, for some vessels, may not be far from the ocean floor). Additionally, shipping companies and other vessel owners have an economic incentive to maximize the possible size and draft of their vessels. According to NOAA1, one more foot of draft can mean between $36,000 and $288,000 more in revenue per ship, and these figures increase every year. The larger the vessel, the more critical it is to understand the physical conditions of the port or harbor and to have access to real-time data and modeling capabilities. One of the most valuable data sources for marine transportation safety is NOAA’s National Ocean Service’s Physical Oceanographic Real-Time System (PORTS®). By measuring and disseminating observations and predictions of water levels, currents, salinity, and meteorological parameters (e.g., winds, atmospheric pressure, air and water temperatures), PORTS® is able to promote safe and efficient navigation of U.S. waters. Accessible to users in a variety of user-friendly formats, PORTS® provides the types of data that can prevent maritime accidents such as collisions and groundings, as well as the potential results of these accidents, such as oil spills. PORTS® is currently operating in 13 U.S. locations. Establishing such a system in all harbors and ports of the nation would not only benefit the port-related USCG missions, but is critical to the goals of IOOS. IOOS will combine data available from PORTS® with Electronic Navigational Charts, shoreline mapping data, water level and current information, satellite-based positioning services like GPS, and other operating and planned initiatives (e.g., NYHOPS) to provide the critical information needed by the USCG and other responsible entities to maintain waterway navigation and prevent ecologically and economically devastating accidents. Currently, NOAA is working to integrate the PORTS network with the USCG’s Automatic Identification System (AIS), which is capable of sending detailed vessel-related information from vessels equipped with a special programmable VHF transmitter to shore-based vessel traffic centers. The AIS broadcasts such information as speed, position, heading, and rate of turn every 2 to 10 seconds while underway; every 6 minutes, information such as cargo type, draft, vessel name, and vessel dimensions is broadcast.
1 NOAA. 1999. Commercial Shipping: Using NOAA Tools for Safe Navigation. http://nauticalcharts.noaa.gov/psn/commercl.htm
1. OBSERVING SUBSYSTEM
Gathers in situ and remote measurements
and data telemetry
3. DATA ANALYSIS & MODELING
SUBSYSTEM Develops and applies models for forecasting
ocean conditions.
2. DATA MANAGEMENT & COMMUNICATIONS
SUBSYSTEM Processes and standardizes
data received from observing subsystem
END USERS

5/10/2007
The Stevens Institute of Technology’s Center for Maritime Systems (CMS) designed, installed, and now operates an observing and forecasting system for the Ports of New Jersey and New York with potential applications nationwide and definitive benefits for IOOS. The New York Harbor Observing and Prediction System (NYHOPS) collects and provides ocean and weather condition data similar to PORTS® capabilities, but extends the coverage beyond the immediate port to cover other heavily-trafficked areas used by cruise ships, fishing vessels, and ferries. Additionally, NYHOPS utilizes port-specific characteristics to determine how, for example, the sheltering effect of Manhattan Island may affect wind conditions in the Hudson River or the influence of piers and seawalls on waves
and currents. By tailoring NYHOPS to the region, the CMS team created a customizable observing system that is effective and provides usable, reliable information to the stakeholders in the area, including the USCG (see example maps above). The NYHOPS network includes a collection of shore-based, moored, and vessel-mounted sensors and a CODAR HF radar system. Observations from NYHOPS provide large spatial coverage on a 10-minute time scale and are enhanced by a three-dimensional circulation/wave modeling system derived from the Princeton Ocean Model. In addition, NYHOPS provides ocean condition forecasts for up to 48 hours ahead and employs a high-volume information distribution system and web-based access. IOOS has the ability to provide the types of data and forecasting results available from NYHOPS and combine them with information available from other systems (e.g., PORTS®, CODAR) to present clear, accurate, and highly applicable information to the entities that need it. The USCG, with its port safety and incident response responsibilities, can benefit in numerous ways from the information provided by IOOS and its components. Efficiency can increase, accidents can be prevented, potential accident precursors can be remedied, and response time and effectiveness in responding to accidents (e.g., oil spills) can be enhanced. But the USCG will not only have access to an existing customizable suite of data and modeling products: IOOS is a constantly evolving network that places its users at the forefront of access to new technologies and breakthrough modeling methodologies. By concentrating the research power behind institutes, universities, agencies, and private entities into one accessible system, IOOS will reflect and integrate new developments in the field of ocean observing.
WWhhaatt CCaann UUSSCCGG aanndd OOtthheerr VVeesssseell MMaannaaggeemmeenntt SSttaakkeehhoollddeerrss DDoo?? The value added from the integrating and sustaining power of IOOS will only be realized with regional association participation and data sharing. Participation: Stakeholders should get involved with an IOOS Regional Association (RA) (www.ocean.us/regional_associations). RAs are critical for engaging private and public user groups to identify regional data and information needs. Additionally, RAs can be high-value entry points for a user to get involved with specific IOOS pilot projects (many of which are happening right now) through which users help improve and refine IOOS. Pilot projects and RAs can facilitate data sharing, the cornerstone of IOOS, between previously unconnected parties. Even by sharing small amounts of data, users can reap significant benefits through invaluable forecasting results. Data Sharing: Stakeholders should share data (e.g., weather information from vessel-based instruments or observations from offshore platforms) with federal, state, and local agencies.
NYHOPS Observations of Surface Currents (left) and Bottom Currents (right) in the NY/NJ Harbor Estuary on April 21, 2007 at 11:00am.
Source: http://hudson.dl.stevens-tech.edu/NYHOPS

4/3/2007
IIOOOOSS aanndd MMaarriittiimmee OOppeerraattiioonnss iinn tthhee GGuullff ooff MMeexxiiccoo
WWhhaatt ddooeess IIOOOOSS ddoo?? IOOS (Integrated Ocean Observing System) is a multidisciplinary system designed to provide ocean and coastal data in the formats, rates, and scales required for decision-making, based initially on the integration of existing private, federal, state, and local systems. For example, IOOS information on surface currents can help marine transportation in the oil and gas sector, and can be used to track the movement of oil spills. Consisting of three major subsystems (see figure at right), IOOS will constantly evolve according to user needs. Currently, numerous ocean and weather data collection systems are maintained by scores of federal, state, and non-governmental agencies and organizations (see Table 1 for a few examples). IOOS is gathering these useful but disparate and isolated data sources into integrated systems, giving users ready access to all ocean-related data gathered by all possible sources. In addition, IOOS will allow any compilation of data specified by the user to be manipulated using myriad existing forecasting models, thereby turning raw numbers into actionable information relevant to the user’s specific concerns. Finally, IOOS is seeking new research and enhancements to add to its already-extensive catalog of products. In this way, IOOS becomes a flexible, adaptable system capable of keeping up with new developments while maintaining the reliable delivery of data, analyses, and forecasting results. IOOS will focus initially on a series of high priorities.
Table 1. Examples of already-existing data collection systems useful for Maritime Operations in the Gulf of Mexico
Existing Data Source Measurements Collected by Data Source Representative Outcomes National Data Buoy Center (NDBC)
Wave height and period, temperature, pressure, winds, currents
Provides marine observations for weather forecasting
Physical Oceanographic Real-Time System (PORTS)
Real-time water level, currents, temperature, winds, pressure, salinity More efficient and safe vessel passage
Texas Automated Buoy System (TABS) Currents, wind speed, wind direction Weather forecasting and data for ship routing
TOPEX/Poseidon Ocean surface topography, circulation, wave height, wind speeds, water mass transport, altimetry
Better understanding of global climate change, especially major events (e.g., El Niño)
HHooww ccaann IIOOOOSS HHeellpp EEnnssuurree SSaaffee aanndd EEffffiicciieenntt MMaarriittiimmee OOppeerraattiioonnss
iinn tthhee GGuullff ooff MMeexxiiccoo?? Safe and efficient maritime operations are fundamental to the Gulf of Mexico States Accord (GoMSA) goals for growth in trade, tourism, and associated transportation corridors. The Gulf of Mexico region, with a population of over 60 million, drives approximately $6 trillion in trade and $2 trillion in gross state product1. Maritime operations in the Gulf of Mexico include such wide-ranging activities as energy exploration, production, and transportation; recreation and tourism; fisheries, aquaculture, and agriculture; and the transportation of goods. By making available an integrated network of real-time data and by applying these data to models and other forecasting tools, IOOS can help the planners and operators of Gulf maritime activities exploit all available ocean-related information to reliably monitor present and predict future conditions. IOOS can be instrumental for ship routing, severe weather planning, oil spill and other contingency preparation and response, transportation pathway optimization, tourism planning, and fisheries industry efficiency. For example, as evident in the Hurricane Katrina aftermath, severe weather
1 Gulf of Mexico States Partnership, Rebuilding the Gulf of Mexico Border Region: The Gulf of Mexico Trade Corridor Transportation Study, 2006, http://www.stpt.usf.edu/brownbag/port_files/GOMSP_report.doc.
1. OBSERVING SUBSYSTEM
Gathers in situ and remote measurements
and data telemetry
3. DATA ANALYSIS & MODELING
SUBSYSTEM Develops and applies models for forecasting
ocean conditions.
2. DATA MANAGEMENT & COMMUNICATIONS
SUBSYSTEM Processes and standardizes data received from observing
subsystem
END USERS

4/3/2007
poses monumental danger to valuable coastal and offshore infrastructure. IOOS can enable regional-scale assessments of oceanographic conditions as well as nearshore and offshore bathymetry and onshore topography to assist with long-range risk management and infrastructure planning. Additionally, IOOS’s ability to strengthen the reliability of weather nowcasts and forecasts can provide more advanced warning of severe weather, allowing, if necessary, timely evacuations and vessel reroutings or, if no danger is posed, preventing costs associated with unnecessary shut-downs. In this way, IOOS data and modeling resources can not only save human life and increase the efficiency of infrastructure planning, but can also increase productivity by reducing unnecessary spending. IOOS developers are committed to making IOOS a user-driven system, by listening to the needs of key stakeholders, incorporating those needs into future products, and using these recommendations to guide future funding and development of IOOS. In November 2005, a Gulf of Mexico-centric workshop asked participants to prioritize the various data products that would be of most use to the oil and gas sector. Table 2 lists only a handful of the products identified at the workshop that can improve operations, reduce risk, and maintain competitiveness for both oil and gas and other maritime-based activities, including ship routing and tourism planning. Many of the measurements needed to develop the products (as shown in the center column) are already available through any number of data collection systems, (Table 1). However, IOOS’s initial responsibility will be to centralize the data and integrate them into a useful forecasting product.
Table 2. Sample maritime operations product needs
Product Need Measurements Needed to Develop Product Needed Scale/Range of Product Hurricane severity forecasts
Upper-level circulation, boundary layer, ocean mixed-layer temperature, offshore Doppler radar
Accuracy of 20% central pressure index at 5 days out
Surface current forecasts
Wind, high frequency radar, density profiles, sea surface temperatures, river inflow, air-sea flux, bathymetry, front locations, tomography
0-15 day nowcasting/forecasting 10 km. horizontal for deepwater 1 km. horizontal for shelf waters
Deepwater current forecasts
Density profiles, sea surface height and temperature, air-sea flux, acoustic Doppler current profiler, Caribbean current inflow (for Gulf of Mexico)
0-30 day nowcasting/forecasting 10 km. horizontal accuracy 50 m vertical accuracy
The safety and efficiency of maritime operations in the Gulf of Mexico depend on reliable environmental data to improve productivity and optimize operational efficiency, prevent damage to equipment and personnel, and limit negative environmental impacts. IOOS supports these needs by helping the maritime operations community in
• Determining the best possible route for tankers and other vessels in regards to weather conditions, the oceanographic environment, and existing vessel traffic
• Planning onshore and offshore infrastructure according to the risks posed by severe weather, historic hurricane trajectories, and current and eddy forecasting
• Improving storm track and hurricane landfall forecasts, which could prevent unnecessary evacuations, prevent shut-down time, and save millions of dollars
• Enhancing short-term fog and precipitation forecasts to prevent accidents and help with scheduling. • Improving the accuracy of high-resolution coastal topography (being made available by recent surveys and
NOAA’s archive center), which will enhance preparedness and inundation modeling to protect coastal infrastructure.
WWhhaatt CCaann GGooMMSSAA aanndd OOtthheerr MMaarriittiimmee OOppeerraattiioonnss SSttaakkeehhoollddeerrss DDoo?? The value added from the integrating and sustaining power of IOOS will only be realized with regional association participation and data sharing.
Participation: Maritime operators should get involved with an IOOS Regional Association (RA) (www.ocean.us/regional_associations). RAs are critical for engaging private and public user groups to identify regional data and information needs. Additionally, RAs can be high-value entry points for a user to get involved with specific IOOS pilot projects (many of which are happening right now) through which users help improve and refine IOOS. Pilot projects and RAs can facilitate data sharing, the cornerstone of IOOS, between previously unconnected parties. Even by sharing small amounts of data, users can reap significant benefits.
Data Sharing: Maritime operators should share data (e.g., weather information from vessel-based instruments or observations from offshore platforms) with federal, state, and local agencies. For instance, many oil platform operators already participate in sharing Acoustic Doppler Current Profiler data in coordination with the NDBC and the TABS. These types of common data reporting and exchange protocols are key to helping IOOS achieve interoperability of data with broad utility without sacrificing protection of proprietary information.

4/3/2007
IIOOOOSS aanndd EElleeccttrriicciittyy GGeenneerraattiioonn,, TTrraannssmmiissssiioonn,, aanndd DDiissttrriibbuuttiioonn
WWhhaatt ddooeess IIOOOOSS ddoo??
IOOS (Integrated Ocean Observing System) is a multidisciplinary system designed to provide weather, climate, ocean, and coastal data in the formats, rates, and scales required for decision-making, based initially on the integration of existing private, federal, state, and local systems. Consisting of three major subsystems (see figure at right), IOOS will constantly evolve according to user needs. IOOS will focus initially on a series of high priorities. For example, IOOS information on sea surface winds can help utilities and value-added weather companies predict sea breezes that have a sudden impact on electric load. Currently, numerous ocean and weather data collection systems useful to electric utilities are maintained by scores of federal, state, and non-governmental agencies and organizations (see Table 1 for a few examples). IOOS is gathering these useful but disparate and isolated data sources into integrated systems, giving users ready access to all ocean-related data gathered by all possible sources. In addition, IOOS will allow any compilation of data specified by the user to be manipulated using myriad existing forecasting models, thereby turning raw numbers into actionable information relevant to the user’s specific concerns. Finally, IOOS is seeking new research and enhancements to add to its already-extensive catalog of products. In this way, IOOS becomes a flexible, adaptable system capable of keeping up with new developments while maintaining the reliable delivery of data, analyses, and forecasting results.
Table 1. Examples of already-existing data collection systems relevant to electricity generation and transmission Existing Data Source Measurements Collected by Data Source Representative Outcomes
Coastal Ocean Observation Laboratory (COOL) Room (http://marine.rutgers.edu/coolroom/)
Sea surface temperature, surface currents, coastal wave measurements
Forecasts of coastal weather fronts at high-resolution scales used by local energy utility to adjust operations and deploy service fleets.
Central and Northern California Coastal Ocean Observing System (CeNCOOS) Monterey Bay Surface Wind Demonstration Product (http://www.cencoos.org/data_winds.htm)
Near real-time surface winds from a mesoscale atmosphere model together with winds measured at four ocean buoys and seven coastal stations from various institutions that are collaborating with CeNCOOS
Enhance sea-breeze forecasts for coastal areas
HHooww ccaann IIOOOOSS HHeellpp tthhee EElleeccttrriicc PPoowweerr SSeeccttoorr?? Through enhanced weather and climate forecasting and modeling, the electric power sector can increase productivity by more accurately estimating load. IOOS can be instrumental for electricity generation, transmission, and distribution not only by making readily available a network of relevant real-time data for coastal areas, but by applying these data to models and other forecasting tools to reliably predict future conditions. By utilizing more accurate, reliable, and timely forecasting information, the electric power sector can optimize operations and streamline expenditures. Some of the potential benefits to electric utilities of improving the day-ahead weather forecast by just 1 degree Fahrenheit have been estimated as about $20
1. OBSERVING SUBSYSTEM
Gathers in situ and remote measurements
and data telemetry
3. DATA ANALYSIS & MODELING
SUBSYSTEM Develops and applies models for forecasting
ocean conditions.
2. DATA MANAGEMENT & COMMUNICATIONS
SUBSYSTEM Processes and standardizes data received from observing
subsystem
END USERS

4/3/2007
million to $25 million per year for a Northeast regional transmission authority, and about $1 million to $2 million per year for a large regional distribution company.1 Due to declining reliability and the ever-increasing concern about emissions and climate change impacts, the electricity generation, transmission, and distribution sector has perhaps the most significant need for accurate weather and climate data in the entire energy industry. Under deregulation, the responsibility for ensuring reliability is dispersed to multiple institutions, with utilities, independent system operators, independent power producers, customers, and markets all playing a role. One unfortunate result is a reduction in reliability. With IOOS, accurate and consistent data and modeling products for coastal areas can be supplied to all entities in a controlled manner, and the reliability of the electric power market can be enhanced.
Changes in weather and climate directly affect the demand for electricity and, therefore, weather-related interruptions are felt immediately in all residential and commercial communities. In this way, and many others listed below, IOOS can directly and indirectly benefit the electric power sector of the energy industry.
• Improved demand forecasts in coastal areas can allow companies to determine in advance the best and
most cost-efficient mixture of electricity generation, prevent starting up and shutting down operations, and can allow demand projections to be tailored to a specific region of the country.
• The design and siting of transmission and distribution
systems can benefit from an understanding of the likelihood and nature of severe weather events, thereby minimizing risk and potentially saving downtime and repair costs.
• Accurate ice predictions can help predict areas that
may need more attention during cold weather and accurate forecasts of potential power surges and outages can reduce customer downtime.
• Weather-sensitive energy firms can reduce risk to
revenue by hedging with weather risk management tools.
• To avoid exceeding emissions targets and to prevent the over-purchasing of power, buyers can use
temperature, humidity, precipitation, and storm forecasts to estimate necessary volumes. • On the business side of the electricity sector, weather data and model analyses can be used to adjust
energy sales and peaks to normal conditions, freeing financial projections from the effects of weather-related sales variations and providing a realistic view of business growth.
WWhhaatt CCaann tthhee EElleeccttrriicc PPoowweerr SSeeccttoorr DDoo??
The value added from the integrating and sustaining power of IOOS can be realized with regional association participation. Electric power stakeholders should get involved with a Regional Association (RA) (www.ocean.us/regional_associations). RAs are critical for engaging private and public user groups to identify regional data and information needs. Additionally, RAs can be high-value entry points for a user to get involved with specific IOOS pilot projects (many of which are happening right now) through which users help improve and refine IOOS. Pilot projects and RAs can facilitate data sharing, the cornerstone of IOOS, between previously unconnected parties. Even by sharing small amounts of data, users can reap significant benefits through invaluable forecasting results.
1 Altalo, M.G., T.D. Davis, and M. Hale, Northeast Energy Network Performance Analysis In Support of An Improved Energy Transmission Regime, Science Applications International Corporation, August 2003.
Errors in the forecasted temperature account for 40-90% of electricity demand estimation
errors.
By using an integrated system like IOOS to acquire and analyze temperature information, data from multiple, previously unconnected, sources can be collected and assessed using multiple different modeling techniques. Load forecasting errors can therefore be decreased by maximizing the data pool and capitalizing on the inherent strengths of multiple modeling products.

4/3/2007
IIOOOOSS aanndd RReenneewwaabbllee EEnneerrggyy
WWhhaatt ddooeess IIOOOOSS ddoo??
IOOS (Integrated Ocean Observing System) is a multidisciplinary system designed to provide weather, climate, ocean, and coastal data in the formats, rates, and scales required for decision-making, based initially on the integration of existing private, federal, state, and local systems. Consisting of three major subsystems (see figure at right), IOOS will constantly evolve according to user needs. Currently, numerous ocean and weather data collection systems are maintained by scores of different federal, state, and non-governmental agencies and organizations (see Table 1 for a few examples). IOOS is gathering these useful but disparate and isolated data sources into integrated systems, permitting users to readily access all ocean-related data gathered by all possible sources. In addition, IOOS will allow any compilation of data specified by the user to be manipulated using myriad existing forecasting models, thereby turning raw numbers into actionable information relevant to the user’s specific concerns. Finally, IOOS is seeking new research and enhancements to add to its already-extensive catalog of products. In this way, IOOS becomes a flexible, adaptable system capable of keeping up with new developments while maintaining the reliable delivery of data, analyses, and forecasting results. IOOS will focus initially on seven priority variables. For example, IOOS information on sea surface winds can help with the siting and design of offshore and coastal wind farms.
Table 1. Examples of already-existing data collection systems for Renewable Energy
Existing Data Source Measurements Collected by Data Source Representative Outcomes
Coastal Ocean Observation Laboratory (COOL) Room (http://marine.rutgers.edu/coolroom/)
Sea surface temperature, surface currents, coastal wave measurements
Forecasts of coastal weather fronts at high-resolution scales, applicable for renewable energy applications.
Central and Northern California Coastal Ocean Observing System (CeNCOOS) Monterey Bay Surface Wind Demonstration Product (http://www.cencoos.org/data_winds.htm)
Near real-time surface winds from a mesoscale atmosphere model together with winds measured at four ocean buoys and seven coastal stations from various institutions that are collaborating with CeNCOOS
Better characterization of wind and ocean resources.
HHooww ccaann IIOOOOSS HHeellpp tthhee RReenneewwaabbllee EEnneerrggyy SSeeccttoorr?? Given its ocean and coastal focus, IOOS has the greatest potential to help the wind and ocean energy sectors of renewable energy. IOOS can help the wind energy sector by improving wind resource assessments and forecasts for offshore and coastal areas, and improving the spatial and temporal coverage of the ocean information required for offshore wind system design, construction, and operation. Wind energy, and more broadly renewable energy, is receiving increased attention as 23 states and the District
1. OBSERVING SUBSYSTEM
Gathers in situ and remote measurements and data
telemetry
3. DATA ANALYSIS & MODELING
SUBSYSTEM Develops and applies models
for forecasting ocean conditions.
2. DATA MANAGEMENT & COMMUNICATIONS
SUBSYSTEM Processes and standardizes data
received from observing subsystem
END USERS

4/3/2007
of Columbia have adopted renewable portfolio standards or mandates aimed at increasing the share of renewable power in their energy mix. National Renewable Energy Laboratory (NREL) resource maps indicate very large areas of strong and reliable winds in shallow and deep offshore waters. In addition, many urban load centers are in coastal areas, increasing the incentive to develop energy resources offshore and in coastal regions. A coastal resource assessment recently carried out by NREL found that with sufficient technology improvements and volume production, costs could reach $0.051/kWh for deployment of deepwater offshore wind turbines by 2015 and $0.041/kWh by 2012 for shallow water areas1. A study conducted for New York State concluded that state-of-the-art wind generation forecasts can improve the value of wind energy by around 25 percent2. By bringing together disparate information sources on sea surface winds (e.g., high frequency radar, Voluntary Observing Ships measurements, and Quicksat satellite data), IOOS will provide the wind energy sector with comprehensive information for resource assessment and forecasting. In addition, IOOS information on priority variables such as currents and waves will be utilized in the design and construction planning of offshore wind turbines.
Another renewable energy technology with potential to benefit from IOOS is ocean energy. Although still in the early stages, this represents one of the most directly relevant energy options with the most to gain from IOOS as the evolution of both IOOS and ocean energy coincide. Whether the focus is on wave energy, tidal energy, or ocean thermal energy conversion, IOOS can help the ocean energy sector by providing improved ocean information needed for resource assessment and technology development. Specifically, improved information on wave height, currents, sea level, and ocean circulation, all of which are included in the IOOS seven priority variables, will be key to further development of ocean energy.
WWhhaatt CCaann tthhee RReenneewwaabbllee EEnneerrggyy SSeeccttoorr DDoo??
The value added from the integrating and sustaining power of IOOS will only be realized with Regional Association (RA) participation (www.ocean.us/regional_associations). RAs are critical for engaging private and public user groups to identify regional data and information needs. Additionally, RAs can be critical entry points for a user to get involved with specific IOOS pilot projects (many of which are happening right now) through which users help improve and refine IOOS. Pilot projects and RAs can facilitate data sharing, the cornerstone of IOOS, between previously unconnected parties. Even by sharing small amounts of data, the benefits are reaped tenfold through invaluable forecasting results.
1 Musial, W. and S. Butterfield, Future for Offshore Wind Energy in the United States. NREL Report No. NREL/CP-500-36313, 2004, http://www.nrel.gov/docs/fy04osti/36313.pdf. 2 The Effects of Integrating Wind Power on Transmission System Planning Reliability and Operations Report Phase 2, March 2005, http://www.nyserda.org/publications/wind_integration_report.pdf.
Wave Power and IOOS
An Electric Power Research Institute (EPRI) report on Wave Energy Conversion in the U.S. concluded that there is a potential for wider application of wave energy. The report analyzed the wave potential at various coastal sites in the United States, examined the economics and viability of various ocean technologies, and provided an overview of potentially applicable permitting regimes. Representing a general reversal in industry attitude, the EPRI report concluded that generation of electricity from wave energy may be economically feasible in the near future. The improved information on wave height, currents, and circulation, as a result of IOOS, will be key to the further development of wave energy. Source: Previsic, M. 2004. E2I EPRI Guidelines for Preliminary Estimation of Power Production by Offshore Wave Energy Conversion Devices. http://www.oceanpd.com/PDFS/E21%20EPRI%20Assessment.pdf

5/10/2007
IIOOOOSS aanndd UU..SS.. WWeesstt CCooaasstt WWaatteerr QQuuaalliittyy
WWhhaatt ddooeess IIOOOOSS ddoo??
IOOS (Integrated Ocean Observing System) is a multidisciplinary system designed to provide weather, climate, ocean, and coastal data in the formats, rates, and scales required for decision-making, based initially on the integration of existing private, federal, state, and local systems. Consisting of three major subsystems (see figure at right), IOOS will constantly evolve according to user needs. IOOS will focus initially on a series of high priorities. For example, IOOS information on surface currents is valuable to spill response, healthy beach assessment, search and rescue, and infrastructure risk management. Currently, numerous ocean observation data acquisition systems useful to the West Coast Governors’ Agreement on Ocean Health (WCGA) are maintained by scores of federal, state, and non-governmental agencies and organizations (see Table 1 for a few examples). IOOS is enabling integration of these useful but disparate or isolated data sources into regional systems, giving users ready access to all ocean-related data gathered by all possible sources. In addition, IOOS will allow any compilation of data specified by the user to be manipulated using myriad existing forecasting models, thereby turning raw numbers into actionable information relevant to the user’s specific concerns. Finally, IOOS is seeking new research and enhancements to add to its already-extensive catalog of products. In this way, IOOS groups can quickly offer flexible, adaptable systems capable of keeping up with new developments while maintaining the reliable delivery of data, analyses, and forecasting results.
Table 1. Examples of already-existing data collection systems relevant to WCGA Existing Data Source Data Source Description Representative Outcomes
Monterey Accelerated Research System (MARS) (http://www.mbari.org/mars)
32 miles of fiber-optic cable laid along the sea floor of Monterey Bay (CA). Provides researchers 24-hour access to instruments and experiments in the deep sea.
Extended research studies and ability to retrieve real-time data, development of new deep-sea monitoring tools and technologies. Education and outreach tool via the internet.
Land/Ocean Biogeochemical Observatory in Elkhorn Slough (LOBO)
Project in Elkhorn Slough, located on Monterey Bay, CA to serve as a pilot for how a real-time in situ nutrient sensor network can be developed and collect data.
Study of chemical fluxes into, within, and out of the slough. Potential to be used in other estuarine environments.
HHooww CCaann IIOOOOSS HHeellpp wwiitthh WWaatteerr QQuuaalliittyy??
The priority issues of WCGA most closely tied to water quality are “Ensuring clean coastal waters and beaches” and “Protecting and restoring healthy ocean and coastal habitats.” IOOS can achieve these WCGA priority issues related to water quality by providing an accumulation of valued products and services, developed through a network of Regional Associations (RAs).
1. OBSERVING SUBSYSTEM
Gathers in situ and remote measurements
and data telemetry
3. DATA ANALYSIS & MODELING
SUBSYSTEM Develops and applies models for forecasting
ocean conditions.
2. DATA MANAGEMENT & COMMUNICATIONS
SUBSYSTEM Processes and standardizes data received from observing
subsystem
END USERS

5/10/2007
One example of value derived from IOOS RAs is shown in the Coastal Oceans Currents Monitoring Program (COCMP). This Program is a collaboration of many institutions and agencies whose focus is the integrated monitoring of currents in the coastal ocean. The Coastal Conservancy manages the COCMP program with observations available through two IOOS RAs: the Southern California Ocean Observing System (SCCOOS) and Northern and Central California Ocean Observing System (CeNCOOS). The focus of the program is to make data available to agencies that are responsible for managing coastal water quality. A specific example of how the coordination of IOOS RAs assisted the coastal management community occurred in Santa Monica Bay in 2006:
The City of Los Angeles needed to inspect its primary water treatment discharge pipe, since this pipe had not been internally inspected during its entire 50 years of use. The City was forced to divert its sewage to an alternate, shorter discharge pipe to allow diver inspection of their primary pipe.
About 875 million gallons of treated sewage was discharged through the alternate pipe during the inspection period, which lasted from November 28-30, 2006.
A monitoring program was established as this discharge was taking place. SCCOOS was able to respond rapidly and provide environmental data support including maps of surface currents, plume trajectories of the discharge, drifter data support, ocean color satellite remote sensing data, meteorological data, and surfzone wave height and current forecasts.
SCCOOS provided continuous real time data to support this immediate and real world management issue, and reports were provided to the City of Los Angeles, the Regional Board, the county health officers, and NGO community.1
Another example of the coordination of IOOS RAs addressing WCGA priority issues relating to water quality is the California State University (CSU) Center for Integrative Coastal Observation, Research and Education (CICORE). The CICORE project is networked applied coastal research center made up of several braches distributed throughout California. The project’s mission is to provide information to the scientific community, resource managers, policy makers, and the public as a means of helping to ensure the future sustainable use of the California coast. Established in 2002 by NOAA, CICORE takes advantage of the wide distribution of CSU campuses along the California coastline to study a variety of ecosystems including estuaries, wetlands, and other critical coastal habitats. CICORE is part of both CeNCOOS and SCCOOS. CICORE applies high resolution bathymetry, in-situ monitoring, and optical remote sensing to provide solutions to coastal issues many communities are faced with. All of the above mentioned technologies can be used to identify ecological areas that need protection, to track changes in the environment due to any number of reasons, and to understand why these changes occur. CICORE is committed to making their data available for integration online at www.cicore.org.
WWhhaatt CCaann tthhee WWeesstt CCooaasstt SSttaatteess DDoo??
The value added from the integrating and sustaining power of IOOS can be realized with regional association participation. By coordinating participation between WCGA and RAs, such as in the ongoing series of WCGA public hearings, synergies will be achieved (see www.ocean.us/regional_associations). RAs are critical for engaging private and public user groups to identify regional data and information needs. Additionally, RAs can be high-value entry points for a user to get involved with specific IOOS pilot projects (many of which are happening right now) through which users help improve and refine IOOS. Pilot projects and RAs can facilitate data sharing, the cornerstone of IOOS, between previously unconnected parties. Even by sharing small amounts of data, users can reap significant benefits through invaluable forecasting results.
1 SCCOOS Coastal Ocean Currents Monitoring Program 2006 Annual Report, Accessed April 18, 2007 http://www.sccoos.org/docs/COCMP_AnnualReport_2006_dra.pdf

5/10/2007
IIOOOOSS aanndd UU..SS.. WWeesstt CCooaasstt FFiisshheerriieess
WWhhaatt ddooeess IIOOOOSS DDoo??
IOOS (Integrated Ocean Observing System) is a multidisciplinary system designed to provide weather, climate, ocean, and coastal data in the formats, rates, and scales required for decision-making, based initially on the integration of existing private, federal, state, and local systems. Consisting of three major subsystems (see figure at right), IOOS will constantly evolve according to user needs. IOOS will focus initially on a series of high priorities. For example, IOOS information on surface currents is valuable to spill response, healthy beach assessment, search and rescue, and infrastructure risk management. Currently, numerous ocean observation data acquisition systems useful to the West Coast Governors’ Agreement on Ocean Health (WCGA) are maintained by scores of federal, state, and non-governmental agencies and organizations (see Table 1 for a few examples). IOOS is enabling integration of these useful but disparate or isolated data sources into regional systems, giving users ready access to all ocean-related data gathered by all possible sources. In addition, IOOS will allow any compilation of data specified by the user to be manipulated using myriad existing forecasting models, thereby turning raw numbers into actionable information relevant to the user’s specific concerns. Finally, IOOS is seeking new research and enhancements to add to its already-extensive catalog of products. In this way, IOOS groups can quickly offer flexible, adaptable system capable of keeping up with new developments while maintaining the reliable delivery of data, analyses, and forecasting results.
Table 1. Examples of already-existing data collection systems relevant to WCGA
Existing Data Source Data Source Description Representative Outcomes
Bodega Ocean Observing Node (BOON)
A coastal ocean observing system centered at Bodega Bay, CA that is managed by Bodega Marine Lab (BML). Includes meteorological sensors, high frequency (HF) radar and an oceanographic mooring offshore of BML. BOON is linked to Central and Northern California Ocean Observing System.
Data from BOON are being used to study salmon populations between Bodega Bay and Salt Point. Researchers at BML are using surface current data measured with high-frequency radar to study how currents affect movements of young fish.
Land/Ocean Biogeochemical Observatory in Elkhorn Slough (LOBO)
Project in Elkhorn Slough, located on Monterey Bay, CA to serve as a pilot for how a real-time in situ nutrient sensor network can be developed and collect data.
Study of chemical fluxes into, within, and out of the slough. Potential to be used in other estuarine environments.
HHooww CCaann IIOOOOSS HHeellpp wwiitthh FFiisshheerriieess??
The priority issues of WCGA most closely tied to fisheries are “Ensuring clean coastal waters and beaches” and “Protecting and restoring healthy ocean and coastal habitats.” Of specific concern for commercial fisheries are the adverse impacts of Harmful Algal Blooms (HABs). Nationwide studies
1. OBSERVING SUBSYSTEM
Gathers in situ and remote measurements
and data telemetry
3. DATA ANALYSIS & MODELING
SUBSYSTEM Develops and applies models for forecasting
ocean conditions.
2. DATA MANAGEMENT & COMMUNICATIONS
SUBSYSTEM Processes and standardizes data received from observing
subsystem
END USERS

5/10/2007
conservatively estimate average annual losses of nearly $50M to 475M due to the impact of HABs on commercial fisheries, public health, recreation and tourism, and monitoring.1,2 IOOS can help achieve the WCGA priority issues related to fisheries by providing an accumulation of valued products and services, developed through a network of Regional Associations (RAs). The following are examples of IOOS support for healthy and sustained operation of fisheries:
Reconciling Coastal Topography with VDatum. IOOS groups are collaborating to address vertical datum (VDatum) referencing, which is of utmost importance in order to allow the range of hydrologic and geomorphic observations to be fully interoperable. Among other benefits, the VDatum service will enable reliable monitoring of shellfish habitats. NOAA and the USGS have numerous VDatum projects underway (including in Puget Sound and northern, central and southern CA) to help transform past coastal elevation and bathymetry surveys into a single coverage with common units.
Coastal Storms Program (CSP). Awareness of near-shore conditions and navigation hazards is
crucial to mariners and fishermen. Likewise, awareness of the sources of contaminated storm runoff and its impacts on commercial species, such a salmon, is important to fishermen. To respond to this need and other needs related to impacts of coastal storms, NOAA began the Coastal Storms Program (CSP) Pacific Northwest pilot in 2003. The CSP develops products that will provide better data and improved forecast models to address storm related issues that are important to the community. The tools included in this pilot include the Lower Columbia River Circulation Model, improved oceanographic and meteorological observations, improved prediction of coastal waves, ecological assessment of storm impacts, and an on-line coastal inundation tool. IOOS RAs provide information on real-time conditions that are critical for all of these tools.
Oregon Coastal Ocean Observing System (OrCOOS). The Oregon Coastal Ocean Observing
System (OrCOOS) was recently established to support the efforts of developing the IOOS program. OrCOOS is establishing an observing system that will contribute to the preservation of Oregon’s coastal ocean as well as enhance its safe and sustained use. OrCOOS is focused on the fishing community and port liaisons as its primary stakeholders. These stakeholders are important to the economic base of the West Coast region. Systems like these can enhance safe and efficient commercial navigation. OrCOOS is committed to collaborating with its stakeholders and partners to expand on existing ocean observing systems and determine useful ocean products for the future.
WWhhaatt CCaann tthhee WWeesstt CCooaasstt SSttaatteess DDoo??
The value added from the integrating and sustaining power of IOOS can be realized with regional association participation. By coordinating participation between WCGA and RAs, such as in the ongoing series of WCGA public hearings, synergies will be achieved (see www.ocean.us/regional_associations). RAs are critical for engaging private and public user groups to identify regional data and information needs. Additionally, RAs can be high-value entry points for a user to get involved with specific IOOS pilot projects (many of which are happening right now) through which users help improve and refine IOOS. Pilot projects and RAs can facilitate data sharing, the cornerstone of IOOS, between previously unconnected parties. Even by sharing small amounts of data, users can reap significant benefits through invaluable forecasting results.
1 Anderson, D.M., Kaoru, Y., and A. White. 2000. Estimated Annual Economic Impacts from Harmful Algal Blooms
(HABs) in the United States. WHOI 2000 11. Technical Report. 2 Hoagland, P. and S. Scatasta. 2006. The economic effects of harmful Algal blooms. In E. Graneli and J. Turner, eds.,
Ecology of Harmful Algae. Ecology Studies Series. Dordrecht, The Netherlands: Springer-Verlag, Chap. 29.

4/3/2007
IIOOOOSS aanndd EEnnvviirroonnmmeennttaall EEdduuccaattiioonn iinn tthhee GGuullff ooff MMeexxiiccoo
WWhhaatt ddooeess IIOOOOSS ddoo??
IOOS (Integrated Ocean Observing System) is a multidisciplinary system designed to provide ocean and coastal data in the formats, rates, and scales required for decision-making, based initially on the integration of existing private, federal, state, and local systems. In addition to decision-making, IOOS can be helpful in educating students and citizens about the environment in general and the Gulf of Mexico in particular, using real-time data and visualization systems to create interest in the Gulf’s ecological and oceanographic processes and connections. For example, IOOS information on sea levels can help students learn about climate change and its impact on coastal habitats and communities. Consisting of three major subsystems (see figure at right), IOOS will constantly evolve according to user needs. Currently, numerous ocean and weather data collection systems are maintained by scores of federal, state, and non-governmental agencies and organizations. IOOS is gathering these useful but disparate and isolated data sources into integrated systems, giving users ready access to all ocean-related data gathered by all possible sources. In addition, IOOS will allow any compilation of data specified by the user to be manipulated using myriad existing forecasting models, thereby turning raw numbers into actionable information relevant to the user’s specific concerns. Finally, IOOS is seeking new research and enhancements to add to its already-extensive catalog of products. In this way, IOOS becomes a flexible, adaptable system capable of keeping up with new developments while maintaining the reliable delivery of data, analyses, and forecasting results. IOOS will focus initially on a series of high priorities.
HHooww ccaann IIOOOOSS HHeellpp IImmpprroovvee EEnnvviirroonnmmeennttaall EEdduuccaattiioonn??
One of the most critical objectives for the Gulf of Mexico Alliance (GoMA) is environmental education, teaching not only the future resource managers and decision-makers about the Gulf of Mexico’s ecological health, but also residents who may not understand how their activities may impact the Gulf or how the Gulf can affect their lives. GoMA hopes to increase science literacy and establish and foster a sense of environmental stewardship toward the Gulf. One of the most tangible benefits of increasing awareness of the Gulf coastal resources and processes lies in hurricane preparedness and a perhaps life-saving appreciation for the power and destructive ability of Gulf waters. GoMA believes that creating community-wide education opportunities and instilling a stewardship ethic in both Gulf Coast residents and those within the drainage basin will help create a present and future generation of informed leaders. The very nature of IOOS makes it an ideal way for people to learn about the ecological nature of the Gulf as well as the ways in which seemingly disparate environmental aspects are really closely connected. Multiple IOOS groups have dedicated education missions. In 2006 the IOOS Education Caucus helped form the Education Data and Technology Protocols (EDATP) for education working group. This group promises to bridge the frequent gaps between scientific investigations and the information content that can be most useful in formal and informal education programs. Additionally, aquariums in both the United States (e.g., Texas Aquarium) and Mexico (e.g., Vera Cruz Aquarium) can be useful as parts of an effective network of active facilities that could become distribution or access points for new IOOS educational products and services. One example of the contribution IOOS can have to environmental education is through the Centers for Ocean Sciences Education Excellence (COSEE), a network of centers focused on promoting ocean science education as a
1. OBSERVING SUBSYSTEM
Gathers in situ and remote measurements
and data telemetry
3. DATA ANALYSIS & MODELING
SUBSYSTEM Develops and applies models for forecasting
ocean conditions.
2. DATA MANAGEMENT & COMMUNICATIONS
SUBSYSTEM Processes and standardizes data received from observing
subsystem
END USERS

4/3/2007
conduit for increasing the scientific literacy of U.S. citizens. Although each Center has regional issues on which it focuses, the fundamental objectives of the COSEE network include encouraging educators to incorporate ocean sciences into their curriculums, providing guidance to scientists who are involved in the educational world, and facilitating the addition of high-quality research findings into educational materials and lessons. Since data and products will be accessible via the internet, IOOS will allow environmental and ocean educators to access actual, tangible data, allowing for real-world, regional-specific scenarios to be played out in the classroom or seminar. IOOS promotes an understanding of often-mysterious environmental and meteorological phenomena and, by exposure to these kinds of concepts, students will be encouraged to seek career paths they might not otherwise have followed. These new career options will put these students in the position of continuing and evolving the IOOS legacy through research, field work, and education. This self-fulfilling sequence is only one of the numerous advantages of incorporating IOOS into educational curricula. In addition, a COSEE pilot program, COSEE-Ocean Systems (OS), is focused on reaching inland and rural audiences, endeavoring to represent oceans as integral parts of larger global systems. The program shows those who are not coastal inhabitants how they can impact the ocean and how ocean processes can affect inland communities. The program also makes evident the role played by these upstream areas, an objective that is shared by GoMA. IOOS can be indispensable in meeting some of the goals of COSEE-OS, including assisting with “key message concept mapping,” which seeks to showcase the role of oceans in larger earth systems by using multimedia resources. User-friendly interfaces, mapping abilities, and real-time access to data from IOOS can put the sometimes abstract connection between upland areas and ocean processes and health in a hands-on format, where students can see for themselves (using IOOS modeling and analysis abilities) how large ecological processes are inextricably entwined. IOOS developers are committed to making IOOS a user-driven system, by listening to the needs of key stakeholders, incorporating those needs into future products, and using these recommendations to guide future funding and development of IOOS.
WWhhaatt CCaann GGooMMAA aanndd OOtthheerr EEnnvviirroonnmmeennttaall EEdduuccaattiioonn SSttaakkeehhoollddeerrss DDoo??
The value added from the integrating and sustaining power of IOOS will only be realized with regional association participation and data sharing.
Participation: Stakeholders should get involved with an IOOS Regional Association (RA) (www.ocean.us/regional_associations). RAs are critical for engaging private and public user groups to identify regional data and information needs. Additionally, RAs can be high-value entry points for a user to get involved with specific IOOS pilot projects (many of which are happening right now) through which users help improve and refine IOOS. Pilot projects and RAs can facilitate data sharing, the cornerstone of IOOS, between previously unconnected parties. Even by sharing small amounts of data, users can reap significant benefits through invaluable forecasting results.
Data Sharing: Stakeholders should share data (e.g., weather information from vessel-based instruments or observations from offshore platforms) with federal, state, and local agencies. For instance, many universities have data collection programs and, in an effort to create student interest in environmental science, these data can be used via IOOS to demonstrate key concepts and create visualization tools.
"The COSEE network promotes a better understanding of the key role the ocean plays in global environmental cycles and processes. NSF is encouraging the ocean-science research community to become more involved in education at all levels."
Larry Clark, acting director of National Science Foundation’s (NSF) Division of Ocean Sciences (NSF Press Release, January 3, 2006)

4/3/2007
IIOOOOSS aanndd DDOOEE GGlloobbaall CClliimmaattee RReesseeaarrcchh
WWhhaatt ddooeess IIOOOOSS ddoo??
IOOS (Integrated Ocean Observing System) is a multidisciplinary system designed to provide weather, climate, ocean, and coastal data in the formats, rates, and scales required for decision-making, based initially on the integration of existing private, federal, state, and local systems. Consisting of three major subsystems (see figure at right), IOOS will constantly evolve according to user needs. IOOS will focus initially on a series of high priorities. For example, IOOS information on sea surface temperature and winds will enhance global climate forecasting models. Currently, numerous ocean and weather data collection systems are maintained by scores of federal, state, and non-governmental agencies and organizations (see Table 1 for a few examples). IOOS is gathering these useful but disparate and isolated data sources into integrated systems, giving users ready access to all ocean-related data gathered by all possible sources. In addition, IOOS will allow any compilation of data specified by the user to be manipulated using myriad existing forecasting models, thereby turning raw numbers into actionable information relevant to the user’s specific concerns. Finally, IOOS is seeking new research and enhancements to add to its already-extensive catalog of products. In this way, IOOS becomes a flexible, adaptable system capable of keeping up with new developments while maintaining the reliable delivery of data, analyses, and forecasting results.
Table 1. Examples of already-existing data collection systems for Global Climate Research
Existing Data Source Measurements Collected by Data Source Representative Outcomes
Atmospheric Radiation Measurement Program (http://www.arm.gov/)
A suite of atmospheric parameters including temperature, cloud cover, irradiance measures, etc.
Data are used to research atmospheric radiation balance and cloud feedback processes, which are critical to the understanding of global climate change.
Carbon Dioxide Information Analysis Center (http://cdiac.ornl.gov/)
Concentrations of CO2 and other radiatively active atmospheric gases, CO2 emissions, biogeochemical cycling of greenhouse gases, climate change trends, etc.
Better characterization of CO2 cycling and its role in global climate studies.
HHooww ccaann IIOOOOSS HHeellpp DDOOEE’’ss CClliimmaattee SSttuuddiieess RReesseeaarrcchh?? Given its ocean and coastal focus and the importance of the world’s oceans in our global climate, IOOS has a great potential to help global climate researchers. Many of DOE’s climate change research initiatives rely on the collection and existing availability of long-term continuous data, such as that available through IOOS. This information is critical in calibrating models to forecast and predict local and global weather patterns.
1. OBSERVING SUBSYSTEM
Gathers in situ and remote measurements and data
telemetry
3. DATA ANALYSIS & MODELING
SUBSYSTEM Develops and applies models
for forecasting ocean conditions.
2. DATA MANAGEMENT & COMMUNICATIONS
SUBSYSTEM Processes and standardizes data
received from observing subsystem
END USERS

4/3/2007
The Climate Change Research Division within DOE’s Office of Biological and Environmental Research conducts process research and modeling to address the following issues:
1. Improving the understanding of factors affecting the earth’s radiant energy balance; 2. Predicting accurately any global and regional climate change induced by increasing atmospheric
concentrations of aerosols and greenhouse gases; 3. Quantifying the sources and sinks of energy-related greenhouse gases, especially carbon dioxide;
and, 4. Improving the scientific basis for assessing both the potential ecological, social, and economic
consequences of climatic changes, and the benefits and costs of alternative response options. Many existing DOE programs focusing on climate change issues are prime examples of how DOE already benefits and will continue to benefit from IOOS. For example, the DOE Carbon Sequestration Program involves approximately 100 individual research efforts across DOE, evaluating such topics as the feasibility and techniques for sequestering carbon in the ocean, geologic formations (e.g., oil and gas
reserves), unminable coal seams, deep saline reservoirs, terrestrial vegetation and soil, agricultural land, biomass croplands, deserts, degraded lands, boreal wetlands, and peatlands. Although IOOS will be highly beneficial to many of these carbon sequestration projects, it will be particularly beneficial to programs researching ocean carbon sequestration. Another example of how IOOS can support DOE climate studies research is shown through the Climate Change Prediction Program. The goal of this program is to develop, test, and apply state-of-the-science computer-based global climate simulation models, based on theoretical climate-science foundations. Additionally, the program is to take advantage of high-performance computing and information technologies to increase the accuracy and throughput of computer model-based projections of climatic variability and change. By doing so, scientists, managers, and policy makers will be able to make more informed decisions on future energy use and technology issues. Because IOOS is a system integrated with the latest high-performance computing and information technologies, the Climate Change Prediction Program and IOOS can be mutually beneficial.
WWhhaatt CCaann DDOOEE’’ss CClliimmaattee SSttuuddiieess PPrrooggrraamm DDoo??
The value added from the integrating and sustaining power of IOOS will only be realized with Regional Association (RA) participation (www.ocean.us/regional_associations) and with NOAA and other federal agencies involved in IOOS. RAs are critical for engaging private and public user groups to identify regional data and information needs. Additionally, RAs can be high-value entry points for a user to get involved with specific IOOS pilot projects (many of which are happening right now) through which users help improve and refine IOOS. Pilot projects and RAs can facilitate data sharing, the cornerstone of IOOS, between previously unconnected parties. Even by sharing small amounts of data, users can reap significant benefits through invaluable forecasting results.
Ocean Carbon Sequestration The world’s oceans will eventually absorb 80 to 90 percent of the CO2 in the atmosphere and transfer it to the deep oceans. The process, however, is slow and may take hundreds of years. DOE is exploring options to speed up this process by enhancing the natural sequestration and directly injecting CO2. Although the technology exists to perform several of these sequestration techniques, information is lacking on potential impacts to the biological, chemical, and physical environment. By incorporating key biological, chemical, and physical parameters, IOOS can enhance modeling efforts to better predict the results of many of these techniques. Additionally, information contained in IOOS may provide estimates of CO2 concentrations at the air-water interface in many open ocean locations throughout the world. This information may be necessary for modeling to identify key locations to implement these types of technologies.