USC FOOTBALL HISTORY - CBSSports.comgraphics.fansonly.com/schools/usc/graphics/media-guides/...1964...
38
PAGE 72 — UNIVERSITY OF SOUTHERN CALIFORNIA USC FOOTBALL HISTORY Head Football Coaches W L T PCT. Henry H. Goddard and Frank H. Suffel, 1888 2 0 0 1.000 Lewis R. Freeman, 1897 (Stanford) 5 1 0 .833 Clair S. Tappaan, 1901 (Syracuse) 0 1 1 .000 John Walker, 1903 4 2 0 .667 Harvey R. Holmes, 1904-07 (Wisconsin) 19 5 3 .759 William I. Traeger, 1908 (Stanford) 3 1 1 .700 Dean B. Cromwell, 1909-10, 1916-18 (Occidental) 21 8 6 .686 Ralph Glaze, 1914-15 (Dartmouth) 7 7 0 .500 Elmer C. (“Gloomy Gus”) Henderson, 1919-24 (Oberlin) 45 7 0 .865 Howard H. Jones, 1925-40 (Yale) 121 36 13 .750 Justin M. (Sam) Barry, 1941 (Wisconsin) 2 6 1 .278 Newell J. Cravath, 1942-50 (USC) 54 28 8 .644 Jesse T. (Jess) Hill, 1951-56 (USC) 45 17 1 .722 Don R. Clark, 1957-59 (USC) 13 16 1 .450 John McKay, 1960-75 (Oregon) 127 40 8 .749 John Robinson, 1976-82, 1993-97 (Oregon) 104 35 4 .741 Ted Tollner, 1983-86 (Cal Poly, San Luis Obispo) 26 20 1 .564 Larry Smith, 1987-92 (Bowling Green) 44 25 3 .632 Paul Hackett, 1998-2000 (UC Davis) 19 18 0 .514 Pete Carroll, 2001-2004 (Pacific) 54 10 0 .844 Annual Won-Loss Record YEAR TEAM CAPTAIN G W L T FIN. PTS. OPP. 1888 Will Whitcomb 2 2 0 0 -- 20 0 1889 No Captain 2 2 0 0 -- 66 0 1890 No Varsity -- -- -- -- -- -- -- 1891 Frank Lapham 3 1 2 0 -- 48 26 1892 No Varsity -- -- -- -- -- -- -- 1893 No Captain 4 3 1 0 -- 56 50 1894 John A. Gray 1 1 0 0 -- 12 0 1895 Lee Bradley 2 0 1 1 -- 4 14 1896 Foster Wright 3 0 3 0 -- 0 74 1897 Harry Martin 6 5 1 0 -- 100 18 1898 Foster Wright 7 5 1 1 -- 97 28 1899 Logan Wheatley 6 2 3 1 -- 22 33 1900 Harry Woodard 3 1 1 1 -- 5 11 1901 Logan Wheatley 1 0 1 0 -- 0 6 1902 Dan Caley 5 2 3 0 -- 29 44 1903 Dan Caley 6 4 2 0 -- 58 27 1904 Jay Bickford 7 6 1 0 -- 199 27 1905 Carl Elliott 10 6 3 1 -- 211 45 1906 Oliver Best 4 2 0 2 -- 36 0 1907 Charley Haigler 6 5 1 0 -- 182 20 1908 Stan Burek 5 3 1 1 -- 63 18 1909 Hal Paulin 6 3 1 2 -- 133 13 1910 Jack Malcolm 8 7 0 1 -- 189 24 1911 Rugby -- -- -- -- -- -- -- 1912 Rugby -- -- -- -- -- -- -- 1913 Rugby -- -- -- -- -- -- -- 1914 Tommy Davis 7 4 3 0 -- 116 88 1915 Len Livernash 7 3 4 0 -- 132 119 1916 Herb Jones 8 5 3 0 -- 129 80 1917 Frank Malette 7 4 2 1 -- 127 47 1918 Harold Galloway, Keith Hunter 6 2 2 2 -- 61 61 1919 John Fox 5 4 1 0 -- 87 21 1920 Roy Evans 6 6 0 0 -- 171 21 1921 Charley Dean 11 10 1 0 -- 362 52 1922 Leo Calland 11 10 1 0 4 236 31 1923 Chet Dolley 8 6 2 0 3T 173 62 1924 John Hawkins 11 9 2 0 4T 269 44 1925 Hobbs Adams 13 11 2 0 3T 456 55 1926 Jeff Cravath 10 8 2 0 2 317 52 1927 Morley Drury 10 8 1 1 1T 287 64 1928 Jesse Hibbs 10 9 0 1 1 267 59 1929 Nate Barragar 12 10 2 0 1 492 69 1930 Marshall Duffield 10 8 2 0 2 382 66 1931 Stan Williamson 11 10 1 0 1 363 52 1932 Tay Brown 10 10 0 0 1 201 13 1933 Ford Palmer 12 10 1 1 3 257 30 1934 Julie Bescos 11 4 6 1 7 120 110 1935 Art Dittberner, Cliff Propst 12 5 7 0 8 155 124 1936 Gil Kuhn 9 4 2 3 3T 129 65 1937 Chuck Williams 10 4 4 2 7 136 98 1938 Don McNeil 11 9 2 0 1T 172 65 1939 Joe Shell 10 8 0 2 1 181 33 1940 Ed Dempsey 9 3 4 2 7 88 98 1941 Bob de Lauer 9 2 6 1 8 64 134 1942 Don Willer 11 5 5 1 4 184 128 1943 Ralph Heywood 10 8 2 0 1 155 58 1944 Jim Hardy 10 8 0 2 1 240 73 1945 Jim Callanan 11 7 4 0 1 205 150 1946 Doug Essick 10 6 4 0 3 158 106 1947 Don Clark 10 7 2 1 1 193 114 1948 Bob Bastian 10 6 3 1 3 142 87 1949 Jim Bird 9 5 3 1 3T 214 170 1950 Paul McMurtry, Volney Peters 9 2 5 2 7 114 182 1951 Pat Cannamela, Dean Schneider 10 7 3 0 4 224 168 1952 Bob Van Doren, Lou Welsh 11 10 1 0 1 254 47 1953 George Bozanic, Tom Nickoloff 10 6 3 1 3 199 161 1954 Ed Fouch, Lindon Crow 12 8 4 0 2 258 159 1955 George Galli, Marv Goux 10 6 4 0 6 265 158 1956 Jon Arnett, Ellsworth Kissinger 10 8 2 0 2T 218 126 1957 Jim Conroy, Mike Henry 10 1 9 0 7T 86 204 JOHN McKAY HOWARD JONES
Transcript of USC FOOTBALL HISTORY - CBSSports.comgraphics.fansonly.com/schools/usc/graphics/media-guides/...1964...

PAGE 72 — UNIVERSITY OF SOUTHERN CALIFORNIA
USC FOOTBALL HISTORYHead Football Coaches
W L T PCT.Henry H. Goddard and
Frank H. Suffel, 1888 2 0 0 1.000Lewis R. Freeman, 1897 (Stanford) 5 1 0 .833Clair S. Tappaan, 1901 (Syracuse) 0 1 1 .000John Walker, 1903 4 2 0 .667Harvey R. Holmes, 1904-07 (Wisconsin) 19 5 3 .759William I. Traeger, 1908 (Stanford) 3 1 1 .700Dean B. Cromwell, 1909-10,
1916-18 (Occidental) 21 8 6 .686Ralph Glaze, 1914-15 (Dartmouth) 7 7 0 .500Elmer C. (“Gloomy Gus”) Henderson,
1919-24 (Oberlin) 45 7 0 .865Howard H. Jones, 1925-40 (Yale) 121 36 13 .750Justin M. (Sam) Barry, 1941 (Wisconsin) 2 6 1 .278Newell J. Cravath, 1942-50 (USC) 54 28 8 .644Jesse T. (Jess) Hill, 1951-56 (USC) 45 17 1 .722Don R. Clark, 1957-59 (USC) 13 16 1 .450John McKay, 1960-75 (Oregon) 127 40 8 .749John Robinson, 1976-82, 1993-97
(Oregon) 104 35 4 .741Ted Tollner, 1983-86 (Cal Poly,
San Luis Obispo) 26 20 1 .564Larry Smith, 1987-92 (Bowling Green) 44 25 3 .632Paul Hackett, 1998-2000 (UC Davis) 19 18 0 .514Pete Carroll, 2001-2004 (Pacific) 54 10 0 .844
Annual Won-Loss RecordYEAR TEAM CAPTAIN G W L T FIN. PTS. OPP.1888 Will Whitcomb 2 2 0 0 -- 20 01889 No Captain 2 2 0 0 -- 66 01890 No Varsity -- -- -- -- -- -- --1891 Frank Lapham 3 1 2 0 -- 48 261892 No Varsity -- -- -- -- -- -- --1893 No Captain 4 3 1 0 -- 56 501894 John A. Gray 1 1 0 0 -- 12 01895 Lee Bradley 2 0 1 1 -- 4 141896 Foster Wright 3 0 3 0 -- 0 741897 Harry Martin 6 5 1 0 -- 100 181898 Foster Wright 7 5 1 1 -- 97 281899 Logan Wheatley 6 2 3 1 -- 22 331900 Harry Woodard 3 1 1 1 -- 5 111901 Logan Wheatley 1 0 1 0 -- 0 61902 Dan Caley 5 2 3 0 -- 29 441903 Dan Caley 6 4 2 0 -- 58 271904 Jay Bickford 7 6 1 0 -- 199 271905 Carl Elliott 10 6 3 1 -- 211 451906 Oliver Best 4 2 0 2 -- 36 01907 Charley Haigler 6 5 1 0 -- 182 201908 Stan Burek 5 3 1 1 -- 63 181909 Hal Paulin 6 3 1 2 -- 133 131910 Jack Malcolm 8 7 0 1 -- 189 241911 Rugby -- -- -- -- -- -- --1912 Rugby -- -- -- -- -- -- --1913 Rugby -- -- -- -- -- -- --1914 Tommy Davis 7 4 3 0 -- 116 881915 Len Livernash 7 3 4 0 -- 132 1191916 Herb Jones 8 5 3 0 -- 129 801917 Frank Malette 7 4 2 1 -- 127 471918 Harold Galloway,
Keith Hunter 6 2 2 2 -- 61 611919 John Fox 5 4 1 0 -- 87 211920 Roy Evans 6 6 0 0 -- 171 211921 Charley Dean 11 10 1 0 -- 362 521922 Leo Calland 11 10 1 0 4 236 311923 Chet Dolley 8 6 2 0 3T 173 621924 John Hawkins 11 9 2 0 4T 269 441925 Hobbs Adams 13 11 2 0 3T 456 551926 Jeff Cravath 10 8 2 0 2 317 521927 Morley Drury 10 8 1 1 1T 287 641928 Jesse Hibbs 10 9 0 1 1 267 591929 Nate Barragar 12 10 2 0 1 492 691930 Marshall Duffield 10 8 2 0 2 382 661931 Stan Williamson 11 10 1 0 1 363 521932 Tay Brown 10 10 0 0 1 201 131933 Ford Palmer 12 10 1 1 3 257 301934 Julie Bescos 11 4 6 1 7 120 1101935 Art Dittberner,
Cliff Propst 12 5 7 0 8 155 1241936 Gil Kuhn 9 4 2 3 3T 129 651937 Chuck Williams 10 4 4 2 7 136 981938 Don McNeil 11 9 2 0 1T 172 651939 Joe Shell 10 8 0 2 1 181 331940 Ed Dempsey 9 3 4 2 7 88 981941 Bob de Lauer 9 2 6 1 8 64 1341942 Don Willer 11 5 5 1 4 184 1281943 Ralph Heywood 10 8 2 0 1 155 581944 Jim Hardy 10 8 0 2 1 240 731945 Jim Callanan 11 7 4 0 1 205 1501946 Doug Essick 10 6 4 0 3 158 1061947 Don Clark 10 7 2 1 1 193 1141948 Bob Bastian 10 6 3 1 3 142 871949 Jim Bird 9 5 3 1 3T 214 1701950 Paul McMurtry,
Volney Peters 9 2 5 2 7 114 1821951 Pat Cannamela,
Dean Schneider 10 7 3 0 4 224 1681952 Bob Van Doren,
Lou Welsh 11 10 1 0 1 254 471953 George Bozanic,
Tom Nickoloff 10 6 3 1 3 199 1611954 Ed Fouch,
Lindon Crow 12 8 4 0 2 258 1591955 George Galli,
Marv Goux 10 6 4 0 6 265 1581956 Jon Arnett,
Ellsworth Kissinger 10 8 2 0 2T 218 1261957 Jim Conroy,
Mike Henry 10 1 9 0 7T 86 204
JOHNMcKAY
HOWARDJONES

2006 FOOTBALL MEDIA GUIDE — PAGE 73
YEAR TEAM CAPTAIN G W L T FIN. PTS. OPP.1958 Ken Antle,
Monte Clark 10 4 5 1 3 151 1201959 Ron Mix,
Willie Wood 10 8 2 0 1T 195 901960 Mike McKeever,
George Van Vliet 10 4 6 0 2 95 1521961 Britt Williams 10 4 5 1 2T 150 1671962 Marv Marinovich,
Ben Wilson 11 11 0 0 1 261 921963 Pete Beathard,
Willie Brown 10 7 3 0 2 207 1141964 Craig Fertig,
Bill Fisk 10 7 3 0 1T 207 1301965 Chuck Arrobio,
Mike Garrett 10 7 2 1 2 262 921966 Nate Shaw,
Rod Sherman 11 7 4 0 1 199 1281967 Tim Rossovich,
Adrian Young 11 10 1 0 1 258 871968 O. J. Simpson,
Steve Sogge 11 9 1 1 1 259 1681969 Jim Gunn,
Bob Jensen 11 10 0 1 1 261 1281970 Charlie Weaver,
Bob Chandler 11 6 4 1 6T 343 2331971 John Vella,
Willie Hall 11 6 4 1 2 229 1641972 Sam Cunningham,
John Grant 12 12 0 0 1 467 1341973 Lynn Swann,
Artimus Parker 12 9 2 1 1 322 2021974 Pat Haden,
Richard Wood 12 10 1 1 1 363 1421975 Kevin Bruce,
Danny Reece 12 8 4 0 5 247 1401976 Ricky Bell,
Vince Evans,Eric Williams 12 11 1 0 1 386 139
1977 Rob Hertel,Clay Matthews 12 8 4 0 2T 357 212
1978 Lynn Cain,Rich Dimler 13 12 1 0 1 318 153
1979 Dennis Johnson,Charles White 12 11 0 1 1 389 171
1980 Ronnie Lott,Keith Van Horne 11 8 2 1 3 265 134
1981 Marcus Allen,Chip Banks 12 9 3 0 2T 294 170
1982 George Achica,Joey Browner,Bruce Matthews 11 8 3 0 3T 302 143
1983 Tony Brewer,Jeff Brown,Keith Browner,Fred Cornwell,Tony Slaton 11 4 6 1 4 210 238
1984 Neil Hope,Ken Ruettgers 12 9 3 0 1 220 173
1985 Matt Koart,Hank Norman 12 6 6 0 4T 223 187
1986 Jeff Bregel,Tim McDonald 12 7 5 0 4T 264 239
1987 Dave Cadigan,Greg Coauette 12 8 4 0 1T 321 229
1988 Rodney Peete 12 10 2 0 1 370 1841989 Leroy Holt,
Tim Ryan 12 9 2 1 1 336 1321990 Don Gibson 13 8 4 1 2 348 2741991 Matt Gee 11 3 8 0 8 229 2761992 Stephon Pace 12 6 5 1 3T 264 2491993 Craig Gibson,
Willie McGinest,Deon Strother 13 8 5 0 1T 348 252
1994 Tony Boselli,Jeff Kopp,Brian Williams 12 8 3 1 2T 356 243
1995 Terry Barnum,Errick Herrin 12 9 2 1 1T 355 212
1996 John Allred,Sammy Knight 12 6 6 0 5T 325 267
1997 Jonathan Himebauch,Brian Kelly 11 6 5 0 5T 233 233
1998 Adam Abrams,Chris Claiborne,Billy Miller,Chad Morton 13 8 5 0 3T 346 241
ANNUAL WON-LOSS RECORD, ALL-TIME PAC-10 RECORDS, USC VS. PAC-10
YEAR TEAM CAPTAIN G W L T FIN. PTS. OPP.1999 David Gibson,
Chad Morton,Ifeanyi Ohalete 12 6 6 0 6T 348 278
2000 Ennis Davis,Eric Denmon,Zeke Moreno,Petros Papadakis 12 5 7 0 8T 309 337
2001 Charlie Landrigan,Troy Polamalu,Antuan Simmons 12 6 6 0 5 298 207
2002 Carson Palmer,Troy Polamalu 13 11 2 0 1T 465 240
2003 Keary Colbert,Melvin Simmons 13 12 1 0 1 534 239
2004 Shaun Cody,Matt Grootegoed,Matt Leinart 13 13 0 0 1 496 169
2005 Darnell Bing,Reggie Bush,Matt Leinart,Dallas Sartz 13 12 1 0 1 638 297Total Record 1084 732 298 54
All-Time NCAA Won-Loss Recordsof Pac-10 Teams
W L T PCT.USC 732 298 54 .700Washington 641 372 50 .627Arizona State 524 318 24 .619UCLA 521 338 37 .602Arizona 525 385 33 .574Stanford 542 401 49 .571California 592 456 51 .562Oregon 532 451 46 .539Washington State 476 463 45 .507Oregon State 459 514 50 .473
USC vs. the Pac-10USC OPP.
OPPONENT WINS WINS TIES PCT.Oregon State 57 8 4 .855Washington State 53 8 4 .846Arizona 23 6 0 .793Stanford 57 24 3 .696Oregon 35 15 2 .692California 58 30 5 .651Washington 46 26 4 .632UCLA 41 27 7 .593Arizona State 13 9 0 .591Totals 383 153 29 .704
PAGE 74 — UNIVERSITY OF SOUTHERN CALIFORNIA
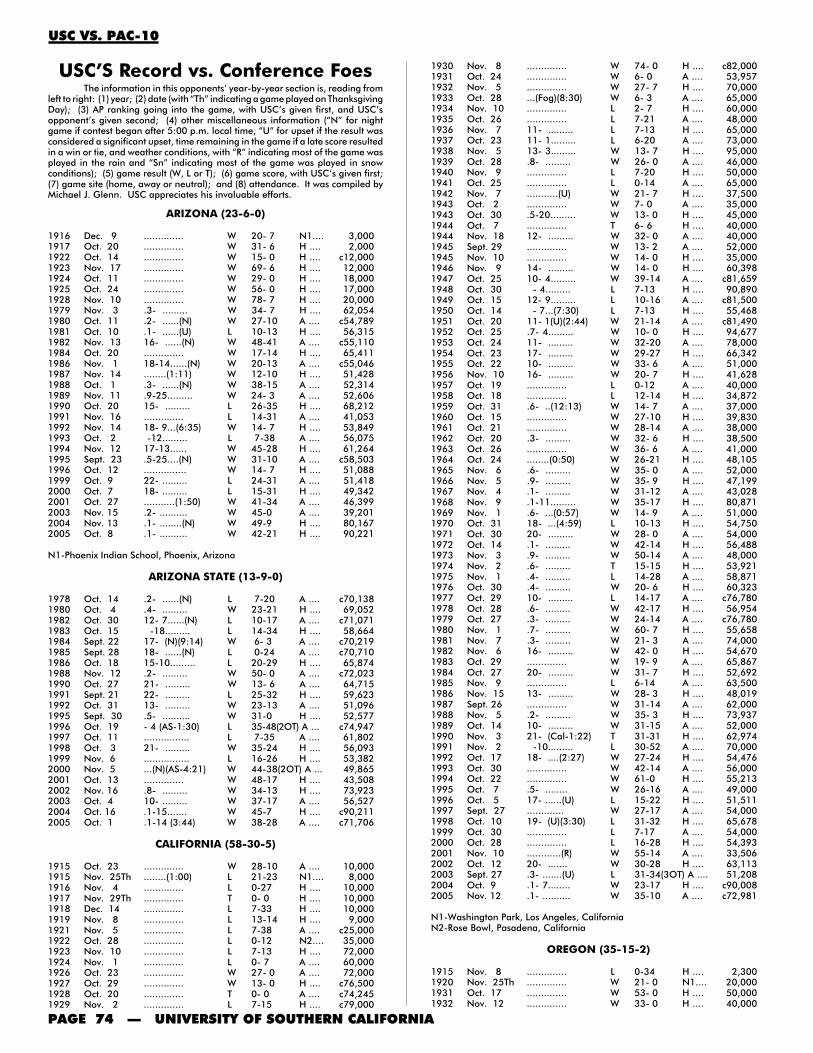
USC’S Record vs. Conference FoesThe information in this opponents’ year-by-year section is, reading from
left to right: (1) year; (2) date (with “Th” indicating a game played on ThanksgivingDay); (3) AP ranking going into the game, with USC’s given first, and USC’sopponent’s given second; (4) other miscellaneous information (“N” for nightgame if contest began after 5:00 p.m. local time, “U” for upset if the result wasconsidered a significant upset, time remaining in the game if a late score resultedin a win or tie, and weather conditions, with “R” indicating most of the game wasplayed in the rain and “Sn” indicating most of the game was played in snowconditions); (5) game result (W, L or T); (6) game score, with USC’s given first;(7) game site (home, away or neutral); and (8) attendance. It was compiled byMichael J. Glenn. USC appreciates his invaluable efforts.
ARIZONA (23-6-0)
1916 Dec. 9 .............. W 20- 7 N1.... 3,0001917 Oct. 20 .............. W 31- 6 H .... 2,0001922 Oct. 14 .............. W 15- 0 H .... c12,0001923 Nov. 17 .............. W 69- 6 H .... 12,0001924 Oct. 11 .............. W 29- 0 H .... 18,0001925 Oct. 24 .............. W 56- 0 H .... 17,0001928 Nov. 10 .............. W 78- 7 H .... 20,0001979 Nov. 3 .3- ......... W 34- 7 H .... 62,0541980 Oct. 11 .2- ......(N) W 27-10 A .... c54,7891981 Oct. 10 .1- ......(U) L 10-13 H .... 56,3151982 Nov. 13 16- ......(N) W 48-41 A .... c55,1101984 Oct. 20 .............. W 17-14 H .... 65,4111986 Nov. 1 18-14......(N) W 20-13 A .... c55,0461987 Nov. 14 ........(1:11) W 12-10 H .... 51,4281988 Oct. 1 .3- ......(N) W 38-15 A .... 52,3141989 Nov. 11 .9-25......... W 24- 3 A .... 52,6061990 Oct. 20 15- ......... L 26-35 H .... 68,2121991 Nov. 16 .............. L 14-31 A .... 41,0531992 Nov. 14 18- 9...(6:35) W 14- 7 H .... 53,8491993 Oct. 2 -12......... L 7-38 A .... 56,0751994 Nov. 12 17-13...... W 45-28 H .... 61,2641995 Sept. 23 .5-25....(N) W 31-10 A .... c58,5031996 Oct. 12 ............... W 14- 7 H .... 51,0881999 Oct. 9 22- ......... L 24-31 A .... 51,4182000 Oct. 7 18- ......... L 15-31 H .... 49,3422001 Oct. 27 ...........(1:50) W 41-34 A .... 46,3992003 Nov. 15 .2- .......... W 45-0 A .... 39,2012004 Nov. 13 .1- ........(N) W 49-9 H .... 80,1672005 Oct. 8 .1- .......... W 42-21 H .... 90,221
N1-Phoenix Indian School, Phoenix, Arizona
ARIZONA STATE (13-9-0)
1978 Oct. 14 .2- ......(N) L 7-20 A .... c70,1381980 Oct. 4 .4- ......... W 23-21 H .... 69,0521982 Oct. 30 12- 7......(N) L 10-17 A .... c71,0711983 Oct. 15 -18......... L 14-34 H .... 58,6641984 Sept. 22 17- (N)(9:14) W 6- 3 A .... c70,2191985 Sept. 28 18- ......(N) L 0-24 A .... c70,7101986 Oct. 18 15-10......... L 20-29 H .... 65,8741988 Nov. 12 .2- ......... W 50- 0 A .... c72,0231990 Oct. 27 21- ......... W 13- 6 A .... 64,7151991 Sept. 21 22- ......... L 25-32 H .... 59,6231992 Oct. 31 13- ......... W 23-13 A .... 51,0961995 Sept. 30 .5- .......... W 31-0 H .... 52,5771996 Oct. 19 - 4 (AS-1:30) L 35-48(2OT) A ... c74,9471997 Oct. 11 ................ L 7-35 A .... 61,8021998 Oct. 3 21- ......... W 35-24 H .... 56,0931999 Nov. 6 ................ L 16-26 H .... 53,3822000 Nov. 5 ...(N)(AS-4:21) W 44-38(2OT) A ... 49,8652001 Oct. 13 .............. W 48-17 H .... 43,5082002 Nov. 16 .8- ......... W 34-13 H .... 73,9232003 Oct. 4 10- ......... W 37-17 A .... 56,5272004 Oct. 16 .1-15....... W 45-7 H .... c90,2112005 Oct. 1 .1-14 (3:44) W 38-28 A .... c71,706
CALIFORNIA (58-30-5)
1915 Oct. 23 .............. W 28-10 A .... 10,0001915 Nov. 25Th ........(1:00) L 21-23 N1.... 8,0001916 Nov. 4 .............. L 0-27 H .... 10,0001917 Nov. 29Th .............. T 0- 0 H .... 10,0001918 Dec. 14 .............. L 7-33 H .... 10,0001919 Nov. 8 .............. L 13-14 H .... 9,0001921 Nov. 5 .............. L 7-38 A .... c25,0001922 Oct. 28 .............. L 0-12 N2.... 35,0001923 Nov. 10 .............. L 7-13 H .... 72,0001924 Nov. 1 .............. L 0- 7 A .... 60,0001926 Oct. 23 .............. W 27- 0 A .... 72,0001927 Oct. 29 .............. W 13- 0 H .... c76,5001928 Oct. 20 .............. T 0- 0 A .... c74,2451929 Nov. 2 .............. L 7-15 H .... c79,000
1930 Nov. 8 .............. W 74- 0 H .... c82,0001931 Oct. 24 .............. W 6- 0 A .... 53,9571932 Nov. 5 .............. W 27- 7 H .... 70,0001933 Oct. 28 ...(Fog)(8:30) W 6- 3 A .... 65,0001934 Nov. 10 .............. L 2- 7 H .... 60,0001935 Oct. 26 .............. L 7-21 A .... 48,0001936 Nov. 7 11- ......... L 7-13 H .... 65,0001937 Oct. 23 11- 1......... L 6-20 A .... 73,0001938 Nov. 5 13- 3......... W 13- 7 H .... 95,0001939 Oct. 28 .8- ......... W 26- 0 A .... 46,0001940 Nov. 9 .............. L 7-20 H .... 50,0001941 Oct. 25 .............. L 0-14 A .... 65,0001942 Nov. 7 ...........(U) W 21- 7 H .... 37,5001943 Oct. 2 .............. W 7- 0 A .... 35,0001943 Oct. 30 .5-20......... W 13- 0 H .... 45,0001944 Oct. 7 .............. T 6- 6 H .... 40,0001944 Nov. 18 12- ......... W 32- 0 A .... 40,0001945 Sept. 29 .............. W 13- 2 A .... 52,0001945 Nov. 10 .............. W 14- 0 H .... 35,0001946 Nov. 9 14- ......... W 14- 0 H .... 60,3981947 Oct. 25 10- 4......... W 39-14 A .... c81,6591948 Oct. 30 - 4......... L 7-13 H .... 90,8901949 Oct. 15 12- 9......... L 10-16 A .... c81,5001950 Oct. 14 - 7...(7:30) L 7-13 H .... 55,4681951 Oct. 20 11- 1(U)(2:44) W 21-14 A .... c81,4901952 Oct. 25 .7- 4......... W 10- 0 H .... 94,6771953 Oct. 24 11- ......... W 32-20 A .... 78,0001954 Oct. 23 17- ......... W 29-27 H .... 66,3421955 Oct. 22 10- ......... W 33- 6 A .... 51,0001956 Nov. 10 16- ......... W 20- 7 H .... 41,6281957 Oct. 19 .............. L 0-12 A .... 40,0001958 Oct. 18 .............. L 12-14 H .... 34,8721959 Oct. 31 .6- ..(12:13) W 14- 7 A .... 37,0001960 Oct. 15 .............. W 27-10 H .... 39,8301961 Oct. 21 .............. W 28-14 A .... 38,0001962 Oct. 20 .3- ......... W 32- 6 H .... 38,5001963 Oct. 26 .............. W 36- 6 A .... 41,0001964 Oct. 24 ........(0:50) W 26-21 H .... 48,1051965 Nov. 6 .6- ......... W 35- 0 A .... 52,0001966 Nov. 5 .9- ......... W 35- 9 H .... 47,1991967 Nov. 4 .1- ......... W 31-12 A .... 43,0281968 Nov. 9 .1-11......... W 35-17 H .... 80,8711969 Nov. 1 .6- ...(0:57) W 14- 9 A .... 51,0001970 Oct. 31 18- ...(4:59) L 10-13 H .... 54,7501971 Oct. 30 20- ......... W 28- 0 A .... 54,0001972 Oct. 14 .1- ......... W 42-14 H .... 56,4881973 Nov. 3 .9- ......... W 50-14 A .... 48,0001974 Nov. 2 .6- ......... T 15-15 H .... 53,9211975 Nov. 1 .4- ......... L 14-28 A .... 58,8711976 Oct. 30 .4- ......... W 20- 6 H .... 60,3231977 Oct. 29 10- ......... L 14-17 A .... c76,7801978 Oct. 28 .6- ......... W 42-17 H .... 56,9541979 Oct. 27 .3- ......... W 24-14 A .... c76,7801980 Nov. 1 .7- ......... W 60- 7 H .... 55,6581981 Nov. 7 .3- ......... W 21- 3 A .... 74,0001982 Nov. 6 16- ......... W 42- 0 H .... 54,6701983 Oct. 29 .............. W 19- 9 A .... 65,8671984 Oct. 27 20- ......... W 31- 7 H .... 52,6921985 Nov. 9 .............. L 6-14 A .... 63,5001986 Nov. 15 13- ......... W 28- 3 H .... 48,0191987 Sept. 26 .............. W 31-14 A .... 62,0001988 Nov. 5 .2- ......... W 35- 3 H .... 73,9371989 Oct. 14 10- ......... W 31-15 A .... 52,0001990 Nov. 3 21- (Cal-1:22) T 31-31 H .... 62,9741991 Nov. 2 -10......... L 30-52 A .... 70,0001992 Oct. 17 18- ....(2:27) W 27-24 H .... 54,4761993 Oct. 30 .............. W 42-14 A .... 56,0001994 Oct. 22 .............. W 61-0 H .... 55,2131995 Oct. 7 .5- ........ W 26-16 A .... 49,0001996 Oct. 5 17- ......(U) L 15-22 H .... 51,5111997 Sept. 27 ............. W 27-17 A .... 54,0001998 Oct. 10 19- (U)(3:30) L 31-32 H .... 65,6781999 Oct. 30 .............. L 7-17 A .... 54,0002000 Oct. 28 .............. L 16-28 H .... 54,3932001 Nov. 10 ............(R) W 55-14 A .... 33,5062002 Oct. 12 20- ....... W 30-28 H .... 63,1132003 Sept. 27 .3- .......(U) L 31-34(3OT) A .... 51,2082004 Oct. 9 .1- 7........ W 23-17 H .... c90,0082005 Nov. 12 .1- .......... W 35-10 A .... c72,981
N1-Washington Park, Los Angeles, CaliforniaN2-Rose Bowl, Pasadena, California
OREGON (35-15-2)
1915 Nov. 8 .............. L 0-34 H .... 2,3001920 Nov. 25Th .............. W 21- 0 N1.... 20,0001931 Oct. 17 .............. W 53- 0 H .... 50,0001932 Nov. 12 .............. W 33- 0 H .... 40,000
USC VS. PAC-10

2006 FOOTBALL MEDIA GUIDE — PAGE 75
1933 Nov. 18 .............. W 26- 0 H .... 69,0001934 Nov. 17 ...........(R) W 33- 0 H .... 20,0001936 Oct. 3 .............. W 26- 0 H .... 35,0001937 Oct. 16 .............. W 34-14 H .... 45,0001938 Oct. 29 19- ....(Mud) W 31- 7 N2.... 18,0001939 Sept. 30 .....(SC-7:00) T 7- 7 H .... 41,0001940 Oct. 19 17- ......... W 13- 0 H .... 35,0001941 Oct. 11 .............. L 6-20 H .... 40,0001942 Nov. 14 .............. W 40- 0 H .... 33,0001946 Nov. 2 .............. W 43- 0 H .... 45,8851948 Oct. 16 .............. L 7- 8 N2.... 32,6001949 Oct. 22 19- ......... W 40-13 H .... 47,0981950 Oct. 28 .............. W 30-21 H .... 27,0081953 Oct. 31 .7- (U)(13:38) L 7-13 N2.... 17,7721954 Oct. 16 .............. W 24-14 N2.... 22,7661955 Sept. 23 .9- ......(N) W 42-15 H .... 37,5381956 Nov. 17 14- ......... L 0- 7 N2.... 14,4801957 Nov. 16 -16......... L 7-16 H .... 30,9751958 Oct. 11 -15......... L 0-25 N2.... 32,7341967 Oct. 28 .1- ......... W 28- 6 H .... 48,8071968 Nov. 2 .1- (R)(1:12) W 20-13 A .... 33,5001970 Oct. 24 10- (R)(U)(13:05) L 7-10 A .... 34,0001971 Oct. 9 ...(N)(U)(7:43) L 23-28 H .... 50,1111972 Oct. 28 .1- ......(R) W 18- 0 A .... 32,0001973 Oct. 20 .6- ......... W 31-10 H .... 53,1551974 Oct. 19 .6- ......... W 16- 7 A .... 32,5001975 Oct. 18 .3- ......... W 17- 3 H .... 50,5421976 Sept. 18 ...........(N) W 53- 0 A .... c40,6001977 Oct. 15 .6- ......... W 33-15 H .... 51,1201978 Sept. 16 .8- ......(N) W 37-10 A .... 31,0001980 Oct. 18 .2- ......... T 7- 7 A .... c42,7331982 Oct. 2 16- ......... W 38- 7 H .... 47,1811984 Oct. 13 .............. W 19- 9 A .... 29,5811985 Nov. 30* .............. W 20- 6 N3.... c65,0001986 Oct. 4 .9- ......(N) W 35-21 H .... 51,3401987 Oct. 10 .............. L 27-34 A .... c39,5871988 Oct. 8 .3-18........ W 42-14 H .... 63,4521991 Sept. 28 ...........(N) W 30-14 A .... c45,9481992 Oct. 10 20- ......... W 32-10 H .... 46,3431993 Oct. 9 ............... W 24-13 A .... 40,9351994 Oct. 1 19- ......(U) L 7-22 H .... 44,2321997 Oct. 1 ............(N) W 24-22 H .... 53,6401998 Oct. 24 -12........ L 13-17 A .... c45,8071999 Sept. 25 16- .(N)(UO-0:30) L 30-33(3OT) A ... c45,6602000 Oct. 14 - 9.......... L 17-28 H .... 54,0312001 Sept. 22 - 7...(N)(0:12) L 22-24 A .... c45,7652002 Oct. 26 15-14....... W 44-33 A .... c56,7542005 Sept. 24 .1-24........ W 45-13 A ... c59,129
N1-Tournament Park, Pasadena, CaliforniaN2-Multnomah Stadium, Portland, OregonN3-Tokyo Olympic Memorial Stadium, Tokyo, Japan*-Mirage Bowl
OREGON STATE (57-8-4)
1914 Nov. 26Th .............. L 6-38 N1.... 7,0001916 Nov. 30Th .............. L 7-16 H .... 5,0001921 Nov. 26 .............. W 7- 0 N2.... 17,5001924 Oct. 18 .............. W 17- 3 N3.... 15,0001925 Dec. 5 .............. W 28- 0 H .... 25,0001926 Nov. 11 .........(Mud) W 17- 7 N3.... 26,0001927 Oct. 8 ........(5:00) W 13-12 H .... 35,0001928 Oct. 6 .............. W 19- 0 H .... 50,0001929 Oct. 5 .............. W 21- 7 H .... 40,0001930 Oct. 4 .............. W 27- 7 H .... 40,0001931 Oct. 3 .............. W 30- 0 H .... 50,0001932 Oct. 8 .............. W 10- 0 H .... 40,0001933 Oct. 21 .............. T 0- 0 N3.... 21,0001934 Oct. 20 .....(OS-1:42) T 6- 6 H .... 40,0001935 Oct. 19 .............. L 7-13 H .... 35,0001936 Sept. 26 .............. W 38- 7 H .... 45,0001937 Nov. 13 .............. T 12-12 H .... 35,0001938 Oct. 1 .............. W 7- 0 H .... 35,0001939 Nov. 4 .7-11......... W 19- 7 N3.... c33,0001940 Oct. 5 .............. T 0- 0 H .... 50,0001941 Sept. 27 ........(0:13) W 13- 7 H .... 50,0001945 Nov. 24 .............. W 34- 7 H .... 30,0001946 Oct. 12 .............. L 0- 6 N3.... 29,5941947 Oct. 18 11- ......... W 48- 6 H .... 61,3011948 Sept. 24 ...........(N) W 21- 6 H .... 50,2371951 Oct. 13 14-18......... W 16-14 H .... 36,4001952 Oct. 18 .7- ......... W 28- 6 N3.... 17,4381953 Oct. 17 13- ......... W 37- 0 H .... 34,1631954 Oct. 30 13- ......... W 34- 0 H .... 30,0651956 Sept. 28 .6- ......(N) W 21-13 H .... 53,7141957 Sept. 21 19-13......(N) L 0-20 N3.... 36,8551958 Sept. 19 -12......(N) W 21- 0 H .... 40,2861959 Sept. 19 ........(N)(R) W 27- 6 N3.... 23,895
1960 Sept. 16 .6- ...(N)(U) L 0-14 H .... 32,9281963 Nov. 15 ...........(N) W 28-22 H .... 30,8461965 Oct. 2 ...........(N) W 26-12 H .... 52,1001966 Oct. 1 .5- ......(N) W 21- 0 N3.... 29,2171967 Nov. 11 .1- ......(R) L 0- 3 A .... c41,4941968 Nov. 16 .1-13......... W 17-13 H .... 59,2361969 Oct. 4 .5- ......... W 31- 7 A .... c38,0131970 Oct. 3 .5- ......(N) W 45-13 H .... 57,7691972 Sept. 16 .1- ......(N) W 51- 6 H .... 56,3051973 Oct. 6 .4- ......(R) W 21- 7 A .... 21,7321974 Oct. 26 .6- ......... W 31-10 H .... 52,3921975 Sept. 19 .4- ......(N) W 24- 7 H .... 50,1651976 Oct. 23 .7- ......... W 56- 0 H .... 53,2161977 Sept. 17 .2- (N)(11:48) W 17-10 A .... 31,1431978 Oct. 21 .7- ......... W 38- 7 H .... 53,7341979 Sept. 15 .1- ......... W 42- 5 A .... 32,0001981 Oct. 3 .1- ......... W 56-22 A .... 33,0001982 Oct. 23 12- ......... W 38- 0 H .... 50,0351983 Sept. 17 14- ......(N) W 33-10 A .... 28,0001985 Oct. 5 .............. W 63- 0 H .... 50,6241987 Oct. 3 ...........(N) W 48-14 H .... 47,9791988 Oct. 29 .3- ......... W 41-20 A .... 31,1171989 Nov. 4 .9- ......... W 48- 6 H .... 65,4301990 Nov. 10 23- ......... W 56- 7 A .... 18,7951993 Oct. 16 ................ W 34-9 H .... 44,3631994 Oct. 8 ................ W 27-19 A .... 33,8921995 Nov. 11 12- .....(N) W 28-10 A .... 21,8511996 Sept. 14 16- .......... W 46-17 H ... 48,0691997 Nov. 15 ................ W 23-0 A .... 20,9381998 Sept. 19 16- .....(N) W 40-20 H .... 45,6291999 Oct. 2 ................ W 37-29 H .... 43,7952000 Sept. 30 .8- .......(U) L 21-31 A .... c33,7752001 Nov. 3 ................ W 16-13(OT) H .... 44,8802002 Sept. 28 18-23....... W 22-0 H .... 56,4172003 Dec. 6 .2- ........... W 52-28 H .... 73,8642004 Nov. 6 .1- (N)(Fog)(Cold) W 28-20 A .... c36,412
N1-Tacoma Stadium, Tacoma, WashingtonN2-Tournament Park, Pasadena, CaliforniaN3-Multnomah Stadium, Portland, Oregon
STANFORD (57-24-3)
1905 Nov. 4 .............. L 0-16 A ....1918 Nov. 23 ...........(R) W 25- 8 N1....1919 Nov. 27Th .........(Mud) W 13- 0 H ....1920 Oct. 16 .............. W 10- 0 H .... 8,0001922 Nov. 11 .............. W 6- 0 A .... 15,0001923 Oct. 27 .............. W 14- 7 A .... 20,0001925 Oct. 17 .............. L 9-13 H .... c70,0001926 Oct. 30 .............. L 12-13 H .... c78,5001927 Oct. 15 .....(SU-0:30) T 13-13 A .... 52,3851928 Nov. 3 .............. W 10- 0 H .... 80,0001929 Oct. 26 .............. W 7- 0 A .... c89,0001930 Oct. 25 .............. W 41-12 A .... c89,0001931 Nov. 7 .............. W 19- 0 H .... c93,0001932 Oct. 22 .............. W 13- 0 A .... 60,0001933 Nov. 11 .............. L 7-13 H .... 95,0001934 Oct. 27 .............. L 0-16 A .... 48,0001935 Nov. 9 ........(1:00) L 0- 3 H .... 50,0001936 Oct. 24 .6- ......... W 14- 7 A .... 35,0001937 Nov. 6 .............. L 6- 7 H .... 55,0001938 Oct. 22 .............. W 13- 2 A .... 35,0001939 Nov. 11 .4- ......... W 33- 0 H .... 50,0001940 Oct. 26 17- 9......... L 7-21 A .... 60,0001941 Nov. 8 - 9......... L 0-13 H .... 86,3051942 Oct. 24 .............. L 6-14 N2.... 25,0001946 Oct. 26 .............. W 28-20 A .... 50,0001947 Nov. 8 .5- ......... W 14- 0 H .... 59,7491948 Oct. 23 .............. W 7- 6 A .... 40,0001949 Nov. 5 12- ......... L 13-34 H .... 70,0411950 Nov. 4 .....(SU-2:20) T 7- 7 A .... 40,0001951 Nov. 10 .6- 7...(2:00) L 20-27 H .... 96,1301952 Nov. 8 .6- ......... W 54- 7 A .... 55,0001953 Nov. 7 17-11...(0:14) W 23-20 H .... 79,0151954 Nov. 6 10- ......... W 21- 7 A .... 28,0001955 Nov. 5 16- ......... L 20-28 H .... 63,2651956 Oct. 27 .6- ......... L 19-27 A .... 70,0001957 Nov. 9 .............. L 7-35 H .... 51,9231958 Nov. 1 .............. W 29- 6 A .... 52,0001959 Oct. 24 .5- ......... W 30-28 H .... 44,2091960 Oct. 29 .............. W 21-10 A .... 29,0001961 Nov. 11 .............. W 30-15 H .... 36,5981962 Nov. 10 .2- ......... W 39-14 A .... 41,0001963 Nov. 9 .............. W 25-11 H .... 57,0351964 Nov. 7 .............. W 15-10 A .... 55,0001965 Oct. 16 .6- ......... W 14- 0 H .... 61,6181966 Oct. 15 .5- ......... W 21- 7 A .... 61,5001967 Oct. 7 .1- ......(N) W 30- 0 H .... 62,598
USC VS. PAC-10
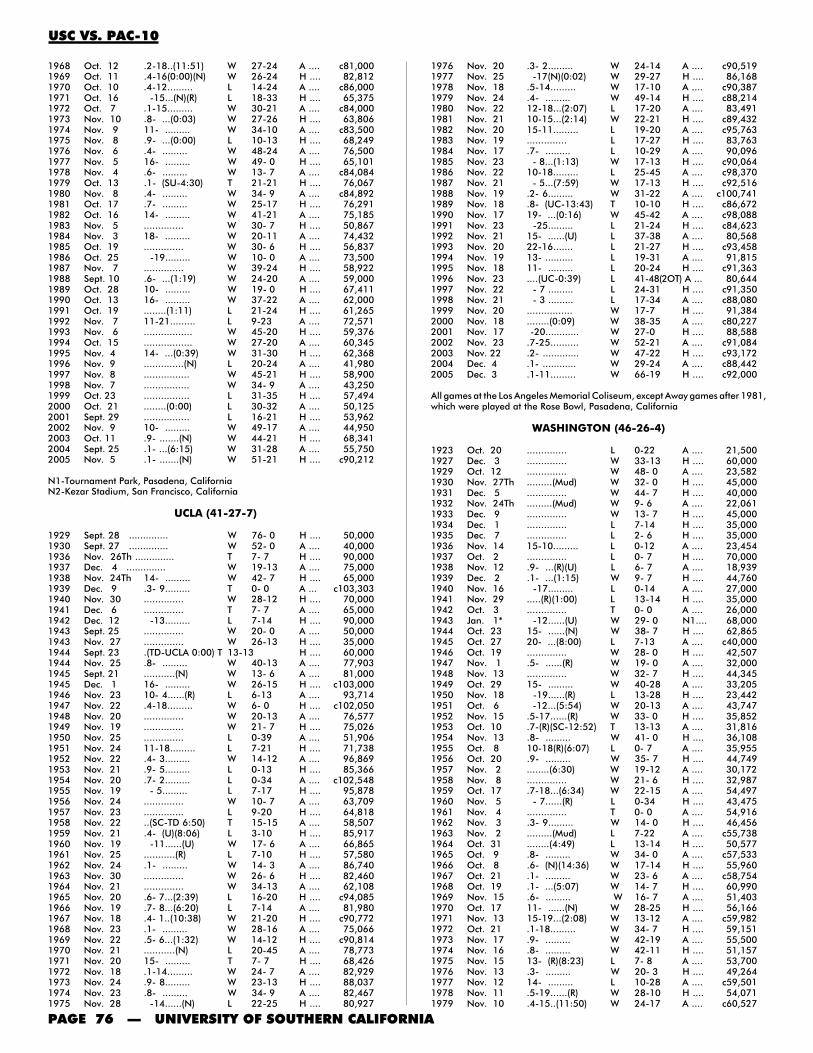
PAGE 76 — UNIVERSITY OF SOUTHERN CALIFORNIA
1968 Oct. 12 .2-18..(11:51) W 27-24 A .... c81,0001969 Oct. 11 .4-16(0:00)(N) W 26-24 H .... 82,8121970 Oct. 10 .4-12......... L 14-24 A .... c86,0001971 Oct. 16 -15...(N)(R) L 18-33 H .... 65,3751972 Oct. 7 .1-15......... W 30-21 A .... c84,0001973 Nov. 10 .8- ...(0:03) W 27-26 H .... 63,8061974 Nov. 9 11- ......... W 34-10 A .... c83,5001975 Nov. 8 .9- ...(0:00) L 10-13 H .... 68,2491976 Nov. 6 .4- ......... W 48-24 A .... 76,5001977 Nov. 5 16- ......... W 49- 0 H .... 65,1011978 Nov. 4 .6- ......... W 13- 7 A .... c84,0841979 Oct. 13 .1- (SU-4:30) T 21-21 H .... 76,0671980 Nov. 8 .4- ......... W 34- 9 A .... c84,8921981 Oct. 17 .7- ......... W 25-17 H .... 76,2911982 Oct. 16 14- ......... W 41-21 A .... 75,1851983 Nov. 5 .............. W 30- 7 H .... 50,8671984 Nov. 3 18- ......... W 20-11 A .... 74,4321985 Oct. 19 .............. W 30- 6 H .... 56,8371986 Oct. 25 -19......... W 10- 0 A .... 73,5001987 Nov. 7 .............. W 39-24 H .... 58,9221988 Sept. 10 .6- ...(1:19) W 24-20 A .... 59,0001989 Oct. 28 10- ......... W 19- 0 H .... 67,4111990 Oct. 13 16- ......... W 37-22 A .... 62,0001991 Oct. 19 ........(1:11) L 21-24 H .... 61,2651992 Nov. 7 11-21......... L 9-23 A .... 72,5711993 Nov. 6 ................. W 45-20 H .... 59,3761994 Oct. 15 ................. W 27-20 A .... 60,3451995 Nov. 4 14- ...(0:39) W 31-30 H .... 62,3681996 Nov. 9 ..............(N) L 20-24 A .... 41,9801997 Nov. 8 ................ W 45-21 H .... 58,9001998 Nov. 7 ................ W 34- 9 A .... 43,2501999 Oct. 23 ................ L 31-35 H .... 57,4942000 Oct. 21 ........(0:00) L 30-32 A .... 50,1252001 Sept. 29 ................ L 16-21 H .... 53,9622002 Nov. 9 10- ......... W 49-17 A .... 44,9502003 Oct. 11 .9- .......(N) W 44-21 H .... 68,3412004 Sept. 25 .1- ...(6:15) W 31-28 A .... 55,7502005 Nov. 5 .1- .......(N) W 51-21 H .... c90,212
N1-Tournament Park, Pasadena, CaliforniaN2-Kezar Stadium, San Francisco, California
UCLA (41-27-7)
1929 Sept. 28 .............. W 76- 0 H .... 50,0001930 Sept. 27 .............. W 52- 0 A .... 40,0001936 Nov. 26Th .............. T 7- 7 H .... 90,0001937 Dec. 4 .............. W 19-13 A .... 75,0001938 Nov. 24Th 14- ......... W 42- 7 H .... 65,0001939 Dec. 9 .3- 9......... T 0- 0 A ... c103,3031940 Nov. 30 .............. W 28-12 H .... 70,0001941 Dec. 6 .............. T 7- 7 A .... 65,0001942 Dec. 12 -13......... L 7-14 H .... 90,0001943 Sept. 25 .............. W 20- 0 A .... 50,0001943 Nov. 27 .............. W 26-13 H .... 35,0001944 Sept. 23 .(TD-UCLA 0:00) T 13-13 H .... 60,0001944 Nov. 25 .8- ......... W 40-13 A .... 77,9031945 Sept. 21 ...........(N) W 13- 6 A .... 81,0001945 Dec. 1 16- ......... W 26-15 H .... c103,0001946 Nov. 23 10- 4......(R) L 6-13 A .... 93,7141947 Nov. 22 .4-18......... W 6- 0 H .... c102,0501948 Nov. 20 .............. W 20-13 A .... 76,5771949 Nov. 19 .............. W 21- 7 H .... 75,0261950 Nov. 25 .............. L 0-39 A .... 51,9061951 Nov. 24 11-18......... L 7-21 H .... 71,7381952 Nov. 22 .4- 3......... W 14-12 A .... 96,8691953 Nov. 21 .9- 5......... L 0-13 H .... 85,3661954 Nov. 20 .7- 2......... L 0-34 A .... c102,5481955 Nov. 19 - 5......... L 7-17 H .... 95,8781956 Nov. 24 .............. W 10- 7 A .... 63,7091957 Nov. 23 .............. L 9-20 H .... 64,8181958 Nov. 22 ..(SC-TD 6:50) T 15-15 A .... 58,5071959 Nov. 21 .4- (U)(8:06) L 3-10 H .... 85,9171960 Nov. 19 -11......(U) W 17- 6 A .... 66,8651961 Nov. 25 ...........(R) L 7-10 H .... 57,5801962 Nov. 24 .1- ......... W 14- 3 A .... 86,7401963 Nov. 30 .............. W 26- 6 H .... 82,4601964 Nov. 21 .............. W 34-13 A .... 62,1081965 Nov. 20 .6- 7...(2:39) L 16-20 H .... c94,0851966 Nov. 19 .7- 8...(6:20) L 7-14 A .... 81,9801967 Nov. 18 .4- 1..(10:38) W 21-20 H .... c90,7721968 Nov. 23 .1- ......... W 28-16 A .... 75,0661969 Nov. 22 .5- 6...(1:32) W 14-12 H .... c90,8141970 Nov. 21 ...........(N) L 20-45 A .... 78,7731971 Nov. 20 15- ......... T 7- 7 H .... 68,4261972 Nov. 18 .1-14......... W 24- 7 A .... 82,9291973 Nov. 24 .9- 8......... W 23-13 H .... 88,0371974 Nov. 23 .8- ......... W 34- 9 A .... 82,4671975 Nov. 28 -14......(N) L 22-25 H .... 80,927
1976 Nov. 20 .3- 2......... W 24-14 A .... c90,5191977 Nov. 25 -17(N)(0:02) W 29-27 H .... 86,1681978 Nov. 18 .5-14......... W 17-10 A .... c90,3871979 Nov. 24 .4- ......... W 49-14 H .... c88,2141980 Nov. 22 12-18...(2:07) L 17-20 A .... 83,4911981 Nov. 21 10-15...(2:14) W 22-21 H .... c89,4321982 Nov. 20 15-11......... L 19-20 A .... c95,7631983 Nov. 19 .............. L 17-27 H .... 83,7631984 Nov. 17 .7- ......... L 10-29 A .... 90,0961985 Nov. 23 - 8...(1:13) W 17-13 H .... c90,0641986 Nov. 22 10-18......... L 25-45 A .... c98,3701987 Nov. 21 - 5...(7:59) W 17-13 H .... c92,5161988 Nov. 19 .2- 6......... W 31-22 A .... c100,7411989 Nov. 18 .8- (UC-13:43) T 10-10 H .... c86,6721990 Nov. 17 19- ...(0:16) W 45-42 A .... c98,0881991 Nov. 23 -25......... L 21-24 H .... c84,6231992 Nov. 21 15- ......(U) L 37-38 A .... 80,5681993 Nov. 20 22-16....... L 21-27 H .... c93,4581994 Nov. 19 13- .......... L 19-31 A .... 91,8151995 Nov. 18 11- ......... L 20-24 H .... c91,3631996 Nov. 23 ....(UC-0:39) L 41-48(2OT) A ... 80,6441997 Nov. 22 - 7 ......... L 24-31 H .... c91,3501998 Nov. 21 - 3 ......... L 17-34 A .... c88,0801999 Nov. 20 ................ W 17-7 H .... 91,3842000 Nov. 18 ........(0:09) W 38-35 A .... c80,2272001 Nov. 17 -20............ W 27-0 H .... 88,5882002 Nov. 23 .7-25.......... W 52-21 A .... c91,0842003 Nov. 22 .2- ............. W 47-22 H .... c93,1722004 Dec. 4 .1- ............ W 29-24 A .... c88,4422005 Dec. 3 .1-11......... W 66-19 H .... c92,000
All games at the Los Angeles Memorial Coliseum, except Away games after 1981,which were played at the Rose Bowl, Pasadena, California
WASHINGTON (46-26-4)
1923 Oct. 20 .............. L 0-22 A .... 21,5001927 Dec. 3 .............. W 33-13 H .... 60,0001929 Oct. 12 .............. W 48- 0 A .... 23,5821930 Nov. 27Th .........(Mud) W 32- 0 H .... 45,0001931 Dec. 5 .............. W 44- 7 H .... 40,0001932 Nov. 24Th .........(Mud) W 9- 6 A .... 22,0611933 Dec. 9 .............. W 13- 7 H .... 45,0001934 Dec. 1 .............. L 7-14 H .... 35,0001935 Dec. 7 .............. L 2- 6 H .... 35,0001936 Nov. 14 15-10......... L 0-12 A .... 23,4541937 Oct. 2 .............. L 0- 7 H .... 70,0001938 Nov. 12 .9- ...(R)(U) L 6- 7 A .... 18,9391939 Dec. 2 .1- ...(1:15) W 9- 7 H .... 44,7601940 Nov. 16 -17......... L 0-14 A .... 27,0001941 Nov. 29 .....(R)(1:00) L 13-14 H .... 35,0001942 Oct. 3 .............. T 0- 0 A .... 26,0001943 Jan. 1* -12......(U) W 29- 0 N1.... 68,0001944 Oct. 23 15- ......(N) W 38- 7 H .... 62,8651945 Oct. 27 20- ...(8:00) L 7-13 A .... c40,0001946 Oct. 19 .............. W 28- 0 H .... 42,5071947 Nov. 1 .5- ......(R) W 19- 0 A .... 32,0001948 Nov. 13 .............. W 32- 7 H .... 44,3451949 Oct. 29 15- ......... W 40-28 A .... 33,2051950 Nov. 18 -19......(R) L 13-28 H .... 23,4421951 Oct. 6 -12...(5:54) W 20-13 A .... 43,7471952 Nov. 15 .5-17......(R) W 33- 0 H .... 35,8521953 Oct. 10 .7-(R)(SC-12:52) T 13-13 A .... 31,8161954 Nov. 13 .8- ......... W 41- 0 H .... 36,1081955 Oct. 8 10-18(R)(6:07) L 0- 7 A .... 35,9551956 Oct. 20 .9- ......... W 35- 7 H .... 44,7491957 Nov. 2 ........(6:30) W 19-12 A .... 30,1721958 Nov. 8 .............. W 21- 6 H .... 32,9871959 Oct. 17 .7-18...(6:34) W 22-15 A .... 54,4971960 Nov. 5 - 7......(R) L 0-34 H .... 43,4751961 Nov. 4 .............. T 0- 0 A .... 54,9161962 Nov. 3 .3- 9......... W 14- 0 H .... 46,4561963 Nov. 2 .........(Mud) L 7-22 A .... c55,7381964 Oct. 31 ........(4:49) L 13-14 H .... 50,5771965 Oct. 9 .8- ......... W 34- 0 A .... c57,5331966 Oct. 8 .6- (N)(14:36) W 17-14 H .... 55,9601967 Oct. 21 .1- ......... W 23- 6 A .... c58,7541968 Oct. 19 .1- ...(5:07) W 14- 7 H .... 60,9901969 Nov. 15 .6- ......... W 16- 7 A .... 51,4031970 Oct. 17 11- ......(N) W 28-25 H .... 56,1661971 Nov. 13 15-19...(2:08) W 13-12 A .... c59,9821972 Oct. 21 .1-18......... W 34- 7 H .... 59,1511973 Nov. 17 .9- ......... W 42-19 A .... 55,5001974 Nov. 16 .8- ......... W 42-11 H .... 51,1571975 Nov. 15 13- (R)(8:23) L 7- 8 A .... 53,7001976 Nov. 13 .3- ......... W 20- 3 H .... 49,2641977 Nov. 12 14- ......... L 10-28 A .... c59,5011978 Nov. 11 .5-19......(R) W 28-10 H .... 54,0711979 Nov. 10 .4-15..(11:50) W 24-17 A .... c60,527
USC VS. PAC-10
2006 FOOTBALL MEDIA GUIDE — PAGE 77
1980 Nov. 15 .2- ......(U) L 10-20 H .... 55,5151981 Nov. 14 .3- ......... L 3-13 A .... 47,3471983 Nov. 12 -18......... L 0-24 A .... c60,6901984 Nov. 10 12- 1......... W 16- 7 H .... 71,8381985 Nov. 16 ........(0:56) L 17-20 A .... c52,6011986 Sept. 27 12- 6......... W 20-10 H .... 58,0231987 Oct. 17 .............. W 37-23 A .... c71,6781988 Oct. 15 .3-16......... W 28-27 H .... 62,9741989 Oct. 7 .9- ......... W 24-16 H .... 58,4101990 Sept. 22 .5-21......... L 0-31 A .... c72,6171991 Nov. 9 - 2......... L 3-14 H .... 59,3201992 Oct. 3 20- 1......... L 10-17 A .... c73,2751993 Nov. 13 -25......... W 22-17 A .... c72,2021994 Sept. 3 13-23..(7:14) W 24-17 H .... 54,5381995 Oct. 28 13-17..(SC-0:33) T 21-21 A .... c74,4211996 Nov. 2 -21 .......... L 10-21 H .... 60,0391997 Nov. 1 - 7 .......... L 0-27 A .... 73,4011998 Nov. 31 ............... W 33-10 H .... 62,2762001 Oct. 6 -11.....(0:00) L 24-27 A .... c72,9462002 Oct. 19 19-22...... W 41-21 H .... 52,9612003 Oct. 25 .5- .......... W 43-23 A .... c72,0152004 Oct. 23 .1- .......... W 38- 0 H .... 72,8552005 Oct. 22 .1- .......... W 51-24 A .... 64,096
N1-Rose Bowl, Pasadena, California*-1944 Rose Bowl
WASHINGTON STATE (53-8-4)
1921 Dec. 3 .............. W 28- 7 N1.... 18,0001922 Nov. 30Th .............. W 41- 3 N2.... 11,0001925 Nov. 28 .....(U)(3:00) L 12-17 H .... 12,0001926 Oct. 9 .............. W 16- 7 H .... 34,7001927 Nov. 19 .............. W 27- 0 H .... 45,0001928 Nov. 17 .............. W 27-13 H .... 33,0001929 Nov. 30 .............. W 27- 7 H .... 55,0001930 Oct. 11 ...........(U) L 6- 7 A .... 22,0001931 Oct. 10 .............. W 38- 6 H .... 30,0001932 Oct. 1 .............. W 20- 0 H .... 55,0001933 Oct. 7 .............. W 33- 0 H .... 65,0001934 Oct. 6 .............. L 0-19 H .... 50,0001935 Nov. 16 .............. W 20-10 H .... 45,0001936 Oct. 17 .............. T 0- 0 H .... 25,0001937 Oct. 30 .........(Fog) T 0- 0 A .... 8,7001938 Oct. 15 .............. W 19- 6 H .... 35,0001939 Oct. 7 ...........(R) W 27- 0 H .... 38,0001940 Sept. 28 .....(WS-8:40) T 14-14 H .... 40,0001941 Oct. 18 .............. W 7- 6 H .... 40,0001942 Oct. 17 -10......... W 26-12 H .... 33,0001946 Sept. 27 .....(N)(0:05) W 13- 7 H .... 68,2821947 Sept. 27 .............. W 21- 0 H .... 48,1731949 Oct. 1 .............. W 35- 7 H .... 36,2431950 Oct. 7 .....(SC-1:20) T 20-20 A .... 16,0001951 Sept. 22 .............. W 31-21 H .... 28,8761952 Sept. 19 16- ......(N) W 35- 7 H .... 58,2881953 Sept. 19 .8- ......... W 29-13 A .... 19,0001954 Sept. 17 17- ......(N) W 39- 0 H .... 37,6451955 Sept. 17 13- ......... W 50-12 H .... 35,3841956 Nov. 3 20- ......... W 28-12 A .... 13,0001957 Oct. 26 .............. L 12-13 H .... 24,9021958 Oct. 25 ........(1:25) W 14- 6 N3.... 25,0001967 Sept. 15 .7- ......(N) W 49- 0 H .... 44,3641969 Nov. 8 .6- ......... W 28- 7 H .... 47,1581970 Nov. 7 .............. W 70-33 N3.... 14,5001971 Nov. 6 17- ......... W 30-20 H .... 57,4321972 Nov. 4 .1- ......... W 44- 3 N4.... 46,0001973 Oct. 13 .4- ......... W 46-35 H .... 50,9751974 Oct. 12 .7- ......(N) W 54- 7 N3.... 32,0001975 Oct. 11 .3- ......... W 28-10 H .... 47,4681976 Oct. 9 11- ......(N) W 23-14 N5.... 37,2681977 Sept. 30 .2- ......(N) W 41- 7 H .... 61,8091979 Oct. 6 .1- ......... W 50-21 H .... 55,1171981 Oct. 31 .4-14......... W 41-17 H .... 60,9721983 Oct. 8 .............. W 38-17 H .... 43,1061984 Oct. 6 .............. W 29-27 A .... 33,0001985 Nov. 2 .............. W 31-13 H .... 46,9541986 Oct. 11 .9- ......... L 14-34 A .... 26,0001987 Oct. 31 ...........(R) W 42- 7 H .... 24,8341989 Sept. 30 11-19...(0:04) W 18-17 A .... c38,4341990 Oct. 6 15- ......(N) W 30-17 H .... 59,3571991 Oct. 12 .............. W 34-27 A .... 23,9971992 Oct. 24 15-13......... W 31-21 H .... 54,0381993 Sept. 25 .............(N) W 34- 3 H .... 48,4711994 Nov. 5 22-16..(Cold) W 23-10 A .... 36,6861995 Oct. 14 .5- ......... W 26-14 H .... 51,1311996 Oct. 26 ..(Cold)(2:05)(N) W 29-24 A .... 33,1111997 Sept. 13 23- ...(4:18) L 21-28 H .... 51,6551998 Oct. 17 ......(Cold)(N) W 42-14 A .... 31,1781999 Nov. 13 ................ W 31-28 A .... 23,065
2000 Nov. 11 ................ L 27-33 H .... 40,5652002 Oct. 5 18-17 (WS-1:50) L 27-30(1OT) A ... c36,8612003 Nov. 1 .3- 6......... W 43-16 H .... 82,4782004 Oct. 30 .1- ..(Cold) W 42-12 A .... c35,1172005 Oct. 29 .1- ........... W 55-13 H .... c92,021
N1-Tournament Park, Pasadena, CaliforniaN2-Rose Bowl, Pasadena, CaliforniaN3-Spokane Memorial (Joe Albi) Stadium, Spokane, WashingtonN4-Husky Stadium, Seattle, WashingtonN5-Kingdome, Seattle, Washington
Non-Conference RecordThe information in this opponents’ year-by-year section is, reading from
left to right: (1) year; (2) date (with “Th” indicating a game played on ThanksgivingDay); (3) AP ranking going into the game, with USC’s given first, and USC’sopponent’s given second; (4) other miscellaneous information (“N” for nightgame if contest began after 5:00 p.m. local time, “U” for upset if the result wasconsidered a significant upset, time remaining in the game if a late score resultedin a win or tie, and weather conditions, with “R” indicating most of the game wasplayed in the rain and “Sn” indicating most of the game was played in snowconditions); (5) game result (W, L or T); (6) game score, with USC’s given first;(7) game site (home, away or neutral); and (8) attendance. It was compiled byMichael J. Glenn. USC appreciates his invaluable efforts.
NOTRE DAME (30-42-5)
1926 Dec. 4 ........(2:00) L 12-13 H .... c74,3781927 Nov. 26 .............. L 6- 7 N1... c120,0001928 Dec. 1 .............. W 27-14 H .... c72,6321929 Nov. 16 .............. L 12-13 N1... c112,9121930 Dec. 6 .............. L 0-27 H .... c73,9671931 Nov. 21 ........(1:00) W 16-14 A .... c50,7311932 Dec. 10 .............. W 13- 0 H .... c93,9241933 Nov. 25 .............. W 19- 0 A .... 25,0371934 Dec. 8 .............. L 0-14 H .... 45,5681935 Nov. 23 ........(Cold) L 13-20 A .... 38,3051936 Dec. 5 - 8......... T 13-13 H .... 71,2011937 Nov. 27 - 9...(1:45) L 6-13 A .... 28,9201938 Dec. 3 .8- 1......(U) W 13- 0 H .... c97,1461939 Nov. 25 .4- 7...(Cold) W 20-12 A .... c54,7991940 Dec. 7 .............. L 6-10 H .... 85,8081941 Nov. 22 - 4......... L 18-20 A .... c54,9671942 Nov. 28 14- 8......... L 0-13 H .... 94,5191946 Nov. 30 16- 2......... L 6-26 A .... c55,2981947 Dec. 6 .3- 1......... L 7-38 H .... c104,9531948 Dec. 4 - 2(ND-0:35) T 14-14 H .... c100,5711949 Nov. 26 17- 1...(Cold) L 0-32 A .... c57,2141950 Dec. 2 .............. W 9- 7 H .... 70,1771951 Dec. 1 20- (R)(6:00) L 12-19 H .... 55,7831952 Nov. 29 .2- 7(U)(Cold) L 0- 9 A .... c58,3941953 Nov. 28 20- 2......... L 14-48 H .... 97,9521954 Nov. 27 17- 4(R)(5:57) L 17-23 A .... c56,4381955 Nov. 26 - 5......(U) W 42-20 H .... 94,8921956 Dec. 1 17- ......... W 28-20 H .... 64,5381957 Nov. 30 -12.....(Sn) L 12-40 A .... 54,7931958 Nov. 29 -18......... L 13-20 H .... 66,9031959 Nov. 28 .7- (U)(Cold) L 6-16 A .... 48,6821960 Nov. 26 ........(U)(R) L 0-17 H .... 28,2971961 Oct. 14 - 8......(R) L 0-30 A .... 50,4271962 Dec. 1 .1- ......... W 25- 0 H .... 81,6761963 Oct. 12 .7- (U)(6:28) L 14-17 A .... c59,1351964 Nov. 28 - 1(U)(1:33) W 20-17 H .... 83,8401965 Oct. 23 .4- 7......(R) L 7-28 A .... c59,2351966 Nov. 26 10- 1......... L 0-51 H .... 88,5201967 Oct. 14 .1- 5......... W 24- 7 A .... c59,0751968 Nov. 30 .2- 9(SC-10:14) T 21-21 H .... 82,6591969 Oct. 18 .3-11(ND-6:51) T 14-14 A .... c59,0751970 Nov. 28 - 4...(R)(U) W 38-28 H .... 64,6941971 Oct. 23 - 6......(U) W 28-14 A .... c59,0751972 Dec. 2 .1-10......... W 45-23 H .... 75,2431973 Oct. 27 .6- 8......(R) L 14-23 A .... c59,0751974 Nov. 30 .6- 5......... W 55-24 H .... 83,5521975 Oct. 25 .3-14......... W 24-17 A .... c59,0751976 Nov. 27 .3-13......... W 17-13 H .... 76,5611977 Oct. 22 .5-11......... L 19-49 A .... c59,0751978 Nov. 25 .3- 8...(0:02) W 27-25 H .... 84,2561979 Oct. 20 .4- 9......... W 42-23 A .... c59,0751980 Dec. 6 17- 2......... W 20- 3 H .... 82,6631981 Oct. 24 .5- ...(4:52) W 14- 7 A .... c59,0751982 Nov. 27 17- ...(0:48) W 17-13 H .... 76,4591983 Oct. 22 .............. L 6-27 A .... c59,0751984 Nov. 24 14- ......(R) L 7-19 H .... 66,3421985 Oct. 26 .............. L 3-37 A .... c59,0751986 Nov. 29 17- ...(0:00) L 37-38 H .... 70,6141987 Oct. 24 -10......... L 15-26 A .... c59,075
USC VS. PAC-10, NON-CONFERENCE RECORD

PAGE 78 — UNIVERSITY OF SOUTHERN CALIFORNIA
1988 Nov. 26 .2- 1......... L 10-27 H .... c93,8291989 Oct. 21 .9- 1...(5:18) L 24-28 A .... c59,0751990 Nov. 24 18- 7......(N) L 6-10 H .... c91,6391991 Oct. 26 - 5......... L 20-24 A .... c59,0751992 Nov. 28 19- 5......(N) L 23-31 H .... c90,0631993 Oct. 23 - 2......... L 13-31 A .... c59,0751994 Nov. 26 17- (N)(Cold)(SC4:53) T 17-17 H .... c90,2171995 Oct. 21 .5-17......(R) L 10-38 A .... c59,0751996 Nov. 30 -10 (N)(U)(SC-1:50) W 27-20(1OT) H .... c90,2961997 Oct. 18 ...........(1:05) W 20-17 A .... c80,2251998 Nov. 28 - 9........(N) W 10- 0 H .... 90,0961999 Oct. 16 ......(R)(2:40) L 24-25 A .... c80,0122000 Nov. 25 -11............. L 21-38 H .... 81,3422001 Oct. 20 ................... L 16-27 A .... c80,7952002 Nov. 30 .6- 7........(N) W 44-13 H .... c91,4322003 Oct. 18 .5- ............. W 45-14 A .... c80,7952004 Nov. 27 .1- .....(N)(R) W 41-10 H .... c92,6112005 Oct. 15 .1- 9 ..(0:03) W 34-31 A .... c80,795
N1-Soldier Field, Chicago, Illinois
INDEPENDENTS/INACTIVES/OTHERS (21-5-0)(not including Notre Dame or Southland teams)
ARMY (2-0-0)
1951 Nov. 3 .7- ...(Cold) W 28- 6 N1.... 16,5081952 Oct. 4 .7- ......... W 22- 0 H .... 48,433
N1-Yankee Stadium, New York, New York
CARNEGIE TECH (1-0-0)
1929 Dec. 14 .............. W 45-13 H .... 65,000
DENVER (1-0-0)
1930 Nov. 1 .............. W 33-13 H .... 18,000
NAVY (2-1-0)
1949 Sept. 24 .............. W 42-20 H .... 62,7871950 Oct. 21 .............. L 14-27 N1.... 24,3001962 Nov. 17 .2- ......... W 13- 6 H .... 51,701
N1-Memorial Stadium, Baltimore, Maryland
PACIFIC (6-0-0)
1934 Sept. 29 .............. W 6- 0 H .... 35,0001935 Oct. 5 .............. W 19- 7 H .... 35,0001937 Sept. 25 .............. W 40- 0 H .... 35,0001943 Oct. 23 .7- 6......... W 6- 0 H .... 65,0001944 Sept. 30 .............. W 18- 6 H .... 30,0001945 Oct. 20 14- ......... W 52- 0 H .... 10,000
ST. MARY’S (5-4-0)
1915 Oct. 16 .............. W 47- 3 H ....1917 Oct. 27 ........(5:00) L 0- 7 H ....1924 Nov. 8 ...........(U) L 10-14 H .... 35,0001925 Dec. 12 .............. W 12- 0 H .... 25,0001928 Oct. 13 .............. W 19- 6 H .... 40,0001931 Sept. 26 ...........(U) L 7-13 H .... 70,0001933 Oct. 14 .............. W 14- 7 H .... 85,0001944 Oct. 28 .............. W 34- 7 H .... 20,0001945 Nov. 3 - 8......... L 0-26 H .... 76,378
SAN FRANCISCO (1-0-0)
1943 Oct. 16 .8- ......... W 34- 0 A .... 6,000
SANTA CLARA (3-0-0)
1925 Nov. 7 .............. W 29- 9 H .... 25,0001926 Oct. 2 .............. W 42- 0 H .... 27,4001927 Oct. 1 .............. W 52-12 H .... 35,000
(NOTE: Carnegie Tech merged with the Mellon Institute of Research in 1967 andis now known as Carnegie Mellon. The Pittsburgh, Penn., school plays DivisionIII football in the University Athletic Association. The University of Denverdiscontinued football in 1961. The University of Pacific in Stockton, Calif., droppedfootball in December of 1995. St. Mary's in Moraga, Calif., plays football as aDivision I-AA independent. The University of San Francisco dropped football from1952 through 1958, and then permanently discontinued the sport after 1971. TheUniversity of Santa Clara dropped football in 1994. Army was an independentuntil it joined Conference USA in 1999, then went back to independent status in2005.)
ATLANTIC COAST (10-6-0)
BOSTON COLLEGE (2-0-0)
1987 Sept. 19 .............. W 23-17 H .... 46,2051988 Sept. 1 .8- ......(N) W 34- 7 A .... c32,000
CLEMSON (1-0-0)
1966 Oct. 22 .5- ......... W 30- 0 H .... 44,614
DUKE (3-0-0)
1938 Jan. 2* .7- 3...(0:40) W 7- 3 N1.... c89,4521962 Sept. 22 - 8......(U) W 14- 7 H .... 26,4001975 Sept. 12 .4- ......(N) W 35- 7 H .... 56,727
N1-Rose Bowl, Pasadena, California*-1939 Rose Bowl
FLORIDA STATE (0-2-0)
1997 Sept. 6 23- 3(N)(10:40) L 7-14 H .... 72,7831998 Sept. 26 17-10......... L 10-30 A .... 79,815
GEORGIA TECH (2-1-0)
1961 Sept. 22 ...........(N) L 7-27 H .... 36,9501969 Oct. 25 .7- ......... W 29-18 H .... 53,3411973 Sept. 22 .1- ......... W 23- 6 A .... 58,228
MIAMI (1-1-0)
1966 Oct. 28 .5- (N)(14:56) L 7-10 A .... 51,1561968 Oct. 5 .2-13......(N) W 28- 3 H .... 71,189
NORTH CAROLINA (0-2-0)
1958 Oct. 3 ...........(N) L 7- 8 H .... 43,2381993 Aug. 29* 19-20..(N) L 9-31 N1.... 49,309
N1-Anaheim Stadium, Anaheim, California*-Disneyland Pigskin Classic
VIRGINIA TECH (1-0-0)
2004 Aug. 28* .1- ......(N) W 24-13 N1.... c91,665
N1-FedEx Field, Landover, Maryland*-Black Coaches Association Football Classic
(NOTE: Duke, the Southern Conference champion when it played USC in the1939 Rose Bowl, was a charter member of the Atlantic Coast Conference in 1953.Georgia Tech, a 1921 charter member of the Southern Conference, left to becomea charter member of the Southeastern Conference in 1933, withdrew from the SECin 1964, and joined the ACC in 1978. Florida State withdrew from the SouthernIndependent Conference to join the ACC in 1991. Miami, originally an independent,became a charter member of the Big East Conference in 1991 before joining theACC in 2004. Virginia Tech joined the ACC in 2004 from the Big East, where itwas a charter member in 1991, and played its first game as an ACC memberagainst USC. Boston College, an independent prior to becoming a chartermember of the Big East Conference in 1991, joined the ACC in 2005.)
BIG EAST (9-4-0)
PITTSBURGH (6-4-0)
1929 Jan. 1* .............. W 47-14 N1.... c72,0001932 Jan. 2+ .............. W 35- 0 N1.... 78,8741934 Oct. 13 .............. L 6-20 A .... 55,0001935 Dec. 14 .............. L 7-12 H .... 35,0001954 Sept. 24 15- ......(N) W 27- 7 H .... 50,2531957 Oct. 4 ...........(N) L 14-20 H .... 43,4891959 Sept. 25 11- ......(N) W 23- 0 H .... 34,1721961 Nov. 18 .............. L 9-10 A .... 34,8201965 Nov. 13 .6- ......... W 28- 0 H .... 40,3391974 Sept. 28 18- 8......... W 16- 7 A .... 52,934
N1-Rose Bowl, Pasadena, California*-1930 Rose Bowl+-1933 Rose Bowl
SYRACUSE (2-0-0)
1924 Dec. 6 .............. W 16- 0 H .... 45,0001990 Aug. 31* .9- ......(N) W 34-16 N1.... 57,293
N1-Giants Stadium, East Rutherford, New Jersey*-Kickoff Classic VIII
NON-CONFERENCE RECORD
2006 FOOTBALL MEDIA GUIDE — PAGE 79
WEST VIRGINIA (1-0-0)
1959 Nov. 7 .6- ......... W 36- 0 H .... 34,066
(NOTE: Pittsburgh, Syracuse, and West Virginia were all independents prior tobecoming charter members of the Big East Conference in 1991.)
BIG SKY (5-0-0)
MONTANA (5-0-0)
1925 Nov. 14 .............. W 27- 7 H .... 25,0001926 Nov. 25Th .............. W 61- 0 H .... 18,6001931 Nov. 14 .............. W 69- 0 H .... 25,0001935 Sept. 28 .............. W 9- 0 H .... 25,0001942 Dec. 5 .............. W 38- 0 H .... 25,000
(NOTE: Montana, a 1963 charter member of the Division I-AA Big SkyConference, was a member of the Pacific Coast Conference from 1924 until1950.)
BIG TEN (63-27-2)
ILLINOIS (10-2-0)
1935 Oct. 12 .............. L 0-19 H .... 60,0001936 Oct. 10 ...........(R) W 24- 6 A .... 40,0001939 Oct. 14 .............. W 26- 0 H .... 60,0001940 Oct. 12 .............. W 13- 7 A .... 30,1251961 Oct. 28 .............. W 14-10 H .... 28,6941962 Oct. 27 .4- ......... W 28-16 A .... 31,3751971 Sept. 25 16- ......(N) W 28- 0 H .... 49,3901972 Sept. 23 .1- ......... W 55-20 A .... 61,2771985 Sept. 7 .6-11......... W 20-10 A .... c76,3691986 Sept. 13 .............. W 31-16 H .... 51,4961989 Sept. 4 .5-22(N)(2:19) L 13-14 H .... 54,6221996 Sept. 7 19- .......... W 55- 3 A .... 56,504
INDIANA (4-0-0)
1953 Oct. 2 .7- ......(N) W 27-14 H .... 49,5781967 Jan. 1* .1- 4......... W 14- 3 N1... c102,9461981 Sept. 19 .2- ......... W 21- 0 A .... 51,1671982 Sept. 18 19- ......... W 28- 7 H .... 50,724
N1-Rose Bowl, Pasadena, California*-1968 Rose Bowl
IOWA (7-2-0)
1925 Nov. 21 .............. W 18- 0 H .... 66,0001950 Sept. 29 12-(N)(U)(10:00) L 14-20 H .... 45,1671961 Oct. 7 - 1......... L 34-35 H .... 30,2631962 Oct. 6 .6- ......... W 7- 0 A .... 55,3001970 Sept. 26 .7- ......... W 48- 0 A .... 56,1311974 Oct. 5 .9- ......... W 41- 3 H .... 52,0951975 Oct. 4 .3- ......... W 27-16 A .... 54,6001976 Oct. 2 13- ......(N) W 55- 0 H .... 55,5182002 Jan. 2* .5- 3......(N) W 38-17 N1.... c75,971
N1- Pro Player Stadium, Miami, Florida*-2003 Orange Bowl
MICHIGAN (5-4-0)
1947 Jan. 1* .8- 2......... L 0-49 N1.... c93,0001957 Sept. 28 -10......... L 6-16 H .... 44,7391958 Sept. 27 .............. L 19-20 A .... 77,0051969 Jan. 1* .5- 7......... W 10- 3 N1... c103,8781976 Jan. 1* .3- 2......... W 14- 6 N1... c106,1821978 Jan. 1* .3- 5......... W 17-10 N1... c105,6291988 Jan. 1* .5-11......... L 14-22 N1... c101,6881989 Jan. 1* 12- 3...(1:10) W 17-10 N1... c103,4502003 Jan. 1* .1- 4......... W 28-14 N1... c93,849
N1-Rose Bowl, Pasadena, California*-Rose Bowl of the following calendar year
MICHIGAN STATE (4-4-0)
1963 Oct. 4 .8- (N)(8:03) W 13-10 H .... 59,1371964 Oct. 3 .2- ......... L 7-17 A .... 70,1021967 Sept. 30 .2- ......... W 21-17 A .... c75,2871972 Sept. 30 .1- ......(N) W 51- 6 H .... 63,9341978 Sept. 29 .3- ......(N) W 30- 9 H .... 65,3191987 Sept. 7 19-17......(N) L 13-27 A .... c77,9221987 Jan. 1* 16- 8...(4:14) L 17-20 N1... c103,8471990 Dec. 31+ 21-22......... L 16-17 N2.... 50,562
N1-Rose Bowl, Pasadena, CaliforniaN2-Sun Bowl, El Paso, Texas*-1988 Rose Bowl+-1990 John Hancock Bowl
MINNESOTA (4-1-1)
1953 Sept. 26 .8- ......... W 17- 7 H .... 66,6981955 Oct. 29 10- .....(Sn) L 19-25 A .... c64,5921965 Sept. 17 .7-(N)(SC-6:24) T 20-20 H .... 58,4971968 Sept. 21 .2-16......(R) W 29-20 A .... c60,8201979 Sept. 22 .1- ......... W 48-14 H .... 61,7661980 Sept. 27 .5- ......... W 24- 7 A .... c55,115
NORTHWESTERN (5-0-0)
1952 Sept. 26 16- ......(N) W 31- 0 H .... 59,7561954 Oct. 2 .9............ W 12- 7 A .... 30,7251968 Sept. 28 .3- ......... W 24- 7 A .... 47,2771969 Sept. 27 .5- ......(N) W 48- 6 H .... 56,5891995 Jan. 1* 17- 3....... W 41-32 N1.... c100,102
N1-Rose Bowl, Pasadena, California*1996 Rose Bowl
OHIO STATE (11-9-1)
1937 Oct. 9 ........(9:00) W 13-12 H .... 65,0001938 Oct. 8 .............. W 14- 7 A .... 62,7781941 Oct. 4 .............. L 0-33 H .... 65,0001942 Oct. 10 - 1......... L 12-28 A .... 56,4361946 Oct. 5 .............. L 0-21 H .... 80,0471947 Oct. 11 20- ......... W 32- 0 A .... 76,5591948 Oct. 2 .............. L 0-20 A .... 75,1021949 Oct. 8 .8-11......... T 13-13 H .... 62,8771954 Jan. 1* 17- 1......(R) L 7-20 N1.... 89,1911959 Oct. 2 11-14......(N) W 17- 0 H .... 49,5921960 Oct. 1 - 9......... L 0-20 A .... c83,2041963 Oct. 19 - 4......... W 32- 3 H .... 61,8831964 Oct. 17 - 2......... L 0-17 A .... c84,3151968 Jan. 1* .2- 1......... L 16-27 N1... c102,0631972 Jan. 1* .1- 3......... W 42-17 N1... c106,8691973 Jan. 1* .7- 4......... L 21-42 N1... c105,2671974 Jan. 1* .5- 3...(2:03) W 18-17 N1... c106,7211979 Jan. 1* .3- 1...(1:32) W 17-16 N1... c105,5261984 Jan. 1* 18- 6......... W 20-17 N1... c102,5941989 Sept. 23 12-20......... W 42- 3 H .... 69,8761990 Sept. 29 18-12......(R) W 35-26 A .... c89,422
N1-Rose Bowl, Pasadena, California*-Rose Bowl of the following calendar year
PENN STATE (4-4-0)
1922 Jan. 1* .............. W 14- 3 N1.... 43,0001981 Jan. 1+ .8- 7......... L 10-26 N2.... c71,0531990 Sept. 15 .6- ......... W 19-14 H .... 70,5941991 Sept. 14 - 5...(N)(U) W 21-10 H .... 64,7581993 Sept. 11 -15........ L 20-21 A .... c95,9921994 Sept. 10 24- 8....... L 14-38 A .... c96,4631996 Aug. 25= .7-11....... L 7-24 N3... c77,7162000 Aug. 27% 15-22...... W 29- 5 N3... c78,902
N1-Rose Bowl, Pasadena, CaliforniaN2-Sun Devil Stadium, Tempe, ArizonaN3-Giants Stadium, East Rutherford, New Jersey*-1923 Rose Bowl+-1982 Fiesta Bowl=-Kickoff Classic XIV%-Kickoff Classic XVIII
PURDUE (3-1-0)
1966 Jan. 1* - 7......... L 13-14 N1... c100,8071975 Sept. 27 .3- ......... W 19- 6 H .... 56,1701976 Sept. 25 19- ......... W 31-13 A .... 65,4251998 Aug. 30 ................ W 27-17+ H .... 56,623
N1-Rose Bowl, Pasadena, California*-1967 Rose Bowl+-Pigskin Classic IX
NON-CONFERENCE RECORD
PAGE 80 — UNIVERSITY OF SOUTHERN CALIFORNIA
WISCONSIN (6-0-0)
1952 Jan. 1* .5-11......... W 7- 0 N1... c101,5001955 Oct. 14 16- 6......(N) W 33-21 H .... 75,1141956 Oct. 6 10- ......... W 13- 6 A .... 52,9441962 Jan. 1+ .1- 2......... W 42-37 N1.... c98,6981965 Sept. 25 .............. W 26- 6 A .... 52,7061966 Sept. 24 .5- ......(N) W 38- 3 H .... 52,325
N1-Rose Bowl, Pasadena, California*-1953 Rose Bowl+-1963 Rose Bowl
(NOTE: Penn State was an independent until it joined the Big Ten in 1993.)
BIG 12 (27-9-2)
BAYLOR (3-2-0)
1959 Nov. 14 .4- ......... W 17- 8 H .... 43,8321960 Nov. 12 ...........(R) L 14-35 A .... 23,0001985 Sept. 21 .3- ......(N) L 13-20 H .... 53,2461986 Sept. 20 - 9...(0:00) W 17-14 A .... 35,0001994 Sept. 24 19- .......(N) W 37-27 H .... 45,762
COLORADO (5-0-0)
1927 Nov. 12 .............. W 46- 7 H .... 25,0001963 Sept. 21 .1- ......(R) W 14- 0 A .... 27,0001964 Sept. 18 ...........(N) W 21- 0 H .... 39,1732000 Sept. 9 11- ..(N)(0:13) W 17-14 H .... 65,1532002 Sept. 14 17-18...... W 40-3 A .... c53,119
KANSAS (0-1-0)
1983 Sept. 24 10- ......(U) L 20-26 H .... 49,255
KANSAS STATE (0-2-0)
2001 Sept. 8 -12............ L 6-10 H .... 69,9592002 Sept. 21 11-25.....(N) L 20-27 A ... 49,276
MISSOURI (2-1-0)
1924 Dec. 25* .............. W 20- 7 H .... 47,0001976 Sept. 11 .8- ......(N) L 25-46 H .... 49,5351977 Sept. 10 .4- ......... W 27-10 A .... c65,298
*-1924 Christmas Festival
NEBRASKA (1-0-1)
1969 Sept. 20 .5- .......... W 31-21 A .... c67,0581970 Sept. 19 .3- 9(N)(SC-6:44) T21-21 H .... 73,768
OKLAHOMA (6-2-1)
1963 Sept. 28 .1- 3......... L 12-17 H .... 39,3451964 Sept. 26 - 2......... W 40-14 A .... 61,7001971 Oct. 2 17- 8......... L 20-33 A .... 61,8261973 Sept. 29 .1- 8......(N) T 7- 7 H .... 84,0161981 Sept. 26 .1- 2...(0:02) W 28-24 H .... 85,6511982 Sept. 25 18- ......... W 12- 0 A .... c75,0081988 Sept. 24 .4- 3......... W 23- 7 H .... 86,1241992 Sept. 19 -13......(U) W 20-10 A .... c70,2152004 Jan. 4* .1- 2......(N)) W 55-19 N1.... c77,912
N1-Pro Player Stadium, Miami, Florida*-2005 Orange Bowl, BCS Championship Game
TEXAS (4-1-0)
1955 Sept. 30 .9- ......(N) W 19- 7 H .... 62,0331956 Sept. 22 15- ......(N) W 44-20 A .... 47,0001966 Sept. 17 .9- ......... W 10- 6 A .... 42,0001967 Sept. 23 .4- 5......(N) W 17-13 H .... 67,7052005 Jan. 4* .1- 2 (0:19)(N) L 38-41 N1.... c93,986
N1-Rose Bowl, Pasadena, California*-2006 Rose Bowl, BCS Championship Game
TEXAS A&M (3-0-0)
1964 Oct. 10 ...........(N) W 31- 7 H .... 42,2951975 Dec. 22* - 2......(N) W 20- 0 N1.... 52,1291977 Dec. 31+ 20-17......(N) W 47-28 N2.... c52,842
N1-Liberty Bowl Memorial Stadium, Memphis, TennesseeN2-Astrodome, Houston, Texas*-1975 Liberty Bowl+-1977 Bluebonnet Bowl
TEXAS TECH (3-0-0)
1978 Sept. 9 .9- ......... W 17- 9 H .... 50,3211979 Sept. 8 .1- ......(N) W 21- 7 A .... c52,9911994 Jan. 2* 21- ......... W 55-14 N1.... c70,218
N1-Cotton Bowl, Dallas, Texas*-1995 Cotton Bowl
(NOTE: Kansas, Missouri and Nebraska were 1907 charter members of theMissouri Valley Intercollegiate Athletic Association (MVIAA). In 1928, these 3schools, along with Oklahoma, which had joined the MVIAA in1920, becamecharter members of the Big Six, which became the Big Seven when Coloradojoined in 1948, the Big Eight in 1958, and the Big 12 in 1996. Colorado was amember of the Rocky Mountain Faculty Athletic Conference from 1910 to 1936,and the Mountain States Conference (Skyline) from 1937 to 1947. Baylor, Texasand Texas A&M, which joined the Big 12 in 1996, were charter members in 1914,along with Oklahoma, in the Southwest Athletic Conference (later known as theSouthwest Conference). Texas Tech, a member of the Southwest Conferencebeginning in 1960, also joined the Big 12 in 1996.)
CONFERENCE USA (9-2-1)
HOUSTON (3-0-0)
1993 Sept. 4 .............. W 49- 7 H .... 49,4381995 Sept. 16 .6- ....(N) W 45-10 H .... 50,2791996 Sept. 21 15- ........ W 26- 9 A ... 21,035
MEMPHIS STATE (0-1-0)
1991 Sept. 2 16- ......(U) L 10-24 H .... 55,637
RICE (2-0-1)
1947 Oct. 4 .....(SC-2:10) T 7- 7 H .... 64,2311948 Oct. 9 .............. W 7- 0 H .... 49,5311971 Sept. 18 17- ......(N) W 24- 0 A .... 22,000
SMU (2-0-0)
1961 Sept. 29 ...........(N) W 21-16 H .... 29,1481962 Sept. 29 .9- ......(N) W 33- 3 A .... 14,000
TULANE (2-1-0)
1931 Jan. 1* ............... W 21-12 N1.... c75,5621942 Sept. 26 ............... L 13-27 H .... 45,0001946 Dec. 21 ............... W 20-13 A .... 25,000
N1-Rose Bowl, Pasadena, California*-1932 Rose Bowl
(NOTE: Conference USA began football play in 1996, with Houston, Memphisand Tulane among its charter members. Houston was a Southwest Conferencemember from 1976 to 1995. Memphis, known as Memphis State prior to 1994,was, in football, a Division I-A independent. Tulane joined the SouthernConference in 1922, but withdrew to become a charter member of the SoutheasternConference, from which it withdrew in 1966, maintaining independent status until1995. Rice was a 1914 charter member of the Southwest Conference and SMUjoined the SWC in 1918, then both joined the Western Athletic Conference in 1996before becoming CUSA members in 2005.)
MOUNTAIN WEST (15-6-1)
BYU (2-0-0)
2003 Sept. 6 .4- ......... W 35-18 H .... 75,3152004 Sept. 18 .1- .....(N) W 42-10 A .... 63,467
COLORADO STATE (1-0-0)
2004 Sept. 11 .1- .....(N) W 49-0 H .... 85,521
NON-CONFERENCE RECORD

2006 FOOTBALL MEDIA GUIDE — PAGE 81
SAN DIEGO STATE (2-0-1)
1992 Sept. 5* .....(SC-5:45) T 31-31 A .... 52,1681998 Sept. 12 22- ......(N) W 35-6 H .... 49,9271999 Sept. 18 17- ....... W 24-21 H .... 53,966
*-Ralphs Holiday Classic
TEXAS CHRISTIAN (2-3-0)
1951 Oct. 27 .6- ......... W 28-26 H .... 50,7321954 Oct. 8 .9- ...(N)(U) L 7-20 H .... 52,7051960 Sept. 24 ...........(N) L 6- 7 H .... 31,4751977 Sept. 24 .2- ......... W 51- 0 H .... 54,6201998 Dec. 31* ...........(U) L 19-28 N1.... 46,612
N1-Sun Bowl, El Paso, Texas*1998 Sun Bowl
UNLV (1-0-0)
1997 Oct. 4 ..........(N) W 35-21 H .... 48,404
UTAH (6-3-0)
1915 Nov. 20 .............. L 13-20 A ....1916 Oct. 21 .............. L 12-27 H .... 2,0001917 Nov. 17 .............. W 51- 0 A ....1919 Nov. 15 .............. W 28- 7 H ....1925 Oct. 10 .............. W 28- 2 H .... 18,0001932 Sept. 24 .............. W 35- 0 H .... 35,0001948 Sept. 17 ...........(N) W 27- 0 H .... 55,2111993 Dec. 30* ...........(N) W 28-21 N1.... 37,2032001 Dec. 25+ .............. L 6-10 N2.... 22,385
N1-Anaheim Stadium, Anaheim, CaliforniaN2-Sam Boyd Stadium, Las Vegas, Nevada*-1993 Freedom Bowl+-2001 Las Vegas Bowl
WYOMING (1-0-0)
1965 Nov. 27 .8- ......... W 56- 6 H .... 39,233
(NOTE: BYU, Colorado State, San Diego State, Utah, UNLV and Wyoming are1999 charter members of the Mountain West Conference. BYU, Utah andWyoming were 1962 members of the Western Athletic Conference, whileColorado State joined the WAC in 1968. San Diego State had been a 1969 chartermember of the Pacific Coast Athletic Association (Big West Conference) until itswithdrawal to join the WAC in 1978. UNLV, which joined the PCAA in 1982, joinedthe WAC in 1996. Rice was a 1914 charter member of the Southwest Conference,SMU joined the conference in 1918, and Texas Christian joined the SouthwestConference in 1922 and then became a member of the WAC in 1996 beforejoining the Mountain West in 2005.)
SOUTHEASTERN (16-10-1)
ALABAMA (2-5-0)
1938 Sept. 24 .............. L 7-19 H .... 70,0001945 Jan. 1* 11- 2......... L 14-34 N1.... c93,0001970 Sept. 12 .3-16......(N) W 42-21 N2.... c72,1751971 Sept. 10 .5-16......(N) L 10-17 H .... 67,7811977 Oct. 8 .1- 7......... L 20-21 H .... 63,1401978 Sept. 23 .7- 1......... W 24-14 N2.... c77,3131985 Dec. 28+ -15......... L 3-24 N3.... 35,183
N1-Rose Bowl, Pasadena, CaliforniaN2-Legion Stadium, Birmingham, AlabamaN3-Aloha Stadium, Honolulu, Hawaii*-1946 Rose Bowl+-1985 Aloha Bowl
ARKANSAS (3-1-0)
1972 Sept. 9 .8- 4......(N) W 31-10 N1.... c54,4611973 Sept. 15 .1- ......(N) W 17- 0 H .... 73,2311974 Sept. 14 .5-20......(N) L 7-22 N1.... c54,6222005 Sept. 17 .1- .........(N) W 70-17 H .... 90,411
N1-War Memorial Stadium, Little Rock, Arkansas
AUBURN (2-1-0)
1986 Jan. 1* -10......... L 7-16 N1.... c51,1132002 Sept. 2 18- ..(N)(1:26) W 24-17 H .... 63,2692003 Aug. 30 .8- 6.....(N) W 23-0 A .... c86,063
N1-Orlando Stadium, Orlando, Florida*-1987 Citrus Bowl
FLORIDA (0-1-1)
1982 Sept. 11 10-11......(N) L 9-17 A .... c73,2381983 Sept. 10 .9-18(SC-0:00) T 19-19 H .... 53,948
GEORGIA (3-0-0)
1931 Dec. 12 .............. W 60- 0 H .... 75,0001933 Dec. 2 .............. W 31- 0 H .... 45,0001960 Oct. 7 ...........(N) W 10- 3 H .... 28,120
LSU (1-1-0)
1979 Sept. 29 .1-20(N)(0:32) W 17-12 A .... c78,3221984 Sept. 29 15- ......... L 3-23 H .... 60,128
SOUTH CAROLINA (1-1-0)
1980 Sept. 20 .4-20......(N) W 23-13 H .... 58,3851983 Oct. 1 ...........(N) L 14-38 A .... c74,200
TENNESSEE (4-0-0)
1939 Jan. 1* .3- 2......... W 14- 0 N1.... c92,2001944 Jan. 1+ .7-12......... W 25- 0 N1.... c91,0001980 Sept. 13 .5- (N)(0:00) W 20-17 A .... c95,0491981 Sept. 12 .5- ......(N) W 43- 7 H .... 62,147
N1-Rose Bowl, Pasadena, California*-1940 Rose Bowl+-1945 Rose Bowl
(NOTE: Alabama, Auburn, Georgia and Tennessee, 1921 charter members of theSouthern Conference, and Florida and LSU, 1922 members of the SouthernConference, all withdrew in 1933 to become charter members of the SoutheasternConference. South Carolina, a 1922 member of the Southern Conference,withdrew in 1953 to become a charter member of the Atlantic Coast Conference,from which it withdrew in 1971. It joined the Southeastern Conference in 1992.Arkansas, a charter member of the Southwest Athletic (Southwest) Conference,withdrew from that conference in 1992 to join the Southeastern Conference.)
SOUTHLAND TEAMS (63-15-8)
CAL POLY SLO (1-0-0)
1909 Oct. 9 .............. W 51- 0 A ....
CAL TECH (11-1-1)
1893 Nov. 18 .............. W 22-12 A ....1893 Dec. 22 ...........(R) W 14- 4 H .... 1001894 .............. W 12- 0 H ....1895 Dec. 7 .............. T 4- 4 H ....1896 Nov. 14 .............. L 0-22 N1....1903 Oct. 10 .............. W 5- 0 H .... 5001904 Oct. 22 .............. W 35- 0 H .... 2001920 Oct. 9 .............. W 46- 7 H .... 5,0001921 Oct. 8 .............. W 70- 0 H ....1923 Sept. 29 .............. W 18- 7 H .... 10,0001924 Sept. 27 .............. W 78- 6 H .... 12,0001925 Sept. 26 .............. W 32- 0 H .... 25,0001927 Oct. 22 .............. W 51- 0 H .... 25,000
N1-Athletic Park, Los Angeles
CHAFFEY COLLEGE (1-1-0)
1893 Dec. 11 .............. L 6-32 A ....1897 Nov. 13 .............. W 38- 0 N1... 200
N1-Fiesta Park, Los Angeles
LOYOLA (6-3-1)
1889 .............. W 40- 0 H ....1892 Feb. 22 .............. L 2-10 H ....1897 .............. W 34- 0 H ....1902 Oct. 11 .............. L 5- 6 N1.... 4001903 Oct. 31 .............. W 12- 5 H ....1904 Nov. 5 .............. W frft. H ....1905 Dec. 2 .............. T 0- 0 H ....1909 Oct. 23 ........(3:00) L 6- 8 H .... 1,2001932 Oct. 15 ........(5:00) W 6- 0 H .... 50,0001933 Sept. 30 .............. W 18- 0 H .... 65,000
N1-Fiesta Park, Los Angeles
NON-CONFERENCE RECORD
PAGE 82 — UNIVERSITY OF SOUTHERN CALIFORNIA
WESTERN ATHLETIC (27-1-0)
FRESNO STATE (1-1-0)
1992 Dec. 29* 23- ...(N)(U) L 7-24 N1.... 58,5462005 Nov. 19 -1-16 (6:22)(N) W 50-42 H .... c90,007
N1-Anaheim Stadium, Anaheim, California*-1992 Freedom Bowl
HAWAII (6-0-0)
1930 Nov. 15 .............. W 52- 0 H .... 17,5001935 Jan. 1* .............. W 38- 6 A .... 12,0001978 Dec. 2 .3- ......(N) W 21- 5 A .... c48,7671999 Sept. 4 21- ......(N) W 62- 7 A .... c50,0002003 Sept. 13 .4- ......... W 61-32 H .... 73,6542005 Sept. 3 .1-.......... W 63-17 A .... c50,000
*-Game played January 1, 1936
IDAHO (7-0-0)
1922 Nov. 18 .............. W 14- 0 N1.... 12,5001923 Nov. 24 .............. W 9- 0 H .... 30,0001924 Nov. 22 .............. W 13- 0 H .... 45,0001925 Oct. 30 .............. W 51- 7 A .... 5,0001926 Nov. 20 .............. W 28- 6 H .... 17,4001928 Nov. 24 .............. W 28- 7 H .... 10,0001929 Nov. 23 .............. W 72- 0 H .... 20,000
N1-Rose Bowl, Pasadena, California
LOUISIANA TECH (1-0-0)
1999 Nov. 26 -25........ W 45-19 H .... 45,070
NEVADA (5-0-0)
1920 Nov. 13 .............. W 38- 7 H ....1922 Oct. 21 ........(9:00) W 6- 0 H .... 8,0001923 Oct. 13 .............. W 33- 0 H .... 20,0001924 Oct. 25 .............. W 21- 7 H .... 20,0001929 Nov. 9 .............. W 66- 0 H .... 20,000
SAN JOSE STATE (3-0-0)
1995 Sept. 9 .7- ......... W 45-7 H .... 50,6122000 Sept. 23 .9- ......... W 34-24 H .... 56,5452001 Sept. 1 ............... W 21-10 H .... 45,568
UTAH STATE (4-0-0)
1928 Sept. 29 .............. W 40-12 H .... 31,0001930 Oct. 18 .............. W 65- 0 H .... 25,0001984 Sept. 8 .............. W 42- 7 H .... 45,0671989 Sept. 16 13- ......(N) W 66-10 H .... 50,249
(NOTE: Hawai‘i joined the Western Athletic Conference in 1979, Fresno State in1992, and San Jose State in 1996. Fresno State and San Jose State had been 1969charter members of the Pacific Coast Athletic Association (Big West Conference)until their respective withdrawals to join the WAC. Louisiana Tech joined the WACin 2001 after being an independent. Nevada was a member of the Big Sky from1979 to 1992, when it joined the Big West through 1999 before joining the WACin 2000. Idaho, a 1963 charter member of the Division I-AA Big Sky Conference,was a member of the Pacific Coast Conference from 1922 to 1958, then joinedthe Division I-A Big West in 1996. When the Big West dropped football, Idahojoined the Sun Belt Conference in 2001 before joining the WAC in 2005. UtahState became a member of the Pacific Coast Athletic Association in 1977. ThePCAA was renamed the Big West in 1988. When the Big West dropped football,Utah State became an independent in 2001 before joining the WAC in 2005.)
NON-CONFERENCE RECORD
OCCIDENTAL (16-5-2)
1895 Nov. 18 .............. L 0-10 N1....1899 Nov. 8 .............. W 11- 0 H ....1899 Nov. 15 .............. T 0- 0 H ....1900 Nov. 10 .............. W 5- 0 A ....1903 Oct. 24 .............. L 0- 5 H .... 6001904 Oct. 29 .............. W 36- 4 H ....1905 Nov. 11 .............. L 0-10 A ....1906 Oct. 13 .............. W 22- 0 H .... 4,0001908 Nov. 7 ...........(U) W 14- 0 H ....1909 Nov. 6 .............. T 3- 3 A .... c3,5001910 Nov. 5 .............. W 6- 0 H .... 5,0001914 Oct. 31 .............. L 13-20 H ....1918 Dec. 21 .............. L 6- 7 H ....1919 Nov. 1 .............. W 27- 0 H .... 5,0001920 Oct. 23 .............. W 48- 7 H ....1921 Oct. 15 .............. W 42- 0 A ....1922 Nov. 4 .............. W 46- 0 H .... 11,0001926 Oct. 16 .............. W 28- 6 H .... 22,0001927 Sept. 24 .............. W 33- 0 H .... 20,0001928 Oct. 27 .............. W 19- 0 H .... 40,0001929 Oct. 19 .............. W 64- 0 H .... 20,0001933 Sept. 23 .............. W 39- 0 H .... 35,0001934 Sept. 22 .............. W 20- 0 H .... 30,000
N1-Athletic Park, Los Angeles
POMONA (13-4-4)
1897 Nov. 25Th .............. W 6- 0 A ....1898 Nov. 24Th .............. W 14-11 N1....1899 Nov. 30Th .............. L 0-12 A .... 2,0001900 Nov. 29Th .............. L 0-11 N2.... 1,2001901 Dec. 7 .......(12:00) L 0- 6 A ....1902 Nov. 15 .............. W 16- 5 N1....1905 Dec. 9 .............. W 6- 4 N1.... 6001906 Nov. 17 .............. W 14- 0 A ....1908 Nov. 14 .....(P-10:00) T 6- 6 A ....1909 Nov. 13 .............. T 0- 0 H ....1910 Nov. 19 ......(P-1:00) T 9- 9 A .... 4,0001914 Nov. 14 .............. L 6-10 A .... 6,0001916 Nov. 25 .............. W 28- 3 H ....1918 Dec. 7 ...........(R) T 0- 0 A ....1919 Oct. 25 .............. W 6- 0 H .... 7,0001920 Oct. 30 .............. W 7- 0 A ....1921 Oct. 29 .............. W 35- 7 H .... 6,0001922 Oct. 7 .............. W 54-13 A ....1923 Oct. 6 .............. W 23- 7 H .... 12,8631924 Oct. 4 .............. W 14- 0 H .... 20,0001925 Oct. 3 .............. W 80- 0 H ....
N1-Fiesta Park, Los AngelesN2-Washington Park, Los Angeles
REDLANDS (4-0-0)
1910 Oct. 29 .............. W 35- 0 A ....1914 Oct. 10 .............. W 41- 0 H ....1914 Nov. 7 .............. W 13- 6 A ....1918 Dec. 25 .............. W 10- 0 H ....
WHITTIER (11-1-0)
1907 Nov. 9 .............. W 46- 0 H .... 8001908 Oct. 17 ...........(R) W 15- 0 H ....1909 Oct. 16 .............. W 22- 2 A ....1910 Nov. 12 .............. W 11- 3 A .... 3001914 Oct. 24 .............. W 17-14 H .... 1,2001915 Dec. 11 .............. L 2-20 N1....1921 Nov. 19 .............. W 14- 0 H .... 12,0001924 Nov. 15 .............. W 51- 0 H .... 15,0001925 Sept. 26 .............. W 74- 0 H .... 25,0001926 Sept. 25 .............. W 74- 0 H .... 15,3001933 Sept. 23 .............. W 51- 0 H .... 35,0001934 Sept. 22 .............. W 40-14 H .... 30,000
(NOTE: Cal Poly San Luis Obispo (SLO) is a member of the Division I-AA AmericanWest Conference. Cal Tech in Pasadena, Calif., dropped football in 1977. Loyolain Los Angeles, now known as Loyola Marymount, and the successor institution toSt. Vincent's College, discontinued football in 1952. Occidental in Los Angeles,Pomona in Claremont, Calif., now known as Pomona-Pitzer, Redlands in Redlands,Calif., and Whittier in Whittier, Calif., are now members of the Division IIISouthern California Intercollegiate Athletic Conference.)

2006 FOOTBALL MEDIA GUIDE — PAGE 83
ALL-TIME USC RECORDThe following is believed to be an accurate record of the outcome of all
games of American football played by the USC varsity team. It was compiledby Michael J. Glenn. USC appreciates his invaluable efforts.
The information in this history is set forth in as brief a fashion as possible.To illustrate this, review the entries under 1989. Reading from left to right, thefollowing information is given on the first line under the coach and captaindata: (1) Date (Sept. 4); (2) Result (L-USC loss); (3) USC's Associated Pressranking going into the game (5); (4) USC's opponent (Illinois); (5) An indicationthat the game began after 5:00 p.m., local time (N); (6) An indication that thewinning score occurred with 2:19 left in the game (2:19); (7) USC's opponent'sAssociated Press ranking going into the game (22); (8) Game score, with USC'spoint total given first (13-14); (9) An indication that the game was played atUSC's home field (H); (10) Game attendance (54,622).
Other information may be noted on the line concerning the UCLA game.The "c" before the attendance figure indicates a capacity crowd. "(UCLA-13:43)" indicates that UCLA made the tying score with 13:43 left in the fourthquarter.
The line beneath the UCLA game record presents USC's regular seasonrecord, conference record, and conference finish, in that order. Next come thepoints scored and points given up.
Beneath this is USC's bowl game result, followed on the next line by USC'sfinal overall record, USC's overall points scored and given up, and the seasonattendance total.
Other symbols: N1, N2, etc., indicate games played at a neutral site;(HC) indicates USC's Homecoming game; (U) indicates that the game resultwas a significant upset; (R) indicates that a major portion of the game wasplayed in the rain; (Sn) indicates the game was played in snow conditions; and"Th" indicates a game played on Thanksgiving Day.
1888Coaches: Henry Goddard, Frank Suffel
Captain: Will Whitcomb
Nov. 14 W ....Alliance AC................ 16- 0 H ....Jan. 19 W ....Alliance AC................ 4- 0 N1....
(2-0-0) 20- 0N1-Vacant Field bordered by Grand, Hope, Eighth, and Ninth Streets, LosAngeles, California
1889Coach: None
Captain: None
W ....Loyola (St. Vincent’s) 40- 0 H ....Nov. 28Th* W ....Pasadena................... 26- 0 N1....
(2-0-0) 66- 0N1-Sportsman’s Park, North Los Robles and Colorado, Pasadena, California*-USC’s first Thanksgiving Day game
1890No Varsity
1891Coach: None
Captain: Frank Lapham
Nov. 26Th L ....Olive Club.................. 12-16 H ....Jan. 23,'92 W ....SC Academy.............. 34- 0 H ....Feb. 22,'92 L ....Loyola....................... 2-10 H ....
(1-2-0) 48-26
1892No Varsity
1893Coach: None
Captain: None
Jan. 14 W ....Chaw-sir Club............ 14- 2 H .... 200Nov. 18 W ....Cal Tech.................... 22-12 A ....Dec. 11 L ....Chaffey College.......... 6-32 A ....Dec. 22 W ....Cal Tech (R)............... 14- 4 H .... 100
(3-1-0) 56-50
1894Coach: None
Captain: John A. Gray
W ....Cal Tech.................... 12- 0 H ....(1-0-0) 12- 0
1895Coach: None
Captain: Lee Bradley
Nov. 18 L ....Occidental................. 0-10 N1....Dec. 7 T ....Cal Tech.................... 4- 4 H ....
(0-1-1) 4-14N1-Athletic Park, 7th & Alameda, Los Angeles
1896Coach: None
Captain: Foster Wright
Oct. 24 L ....Whittier Reform.......... 0-30 H ....Oct. 31 L ....Los Angeles AC......... 0-22 N1.... 1,500Nov. 14 L ....Cal Tech.................... 0-22 N1....
(0-3-0) 0-74N1-Athletic Park, Los Angeles
1897Coach: Lewis FreemanCaptain: Harry Martin
W ....Loyola....................... 34- 0 H ....Nov. 6 W ....Los Angeles HS.......... 10- 0 N1.... 500Nov. 13 W ....Chaffey College.......... 38- 0 N1.... 250Nov. 25Th W ....Pomona..................... 6- 0 A ....Dec. 25 L ....San Diego YMCA........ 0-18 A ....Jan. 1 W ....Ventura..................... 12-0 A ....
(5-1-0) 100-18N1-Fiesta Park, Grand & Pico, Los Angeles
1898Coach: None
Captain: Foster Wright
Oct. 15 T ....Los Angeles HS.......... 0- 0 N1....Oct. 22 W ....Pasadena AC............. 17- 0 H ....Nov. 19 L ....Los Angeles HS.......... 0- 6 N2....Nov. 24Th W ....Pomona..................... 14-11 N2....Nov. 26 W ....7th Regiment*........... 34- 0 N2....Dec. 3 W ....Phoenix Indian School.. 27-11 N2....Jan. 2 W ....Santa Barbara AC (R)... 5- 0 A ....
(5-1-1) 97-28N1-Athletic Park, Los AngelesN2-Fiesta Park, Los Angeles*-Company F, 1st Battalion, 7th Regiment, California National Guard, LosAngeles, California
1899Coach: None
Captain: Logan Wheatley
Oct. 21 W ....Whittier Reform.......... 11- 0 H ....Nov. 4 L ....Santa Ana HS............ 0-11 A ....Nov. 8 W ....Occidental................. 11- 0 H ....Nov. 15 T ....Occidental................. 0- 0 H ....Nov. 30Th L ....Pomona..................... 0-12 A .... 2,000Jan. 1 L ....Santa Barbara AC 0-10 A ....
(2-3-1) 22-33
1900Coach: None
Captain: Harry Woodard
Nov. 10 W ....Occidental................. 5- 0 A ....Nov. 24 T ....Los Angeles HS.......... 0- 0 N1....Nov. 29Th L ....Pomona..................... 0-11 N1.... 1,200
(1-1-1) 5-11N1-Washington Park, Washington & Grand, Los Angeles
1901Coach: Clair Tappaan
Captain: Logan Wheatley
Dec. 7 L ....Pomona (12:00)......... 0- 6 A ....(0-1-0) 0- 6

PAGE 84 — UNIVERSITY OF SOUTHERN CALIFORNIA
1902Coach: None
Captain: Dan Caley
Oct. 11 L ....Loyola....................... 5- 6 N1 .... 400Oct. 25 L ....Santa Ana................. 2- 5 A ....Nov. 7 W ....Santa Ana................. 6- 0 H ....Nov. 15 W ....Pomona..................... 16- 5 N1....Nov. 22 L ....Sherman Institute....... 0-28 A ....
(2-3-0) 29-44N1-Fiesta Park, Los Angeles
1903Coach: John WalkerCaptain: Dan Caley
Oct. 10 W ....Cal Tech.................... 5- 0 H .... 500Oct. 17 W ....Los Angeles HS.......... 10- 0* H .... 500Oct. 24 L ....Occidental................. 0- 5 H .... 600Oct. 31 W ....Loyola....................... 12- 5 H ....Nov. 7 W ....Orange AC................. 31- 5 H ....Nov. 14 L ....Sherman Institute....... 0-12 H ....
(4-2-0) 58-27All USC home games in 1903 played at Prager Park, near Washington & Grand,Los Angeles*-Los Angeles HS left field of play with several minutes left, in protest overpenalty called by umpire Dean Cromwell; USC awarded five points to makefinal score 10-0
1904Coach: Harvey HolmesCaptain: Jay Bickford
Oct. 15 W ....Los Angeles HS.......... 42- 0 N1.... 1,600Oct. 22 W ....Cal Tech.................... 35- 0 H .... 200Oct. 29 W ....Occidental................. 36- 4 H ....Nov. 5 W ....Loyola....................... frft.* H ....Nov. 5 W ....SC Prep..................... 26- 0 H ....Nov. 12 L ....Sherman Institute....... 0-17+ N2....Nov. 19 W ....Whittier Reform.......... 60-6 A.....
(6-1-0) 199-27N1-Fiesta Park, Los AngelesN2-Eagle Park, Long Beach, California*-Opposing coaches could not agree on time of halves, game awarded to USC;game against USC prep students played instead+-Game called, midway through second half, darkness
1905Coach: Harvey Holmes
Captain: Carl Elliott
Oct. 4 W ....National Guard#......... 28- 0 H ....Oct. 10 W ....Harvard School.......... 12- 0% H .... 300Oct. 16 W ....LA Poly HS................ 27- 0 H ....Oct. 18 W ....Whittier Reform.......... 75- 0+ H ....Nov. 1 W ....Alumni...................... 63- 0 H ....Nov. 4 L ....Stanford.................... 0-16* A ....Nov. 11 L ....Occidental................. 0-10 A ....Nov. 25 L ....Sherman Institute....... 0-15 N1.... 800Dec. 2 T ....Loyola....................... 0- 0 H ....Dec. 9 W ....Pomona.................... 6- 4 N1.... 600
(6-3-1) 211-45N1-Fiesta Park, Los Angeles#-Company F%-Because of “deficiencies” of Harvard roster, Harvard’s coach, USC’s coach,and Dean Cromwell played for Harvard+-15-minute halves*-First USC game played outside Southern California
1906Coach: Harvey Holmes
Captain: Oliver Best
Oct. 6 T ....Los Angeles HS.......... 0- 0 N1....Oct. 13 W ....Occidental................. 22- 0 H .... 4,000Nov. 17 W ....Pomona..................... 14- 0 A ....Nov. 29Th T ....Sherman Institute....... 0- 0 N1.... 4,000
(2-0-2) 36-0N1-Fiesta Park, Los Angeles
1907Coach: Harvey Holmes
Captain: Charley Haigler
Oct. 12 W ....Los Angeles HS.......... 6- 0 N1.... 2,000Oct. 16 W ....Whittier Reform.......... 57- 0 H ....Oct. 26 W ....Santa Ana HS............ 51- 0 A ....Nov. 9 W ....Whittier..................... 46- 0 H .... 800Nov. 15 W ....USS Colorado............ 16- 4 H .... 1,200Dec. 25 L ....Los Angeles HS.......... 6-16 N1.... 2,200
(5-1-0) 182-20N1-Fiesta Park, Los Angeles
1908Coach: Bill TraegerCaptain: Stan Burek
Oct. 10 L ....Los Angeles HS.......... 0-12 N1.... 2,500Oct. 17 W ....Whittier (R)................ 15- 0 H ....Oct. 24 W ....Arrowhead AC........... 28- 0 A ....Nov. 7 W ....Occidental (U)............ 14- 0* H ....Nov. 14 T ....Pomona (P-10:00)...... 6- 6 A ....
(3-1-1) 63-18N1-Fiesta Park, Los Angeles*-50th USC victory
1909Coach: Dean Cromwell
Captain: Hal Paulin
Oct. 9 W ....Cal Poly SLO.............. 51- 0 A ....Oct. 16 W ....Whittier..................... 22- 2 A ....Oct. 23 L ....Loyola (3:00)............. 6- 8 H .... 1,200Oct. 30 W ....Orange AC................. 51- 0 H ....Nov. 6 T ....Occidental................. 3- 3 A .... c3,500Nov. 13 T ....Pomona..................... 0- 0 H ....
(3-1-2) 133-13
1910Coach: Dean CromwellCaptain: Jack Malcolm
Oct. 5 W ....Long Beach Poly HS.... 22- 6 H ....Oct. 8 W ....Chaffey HS................ 65- 6 H ....Oct. 15 W ....Throop Academy (R)... 9- 0 A ....Oct. 22 W ....San Diego HS............ 32- 0 A ....Oct. 29 W ....Redlands................... 35- 0 A ....Nov. 5 W ....Occidental................. 6- 0 H .... 5,000Nov. 12 W ....Whittier..................... 11- 3 A .... 300Nov. 19 T ....Pomona (P-1:00)........ 9- 9 A .... 4,000
(7-0-1) 189-24
1911-1913Rugby
1914Coach: Ralph Glaze
Captain: Tommy Davis
Sept. 26 W ....Los Angeles AC......... 20- 0 H ....Oct. 10 W ....Redlands................... 41- 0 H ....Oct. 24 W ....Whittier..................... 17-14 H .... 1,200Oct. 31 L ....Occidental................. 13-20 H ....Nov. 7 W ....Redlands................... 13- 6 A ....Nov. 14 L ....Pomona..................... 6-10 A .... 6,000Nov. 26Th L ....Oregon State............. 6-38 N1.... 7,000
(4-3-0) 116-88N1-Tacoma Stadium, Tacoma, Washington; first USC game played outsideCalifornia
1915Coach: Ralph Glaze
Captain: Len Livernash
Oct. 2 W ....Los Angeles AC.......... 21- 9 H ....Oct. 16 W ....St. Mary’s................. 47- 3 H ....Oct. 23 W ....California................... 28-10 A .... 10,000Nov. 8 L ....Oregon...................... 0-34* H .... 2,300Nov. 20 L ....Utah......................... 13-20 A ....Nov. 25Th L ....California (1:00)......... 21-23 N1.... 8,000Dec. 11 L ....Whittier..................... 2-20 N1....
(3-4-0) 132-119N1-Washington Park, Washington & Hill, Los Angeles*-Originally scheduled for Nov. 6, but rescheduled due to rain
ALL-TIME USC RECORD
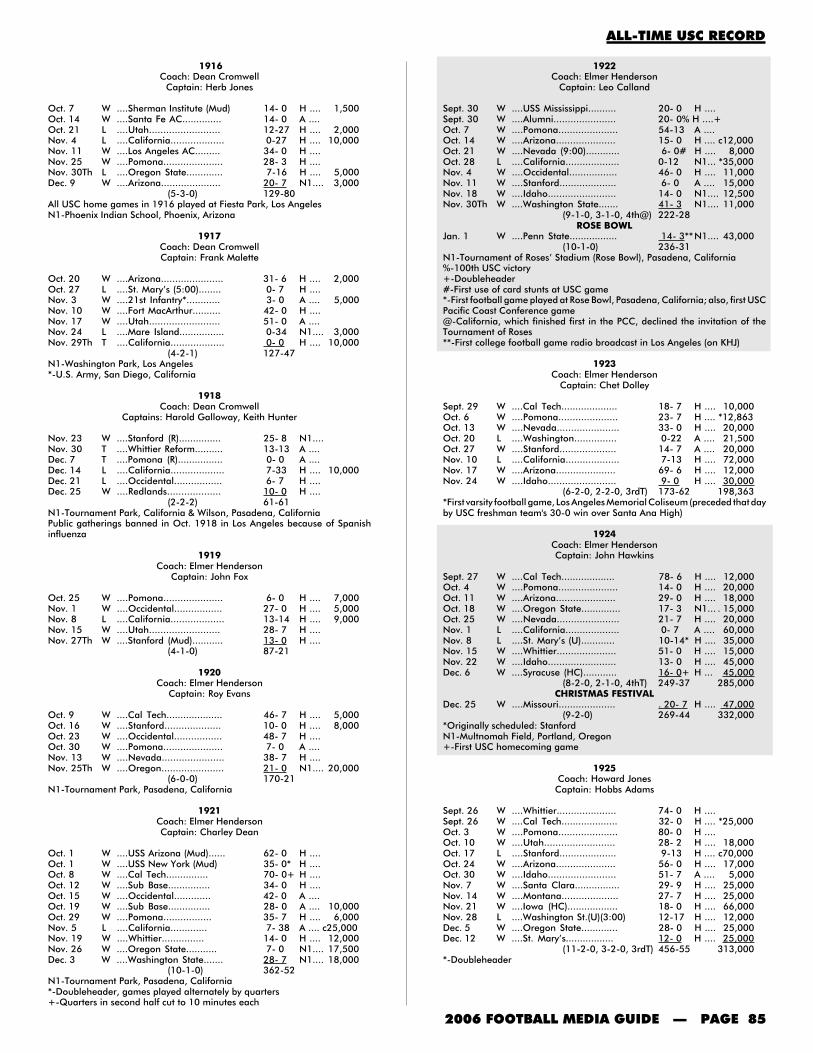
2006 FOOTBALL MEDIA GUIDE — PAGE 85
1916Coach: Dean Cromwell
Captain: Herb Jones
Oct. 7 W ....Sherman Institute (Mud) 14- 0 H .... 1,500Oct. 14 W ....Santa Fe AC.............. 14- 0 A ....Oct. 21 L ....Utah......................... 12-27 H .... 2,000Nov. 4 L ....California................... 0-27 H .... 10,000Nov. 11 W ....Los Angeles AC......... 34- 0 H ....Nov. 25 W ....Pomona..................... 28- 3 H ....Nov. 30Th L ....Oregon State............. 7-16 H .... 5,000Dec. 9 W ....Arizona..................... 20- 7 N1.... 3,000
(5-3-0) 129-80All USC home games in 1916 played at Fiesta Park, Los AngelesN1-Phoenix Indian School, Phoenix, Arizona
1917Coach: Dean CromwellCaptain: Frank Malette
Oct. 20 W ....Arizona...................... 31- 6 H .... 2,000Oct. 27 L ....St. Mary’s (5:00)........ 0- 7 H ....Nov. 3 W ....21st Infantry*............ 3- 0 A .... 5,000Nov. 10 W ....Fort MacArthur.......... 42- 0 H ....Nov. 17 W ....Utah......................... 51- 0 A ....Nov. 24 L ....Mare Island................ 0-34 N1.... 3,000Nov. 29Th T ....California................... 0- 0 H .... 10,000
(4-2-1) 127-47N1-Washington Park, Los Angeles*-U.S. Army, San Diego, California
1918Coach: Dean Cromwell
Captains: Harold Galloway, Keith Hunter
Nov. 23 W ....Stanford (R)............... 25- 8 N1....Nov. 30 T ....Whittier Reform.......... 13-13 A ....Dec. 7 T ....Pomona (R)................ 0- 0 A ....Dec. 14 L ....California................... 7-33 H .... 10,000Dec. 21 L ....Occidental................. 6- 7 H ....Dec. 25 W ....Redlands................... 10- 0 H ....
(2-2-2) 61-61N1-Tournament Park, California & Wilson, Pasadena, CaliforniaPublic gatherings banned in Oct. 1918 in Los Angeles because of Spanishinfluenza
1919Coach: Elmer Henderson
Captain: John Fox
Oct. 25 W ....Pomona..................... 6- 0 H .... 7,000Nov. 1 W ....Occidental................. 27- 0 H .... 5,000Nov. 8 L ....California................... 13-14 H .... 9,000Nov. 15 W ....Utah......................... 28- 7 H ....Nov. 27Th W ....Stanford (Mud)........... 13- 0 H ....
(4-1-0) 87-21
1920Coach: Elmer Henderson
Captain: Roy Evans
Oct. 9 W ....Cal Tech.................... 46- 7 H .... 5,000Oct. 16 W ....Stanford.................... 10- 0 H .... 8,000Oct. 23 W ....Occidental................. 48- 7 H ....Oct. 30 W ....Pomona..................... 7- 0 A ....Nov. 13 W ....Nevada...................... 38- 7 H ....Nov. 25Th W ....Oregon...................... 21- 0 N1.... 20,000
(6-0-0) 170-21N1-Tournament Park, Pasadena, California
1921Coach: Elmer HendersonCaptain: Charley Dean
Oct. 1 W ....USS Arizona (Mud)...... 62- 0 H ....Oct. 1 W ....USS New York (Mud) 35- 0* H ....Oct. 8 W ....Cal Tech............... 70- 0+ H ....Oct. 12 W ....Sub Base............... 34- 0 H ....Oct. 15 W ....Occidental............. 42- 0 A ....Oct. 19 W ....Sub Base............... 28- 0 A .... 10,000Oct. 29 W ....Pomona................. 35- 7 H .... 6,000Nov. 5 L ....California............. 7- 38 A .... c25,000Nov. 19 W ....Whittier............... 14- 0 H .... 12,000Nov. 26 W ....Oregon State........... 7- 0 N1.... 17,500Dec. 3 W ....Washington State....... 28- 7 N1.... 18,000
(10-1-0) 362-52N1-Tournament Park, Pasadena, California*-Doubleheader, games played alternately by quarters+-Quarters in second half cut to 10 minutes each
1922Coach: Elmer Henderson
Captain: Leo Calland
Sept. 30 W ....USS Mississippi.......... 20- 0 H ....Sept. 30 W ....Alumni...................... 20- 0% H ....+Oct. 7 W ....Pomona..................... 54-13 A ....Oct. 14 W ....Arizona..................... 15- 0 H .... c12,000Oct. 21 W ....Nevada (9:00)............ 6- 0# H .... 8,000Oct. 28 L ....California................... 0-12 N1... *35,000Nov. 4 W ....Occidental................. 46- 0 H .... 11,000Nov. 11 W ....Stanford.................... 6- 0 A .... 15,000Nov. 18 W ....Idaho........................ 14- 0 N1.... 12,500Nov. 30Th W ....Washington State....... 41- 3 N1.... 11,000
(9-1-0, 3-1-0, 4th@) 222-28ROSE BOWL
Jan. 1 W ....Penn State................. 14- 3**N1.... 43,000(10-1-0) 236-31
N1-Tournament of Roses’ Stadium (Rose Bowl), Pasadena, California%-100th USC victory+-Doubleheader#-First use of card stunts at USC game*-First football game played at Rose Bowl, Pasadena, California; also, first USCPacific Coast Conference game@-California, which finished first in the PCC, declined the invitation of theTournament of Roses**-First college football game radio broadcast in Los Angeles (on KHJ)
1923Coach: Elmer Henderson
Captain: Chet Dolley
Sept. 29 W ....Cal Tech.................... 18- 7 H .... 10,000Oct. 6 W ....Pomona..................... 23- 7 H .... *12,863Oct. 13 W ....Nevada...................... 33- 0 H .... 20,000Oct. 20 L ....Washington............... 0-22 A .... 21,500Oct. 27 W ....Stanford.................... 14- 7 A .... 20,000Nov. 10 L ....California................... 7-13 H .... 72,000Nov. 17 W ....Arizona..................... 69- 6 H .... 12,000Nov. 24 W ....Idaho........................ 9- 0 H .... 30,000
(6-2-0, 2-2-0, 3rdT) 173-62 198,363*First varsity football game, Los Angeles Memorial Coliseum (preceded that dayby USC freshman team's 30-0 win over Santa Ana High)
1924Coach: Elmer HendersonCaptain: John Hawkins
Sept. 27 W ....Cal Tech................... 78- 6 H .... 12,000Oct. 4 W ....Pomona..................... 14- 0 H .... 20,000Oct. 11 W ....Arizona..................... 29- 0 H .... 18,000Oct. 18 W ....Oregon State.............. 17- 3 N1... . 15,000Oct. 25 W ....Nevada...................... 21- 7 H .... 20,000Nov. 1 L ....California................... 0- 7 A .... 60,000Nov. 8 L ....St. Mary’s (U)............ 10-14* H .... 35,000Nov. 15 W ....Whittier..................... 51- 0 H .... 15,000Nov. 22 W ....Idaho........................ 13- 0 H .... 45,000Dec. 6 W ....Syracuse (HC)............ 16- 0+ H ... 45,000
(8-2-0, 2-1-0, 4thT) 249-37 285,000CHRISTMAS FESTIVAL
Dec. 25 W ....Missouri.................... . 20- 7 H .... 47,000(9-2-0) 269-44 332,000
*Originally scheduled: StanfordN1-Multnomah Field, Portland, Oregon+-First USC homecoming game
1925Coach: Howard Jones
Captain: Hobbs Adams
Sept. 26 W ....Whittier..................... 74- 0 H ....Sept. 26 W ....Cal Tech.................... 32- 0 H .... *25,000Oct. 3 W ....Pomona..................... 80- 0 H ....Oct. 10 W ....Utah......................... 28- 2 H .... 18,000Oct. 17 L ....Stanford.................... 9-13 H .... c70,000Oct. 24 W ....Arizona..................... 56- 0 H .... 17,000Oct. 30 W ....Idaho........................ 51- 7 A .... 5,000Nov. 7 W ....Santa Clara................ 29- 9 H .... 25,000Nov. 14 W ....Montana.................... 27- 7 H .... 25,000Nov. 21 W ....Iowa (HC).................. 18- 0 H .... 66,000Nov. 28 L ....Washington St.(U)(3:00) 12-17 H .... 12,000Dec. 5 W ....Oregon State............. 28- 0 H .... 25,000Dec. 12 W ....St. Mary’s................. 12- 0 H .... 25,000
(11-2-0, 3-2-0, 3rdT) 456-55 313,000*-Doubleheader
ALL-TIME USC RECORD

PAGE 86 — UNIVERSITY OF SOUTHERN CALIFORNIA
1926Coach: Howard JonesCaptain: Jeff Cravath
Sept. 25 W ....Whittier..................... 74- 0 H .... 15,300Oct. 2 W ....Santa Clara................ 42- 0 H .... 27,400Oct. 9 W ....Washington State....... 16- 7 H .... 34,700Oct. 16 W ....Occidental................. 28- 6 H .... 22,000Oct. 23 W ....California................... 27- 0 A .... 72,000Oct. 30 L ....Stanford.................... 12-13 H .... c78,500Nov. 11 W ....Oregon State (Mud).... 17- 7 N1.... 26,000Nov. 20 W ....Idaho........................ 28- 6 H .... 17,400Nov. 25Th W ....Montana.................... 61- 0 H .... 18,600Dec. 4 L ....Notre Dame (HC) (2:00) 12-13 H .... c74,378
(8-2-0, 5-1-0, 2nd) 317- 52 386,278N1-Multnomah Stadium, Portland, Oregon
1927Coach: Howard JonesCaptain: Morley Drury
Sept. 24 W ....Occidental................. 33- 0 H .... 20,000Oct. 1 W ....Santa Clara................ 52-12 H .... 35,000Oct. 8 W ....Oregon State (5:00).... 13-12 H .... 35,000Oct. 15 T ....Stanford (SU-0:30)..... 13-13 A .... 52,385Oct. 22 W ....Cal Tech.................... 51- 0 H .... 25,000Oct. 29 W ....California................... 13- 0 H .... c76,500Nov. 12 W ....Colorado.................... 46- 7 H .... 25,000Nov. 19 W ....Washington State....... 27- 0 H .... 45,000Nov. 26 L ....Notre Dame............... 6- 7 N1.. c120,000Dec. 3 W ....Washington (HC)........ 33-13 H .... 60,000
(8-1-1, 4-0-1, 1stT*) 287- 64 493,885N1-Soldier Field, Chicago, Illinois (paid attendance-99,573)*-Stanford selected to play in 1928 Rose Bowl
1928Coach: Howard JonesCaptain: Jesse Hibbs
Sept. 29 W ....Utah State................. 40-12 H .... 31,000Oct. 6 W ....Oregon State............. 19- 0 H .... 50,000Oct. 13 W ....St. Mary’s................. 19- 6 H .... 40,000Oct. 20 T ....California................... 0- 0 A .... c74,245Oct. 27 W ....Occidental................. 19- 0 H .... 40,000Nov. 3 W ....Stanford.................... 10- 0 H .... 80,000Nov. 10 W ....Arizona..................... 78- 7 H .... 20,000Nov. 17 W ....Washington State....... 27-13 H .... 33,000Nov. 24 W ....Idaho........................ 28- 7 H .... 10,000Dec. 1 W ....Notre Dame (HC)........ 27-14 H .... c72,632
(9-0-1, 4-0-1, 1st*) 267-59 450,877USC won national championship*-USC declined the Tournament of Roses’ bid to play in the 1929 Rose Bowl;instead California represented the West, and lost to Georgia Tech, 8-7, in partbecause Roy Riegels of Cal ran a recovered fumble back 64 yards, the “wrongway”
1929Coach: Howard Jones
Captain: Nate Barragar
Sept. 28 W ....UCLA....................... 76- 0 H .... 50,000Oct. 5 W ....Oregon State............. 21- 7 H .... 40,000Oct. 12 W ....Washington............... 48- 0 A .... 23,582Oct. 19 W ....Occidental................. 64- 0 H .... 20,000Oct. 26 W ....Stanford.................... 7- 0 A .... c89,000Nov. 2 L ....California................... 7-15 H .... c79,000Nov. 9 W ....Nevada..................... 66- 0 H .... 20,000Nov. 16 L ....Notre Dame............... 12-13 N1.. c112,912Nov. 23 W ....Idaho........................ 72- 0 H .... 20,000Nov. 30 W ....Washington State....... 27- 7 H .... 55,000Dec. 14 W ....Carnegie Tech (HC).... 45-13 H .... 65,000
(9-2-0, 6-1-0, 1st) 445-55 574,494ROSE BOWL
Jan. 1 W ....Pittsburgh.................. 47-14 N2.... c72,000(10-2-0) 492-69 646,494
N1-Soldier Field, Chicago, Illinois (paid attendance-99,351)N2-Rose Bowl, Pasadena, California
1930Coach: Howard Jones
Captain: Marshall Duffield
Sept. 27 W ....UCLA........................ 52- 0 A .... 40,000Oct. 4 W ....Oregon State............. 27- 7 H .... 40,000Oct. 11 L ....Washington State (U).. 6- 7 A .... 22,000Oct. 18 W ....Utah State................. 65- 0 H .... 25,000Oct. 25 W ....Stanford.................... 41-12 A .... c89,000Nov. 1 W ....Denver...................... 33-13 H .... 18,000Nov. 8 W ....California................... 74- 0 H .... c82,000Nov. 15 W ....Hawai‘i...................... 52- 0 H .... 17,500Nov. 27Th W ....Washington (Mud)...... 32- 0 H .... 45,000Dec. 6 L ....Notre Dame (HC)........ 0-27* H .... c73,967
(8-2-0, 5-1-0, 2nd) 382-66 452,467*Knute Rockne’s last game at Notre Dame
1931Coach: Howard Jones
Captain: Stan Williamson
Sept. 26 L ....St. Mary’s (U)............ 7-13 H .... 70,000Oct. 3 W ....Oregon State............. 30- 0 H .... 50,000Oct. 10 W ....Washington State....... 38- 6 H .... 30,000Oct. 17 W ....Oregon...................... 53- 0 H .... 50,000Oct. 24 W ....California................... 6- 0 A .... 53,957Nov. 7 W ....Stanford.................... 19- 0 H .... c93,000Nov. 14 W ....Montana.................... 69- 0 H .... 25,000Nov. 21 W ....Notre Dame (1:00)..... 16-14 A ... *c50,731Dec. 5 W ....Washington (HC)........ 44- 7 H .... 40,000Dec. 12 W ....Georgia..................... 60- 0 H .... 75,000
(9-1-0, 7-0-0, 1st) 342-40 537,688ROSE BOWL
Jan. 1 W ....Tulane....................... 21-12 N1.... c75,562(10-1-0) 363-52 613,250
USC won national championshipN1-Rose Bowl, Pasadena, California*-First capacity crowd at Notre Dame Stadium, ended Notre Dame 26-gameunbeaten streak
1932Coach: Howard JonesCaptain: Tay Brown
Sept. 24 W ....Utah......................... 35- 0 H .... 35,000Oct. 1 W ....Washington State....... 20- 0 H .... 55,000Oct. 8 W ....Oregon State............. 10- 0 H .... 40,000Oct. 15 W ....Loyola (5:00)............. 6- 0 H .... 50,000Oct. 22 W ....Stanford.................... 13- 0 A .... 60,000Nov. 5 W ....California................... 27- 7 H .... 70,000Nov. 12 W ....Oregon...................... 33- 0 H .... 40,000Nov. 24Th W ....Washington (Mud)...... 9- 6 A .... 22,061Dec. 10 W ....Notre Dame (HC)........ 13- 0 H .... c93,924
(9-0-0, 6-0-0, 1st) 166-13 465,985ROSE BOWL
Jan. 2 W ....Pittsburgh.................. 35- 0 N1.... 78,874(10-0-0) 201-13 544,859
USC won national championshipN1-Rose Bowl, Pasadena, California
1933Coach: Howard JonesCaptain: Ford Palmer
Sept. 23 W ....Occidental................. 39- 0+ H ....Sept. 23 W ....Whittier..................... 51- 0 H .... *35,000Sept. 30 W ....Loyola....................... 18- 0% H .... 65,000Oct. 7 W ....Washington State....... 33- 0 H .... 65,000Oct. 14 W ....St. Mary’s................. 14- 7 H .... 85,000Oct. 21 T ....Oregon State............. 0- 0& N1.... 21,000Oct. 28 W ....California (Fog)(8:30).. 6- 3@ A .... 65,000Nov. 11 L ....Stanford.................... 7-13# H .... 95,000Nov. 18 W ....Oregon...................... 26- 0 H .... 69,000Nov. 25 W ....Notre Dame............... 19- 0 A .... 25,037Dec. 2 W ....Georgia..................... 31- 0 H .... 45,000Dec. 9 W ....Washington (HC)........ 13- 7 H .... 45,000
(10-1-1, 4-1-1, 3rd) 257-30 615,037N1-Multnomah Field, Portland, Oregon+-Second half cut to approximately 14 minutes*-Doubleheader&-Oregon State’s 11 “iron men” played entire game with no substitutes,ending USC’s 25-game winning streak@-Cotton Warburton’s 59-yard touchdown run, which won game, wasobscured from most fans by fog#-Ended USC’s 27-game unbeaten streak (first game, Stanford’s “Vow Boys”)%-USC’s 200th victory
ALL-TIME USC RECORD
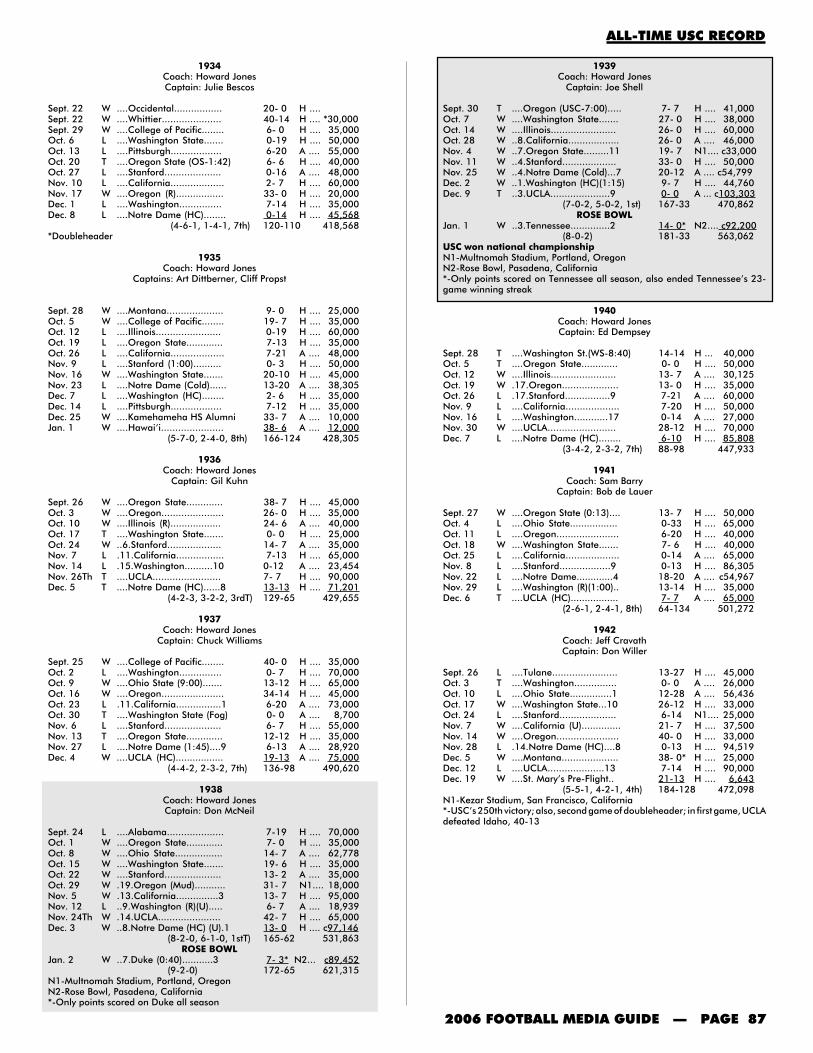
2006 FOOTBALL MEDIA GUIDE — PAGE 87
ALL-TIME USC RECORD
1934Coach: Howard JonesCaptain: Julie Bescos
Sept. 22 W ....Occidental................. 20- 0 H ....Sept. 22 W ....Whittier..................... 40-14 H .... *30,000Sept. 29 W ....College of Pacific........ 6- 0 H .... 35,000Oct. 6 L ....Washington State....... 0-19 H .... 50,000Oct. 13 L ....Pittsburgh.................. 6-20 A .... 55,000Oct. 20 T ....Oregon State (OS-1:42) 6- 6 H .... 40,000Oct. 27 L ....Stanford.................... 0-16 A .... 48,000Nov. 10 L ....California................... 2- 7 H .... 60,000Nov. 17 W ....Oregon (R)................. 33- 0 H .... 20,000Dec. 1 L ....Washington............... 7-14 H .... 35,000Dec. 8 L ....Notre Dame (HC)........ 0-14 H .... 45,568
(4-6-1, 1-4-1, 7th) 120-110 418,568*Doubleheader
1935Coach: Howard Jones
Captains: Art Dittberner, Cliff Propst
Sept. 28 W ....Montana.................... 9- 0 H .... 25,000Oct. 5 W ....College of Pacific........ 19- 7 H .... 35,000Oct. 12 L ....Illinois....................... 0-19 H .... 60,000Oct. 19 L ....Oregon State............. 7-13 H .... 35,000Oct. 26 L ....California................... 7-21 A .... 48,000Nov. 9 L ....Stanford (1:00).......... 0- 3 H .... 50,000Nov. 16 W ....Washington State....... 20-10 H .... 45,000Nov. 23 L ....Notre Dame (Cold)...... 13-20 A .... 38,305Dec. 7 L ....Washington (HC)........ 2- 6 H .... 35,000Dec. 14 L ....Pittsburgh.................. 7-12 H .... 35,000Dec. 25 W ....Kamehameha HS Alumni 33- 7 A .... 10,000Jan. 1 W ....Hawai‘i...................... 38- 6 A .... 12,000
(5-7-0, 2-4-0, 8th) 166-124 428,305
1936Coach: Howard Jones
Captain: Gil Kuhn
Sept. 26 W ....Oregon State............. 38- 7 H .... 45,000Oct. 3 W ....Oregon...................... 26- 0 H .... 35,000Oct. 10 W ....Illinois (R).................. 24- 6 A .... 40,000Oct. 17 T ....Washington State....... 0- 0 H .... 25,000Oct. 24 W ..6.Stanford................... 14- 7 A .... 35,000Nov. 7 L .11.California................. 7-13 H .... 65,000Nov. 14 L .15.Washington..........10 0-12 A .... 23,454Nov. 26Th T ....UCLA........................ 7- 7 H .... 90,000Dec. 5 T ....Notre Dame (HC)......8 13-13 H .... 71,201
(4-2-3, 3-2-2, 3rdT) 129-65 429,655
1937Coach: Howard Jones
Captain: Chuck Williams
Sept. 25 W ....College of Pacific........ 40- 0 H .... 35,000Oct. 2 L ....Washington............... 0- 7 H .... 70,000Oct. 9 W ....Ohio State (9:00)....... 13-12 H .... 65,000Oct. 16 W ....Oregon...................... 34-14 H .... 45,000Oct. 23 L .11.California................1 6-20 A .... 73,000Oct. 30 T ....Washington State (Fog) 0- 0 A .... 8,700Nov. 6 L ....Stanford.................... 6- 7 H .... 55,000Nov. 13 T ....Oregon State............. 12-12 H .... 35,000Nov. 27 L ....Notre Dame (1:45)....9 6-13 A .... 28,920Dec. 4 W ....UCLA (HC)................. 19-13 A .... 75,000
(4-4-2, 2-3-2, 7th) 136-98 490,620
1938Coach: Howard JonesCaptain: Don McNeil
Sept. 24 L ....Alabama.................... 7-19 H .... 70,000Oct. 1 W ....Oregon State............. 7- 0 H .... 35,000Oct. 8 W ....Ohio State................. 14- 7 A .... 62,778Oct. 15 W ....Washington State....... 19- 6 H .... 35,000Oct. 22 W ....Stanford.................... 13- 2 A .... 35,000Oct. 29 W .19.Oregon (Mud)........... 31- 7 N1.... 18,000Nov. 5 W .13.California...............3 13- 7 H .... 95,000Nov. 12 L ..9.Washington (R)(U)..... 6- 7 A .... 18,939Nov. 24Th W .14.UCLA...................... 42- 7 H .... 65,000Dec. 3 W ..8.Notre Dame (HC) (U).1 13- 0 H .... c97,146
(8-2-0, 6-1-0, 1stT) 165-62 531,863ROSE BOWL
Jan. 2 W ..7.Duke (0:40)...........3 7- 3* N2... c89,452(9-2-0) 172-65 621,315
N1-Multnomah Stadium, Portland, OregonN2-Rose Bowl, Pasadena, California*-Only points scored on Duke all season
1939Coach: Howard Jones
Captain: Joe Shell
Sept. 30 T ....Oregon (USC-7:00)..... 7- 7 H .... 41,000Oct. 7 W ....Washington State....... 27- 0 H .... 38,000Oct. 14 W ....Illinois....................... 26- 0 H .... 60,000Oct. 28 W ..8.California.................. 26- 0 A .... 46,000Nov. 4 W ..7.Oregon State.........11 19- 7 N1.... c33,000Nov. 11 W ..4.Stanford................... 33- 0 H .... 50,000Nov. 25 W ..4.Notre Dame (Cold)...7 20-12 A .... c54,799Dec. 2 W ..1.Washington (HC)(1:15) 9- 7 H .... 44,760Dec. 9 T ..3.UCLA.....................9 0- 0 A ... c103,303
(7-0-2, 5-0-2, 1st) 167-33 470,862ROSE BOWL
Jan. 1 W ..3.Tennessee..............2 14- 0* N2.... c92,200(8-0-2) 181-33 563,062
USC won national championshipN1-Multnomah Stadium, Portland, OregonN2-Rose Bowl, Pasadena, California*-Only points scored on Tennessee all season, also ended Tennessee’s 23-game winning streak
1940Coach: Howard JonesCaptain: Ed Dempsey
Sept. 28 T ....Washington St.(WS-8:40) 14-14 H ... 40,000Oct. 5 T ....Oregon State............. 0- 0 H .... 50,000Oct. 12 W ....Illinois....................... 13- 7 A .... 30,125Oct. 19 W .17.Oregon.................... 13- 0 H .... 35,000Oct. 26 L .17.Stanford................9 7-21 A .... 60,000Nov. 9 L ....California................... 7-20 H .... 50,000Nov. 16 L ....Washington............17 0-14 A .... 27,000Nov. 30 W ....UCLA........................ 28-12 H .... 70,000Dec. 7 L ....Notre Dame (HC)........ 6-10 H .... 85,808
(3-4-2, 2-3-2, 7th) 88-98 447,933
1941Coach: Sam Barry
Captain: Bob de Lauer
Sept. 27 W ....Oregon State (0:13).... 13- 7 H .... 50,000Oct. 4 L ....Ohio State................. 0-33 H .... 65,000Oct. 11 L ....Oregon...................... 6-20 H .... 40,000Oct. 18 W ....Washington State....... 7- 6 H .... 40,000Oct. 25 L ....California................... 0-14 A .... 65,000Nov. 8 L ....Stanford..................9 0-13 H .... 86,305Nov. 22 L ....Notre Dame.............4 18-20 A .... c54,967Nov. 29 L ....Washington (R)(1:00).. 13-14 H .... 35,000Dec. 6 T ....UCLA (HC)................. 7- 7 A .... 65,000
(2-6-1, 2-4-1, 8th) 64-134 501,272
1942Coach: Jeff CravathCaptain: Don Willer
Sept. 26 L ....Tulane....................... 13-27 H .... 45,000Oct. 3 T ....Washington............... 0- 0 A .... 26,000Oct. 10 L ....Ohio State...............1 12-28 A .... 56,436Oct. 17 W ....Washington State...10 26-12 H .... 33,000Oct. 24 L ....Stanford.................... 6-14 N1.... 25,000Nov. 7 W ....California (U).............. 21- 7 H .... 37,500Nov. 14 W ....Oregon...................... 40- 0 H .... 33,000Nov. 28 L .14.Notre Dame (HC)....8 0-13 H .... 94,519Dec. 5 W ....Montana.................... 38- 0* H .... 25,000Dec. 12 L ....UCLA....................13 7-14 H .... 90,000Dec. 19 W ....St. Mary’s Pre-Flight.. 21-13 H .... 6,643
(5-5-1, 4-2-1, 4th) 184-128 472,098N1-Kezar Stadium, San Francisco, California*-USC’s 250th victory; also, second game of doubleheader; in first game, UCLAdefeated Idaho, 40-13

PAGE 88 — UNIVERSITY OF SOUTHERN CALIFORNIA
1943Coach: Jeff Cravath
Captain: Ralph Heywood
Sept. 25 W ....UCLA........................ 20- 0 A .... 50,000Oct. 2 W ....California................... 7- 0 A .... 35,000Oct. 9 W .10.St. Mary’s Pre-Flight. 13- 0 H .... 30,000Oct. 16 W ..8.San Francisco........... 34- 0 A .... 6,000Oct. 23 W ..7.College of Pacific.....6 6- 0 H .... 65,000Oct. 30 W ..5.California..............20 13- 0 H .... 45,000Nov. 6 L ..4.San Diego Navy......... 7-10 A .... 6,000Nov. 13 L ..9.March Field*.........15 0-35 H .... 30,000Nov. 27 W ....UCLA (HC)................ 26-13 H .... 35,000
(7-2-0, 5-0-0, 1st) 126-58 302,000ROSE BOWL
Jan. 1 W ....Washington (U)......12 29- 0 N1.... 68,000(8-2-0) 155-58 370,000
N1-Rose Bowl, Pasadena, California*-4th Air Force
1944Coach: Jeff CravathCaptain: Jim Hardy
Sept. 23 T ....UCLA (TD-UCLA 0:00) 13-13 H .... 60,000Sept. 30 W ....College of Pacific........ 18- 6 H .... 30,000Oct. 7 T ....California................... 6- 6 H .... 40,000Oct. 14 W ....St. Mary’s Pre-Flt. (N). 6- 0* N1.... c13,500Oct. 23 W .15.Washington (N)........ 38- 7+ H .... 62,865Oct. 28 W ....St. Mary’s................. 34- 7 H .... 20,000Nov. 4 W .13.San Diego Navy (4:00) 28-21 H .... 28,000Nov. 18 W .12.California................. 32- 0 A .... 40,000Nov. 25 W ..8.UCLA (HC)................ 40-13 A .... 77,903
(7-0-2, 3-0-2, 1st) 215-73 372,268ROSE BOWL
Jan. 1 W ..7.Tennessee.............12 25- 0 N2.... c91,000(8-0-2) 240- 73 463,268
N1-Ratcliffe Stadium, Fresno, CaliforniaN2-Rose Bowl, Pasadena, California*-First USC varsity night game; also first USC home game played outsideColiseum since that stadium was opened (USC served as the home team)+-USC’s first Coliseum night game
1945Coach: Jeff Cravath
Captain: Jim Callanan
Sept. 21 W ....UCLA (N)................... 13- 6 A .... 81,000Sept. 29 W ....California................... 13- 2 A .... 52,000Oct. 6 W ....St. Mary’s Pre-Flight... 26-14 H .... 25,000Oct. 13 L ..6.San Diego Navy (U)... 6-33 A .... 6,000Oct. 20 W .14.College of Pacific...... 52- 0 H .... 10,000Oct. 27 L .20.Washington (8:00).... 7-13 A .... c40,000Nov. 3 L ....St. Mary’s...............8 0-26 H .... 76,378Nov. 10 W ....California................... 14- 0 H .... 35,000Nov. 24 W ....Oregon State............. 34- 7 H .... 30,000Dec. 1 W .16.UCLA (HC)............... 26-15 H ...c103,000
(7-3-0, 5-1-0, 1st) 191-116 458,378ROSE BOWL
Jan. 1 L .11.Alabama................2 14-34 N1.... c93,000(7-4-0) 205-150 551,378
N1-Rose Bowl, Pasadena, California
1946Coach: Jeff Cravath
Captain: Doug Essick
Sept. 27 W ....Washington St.(N)(0:05) 13- 7 H .... 68,282Oct. 5 L ....Ohio State................. 0-21 H .... 80,047Oct. 12 L ....Oregon State............. 0- 6 N1.... 29,594Oct. 19 W ....Washington............... 28- 0 H .... 42,507Oct. 26 W ....Stanford.................... 28-20 A .... 50,000Nov. 2 W ....Oregon...................... 43- 0 H .... 45,885Nov. 9 W .14.California................. 14- 0 H .... 60,398Nov. 23 L .10.UCLA (HC) (R)........4 6-13 A .... 93,714Nov. 30 L .16.Notre Dame............2 6-26 A .... c55,298Dec. 21 W ....Tulane....................... 20-13 A .... 25,000
(6-4-0, 5-2-0, 3rd) 158-106 550,725N1-Multnomah Stadium, Portland, Oregon
1947Coach: Jeff CravathCaptain: Don Clark
Sept. 27 W ....Washington State....... 21- 0 H .... 48,173Oct. 4 T ....Rice (SC-2:10)........... 7- 7 H .... 64,231Oct. 11 W .20.Ohio State............... 32- 0 A .... 76,559Oct. 18 W .11.Oregon State........... 48- 6 H .... 61,301Oct. 25 W .10.California...............4 39-14 A .... c81,659Nov. 1 W ..5.Washington (R)......... 19- 0 A .... 32,000Nov. 8 W ..5.Stanford................... 14- 0 H .... 59,749Nov. 22 W ..4.UCLA...................18 6- 0 H ...c102,050Dec. 6 L ..3.Notre Dame (HC).....1 7-38 H ..*c104,953
(7-1-1, 6-0-0, 1st) 193-65 630,675ROSE BOWL
Jan. 1 L ..8.Michigan................2 0-49 N1.... c93,000(7-2-1) 193-114 723,675
N1-Rose Bowl, Pasadena, California*-Largest crowd for football, Los Angeles Memorial Coliseum
1948Coach: Jeff Cravath
Captain: Bob Bastian
Sept. 17 W ....Utah (N).................... 27- 0 H .... 55,211Sept. 24 W ....Oregon State (N)........ 21- 6 H .... 50,237Oct. 2 L ....Ohio State................. 0-20 A .... 75,102Oct. 9 W ....Rice.......................... 7- 0 H .... 49,531Oct. 16 L ....Oregon...................... 7- 8+ N1.... 32,600Oct. 23 W ....Stanford.................... 7- 6 A .... 40,000Oct. 30 L ....California.................4 7-13 H .... 90,890Nov. 13 W ....Washington............... 32- 7 H .... 44,345Nov. 20 W ....UCLA........................ 20-13 A .... 76,577Dec. 4 T ....Notre Dame(HC)(ND-0:35).2 14-14* H ...c100,571
(6-3-1, 4-2-0, 3rd) 142-87 615,064N1-Multnomah Stadium, Portland, Oregon*-Ended Notre Dame’s 21-game winning streak+-First time USC travelled by airplane to a game
1949Coach: Jeff Cravath Captain: Jim Bird
Sept. 24 W ....Navy......................... 42-20 H .... 62,787Oct. 1 W ....Washington State....... 35- 7 H .... 36,243Oct. 8 T ..8.Ohio State.............11 13-13 H .... 62,877Oct. 15 L .12.California...............9 10-16* A .... c81,500Oct. 22 W .19.Oregon.................... 40-13 H .... 47,098Oct. 29 W .15.Washington.............. 40-28 A .... 33,205Nov. 5 L .12.Stanford (HC)........... 13-34 H .... 70,041Nov. 19 W ....UCLA........................ 21- 7 H .... 75,026Nov. 26 L .17.Notre Dame (Cold)...1 0-32 A .... c57,214
(5-3-1, 4-2-0, 3rdT) 215-170 525,991*-Frank Gifford's 22-yard field goal in the fourth quarter was USC's first sinceMax Belko's field goal in the 1935 opener against Montana
1950Coach: Jeff Cravath
Captains: Paul McMurtry, Volney Peters
Sept. 29 L .12..Iowa (N)(U)(10:00) 14-20+ H .... 45,167Oct. 7 T ....Washington St.(SC-1:20) 20-20 A .... 16,000Oct. 14 L ....California (7:30).......7 7-13 H .... 55,468Oct. 21 L ....Navy......................... 14-27 N1.... 24,300Oct. 28 W ....Oregon...................... 30-21 H .... 27,008Nov. 4 T ....Stanford (SU-2:20)..... 7- 7 A .... 40,000Nov. 18 L ....Washington (R).......19 13-28 H .... 23,442Nov. 25 L ....UCLA........................ 0-39 A .... 51,906Dec. 2 W ....Notre Dame (HC)........ 9- 7* H .... 70,177
(2-5-2, 1-3-2, 7th) 114-182 353,468N1-Memorial Stadium, Baltimore, Maryland+-First USC night loss*-USC’s 300th victory
ALL-TIME USC RECORD

2006 FOOTBALL MEDIA GUIDE — PAGE 89
1951Coach: Jess Hill
Captains: Pat Cannamela, Dean Schneider
Sept. 22 W ....Washington State....... 31-21 H .... 28,876Sept. 29 W ....San Diego Navy.......... 41- 7 H .... 26,574Oct. 6 W ....Washington (5:54)..12 20-13 A .... 43,747Oct. 13 W .14.Oregon State........18 16-14 H .... 36,400Oct. 20 W .11.California (U)(2:44)..1 21-14* A .... c81,490Oct. 27 W ..6.Texas Christian......... 28-26 H .... 50,732Nov. 3 W ..7.Army (Cold).............. 28- 6 N1.... 16,508Nov. 10 L ..6.Stanford (HC)(2:00)..7 20-27 H .... 96,130Nov. 24 L .11.UCLA..................18 7-21 H .... 71,738Dec. 1 L .20.Notre Dame (R)(6:00) 12-19+ H .... 55,783
(7-3-0, 4-2-0, 4th) 224-168 507,978N1-Yankee Stadium, New York City, New York*-Ended California’s 38-game regular season undefeated streak+-USC’s first national telecast
1952Coach: Jess Hill
Captains: Bob Van Doren, Lou Welsh
Sept. 19 W .16.Washington State (N). 35- 7 H .... 58,288Sept. 26 W .16.Northwestern (N)...... 31- 0 H .... 59,756Oct. 4 W ..7.Army....................... 22- 0 H .... 48,433Oct. 10 W ..7.San Diego Navy (N)... 20- 6 H .... 40,137Oct. 18 W ..7.Oregon State............ 28- 6 N1.... 17,438Oct. 25 W ..7.California (HC).........4 10- 0 H .... 94,677Nov. 8 W ..6.Stanford................... 54- 7 A .... 55,000Nov. 15 W ..5.Washington (R)......17 33- 0 H .... 35,852Nov. 22 W ..4.UCLA.....................3 14-12 A .... 96,869Nov. 29 L. .2.Notre Dame (U)(Cold).7 0- 9 A .... c58,394
(9-1-0, 6-0-0, 1st) 247-47 564,844ROSE BOWL
Jan. 1 W ..5.Wisconsin.............11 7- 0 N2.. c101,500(10-1-0) 254-47 666,344
N1-Multnomah Stadium, Portland, OregonN2-Rose Bowl, Pasadena, California
1953Coach: Jess Hill
Captains: George Bozanic, Tom Nickoloff
Sept. 19 W ..8.Washington State...... 29-13 A .... 19,000Sept. 26 W ..8.Minnesota................. 17- 7 H .... 66,698Oct. 2 W ..7.Indiana (N)................ 27-14 H .... 49,578Oct. 10 T ..7.Washington(R)(SC-12:52) 13-13 A .... 31,816Oct. 17 W .13.Oregon State............ 37- 0 H .... 34,163Oct. 24 W .11.California................. 32-20 A .... 78,000Oct. 31 L ..7.Oregon (U)(13:38)..... 7-13 N1.... 17,772Nov. 7 W .17.Stanford (HC)(0:14).11 23-20 H .... 79,015Nov. 21 L ..9.UCLA.....................5 0-13 H .... 85,366Nov. 28 L .20.Notre Dame...........2 14-48 H .... 97,952
(6-3-1, 4-2-1, 3rd) 199-161 559,360N1-Multnomah Stadium, Portland, Oregon
1954Coach: Jess Hill
Captains: Ed Fouch, Lindon Crow
Sept. 17 W .17.Washington State (N) 39- 0 H .... 37,645Sept. 24 W .15.Pittsburgh (N)........... 27- 7 H .... 50,253Oct. 2 W ..9.Northwestern............ 12- 7 A .... 30,725Oct. 8 L ..9.Texas Christian (N)(U) 7-20 H .... 52,705Oct. 16 W ....Oregon...................... 24-14 N1.... 22,766Oct. 23 W .17.California................. 29-27 H .... 66,342Oct. 30 W .13.Oregon State........... 30- 0 H .... 30,065Nov. 6 W .10.Stanford.................. 21- 7 A .... 28,000Nov. 13 W ..8.Washington (HC)....... 41- 0 H .... 36,108Nov. 20 L ..7.UCLA.....................2 0-34 A ...c102,548Nov. 27 L .17.Notre Dame (R)(5:57).4 17-23 A .... c56,438
(8-3-0, 6-1-0, 2nd*) 251-139 513,595ROSE BOWL
Jan. 1 L .17.Ohio State (R).........1 7-20 N2.... 89,191(8-4-0) 258-159 602,786
N1-Multnomah Stadium, Portland, OregonN2-Rose Bowl, Pasadena, California*-UCLA finished first in PCC, but was ineligible for Rose Bowl because of thePCC’s “no-repeat” rule
1955Coach: Jess Hill
Captains: George Galli, Marv Goux
Sept. 17 W .13.Washington State..... 50-12 H .... 35,384Sept. 23 W ..9.Oregon (N)................ 42-15 H .... 37,538Sept. 30 W ..9.Texas (N)................. 19- 7 H .... 62,033Oct. 8 L .10.Washington (R)(6:07).18 0- 7 A .... 35,955Oct. 14 W .16.Wisconsin (N).........6 33-21 H .... 75,114Oct. 22 W .10.California................. 33- 6 A .... 51,000Oct. 29 L .10.Minnesota (Sn)......... 19-25 A .... c64,592Nov. 5 L .16.Stanford (HC)........... 20-28 H .... 63,265Nov. 19 L ....UCLA........................5 7-17 H .... 95,878Nov. 26 W ....Notre Dame (U)........5 42-20 H .... 94,892
(6-4-0, 3-3-0, 6th) 265-158 615,651
1956Coach: Jess Hill
Captains: Jon Arnett, Ellsworth Kissinger
Sept. 22 W .15.Texas (N)................. 44-20* A .... 47,000Sept. 28 W ..6.Oregon State (N)....... 21-13 H .... 53,714Oct. 6 W .10.Wisconsin................ 13- 6 A .... 52,944Oct. 20 W ..9.Washington.............. 35- 7 H .... 44,749Oct. 27 L ..6.Stanford................... 19-27 A .... 70,000Nov. 3 W .20.Washington State..... 28-12 A .... 13,000Nov. 10 W .16.California (HC).......... 20- 7 H .... 41,628Nov. 17 L .14.Oregon.................... 0- 7 N1.... 14,480Nov. 24 W ....UCLA........................ 10- 7 A .... 63,709Dec. 1 W .17.Notre Dame............. 28-20 H .... 64,538
(8-2-0, 5-2-0, 2ndT) 218-126 465,762N1-Multnomah Stadium, Portland, Oregon*-First USC night game outside CaliforniaUSC banned from Rose Bowl eligibility because of PCC penalty
1957Coach: Don Clark
Captains: Jim Conroy, Mike Henry
Sept. 21 L .19.Oregon State (N)...13 0-20 N1.... 36,855Sept. 28 L ....Michigan................10 6-16 H .... 44,739Oct. 4 L ....Pittsburgh (N)............. 14-20 H .... 43,489Oct. 19 L ....California................... 0-12 A .... 40,000Oct. 26 L ....Washington State....... 12-13 H .... 24,902Nov. 2 W ....Washington (6:30)...... 19-12 A .... 30,172Nov. 9 L ....Stanford (HC)............. 7-35 H .... 51,923Nov. 16 L ....Oregon..................16 7-16 H .... 30,975Nov. 23 L ....UCLA........................ 9-20 H .... 64,818Nov. 30 L ....Notre Dame (Sn).....12 12-40 A .... 54,793
(1-9-0, 1-6-0, 7thT) 86-204 422,666N1-Multnomah Stadium, Portland, OregonUSC banned from Rose Bowl eligibility because of PCC penalty
1958Coach: Don Clark
Captains: Ken Antle, Monte Clark
Sept. 19 W ....Oregon State (N)....12 21- 0 H .... 40,286Sept. 27 L ....Michigan................... 19-20 A .... 77,005Oct. 3 L ....North Carolina (N)...... 7- 8 H .... 43,238Oct. 11 L ....Oregon..................15 0-25 N1.... 32,734Oct. 18 L ....California (HC)........... 12-14 H .... 34,872Oct. 25 W ....Washington State (1:25) 14- 6 N2.... 25,000Nov. 1 W ....Stanford.................... 29- 6 A .... 52,000Nov. 8 W ....Washington............... 21- 6 H .... 32,987Nov. 22 T ....UCLA (USC-TD 6:50).. 15-15 A .... 58,507Nov. 29 L ....Notre Dame...........18 13-20 H .... 66,903
(4-5-1, 4-2-1, 3rd) 151-120 463,532N1-Multnomah Stadium, Portland, OregonN2-Spokane Memorial Stadium, Spokane, Washington
1959Coach: Don Clark
Captains: Ron Mix, Willie Wood
Sept. 19 W ....Oregon State (N)(R).... 27- 6 N1.... 23,895Sept. 25 W .11.Pittsburgh (N)........... 23- 0 H .... 34,172Oct. 2 W .11.Ohio State (N).......14 17- 0 H .... 49,592Oct. 17 W ..7.Washington (6:34).18 22-15 A .... 54,497Oct. 24 W ..5.Stanford................... 30-28 H .... 44,209Oct. 31 W ..6.California (12:13)...... 14- 7 A .... 37,000Nov. 7 W ..6.West Virginia............ 36- 0 H .... 34,066Nov. 14 W ..4.Baylor...................... 17- 8 H .... 43,832Nov. 21 L ..4.UCLA (HC)(U)(8:06)... 3-10 H .... 85,917Nov. 28 L ..7.Notre Dame (U)(Cold) 6-16 A .... 48,682
(8-2-0, 3-1-0, 1stT) 195-90 455,862N1-Multnomah Stadium, Portland, OregonUSC banned from post-season bowls because of NCAA penalty
ALL-TIME USC RECORD
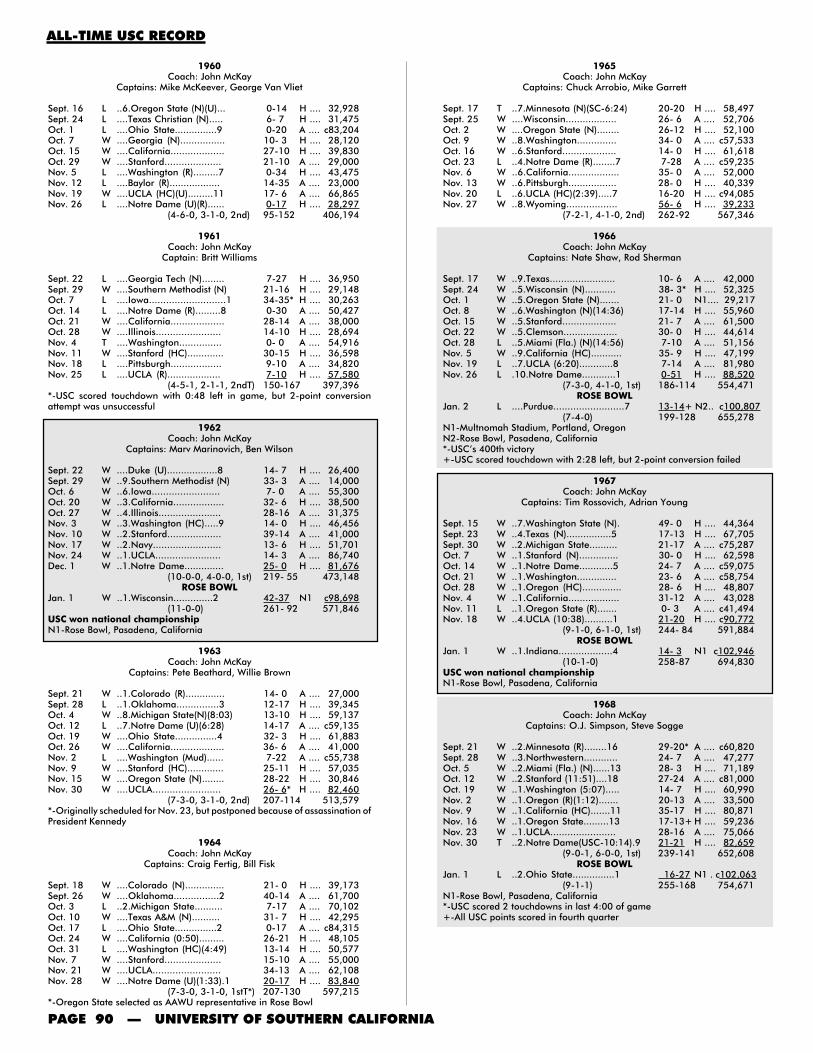
PAGE 90 — UNIVERSITY OF SOUTHERN CALIFORNIA
1965Coach: John McKay
Captains: Chuck Arrobio, Mike Garrett
Sept. 17 T ..7.Minnesota (N)(SC-6:24) 20-20 H .... 58,497Sept. 25 W ....Wisconsin.................. 26- 6 A .... 52,706Oct. 2 W ....Oregon State (N)........ 26-12 H .... 52,100Oct. 9 W ..8.Washington.............. 34- 0 A .... c57,533Oct. 16 W ..6.Stanford................... 14- 0 H .... 61,618Oct. 23 L ..4.Notre Dame (R)........7 7-28 A .... c59,235Nov. 6 W ..6.California.................. 35- 0 A .... 52,000Nov. 13 W ..6.Pittsburgh................. 28- 0 H .... 40,339Nov. 20 L ..6.UCLA (HC)(2:39).....7 16-20 H .... c94,085Nov. 27 W ..8.Wyoming.................. 56- 6 H .... 39,233
(7-2-1, 4-1-0, 2nd) 262-92 567,346
1966Coach: John McKay
Captains: Nate Shaw, Rod Sherman
Sept. 17 W ..9.Texas....................... 10- 6 A .... 42,000Sept. 24 W ..5.Wisconsin (N)........... 38- 3* H .... 52,325Oct. 1 W ..5.Oregon State (N)....... 21- 0 N1.... 29,217Oct. 8 W ..6.Washington (N)(14:36) 17-14 H .... 55,960Oct. 15 W ..5.Stanford................... 21- 7 A .... 61,500Oct. 22 W ..5.Clemson................... 30- 0 H .... 44,614Oct. 28 L ..5.Miami (Fla.) (N)(14:56) 7-10 A .... 51,156Nov. 5 W ..9.California (HC)........... 35- 9 H .... 47,199Nov. 19 L ..7.UCLA (6:20)............8 7-14 A .... 81,980Nov. 26 L .10.Notre Dame............1 0-51 H .... 88,520
(7-3-0, 4-1-0, 1st) 186-114 554,471ROSE BOWL
Jan. 2 L ....Purdue.........................7 13-14+ N2.. c100,807(7-4-0) 199-128 655,278
N1-Multnomah Stadium, Portland, OregonN2-Rose Bowl, Pasadena, California*-USC’s 400th victory+-USC scored touchdown with 2:28 left, but 2-point conversion failed
1967Coach: John McKay
Captains: Tim Rossovich, Adrian Young
Sept. 15 W ..7.Washington State (N). 49- 0 H .... 44,364Sept. 23 W ..4.Texas (N)................5 17-13 H .... 67,705Sept. 30 W ..2.Michigan State.......... 21-17 A .... c75,287Oct. 7 W ..1.Stanford (N).............. 30- 0 H .... 62,598Oct. 14 W ..1.Notre Dame............5 24- 7 A .... c59,075Oct. 21 W ..1.Washington.............. 23- 6 A .... c58,754Oct. 28 W ..1.Oregon (HC).............. 28- 6 H .... 48,807Nov. 4 W ..1.California.................. 31-12 A .... 43,028Nov. 11 L ..1.Oregon State (R)....... 0- 3 A .... c41,494Nov. 18 W ..4.UCLA (10:38)..........1 21-20 H .... c90,772
(9-1-0, 6-1-0, 1st) 244- 84 591,884ROSE BOWL
Jan. 1 W ..1.Indiana...................4 14- 3 N1 c102,946(10-1-0) 258-87 694,830
USC won national championshipN1-Rose Bowl, Pasadena, California
1968Coach: John McKay
Captains: O.J. Simpson, Steve Sogge
Sept. 21 W ..2.Minnesota (R)........16 29-20* A .... c60,820Sept. 28 W ..3.Northwestern............ 24- 7 A .... 47,277Oct. 5 W ..2.Miami (Fla.) (N)......13 28- 3 H .... 71,189Oct. 12 W ..2.Stanford (11:51)....18 27-24 A .... c81,000Oct. 19 W ..1.Washington (5:07)..... 14- 7 H .... 60,990Nov. 2 W ..1.Oregon (R)(1:12)....... 20-13 A .... 33,500Nov. 9 W ..1.California (HC).......11 35-17 H .... 80,871Nov. 16 W ..1.Oregon State.........13 17-13+ H .... 59,236Nov. 23 W ..1.UCLA....................... 28-16 A .... 75,066Nov. 30 T ..2.Notre Dame(USC-10:14).9 21-21 H .... 82,659
(9-0-1, 6-0-0, 1st) 239-141 652,608ROSE BOWL
Jan. 1 L ..2.Ohio State...............1 16-27 N1 . c102,063(9-1-1) 255-168 754,671
N1-Rose Bowl, Pasadena, California*-USC scored 2 touchdowns in last 4:00 of game+-All USC points scored in fourth quarter
ALL-TIME USC RECORD
1960Coach: John McKay
Captains: Mike McKeever, George Van Vliet
Sept. 16 L ..6.Oregon State (N)(U)... 0-14 H .... 32,928Sept. 24 L ....Texas Christian (N)..... 6- 7 H .... 31,475Oct. 1 L ....Ohio State...............9 0-20 A .... c83,204Oct. 7 W ....Georgia (N)................ 10- 3 H .... 28,120Oct. 15 W ....California................... 27-10 H .... 39,830Oct. 29 W ....Stanford.................... 21-10 A .... 29,000Nov. 5 L ....Washington (R).........7 0-34 H .... 43,475Nov. 12 L ....Baylor (R).................. 14-35 A .... 23,000Nov. 19 W ....UCLA (HC)(U).........11 17- 6 A .... 66,865Nov. 26 L ....Notre Dame (U)(R)...... 0-17 H .... 28,297
(4-6-0, 3-1-0, 2nd) 95-152 406,194
1961Coach: John McKay
Captain: Britt Williams
Sept. 22 L ....Georgia Tech (N)........ 7-27 H .... 36,950Sept. 29 W ....Southern Methodist (N) 21-16 H .... 29,148Oct. 7 L ....Iowa...........................1 34-35* H .... 30,263Oct. 14 L ....Notre Dame (R).........8 0-30 A .... 50,427Oct. 21 W ....California................... 28-14 A .... 38,000Oct. 28 W ....Illinois....................... 14-10 H .... 28,694Nov. 4 T ....Washington............... 0- 0 A .... 54,916Nov. 11 W ....Stanford (HC)............. 30-15 H .... 36,598Nov. 18 L ....Pittsburgh.................. 9-10 A .... 34,820Nov. 25 L ....UCLA (R)................... 7-10 H .... 57,580
(4-5-1, 2-1-1, 2ndT) 150-167 397,396*-USC scored touchdown with 0:48 left in game, but 2-point conversionattempt was unsuccessful
1962Coach: John McKay
Captains: Marv Marinovich, Ben Wilson
Sept. 22 W ....Duke (U)..................8 14- 7 H .... 26,400Sept. 29 W ..9.Southern Methodist (N) 33- 3 A .... 14,000Oct. 6 W ..6.Iowa........................ 7- 0 A .... 55,300Oct. 20 W ..3.California.................. 32- 6 H .... 38,500Oct. 27 W ..4.Illinois...................... 28-16 A .... 31,375Nov. 3 W ..3.Washington (HC).....9 14- 0 H .... 46,456Nov. 10 W ..2.Stanford................... 39-14 A .... 41,000Nov. 17 W ..2.Navy........................ 13- 6 H .... 51,701Nov. 24 W ..1.UCLA....................... 14- 3 A .... 86,740Dec. 1 W ..1.Notre Dame.............. 25- 0 H .... 81,676
(10-0-0, 4-0-0, 1st) 219- 55 473,148ROSE BOWL
Jan. 1 W ..1.Wisconsin..............2 42-37 N1 c98,698(11-0-0) 261- 92 571,846
USC won national championshipN1-Rose Bowl, Pasadena, California
1963Coach: John McKay
Captains: Pete Beathard, Willie Brown
Sept. 21 W ..1.Colorado (R).............. 14- 0 A .... 27,000Sept. 28 L ..1.Oklahoma...............3 12-17 H .... 39,345Oct. 4 W ..8.Michigan State(N)(8:03) 13-10 H .... 59,137Oct. 12 L ..7.Notre Dame (U)(6:28) 14-17 A .... c59,135Oct. 19 W ....Ohio State...............4 32- 3 H .... 61,883Oct. 26 W ....California................... 36- 6 A .... 41,000Nov. 2 L ....Washington (Mud)...... 7-22 A .... c55,738Nov. 9 W ....Stanford (HC)............. 25-11 H .... 57,035Nov. 15 W ....Oregon State (N)........ 28-22 H .... 30,846Nov. 30 W ....UCLA........................ 26- 6* H .... 82,460
(7-3-0, 3-1-0, 2nd) 207-114 513,579*-Originally scheduled for Nov. 23, but postponed because of assassination ofPresident Kennedy
1964Coach: John McKay
Captains: Craig Fertig, Bill Fisk
Sept. 18 W ....Colorado (N).............. 21- 0 H .... 39,173Sept. 26 W ....Oklahoma................2 40-14 A .... 61,700Oct. 3 L ..2.Michigan State.......... 7-17 A .... 70,102Oct. 10 W ....Texas A&M (N).......... 31- 7 H .... 42,295Oct. 17 L ....Ohio State...............2 0-17 A .... c84,315Oct. 24 W ....California (0:50)......... 26-21 H .... 48,105Oct. 31 L ....Washington (HC)(4:49) 13-14 H .... 50,577Nov. 7 W ....Stanford.................... 15-10 A .... 55,000Nov. 21 W ....UCLA........................ 34-13 A .... 62,108Nov. 28 W ....Notre Dame (U)(1:33).1 20-17 H .... 83,840
(7-3-0, 3-1-0, 1stT*) 207-130 597,215*-Oregon State selected as AAWU representative in Rose Bowl

2006 FOOTBALL MEDIA GUIDE — PAGE 91
1969Coach: John McKay
Captains: Jim Gunn, Bob Jensen
Sept. 20 W ..5.Nebraska.................. 31-21 A .... c67,058Sept. 27 W ..5.Northwestern (N)....... 48- 6 H .... 56,589Oct. 4 W ..5.Oregon State............ 31- 7 A .... c38,013Oct. 11 W ..4.Stanford (N)(0:00)..16 26-24 H .... 82,812Oct. 18 T ..3.Notre Dame(ND-6:51).11 14-14 A .... c59,075Oct. 25 W ..7.Georgia Tech (HC)..... 29-18 H .... 53,341Nov. 1 W ..6.California (0:57)........ 14- 9 A .... 51,000Nov. 8 W ..6.Washington State...... 28- 7 H .... 47,158Nov. 15 W ..6.Washington.............. 16- 7 A .... 51,403Nov. 22 W ..5.UCLA (1:32)............6 14-12 H .... c90,814
(9-0-1, 6-0-0, 1st) 251-125 597,263ROSE BOWL
Jan. 1 W ..5.Michigan................7 10- 3 N1... c103,878(10-0-1) 261-128 701,141
N1-Rose Bowl, Pasadena, California
1970Coach: John McKay
Captains: Charlie Weaver, Bob Chandler
Sept. 12 W ..3.Alabama (N)..........16 42-21 N1... c72,175Sept. 19 T ..3.Nebraska (N)(6:44-SC).9 21-21 H .... 73,768Sept. 26 W ..7.Iowa........................ 48- 0 A .... 56,131Oct. 3 W ..5.Oregon State (N)....... 45-13 H .... 57,769Oct. 10 L ..4.Stanford...............12 14-24 A .... c86,000Oct. 17 W .11.Washington (N)......... 28-25 H .... 56,166Oct. 24 L .10.Oregon (R)(U)(13:05) 7-10 A .... 34,000Oct. 31 L .18.California (HC)(4:59) 10-13 H .... 54,750Nov. 7 W .....Washington State...... 70-33 N2.... 14,500Nov. 21 L .....UCLA (N)................. 20-45 A .... 78,773Nov. 28 W .....Notre Dame (R)(U)...4 38-28 H .... 64,694
(6-4-1, 3-4-0, 6thT) 343-233 648,726N1-Legion Field, Birmingham, AlabamaN2-Joe Albi Stadium, Spokane, Washington
1971Coach: John McKay
Captains: John Vella, Willie Hall
Sept. 10 L ..5.Alabama (N)..........16 10-17 H .... 67,781Sept. 18 W .17.Rice (N)................... 24- 0 A .... 22,000Sept. 25 W .16.Illinois (N)................ 28- 0 H .... 49,390Oct. 2 L .17.Oklahoma..............8 20-33 A .... 61,826Oct. 9 L ....Oregon (N)(U)(7:43).... 23-28 H .... 50,111Oct. 16 L ....Stanford (N)(R).......15 18-33 H .... 65,375Oct. 23 W ....Notre Dame (U)........6 28-14 A .... c59,075Oct. 30 W .20.California................. 28- 0 A .... 54,000Nov. 6 W .17.Washington State (HC) 30-20 H .... 57,432Nov. 13 W .15.Washington (2:08).19 13-12 A .... c59,982Nov. 20 T .15.UCLA...................... 7- 7 H .... 68,426
(6-4-1, 3-2-1, 2nd) 229-164 615,034
1972Coach: John McKay
Captains: Sam Cunningham, John Grant
Sept. 9 W ..8.Arkansas (N)...........4 31-10 N1... c54,461Sept. 16 W ..1.Oregon State (N)....... 51- 6 H .... 56,305Sept. 23 W ..1.Illinois...................... 55-20 A .... 61,277Sept. 30 W ..1.Michigan State (N)..... 51- 6 H .... 63,934Oct. 7 W ..1.Stanford...............15 30-21 A .... c84,000Oct. 14 W ..1.California.................. 42-14 H .... 56,488Oct. 21 W ..1.Washington (HC)...18 34- 7 H .... 59,151Oct. 28 W ..1.Oregon (R)................ 18- 0 A .... 32,000Nov. 4 W ..1.Washington State...... 44- 3 N2.... 46,000Nov. 18 W ..1.UCLA (N)..............14 24- 7 A .... 82,929Dec. 2 W ..1.Notre Dame..........10 45-23 H .... 75,243
(11-0-0, 7-0-0, 1st) 425-117 671,788ROSE BOWL
Jan. 1 W ..1.Ohio State............3 42-17 N3... c106,869(12-0-0) 467-134 778,657
USC won national championshipN1-War Memorial Stadium, Little Rock, ArkansasN2-Husky Stadium, Seattle, WashingtonN3-Rose Bowl, Pasadena, California
1973Coach: John McKay
Captains: Lynn Swann, Artimus Parker
Sept. 15 W ..1.Arkansas (N)............. 17- 0 H .... 73,231Sept. 22 W ..1.Georgia Tech............ 23- 6 A .... 58,228Sept. 29 T ..1.Oklahoma (N)..........8 7- 7 H .... 84,016Oct. 6 W ..4.Oregon State (R)....... 21- 7 A .... 21,732Oct. 13 W ..4.Washington State...... 46-35 H .... 50,975Oct. 20 W ..6.Oregon (HC).............. 31-10 H .... 53,155Oct. 27 L ..6.Notre Dame (R).......8 14-23 A .... c59,075Nov. 3 W ..9.California.................. 50-14 A .... 48,000Nov. 10 W ..8.Stanford (0:03)......... 27-26* H .... 63,806Nov. 17 W ..9.Washington.............. 42-19 A .... 55,500Nov. 24 W ..9.UCLA.....................8 23-13 H .... 88,037
(9-1-1, 7-0-0, 1st) 301-160 655,755ROSE BOWL
Jan. 1 L ..7.Ohio State..............4 21-42 N1... c105,267(9-2-1) 322-202 761,510
N1-Rose Bowl, Pasadena, California*-USC scored 10 points in last 2:10
1974Coach: John McKay
Captains: Pat Haden, Richard Wood
Sept. 14 L ..5.Arkansas (N).........20 7-22 N1... c54,622Sept. 28 W .18.Pittsburgh..............8 16- 7 A .... 52,934Oct. 5 W ..9.Iowa........................ 41- 3 H .... 52,095Oct. 12 W ..7.Washington State (N). 54- 7 N2.... 32,000Oct. 19 W ..6.Oregon..................... 16- 7 A .... 32,500Oct. 26 W ..6.Oregon State (HC)..... 31-10 H .... 52,392Nov. 2 T ..6.California.................. 15-15 H .... 53,921Nov. 9 W .11.Stanford.................. 34-10 A .... c83,500Nov. 16 W ..8.Washington.............. 42-11 H .... 51,157Nov. 23 W ..8.UCLA....................... 34- 9 A .... 82,467Nov. 30 W ..6.Notre Dame............5 55-24* H .... 83,552
(9-1-1, 6-0-1, 1st) 345-125 631,140ROSE BOWL
Jan. 1 W ..5.Ohio State (2:03)....3 18-17 N3 c106,721(10-1-1) 363-142 737,861
USC won national championshipN1-War Memorial Stadium, Little Rock, ArkansasN2-Joe Albi Stadium, Spokane, WashingtonN3-Rose Bowl, Pasadena, California*-USC trailed 24-0 late in second quarter before scoring 55 unanswered pointsin less than 17 minutes
1975Coach: John McKay
Captains: Kevin Bruce, Danny Reece
Sept. 12 W ..4.Duke (N)................... 35- 7 H .... 56,727Sept. 19 W ..4.Oregon State (N)....... 24- 7 H .... 50,165Sept. 27 W ..3.Purdue..................... 19- 6 H .... 56,170Oct. 4 W ..3.Iowa........................ 27-16 A .... 54,600Oct. 11 W ..3.Washington State...... 28-10 H .... 47,468Oct. 18 W ..3.Oregon (HC).............. 17- 3 H .... 50,542Oct. 25 W ..3.Notre Dame..........14 24-17 A .... c59,075Nov. 1 L ..4.California.................. 14-28 A .... 58,871Nov. 8 L ..9.Stanford (0:00)......... 10-13 H .... 68,249Nov. 15 L .13.Washington (R)(8:23) 7- 8 A .... 53,700Nov. 28 L ....UCLA (N)...............14 22-25 H .... 80,927
(7-4-0, 3-4-0, 5th) 227-140 636,494LIBERTY BOWL
Dec. 22 W ....Texas A&M (U)(N)....2 20- 0 N1.... 52,129(8-4-0) 247-140 688,623
N1-Liberty Bowl Memorial Stadium, Memphis, Tennessee
1976Coach: John Robinson
Captains: Ricky Bell, Vince Evans, Eric Williams
Sept. 11 L ..8.Missouri (N).............. 25-46 H .... 49,535Sept. 18 W ....Oregon (N)................. 53- 0 A .... c40,600Sept. 25 W .19.Purdue.................... 31-13 A .... 65,425Oct. 2 W .13.Iowa (N).................. 55- 0 H .... 55,518Oct. 9 W .11.Washington State (N) 23-14 N1.... 37,268Oct. 23 W ..7.Oregon State (HC)..... 56- 0 H .... 53,216Oct. 30 W ..4.California.................. 20- 6 H .... 60,323Nov. 6 W ..4.Stanford................... 48-24 A .... 76,500Nov. 13 W ..3.Washington.............. 20- 3 H .... 49,264Nov. 20 W ..3.UCLA.....................2 24-14 A .... c90,519Nov. 27 W ..3.Notre Dame..........13 17-13 H .... 76,561
(10-1-0, 7-0-0, 1st) 372-133 654,729ROSE BOWL
Jan. 1 W ..3.Michigan................2 14- 6 N2. c106,182(11-1-0) 386-139 760,911
N1-Kingdome, Seattle, WashingtonN2-Rose Bowl, Pasadena, California
ALL-TIME USC RECORD

PAGE 92 — UNIVERSITY OF SOUTHERN CALIFORNIA
ALL-TIME USC RECORD
1977 Coach: John Robinson
Captains: Rob Hertel, Clay Matthews
Sept. 10 W ..4.Missouri................... 27-10 A .... c65,298Sept. 17 W ..2.Oregon State (N)(11:48) 17-10 A .... 31,143Sept. 24 W ..2.Texas Christian......... 51- 0 H .... 54,620Sept. 30 W ..2.Washington State (N). 41- 7* H .... 61,809Oct. 8 L ..1.Alabama.................7 20-21% H .... 63,140Oct. 15 W ..6.Oregon (HC).............. 33-15 H .... 51,120Oct. 22 L ..5.Notre Dame...........11 19-49 A .... c59,075Oct. 29 L .10.California................. 14-17 A .... c76,780Nov. 5 W .16.Stanford.................. 49- 0 H .... 65,101Nov. 12 L .14.Washington............. 10-28 A .... c59,501Nov. 25 W ....UCLA (N)(0:02)......17 29-27 H .... 86,168
(7-4-0, 5-2-0, 2ndT) 310-184 673,755BLUEBONNET BOWL
Dec. 31 W .20.Texas A&M (N).....17 47-28 N1 c52,842(8-4-0) 357-212 726,597
N1-Astrodome, Houston, Texas*-USC’s 500th victory%-USC scored touchdown with 0:35 left, but 2-point conversion attempt failed
1978Coach: John Robinson
Captains: Lynn Cain, Rich Dimler
Sept. 9 W ..9.Texas Tech............... 17- 9 H .... 50,321Sept. 16 W ..8.Oregon (N)................ 37-10 A .... 31,000Sept. 23 W ..7.Alabama.................1 24-14 N1.... c77,313Sept. 29 W ..3.Michigan State (N)..... 30- 9 H .... 65,319Oct. 14 L ..2.Arizona State (N)....... 7-20 A .... c70,138Oct. 21 W ..7.Oregon State (HC)..... 38- 7 H .... 53,734Oct. 28 W ..6.California.................. 42-17 H .... 56,954Nov. 4 W ..6.Stanford................... 13- 7 A .... c84,084Nov. 11 W ..5.Washington (R)......19 28-10 H .... 54,071Nov. 18 W ..5.UCLA.....................14 17-10 A .... c90,387Nov. 25 W ..3.Notre Dame (0:02)...8 27-25 H .... 84,256Dec. 2 W ..3.Hawai‘i (N)................ 21- 5 A .... c48,767
(11-1-0, 6-1-0, 1st) 301-143 766,344ROSE BOWL
Jan. 1 W ..3.Michigan................5 17-10 N2.c105,629(12-1-0) 318-153 871,973
USC won national championshipN1-Legion Field, Birmingham, AlabamaN2-Rose Bowl, Pasadena, California
1979Coach: John Robinson
Captains: Dennis Johnson, Charles White
Sept. 8 W ..1.Texas Tech (N).......... 21- 7 A .... c52,991Sept. 15 W ..1.Oregon State............ 42- 5 A .... 32,000Sept. 22 W ..1.Minnesota................ 48-14 H .... 61,766Sept. 29 W ..1.LSU (N)(0:32).......20 17-12 A .... c78,322Oct. 6 W ..1.Washington State...... 50-21 H .... 55,117Oct. 13 T ..1.Stanford (HC)(SU-4:30) 21-21 H .... 76,067Oct. 20 W ..4.Notre Dame............9 42-23 A .... c59,075Oct. 27 W ..3.California.................. 24-14 A .... c76,780Nov. 3 W ..3.Arizona.................... 34- 7 H .... 62,054Nov. 10 W ..4.Washington (11:50).15 24-17 A .... c60,527Nov. 24 W ..4.UCLA....................... 49-14 H .... c88,214
(10-0-1, 6-0-1, 1st) 372-155 702,913ROSE BOWL
Jan. 1 W..3.Ohio State (1:32)......1 17-16 N1.c105,526(11-0-1) 389-171 808,439
N1-Rose Bowl, Pasadena, California
1980Coach: John Robinson
Captains: Ronnie Lott, Keith Van Horne
Sept. 13 W ..5.Tennessee (N)(0:00).. 20-17 A .... c95,049Sept. 20 W ..4.South Carolina (N).20 23-13 H .... 58,385Sept. 27 W ..5.Minnesota................. 24- 7 A .... c55,115Oct. 4 W ..4.Arizona State (HC)..... 23-21 H .... 69,052Oct. 11 W ..2.Arizona (N)............... 27-10 A .... c54,789Oct. 18 T ..2.Oregon..................... 7- 7 A .... c42,733Nov. 1 W ..7.California.................. 60- 7 H .... 55,658Nov. 8 W ..4.Stanford................... 34- 9 A .... c84,892Nov. 15 L ..2.Washington (U)......... 10-20* H .... 55,515Nov. 22 L .12.UCLA (2:07).........18 17-20 A .... 83,491Dec. 6 W .17.Notre Dame...........2 20- 3 H .... 82,663
(8-2-1, 4-2-1, 3rd) 265-134 737,342USC banned from post-season bowls because of Pacific-10 penalty*-Ended USC 28-game unbeaten streak
1981Coach: John Robinson
Captains: Marcus Allen, Chip Banks
Sept. 12 W ..5.Tennessee (N)........... 43- 7 H .... 62,147Sept. 19 W ..2.Indiana..................... 21- 0 A .... 51,167Sept. 26 W ..1.Oklahoma (0:02).....2 28-24 H .... 85,651Oct. 3 W ..1.Oregon State............ 56-22 A .... 33,000Oct. 10 L ..1.Arizona (U)............... 10-13 H .... 56,315Oct. 17 W ..7.Stanford (HC)............ 25-17 H .... 76,291Oct. 24 W ..5.Notre Dame (4:52).... 14- 7 A .... c59,075Oct. 31 W ..4.Washington State..14 41-17 H .... 60,972Nov. 7 W ..3.California.................. 21- 3 A .... 74,000Nov. 14 L ..3.Washington.............. 3-13 A .... 47,347Nov. 21 W .10.UCLA (2:14)........15 22-21 H .... c89,432
(9-2-0, 5-2-0, 2ndT) 284-144 695,397FIESTA BOWL
Jan. 1 L ..8.Penn State..............7 10-26 N1...c71,053(9-3-0) 294-170 766,450
N1-Sun Devil Stadium, Tempe, Arizona
1982Coach: John Robinson
Captains: George Achica, Joey Browner, Bruce Matthews
Sept. 11 L .10.Florida ................11 9-17 A .... c73,238Sept. 18 W .19.Indiana.................... 28- 7 H .... 50,724Sept. 25 W .18.Oklahoma................ 12- 0 A .... c75,008Oct. 2 W .16.Oregon.................... 38- 7 H .... 47,181Oct. 16 W .14.Stanford.................. 41-21 A .... 75,185Oct. 23 W .12.Oregon State (HC).... 38- 0 H .... 50,035Oct. 30 L .12.Arizona State (N)....7 10-17 A .... c71,071Nov. 6 W .16.California................. 42- 0 H .... 54,670Nov. 13 W .16.Arizona (N).............. 48-41 A .... c55,110Nov. 20 L .15.UCLA..................11 19-20* A .... c95,763Nov. 27 W .17.Notre Dame (0:48).... 17-13 H .... 76,459
(8-3-0, 5-2-0, 3rdT) 302-143 724,444USC banned from post-season bowls because of NCAA penalty*-USC scored touchdown with 0:00 left, but 2-point conversion attempt failed
1983Coach: Ted Tollner
Captains: Tony Brewer, Jeff Brown, Keith Browner,Fred Cornwell, Tony Slaton
Sept. 10 T ..9.Florida (USC-0:00).18 19-19 H .... 53,948Sept. 17 W .14.Oregon State (N)...... 33-10 A .... 28,000Sept. 24 L .10.Kansas (U)............... 20-26 H .... 49,255Oct. 1 L ....South Carolina (N)...... 14-38 A .... c74,200Oct. 8 W ....Washington State....... 38-17 H .... 43,106Oct. 15 L ....Arizona State (HC)..18 14-34 H .... 58,664Oct. 22 L ....Notre Dame............... 6-27 A .... c59,075Oct. 29 W ....California................... 19- 9 A .... 65,867Nov. 5 W ....Stanford.................... 30- 7 H .... 50,867Nov. 12 L ....Washington...........18 0-24* A .... c60,690Nov. 19 L ....UCLA........................ 17-27 H .... 83,763
(4-6-1, 4-3-0, 4th) 210-238 624,435USC banned from post-season bowls because of NCAA penalty*-First shutout of USC in 187 games
1984Coach: Ted Tollner
Captains: Neil Hope, Ken Ruettgers
Sept. 8 W ....Utah State................. 42- 7 H .... 45,067Sept. 22 W .17.Arizona State (N)(9:14) 6- 3 A .... c70,219Sept. 29 L .15.LSU........................ 3-23 H .... 60,128Oct. 6 W ....Washington State....... 29-27 A .... 33,000Oct. 13 W ....Oregon...................... 19- 9 A .... 29,581Oct. 20 W ....Arizona (HC).............. 17-14 H .... 65,411Oct. 27 W .20.California................. 31- 7 H .... 52,692Nov. 3 W .18.Stanford.................. 20-11 A .... 74,432Nov. 10 W .12.Washington............1 16- 7 H .... 71,838Nov. 17 L ..7.UCLA....................... 10-29 A .... 90,096Nov. 24 L .14.Notre Dame (R)........ 7-19 H .... 66,342
(8-3-0, 7-1-0, 1st) 200-156 658,806ROSE BOWL
Jan. 1 W .18.Ohio State.............6 20-17 N1.c102,594(9-3-0) 220-173 761,400
N1-Rose Bowl, Pasadena, California
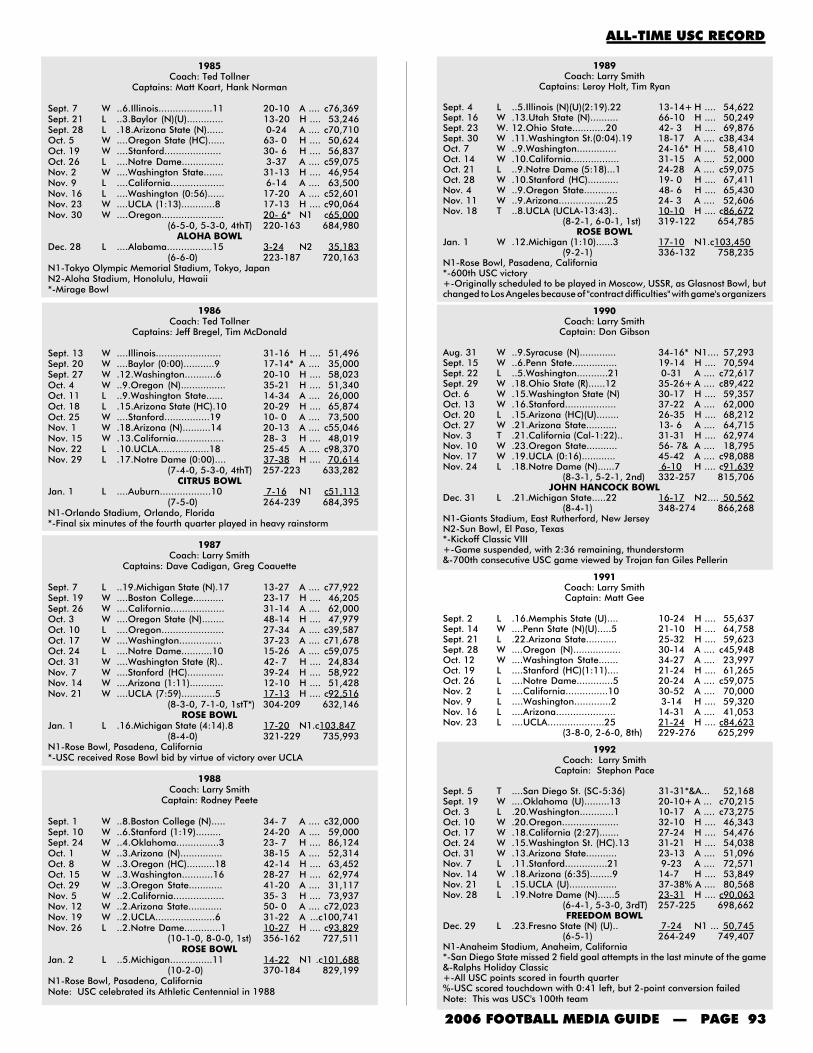
2006 FOOTBALL MEDIA GUIDE — PAGE 93
1985Coach: Ted Tollner
Captains: Matt Koart, Hank Norman
Sept. 7 W ..6.Illinois...................11 20-10 A .... c76,369Sept. 21 L ..3.Baylor (N)(U)............. 13-20 H .... 53,246Sept. 28 L .18.Arizona State (N)...... 0-24 A .... c70,710Oct. 5 W ....Oregon State (HC)...... 63- 0 H .... 50,624Oct. 19 W ....Stanford.................... 30- 6 H .... 56,837Oct. 26 L ....Notre Dame............... 3-37 A .... c59,075Nov. 2 W ....Washington State....... 31-13 H .... 46,954Nov. 9 L ....California................... 6-14 A .... 63,500Nov. 16 L ....Washington (0:56)...... 17-20 A .... c52,601Nov. 23 W ....UCLA (1:13)............8 17-13 H .... c90,064Nov. 30 W ....Oregon...................... 20- 6* N1 c65,000
(6-5-0, 5-3-0, 4thT) 220-163 684,980ALOHA BOWL
Dec. 28 L ....Alabama................15 3-24 N2 35,183(6-6-0) 223-187 720,163
N1-Tokyo Olympic Memorial Stadium, Tokyo, JapanN2-Aloha Stadium, Honolulu, Hawaii*-Mirage Bowl
1986Coach: Ted Tollner
Captains: Jeff Bregel, Tim McDonald
Sept. 13 W ....Illinois....................... 31-16 H .... 51,496Sept. 20 W ....Baylor (0:00)...........9 17-14* A .... 35,000Sept. 27 W .12.Washington...........6 20-10 H .... 58,023Oct. 4 W ..9.Oregon (N)................ 35-21 H .... 51,340Oct. 11 L ..9.Washington State...... 14-34 A .... 26,000Oct. 18 L .15.Arizona State (HC).10 20-29 H .... 65,874Oct. 25 W ....Stanford................19 10- 0 A .... 73,500Nov. 1 W .18.Arizona (N)..........14 20-13 A .... c55,046Nov. 15 W .13.California................. 28- 3 H .... 48,019Nov. 22 L .10.UCLA..................18 25-45 A .... c98,370Nov. 29 L .17.Notre Dame (0:00).... 37-38 H .... 70,614
(7-4-0, 5-3-0, 4thT) 257-223 633,282CITRUS BOWL
Jan. 1 L ....Auburn..................10 7-16 N1 c51,113(7-5-0) 264-239 684,395
N1-Orlando Stadium, Orlando, Florida*-Final six minutes of the fourth quarter played in heavy rainstorm
1987Coach: Larry Smith
Captains: Dave Cadigan, Greg Coauette
Sept. 7 L ..19.Michigan State (N).17 13-27 A .... c77,922Sept. 19 W ....Boston College........... 23-17 H .... 46,205Sept. 26 W ....California................... 31-14 A .... 62,000Oct. 3 W ....Oregon State (N)........ 48-14 H .... 47,979Oct. 10 L ....Oregon...................... 27-34 A .... c39,587Oct. 17 W ....Washington............... 37-23 A .... c71,678Oct. 24 L ....Notre Dame...........10 15-26 A .... c59,075Oct. 31 W ....Washington State (R).. 42- 7 H .... 24,834Nov. 7 W ....Stanford (HC)............. 39-24 H .... 58,922Nov. 14 W ....Arizona (1:11)............ 12-10 H .... 51,428Nov. 21 W ....UCLA (7:59)............5 17-13 H .... c92,516
(8-3-0, 7-1-0, 1stT*) 304-209 632,146ROSE BOWL
Jan. 1 L .16.Michigan State (4:14).8 17-20 N1.c103,847(8-4-0) 321-229 735,993
N1-Rose Bowl, Pasadena, California*-USC received Rose Bowl bid by virtue of victory over UCLA
1988Coach: Larry Smith
Captain: Rodney Peete
Sept. 1 W ..8.Boston College (N)..... 34- 7 A .... c32,000Sept. 10 W ..6.Stanford (1:19)......... 24-20 A .... 59,000Sept. 24 W ..4.Oklahoma...............3 23- 7 H .... 86,124Oct. 1 W ..3.Arizona (N)............... 38-15 A .... 52,314Oct. 8 W ..3.Oregon (HC)..........18 42-14 H .... 63,452Oct. 15 W ..3.Washington...........16 28-27 H .... 62,974Oct. 29 W ..3.Oregon State............ 41-20 A .... 31,117Nov. 5 W ..2.California.................. 35- 3 H .... 73,937Nov. 12 W ..2.Arizona State............ 50- 0 A .... c72,023Nov. 19 W ..2.UCLA.....................6 31-22 A ...c100,741Nov. 26 L ..2.Notre Dame.............1 10-27 H .... c93,829
(10-1-0, 8-0-0, 1st) 356-162 727,511ROSE BOWL
Jan. 2 L ..5.Michigan...............11 14-22 N1 .c101,688(10-2-0) 370-184 829,199
N1-Rose Bowl, Pasadena, CaliforniaNote: USC celebrated its Athletic Centennial in 1988
1989Coach: Larry Smith
Captains: Leroy Holt, Tim Ryan
Sept. 4 L ..5.Illinois (N)(U)(2:19).22 13-14+ H .... 54,622Sept. 16 W .13.Utah State (N).......... 66-10 H .... 50,249Sept. 23 W. 12.Ohio State............20 42- 3 H .... 69,876Sept. 30 W .11.Washington St.(0:04).19 18-17 A .... c38,434Oct. 7 W ..9.Washington.............. 24-16* H .... 58,410Oct. 14 W .10.California................. 31-15 A .... 52,000Oct. 21 L ..9.Notre Dame (5:18)...1 24-28 A .... c59,075Oct. 28 W .10.Stanford (HC)........... 19- 0 H .... 67,411Nov. 4 W ..9.Oregon State............ 48- 6 H .... 65,430Nov. 11 W ..9.Arizona.................25 24- 3 A .... 52,606Nov. 18 T ..8.UCLA (UCLA-13:43).. 10-10 H .... c86,672
(8-2-1, 6-0-1, 1st) 319-122 654,785ROSE BOWL
Jan. 1 W .12.Michigan (1:10)......3 17-10 N1.c103,450(9-2-1) 336-132 758,235
N1-Rose Bowl, Pasadena, California*-600th USC victory+-Originally scheduled to be played in Moscow, USSR, as Glasnost Bowl, butchanged to Los Angeles because of "contract difficulties" with game's organizers
1990Coach: Larry Smith
Captain: Don Gibson
Aug. 31 W ..9.Syracuse (N)............. 34-16* N1.... 57,293Sept. 15 W ..6.Penn State................ 19-14 H .... 70,594Sept. 22 L ..5.Washington...........21 0-31 A .... c72,617Sept. 29 W .18.Ohio State (R)......12 35-26+ A .... c89,422Oct. 6 W .15.Washington State (N) 30-17 H .... 59,357Oct. 13 W .16.Stanford.................. 37-22 A .... 62,000Oct. 20 L .15.Arizona (HC)(U)........ 26-35 H .... 68,212Oct. 27 W .21.Arizona State........... 13- 6 A .... 64,715Nov. 3 T .21.California (Cal-1:22).. 31-31 H .... 62,974Nov. 10 W .23.Oregon State........... 56- 7& A .... 18,795Nov. 17 W .19.UCLA (0:16)............ 45-42 A .... c98,088Nov. 24 L .18.Notre Dame (N)......7 6-10 H .... c91,639
(8-3-1, 5-2-1, 2nd) 332-257 815,706JOHN HANCOCK BOWL
Dec. 31 L .21.Michigan State.....22 16-17 N2.... 50,562(8-4-1) 348-274 866,268
N1-Giants Stadium, East Rutherford, New JerseyN2-Sun Bowl, El Paso, Texas*-Kickoff Classic VIII+-Game suspended, with 2:36 remaining, thunderstorm&-700th consecutive USC game viewed by Trojan fan Giles Pellerin
1991Coach: Larry SmithCaptain: Matt Gee
Sept. 2 L .16.Memphis State (U).... 10-24 H .... 55,637Sept. 14 W ....Penn State (N)(U).....5 21-10 H .... 64,758Sept. 21 L .22.Arizona State........... 25-32 H .... 59,623Sept. 28 W ....Oregon (N)................. 30-14 A .... c45,948Oct. 12 W ....Washington State....... 34-27 A .... 23,997Oct. 19 L ....Stanford (HC)(1:11).... 21-24 H .... 61,265Oct. 26 L ....Notre Dame.............5 20-24 A .... c59,075Nov. 2 L ....California...............10 30-52 A .... 70,000Nov. 9 L ....Washington.............2 3-14 H .... 59,320Nov. 16 L ....Arizona..................... 14-31 A .... 41,053Nov. 23 L ....UCLA....................25 21-24 H .... c84,623
(3-8-0, 2-6-0, 8th) 229-276 625,299
1992Coach: Larry Smith
Captain: Stephon Pace
Sept. 5 T ....San Diego St. (SC-5:36) 31-31*&A... 52,168Sept. 19 W ....Oklahoma (U).........13 20-10+ A ... c70,215Oct. 3 L .20.Washington............1 10-17 A .... c73,275Oct. 10 W .20.Oregon.................... 32-10 H .... 46,343Oct. 17 W .18.California (2:27)....... 27-24 H .... 54,476Oct. 24 W .15.Washington St. (HC).13 31-21 H .... 54,038Oct. 31 W .13.Arizona State........... 23-13 A .... 51,096Nov. 7 L .11.Stanford...............21 9-23 A .... 72,571Nov. 14 W .18.Arizona (6:35)........9 14-7 H .... 53,849Nov. 21 L .15.UCLA (U)................. 37-38% A .... 80,568Nov. 28 L .19.Notre Dame (N)......5 23-31 H .... c90,063
(6-4-1, 5-3-0, 3rdT) 257-225 698,662FREEDOM BOWL
Dec. 29 L .23.Fresno State (N) (U).. 7-24 N1 ... 50,745(6-5-1) 264-249 749,407
N1-Anaheim Stadium, Anaheim, California*-San Diego State missed 2 field goal attempts in the last minute of the game&-Ralphs Holiday Classic+-All USC points scored in fourth quarter%-USC scored touchdown with 0:41 left, but 2-point conversion failedNote: This was USC's 100th team
ALL-TIME USC RECORD
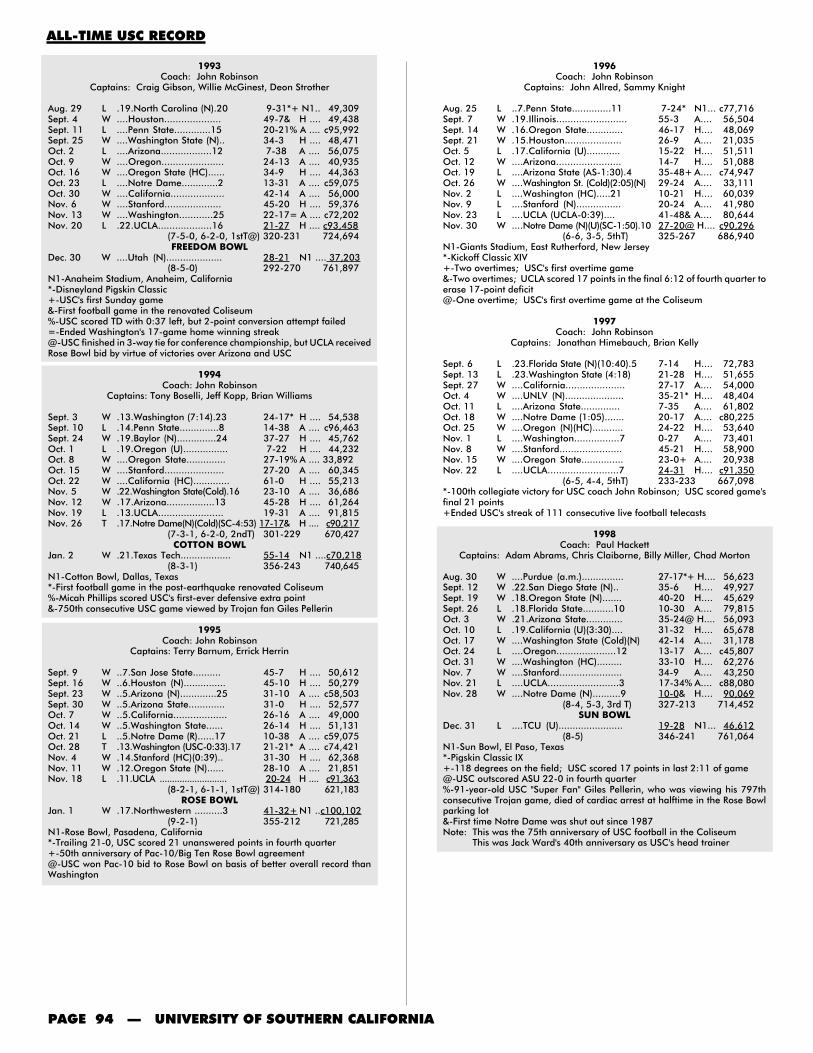
PAGE 94 — UNIVERSITY OF SOUTHERN CALIFORNIA
1993Coach: John Robinson
Captains: Craig Gibson, Willie McGinest, Deon Strother
Aug. 29 L .19.North Carolina (N).20 9-31*+ N1.. 49,309Sept. 4 W ....Houston.................... 49-7& H .... 49,438Sept. 11 L ....Penn State.............15 20-21% A .... c95,992Sept. 25 W ....Washington State (N).. 34-3 H .... 48,471Oct. 2 L ....Arizona..................12 7-38 A .... 56,075Oct. 9 W ....Oregon...................... 24-13 A .... 40,935Oct. 16 W ....Oregon State (HC)...... 34-9 H .... 44,363Oct. 23 L ....Notre Dame.............2 13-31 A .... c59,075Oct. 30 W ....California................... 42-14 A .... 56,000Nov. 6 W ....Stanford.................... 45-20 H .... 59,376Nov. 13 W ....Washington............25 22-17= A .... c72,202Nov. 20 L .22.UCLA...................16 21-27 H .... c93,458
(7-5-0, 6-2-0, 1stT@) 320-231 724,694FREEDOM BOWL
Dec. 30 W ....Utah (N).................... 28-21 N1 .... 37,203(8-5-0) 292-270 761,897
N1-Anaheim Stadium, Anaheim, California*-Disneyland Pigskin Classic+-USC's first Sunday game&-First football game in the renovated Coliseum%-USC scored TD with 0:37 left, but 2-point conversion attempt failed=-Ended Washington's 17-game home winning streak@-USC finished in 3-way tie for conference championship, but UCLA receivedRose Bowl bid by virtue of victories over Arizona and USC
1994Coach: John Robinson
Captains: Tony Boselli, Jeff Kopp, Brian Williams
Sept. 3 W .13.Washington (7:14).23 24-17* H .... 54,538Sept. 10 L .14.Penn State..............8 14-38 A .... c96,463Sept. 24 W .19.Baylor (N)..............24 37-27 H .... 45,762Oct. 1 L .19.Oregon (U)................ 7-22 H .... 44,232Oct. 8 W ....Oregon State.............. 27-19% A .... 33,892Oct. 15 W ....Stanford..................... 27-20 A .... 60,345Oct. 22 W ....California (HC)............. 61-0 H .... 55,213Nov. 5 W .22.Washington State(Cold).16 23-10 A .... 36,686Nov. 12 W .17.Arizona.................13 45-28 H .... 61,264Nov. 19 L .13.UCLA....................... 19-31 A .... 91,815Nov. 26 T .17.Notre Dame(N)(Cold)(SC-4:53) 17-17& H .... c90,217
(7-3-1, 6-2-0, 2ndT) 301-229 670,427COTTON BOWL
Jan. 2 W .21.Texas Tech.................. 55-14 N1 ....c70,218(8-3-1) 356-243 740,645
N1-Cotton Bowl, Dallas, Texas*-First football game in the post-earthquake renovated Coliseum%-Micah Phillips scored USC's first-ever defensive extra point&-750th consecutive USC game viewed by Trojan fan Giles Pellerin
1995Coach: John Robinson
Captains: Terry Barnum, Errick Herrin
Sept. 9 W ..7.San Jose State.......... 45-7 H .... 50,612Sept. 16 W ..6.Houston (N)............... 45-10 H .... 50,279Sept. 23 W ..5.Arizona (N).............25 31-10 A .... c58,503Sept. 30 W ..5.Arizona State............. 31-0 H .... 52,577Oct. 7 W ..5.California................... 26-16 A .... 49,000Oct. 14 W ..5.Washington State...... 26-14 H .... 51,131Oct. 21 L ..5.Notre Dame (R)......17 10-38 A .... c59,075Oct. 28 T .13.Washington (USC-0:33).17 21-21* A .... c74,421Nov. 4 W .14.Stanford (HC)(0:39).. 31-30 H .... 62,368Nov. 11 W .12.Oregon State (N)...... 28-10 A .... 21,851Nov. 18 L .11.UCLA ........................... 20-24 H .... c91,363
(8-2-1, 6-1-1, 1stT@) 314-180 621,183ROSE BOWL
Jan. 1 W .17.Northwestern ..........3 41-32+ N1 ..c100,102(9-2-1) 355-212 721,285
N1-Rose Bowl, Pasadena, California*-Trailing 21-0, USC scored 21 unanswered points in fourth quarter+-50th anniversary of Pac-10/Big Ten Rose Bowl agreement@-USC won Pac-10 bid to Rose Bowl on basis of better overall record thanWashington
1996Coach: John Robinson
Captains: John Allred, Sammy Knight
Aug. 25 L ..7.Penn State..............11 7-24* N1... c77,716Sept. 7 W .19.Illinois......................... 55-3 A.... 56,504Sept. 14 W .16.Oregon State............. 46-17 H.... 48,069Sept. 21 W .15.Houston.................... 26-9 A.... 21,035Oct. 5 L .17.California (U)............ 15-22 H.... 51,511Oct. 12 W ....Arizona....................... 14-7 H.... 51,088Oct. 19 L ....Arizona State (AS-1:30).4 35-48+ A.... c74,947Oct. 26 W ....Washington St. (Cold)(2:05)(N) 29-24 A.... 33,111Nov. 2 L ....Washington (HC).....21 10-21 H.... 60,039Nov. 9 L ....Stanford (N)................ 20-24 A.... 41,980Nov. 23 L ....UCLA (UCLA-0:39).... 41-48& A.... 80,644Nov. 30 W ....Notre Dame (N)(U)(SC-1:50).10 27-20@ H.... c90,296
(6-6, 3-5, 5thT) 325-267 686,940N1-Giants Stadium, East Rutherford, New Jersey*-Kickoff Classic XIV+-Two overtimes; USC's first overtime game&-Two overtimes; UCLA scored 17 points in the final 6:12 of fourth quarter toerase 17-point deficit@-One overtime; USC's first overtime game at the Coliseum
1997Coach: John Robinson
Captains: Jonathan Himebauch, Brian Kelly
Sept. 6 L .23.Florida State (N)(10:40).5 7-14 H.... 72,783Sept. 13 L .23.Washington State (4:18) 21-28 H.... 51,655Sept. 27 W ....California..................... 27-17 A.... 54,000Oct. 4 W ....UNLV (N)..................... 35-21* H.... 48,404Oct. 11 L ....Arizona State.............. 7-35 A.... 61,802Oct. 18 W ....Notre Dame (1:05)....... 20-17 A.... c80,225Oct. 25 W ....Oregon (N)(HC)........... 24-22 H.... 53,640Nov. 1 L ....Washington................7 0-27 A.... 73,401Nov. 8 W ....Stanford...................... 45-21 H.... 58,900Nov. 15 W ....Oregon State............... 23-0+ A.... 20,938Nov. 22 L ....UCLA.........................7 24-31 H.... c91,350
(6-5, 4-4, 5thT) 233-233 667,098*-100th collegiate victory for USC coach John Robinson; USC scored game'sfinal 21 points+Ended USC's streak of 111 consecutive live football telecasts
1998Coach: Paul Hackett
Captains: Adam Abrams, Chris Claiborne, Billy Miller, Chad Morton
Aug. 30 W ....Purdue (a.m.)............... 27-17*+ H.... 56,623Sept. 12 W .22.San Diego State (N).. 35-6 H.... 49,927Sept. 19 W .18.Oregon State (N)....... 40-20 H.... 45,629Sept. 26 L .18.Florida State...........10 10-30 A.... 79,815Oct. 3 W .21.Arizona State............. 35-24@ H.... 56,093Oct. 10 L .19.California (U)(3:30).... 31-32 H.... 65,678Oct. 17 W ....Washington State (Cold)(N) 42-14 A.... 31,178Oct. 24 L ....Oregon.....................12 13-17 A.... c45,807Oct. 31 W ....Washington (HC)......... 33-10 H.... 62,276Nov. 7 W ....Stanford...................... 34-9 A.... 43,250Nov. 21 L ....UCLA.........................3 17-34% A.... c88,080Nov. 28 W ....Notre Dame (N)..........9 10-0& H.... 90,069
(8-4, 5-3, 3rd T) 327-213 714,452SUN BOWL
Dec. 31 L ....TCU (U)....................... 19-28 N1... 46,612(8-5) 346-241 761,064
N1-Sun Bowl, El Paso, Texas*-Pigskin Classic IX+-118 degrees on the field; USC scored 17 points in last 2:11 of game@-USC outscored ASU 22-0 in fourth quarter%-91-year-old USC "Super Fan" Giles Pellerin, who was viewing his 797thconsecutive Trojan game, died of cardiac arrest at halftime in the Rose Bowlparking lot&-First time Notre Dame was shut out since 1987Note: This was the 75th anniversary of USC football in the Coliseum
This was Jack Ward's 40th anniversary as USC's head trainer
ALL-TIME USC RECORD

2006 FOOTBALL MEDIA GUIDE — PAGE 95
2002Coach: Pete Carroll
Captains: Carson Palmer, Troy Polamalu
Sept. 2 W .18.Auburn (N) (1:26).......... 24-17* H.... 63,269Sept. 14 W .17.Colorado....................18 40-3 A.... c53,119Sept. 21 L .11.Kansas State (N)......25 20-27& A.... 49,276Sept. 28 W .18.Oregon State.............23 22-0 H.... 56,417Oct. 5 L .18.Washington State.(WS-1:50).17 27-30+ A... c36,861Oct. 12 W .20.California...................... 30-28% H.... 63,113Oct. 19 W .19.Washington...............22 41-21# H.... 52,961Oct. 26 W .15.Oregon .....................14 44-33@ A.... c56,754Nov. 9 W .10.Stanford ....................... 49-17 A.... 44,950Nov. 16 W ..8.Arizona State (HC)........ 34-13 H.... 73,923Nov. 23 W ..7.UCLA ........................25 52-21 A.... c91,084Nov. 30 W ..6.Notre Dame (N)...........7 44-13** H.... c91,432
(10-2, 7-1, 1st T^) 427-223 733,159ORANGE BOWL
Jan. 2 W ..5.Iowa (N)........................3 38-17++ N1...c75,971(11-2) 465-240 809,130
N1-Pro Player Stadium, Miami, Florida*-USC unveiled new jerseys, similar to those worn from 1958 to 1969 (a singlecrescent stripe on each shoulder and numbers on the sleeve)&-Terence Newman scored the first-ever defensive extra point against USC+-One overtime; USC's 300th game on live television%-Trailing 21-3, USC scored 27 unanswered points#-Tied at 7-7, USC scored 27 unanswered points@-Trailing 19-14 at halftime, USC scored 30 unanswered points; It was thelargest crowd to see a football game in Oregon**-USC's 610 yards of total offense, and Carson Palmer's 425 passing yards and4 TD passes, were the most ever allowed by Notre Dame; Trailing 13-10, USCscored 34 unanswered points; USC's 62-point margin of victory over UCLA andNotre Dame were its most ever in a season^-Washington State received Rose Bowl bid by virtue of its victory over USC;USC received first-ever Bowl Championship Series bid++-USC's first win in Florida in 5 tries; Trailing 10-7, USC scored 31unanswered pointsNote: USC scored at least 30 points in its last 8 games (the first time in USC
history) USC faced 9 AP-ranked teams, the most USC ever faced in a season. USC players wore a gold football-shaped decal on their helmets
reading "Goux" in memory of legendary assistant coachMarv Goux, who passed away in July of 2002
2003Coach: Pete Carroll
Captains: Keary Colbert, Melvin Simmons
Aug. 30 W ..8.Auburn (N)....................6 23-0* A... c86,063Sept. 6 W ..4.BYU (N)......................... 35-18 H... 75,315Sept. 13 W ..4.Hawaii............................ 61-32 H... 73,654Sept. 27 L ..3.California (U) (SC-0:16).. 31-34+ A... 51,208Oct. 4 W .10.Arizona State................ 37-17& A... 56,527Oct. 11 W ..9.Stanford (N)................... 44-21**H... 68,341Oct. 18 W ..5.Notre Dame................... 45-14% A... c80,795Oct. 25 W ..5.Washington................... 43-23 A... c72,015Nov. 1 W ..3.Washington State (HC).6 43-16 H... 82,478Nov. 15 W ..2.Arizona (N).................... 45-0^ A... 39,201Nov. 22 W ..2.UCLA............................. 47-22 H... c93,172Dec. 6 W ..2.Oregon State................. 52-28 H... 73,864
(11-1, 7-1, 1st) 506-225 852,633ROSE BOWL
Jan. 1 W ..1.Michigan.......................4 28-14 N1... c93,849(12-1) 534-239 946,482
USC won national championshipN1-Rose Bowl, Pasadena, California*-Worst season-opening loss in Auburn history+-Three overtimes; Cal's first win over a Top 5 team since 1975&-Trailing 17-10 just after halftime, USC scored 27 unanswered points**-USC's 700th victory%-75th USC-Notre Dame game; Most points scored by a team in South Bendsince 1960; USC scored game's final 31 points^-Arizona's first shutout in 146 gamesNote: USC players wore a football-shaped sticker on their helmets with "54"
inside in gold lettering in memory of Drean Rucker, anincoming freshman linebacker who drowned in July of 2003
ALL-TIME USC RECORD
1999Coach: Paul Hackett
Captains: David Gibson, Chad Morton, Ifeanyi Ohalete
Sept. 4 W .21.Hawaii (N)................. 62-7 A.... c50,000Sept. 18 W .17.San Diego State........ 24-21 H.... 53,966Sept. 25 L .16.Oregon (N)(UO-0:30) 30-33+ A.... c45,660Oct. 2 W ....Oregon State............... 37-29* H.... 43,795Oct. 9 L .22.Arizona...................... 24-31 A.... 51,418Oct. 16 L ....Notre Dame (R)(2:40). 24-25% A.... c80,012Oct. 23 L ....Stanford (14:56).......... 31-35** H.... 57,494Oct. 30 L ....California..................... 7-17 A.... 54,000Nov. 6 L ....Arizona State (HC)...... 16-26 H.... 53,382Nov. 13 W ....Washington State........ 31-28 A.... 23,065Nov. 20 W ....UCLA........................... 17-7 H.... 91,384Nov. 26 W ....Louisiana Tech.......25 45-19 H.... 45,070
(6-6, 3-5, 6thT) 348-278 649,246+-Three overtimes; USC's longest game ever*-USC's 1,000th game%-Trailing 24-3, Notre Dame scored 22 unanswered points in second half**-USC led 21-0 in first quarter
2000Coach: Paul Hackett
Captains: Ennis Davis, Eric Denmon, Zeke Moreno, Petros Papadakis
Aug. 27 W .15.Penn State..............22 29-5* N1... c78,902Sept. 9 W .11.Colorado (N) (0:13).... 17-14 H.... 65,153Sept. 23 W ..9.San Jose State............ 34-24+ H.... 56,545Sept. 30 L ..8.Oregon State............... 21-31& A.... c33,775Oct. 7 L .18.Arizona....................... 15-31 H.... 49,342Oct. 14 L ....Oregon........................9 17-28 H.... 54,031Oct. 21 L ....Stanford (0:00)............. 30-32% A.... 50,125Oct. 28 L ....California (HC)............. 16-28 H.... 54,393Nov. 4 W ....Arizona State (N) (AS-4:21) 44-38@ A.... 49,865Nov. 11 L ....Washington State (U)... 27-33 H.... 40,565Nov. 18 W ....UCLA (0:09).................. 38-35 A.... c80,227Nov. 25 L ....Notre Dame...............11 21-38 H.... 81,342
(5-7, 2-6, 8th T**) 309-337 694,265N1-Giants Stadium, East Rutherford, New Jersey*-Kickoff Classic XVIII+-USC's 500th game in the Coliseum; Trailing 24-12, USC scored 22unanswered points in fourth quarter&-Ended USC's Pac-10 record 26-game winning streak over Oregon State%-Stanford scored 12 points in final 5:22@-Two overtimes; Arizona State scored 29 consecutive second-half points toforce overtime**-USC's first-ever last place finish in conference play
2001Coach: Pete Carroll
Captains: Charlie Landrigan, Troy Polamalu, Antuan Simmons
Sept. 1 W ....San Jose State............. 21-10 H.... 45,568Sept. 8 L ....Kansas State............12 6-10 H.... 69,959Sept. 22 L ....Oregon (N)(0:12)........7 22-24 A.... c45,765Sept. 29 L ....Stanford........................ 16-21 H.... 53,962Oct. 6 L ....Washington (0:00)....11 24-27 A... c72,946Oct. 13 W ....Arizona State................ 48-17 H.... 43,508Oct. 20 L ....Notre Dame.................. 16-27* A.... c80,795Oct. 27 W ....Arizona (1:50)............... 41-34 A.... 46,399Nov. 3 W ....Oregon State (HC)....... 16-13+ H.... 44,880Nov. 10 W ....California (R)................ 55-14& A.... 33,506Nov. 17 W ....UCLA........................20 27-0 H.... 88,588
(6-5, 5-3, 5th) 292-197 625,876LAS VEGAS BOWL
Dec. 25 L ....Utah.............................. 6-10 N1... 22,385(6-6) 298-207 648,261
N1-Sam Boyd Stadium, Las Vegas, Nevada*-75th anniversary of USC-Notre Dame series+-One overtime&-Ended USC's streak of 48 consecutive live football telecastsNote: This was the first season that USC lost 5 games by 5 points or less and the first season it lost twice in the final 12 seconds
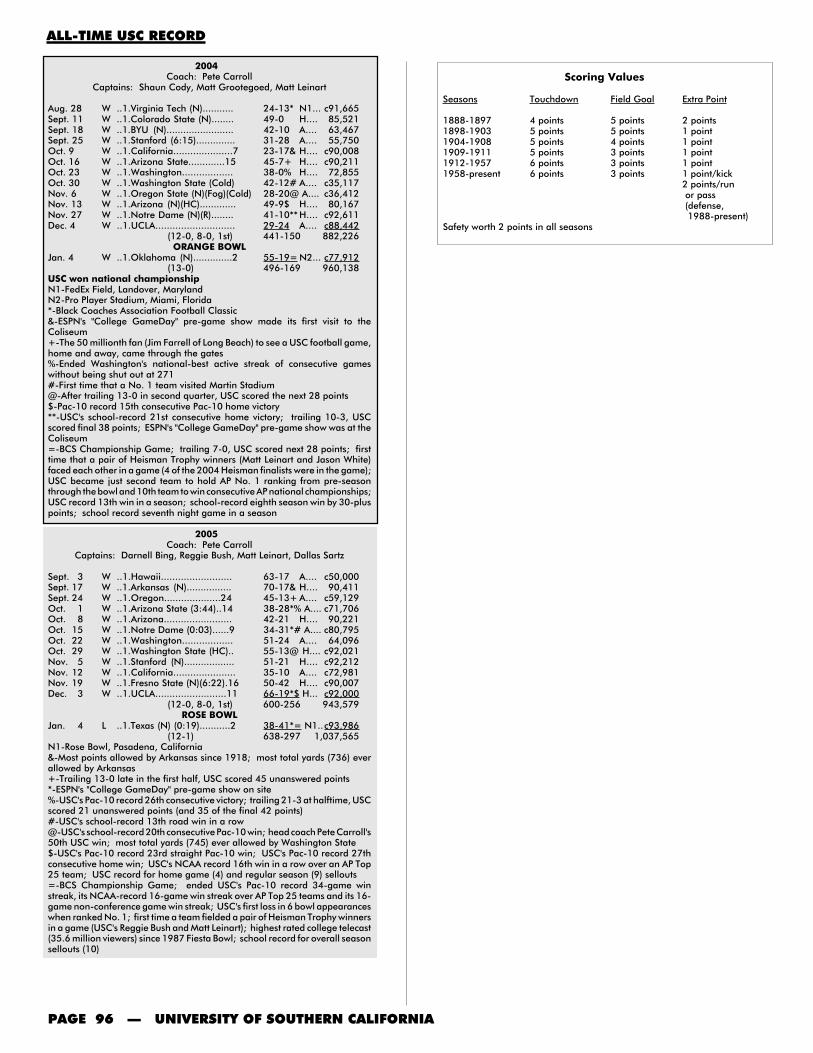
PAGE 96 — UNIVERSITY OF SOUTHERN CALIFORNIA
ALL-TIME USC RECORD
2004Coach: Pete Carroll
Captains: Shaun Cody, Matt Grootegoed, Matt Leinart
Aug. 28 W ..1.Virginia Tech (N)........... 24-13* N1... c91,665Sept. 11 W ..1.Colorado State (N)........ 49-0 H.... 85,521Sept. 18 W ..1.BYU (N)........................ 42-10 A.... 63,467Sept. 25 W ..1.Stanford (6:15).............. 31-28 A.... 55,750Oct. 9 W ..1.California.....................7 23-17& H.... c90,008Oct. 16 W ..1.Arizona State.............15 45-7+ H.... c90,211Oct. 23 W ..1.Washington.................. 38-0% H.... 72,855Oct. 30 W ..1.Washington State (Cold) 42-12# A.... c35,117Nov. 6 W ..1.Oregon State (N)(Fog)(Cold) 28-20@ A.... c36,412Nov. 13 W ..1.Arizona (N)(HC)............. 49-9$ H.... 80,167Nov. 27 W ..1.Notre Dame (N)(R)........ 41-10** H.... c92,611Dec. 4 W ..1.UCLA............................ 29-24 A.... c88,442
(12-0, 8-0, 1st) 441-150 882,226ORANGE BOWL
Jan. 4 W ..1.Oklahoma (N)..............2 55-19= N2... c77,912(13-0) 496-169 960,138
USC won national championshipN1-FedEx Field, Landover, MarylandN2-Pro Player Stadium, Miami, Florida*-Black Coaches Association Football Classic&-ESPN's "College GameDay" pre-game show made its first visit to theColiseum+-The 50 millionth fan (Jim Farrell of Long Beach) to see a USC football game,home and away, came through the gates%-Ended Washington's national-best active streak of consecutive gameswithout being shut out at 271#-First time that a No. 1 team visited Martin Stadium@-After trailing 13-0 in second quarter, USC scored the next 28 points$-Pac-10 record 15th consecutive Pac-10 home victory**-USC's school-record 21st consecutive home victory; trailing 10-3, USCscored final 38 points; ESPN's "College GameDay" pre-game show was at theColiseum=-BCS Championship Game; trailing 7-0, USC scored next 28 points; firsttime that a pair of Heisman Trophy winners (Matt Leinart and Jason White)faced each other in a game (4 of the 2004 Heisman finalists were in the game);USC became just second team to hold AP No. 1 ranking from pre-seasonthrough the bowl and 10th team to win consecutive AP national championships;USC record 13th win in a season; school-record eighth season win by 30-pluspoints; school record seventh night game in a season
2005Coach: Pete Carroll
Captains: Darnell Bing, Reggie Bush, Matt Leinart, Dallas Sartz
Sept. 3 W ..1.Hawaii......................... 63-17 A.... c50,000Sept. 17 W ..1.Arkansas (N)................ 70-17& H.... 90,411Sept. 24 W ..1.Oregon....................24 45-13+ A.... c59,129Oct. 1 W ..1.Arizona State (3:44)..14 38-28*% A.... c71,706Oct. 8 W ..1.Arizona........................ 42-21 H.... 90,221Oct. 15 W ..1.Notre Dame (0:03)......9 34-31*# A.... c80,795Oct. 22 W ..1.Washington.................. 51-24 A.... 64,096Oct. 29 W ..1.Washington State (HC).. 55-13@ H.... c92,021Nov. 5 W ..1.Stanford (N).................. 51-21 H.... c92,212Nov. 12 W ..1.California...................... 35-10 A.... c72,981Nov. 19 W ..1.Fresno State (N)(6:22).16 50-42 H.... c90,007Dec. 3 W ..1.UCLA.........................11 66-19*$ H... c92,000
(12-0, 8-0, 1st) 600-256 943,579ROSE BOWL
Jan. 4 L ..1.Texas (N) (0:19)...........2 38-41*= N1..c93,986(12-1) 638-297 1,037,565
N1-Rose Bowl, Pasadena, California&-Most points allowed by Arkansas since 1918; most total yards (736) everallowed by Arkansas+-Trailing 13-0 late in the first half, USC scored 45 unanswered points*-ESPN's "College GameDay" pre-game show on site%-USC's Pac-10 record 26th consecutive victory; trailing 21-3 at halftime, USCscored 21 unanswered points (and 35 of the final 42 points)#-USC's school-record 13th road win in a row@-USC's school-record 20th consecutive Pac-10 win; head coach Pete Carroll's50th USC win; most total yards (745) ever allowed by Washington State$-USC's Pac-10 record 23rd straight Pac-10 win; USC's Pac-10 record 27thconsecutive home win; USC's NCAA record 16th win in a row over an AP Top25 team; USC record for home game (4) and regular season (9) sellouts=-BCS Championship Game; ended USC's Pac-10 record 34-game winstreak, its NCAA-record 16-game win streak over AP Top 25 teams and its 16-game non-conference game win streak; USC's first loss in 6 bowl appearanceswhen ranked No. 1; first time a team fielded a pair of Heisman Trophy winnersin a game (USC's Reggie Bush and Matt Leinart); highest rated college telecast(35.6 million viewers) since 1987 Fiesta Bowl; school record for overall seasonsellouts (10)
Scoring Values
Seasons Touchdown Field Goal Extra Point
1888-1897 4 points 5 points 2 points1898-1903 5 points 5 points 1 point1904-1908 5 points 4 points 1 point1909-1911 5 points 3 points 1 point1912-1957 6 points 3 points 1 point1958-present 6 points 3 points 1 point/kick
2 points/run or pass (defense, 1988-present)
Safety worth 2 points in all seasons
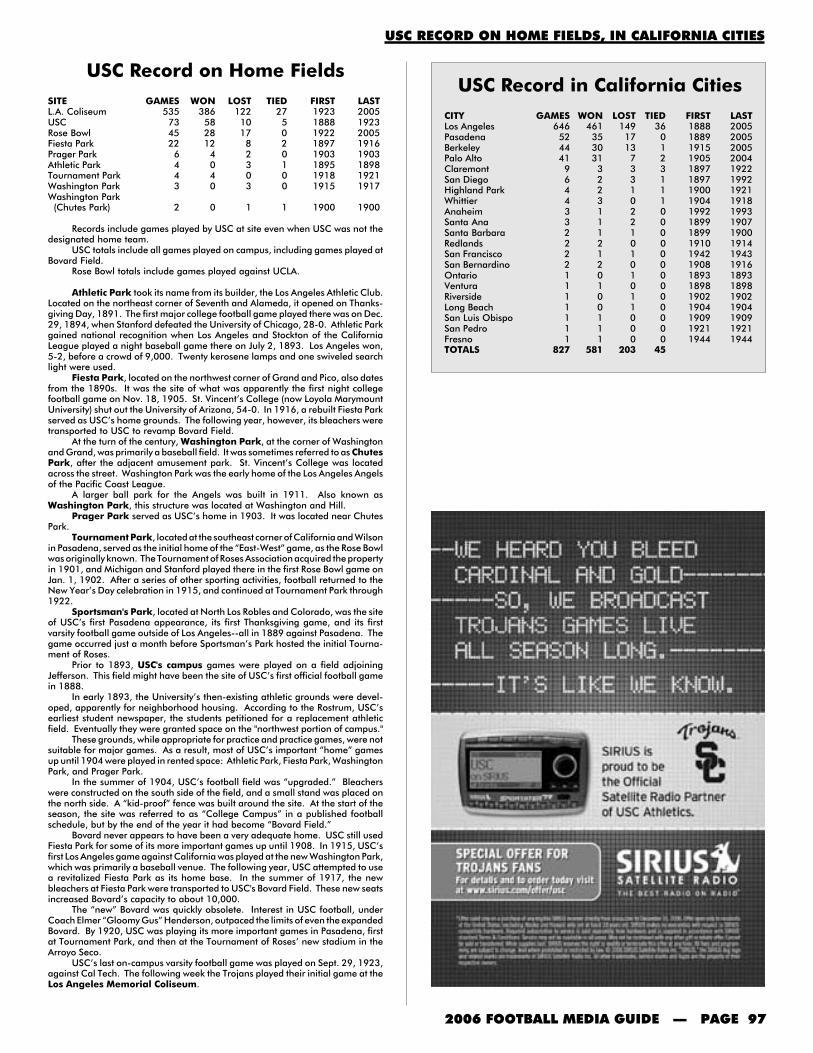
2006 FOOTBALL MEDIA GUIDE — PAGE 97
USC RECORD ON HOME FIELDS, IN CALIFORNIA CITIES
USC Record on Home FieldsSITE GAMES WON LOST TIED FIRST LASTL.A. Coliseum 535 386 122 27 1923 2005USC 73 58 10 5 1888 1923Rose Bowl 45 28 17 0 1922 2005Fiesta Park 22 12 8 2 1897 1916Prager Park 6 4 2 0 1903 1903Athletic Park 4 0 3 1 1895 1898Tournament Park 4 4 0 0 1918 1921Washington Park 3 0 3 0 1915 1917Washington Park (Chutes Park) 2 0 1 1 1900 1900
Records include games played by USC at site even when USC was not thedesignated home team.
USC totals include all games played on campus, including games played atBovard Field.
Rose Bowl totals include games played against UCLA.
Athletic Park took its name from its builder, the Los Angeles Athletic Club.Located on the northeast corner of Seventh and Alameda, it opened on Thanks-giving Day, 1891. The first major college football game played there was on Dec.29, 1894, when Stanford defeated the University of Chicago, 28-0. Athletic Parkgained national recognition when Los Angeles and Stockton of the CaliforniaLeague played a night baseball game there on July 2, 1893. Los Angeles won,5-2, before a crowd of 9,000. Twenty kerosene lamps and one swiveled searchlight were used.
Fiesta Park, located on the northwest corner of Grand and Pico, also datesfrom the 1890s. It was the site of what was apparently the first night collegefootball game on Nov. 18, 1905. St. Vincent’s College (now Loyola MarymountUniversity) shut out the University of Arizona, 54-0. In 1916, a rebuilt Fiesta Parkserved as USC’s home grounds. The following year, however, its bleachers weretransported to USC to revamp Bovard Field.
At the turn of the century, Washington Park, at the corner of Washingtonand Grand, was primarily a baseball field. It was sometimes referred to as ChutesPark, after the adjacent amusement park. St. Vincent’s College was locatedacross the street. Washington Park was the early home of the Los Angeles Angelsof the Pacific Coast League.
A larger ball park for the Angels was built in 1911. Also known asWashington Park, this structure was located at Washington and Hill.
Prager Park served as USC’s home in 1903. It was located near ChutesPark.
Tournament Park, located at the southeast corner of California and Wilsonin Pasadena, served as the initial home of the “East-West” game, as the Rose Bowlwas originally known. The Tournament of Roses Association acquired the propertyin 1901, and Michigan and Stanford played there in the first Rose Bowl game onJan. 1, 1902. After a series of other sporting activities, football returned to theNew Year’s Day celebration in 1915, and continued at Tournament Park through1922.
Sportsman's Park, located at North Los Robles and Colorado, was the siteof USC’s first Pasadena appearance, its first Thanksgiving game, and its firstvarsity football game outside of Los Angeles--all in 1889 against Pasadena. Thegame occurred just a month before Sportsman’s Park hosted the initial Tourna-ment of Roses.
Prior to 1893, USC's campus games were played on a field adjoiningJefferson. This field might have been the site of USC’s first official football gamein 1888.
In early 1893, the University’s then-existing athletic grounds were devel-oped, apparently for neighborhood housing. According to the Rostrum, USC’searliest student newspaper, the students petitioned for a replacement athleticfield. Eventually they were granted space on the "northwest portion of campus."
These grounds, while appropriate for practice and practice games, were notsuitable for major games. As a result, most of USC’s important “home” gamesup until 1904 were played in rented space: Athletic Park, Fiesta Park, WashingtonPark, and Prager Park.
In the summer of 1904, USC’s football field was “upgraded.” Bleacherswere constructed on the south side of the field, and a small stand was placed onthe north side. A “kid-proof” fence was built around the site. At the start of theseason, the site was referred to as “College Campus” in a published footballschedule, but by the end of the year it had become “Bovard Field.”
Bovard never appears to have been a very adequate home. USC still usedFiesta Park for some of its more important games up until 1908. In 1915, USC’sfirst Los Angeles game against California was played at the new Washington Park,which was primarily a baseball venue. The following year, USC attempted to usea revitalized Fiesta Park as its home base. In the summer of 1917, the newbleachers at Fiesta Park were transported to USC's Bovard Field. These new seatsincreased Bovard’s capacity to about 10,000.
The “new” Bovard was quickly obsolete. Interest in USC football, underCoach Elmer “Gloomy Gus” Henderson, outpaced the limits of even the expandedBovard. By 1920, USC was playing its more important games in Pasadena, firstat Tournament Park, and then at the Tournament of Roses’ new stadium in theArroyo Seco.
USC’s last on-campus varsity football game was played on Sept. 29, 1923,against Cal Tech. The following week the Trojans played their initial game at theLos Angeles Memorial Coliseum.
USC Record in California CitiesCITY GAMES WON LOST TIED FIRST LASTLos Angeles 646 461 149 36 1888 2005Pasadena 52 35 17 0 1889 2005Berkeley 44 30 13 1 1915 2005Palo Alto 41 31 7 2 1905 2004Claremont 9 3 3 3 1897 1922San Diego 6 2 3 1 1897 1992Highland Park 4 2 1 1 1900 1921Whittier 4 3 0 1 1904 1918Anaheim 3 1 2 0 1992 1993Santa Ana 3 1 2 0 1899 1907Santa Barbara 2 1 1 0 1899 1900Redlands 2 2 0 0 1910 1914San Francisco 2 1 1 0 1942 1943San Bernardino 2 2 0 0 1908 1916Ontario 1 0 1 0 1893 1893Ventura 1 1 0 0 1898 1898Riverside 1 0 1 0 1902 1902Long Beach 1 0 1 0 1904 1904San Luis Obispo 1 1 0 0 1909 1909San Pedro 1 1 0 0 1921 1921Fresno 1 1 0 0 1944 1944TOTALS 827 581 203 45
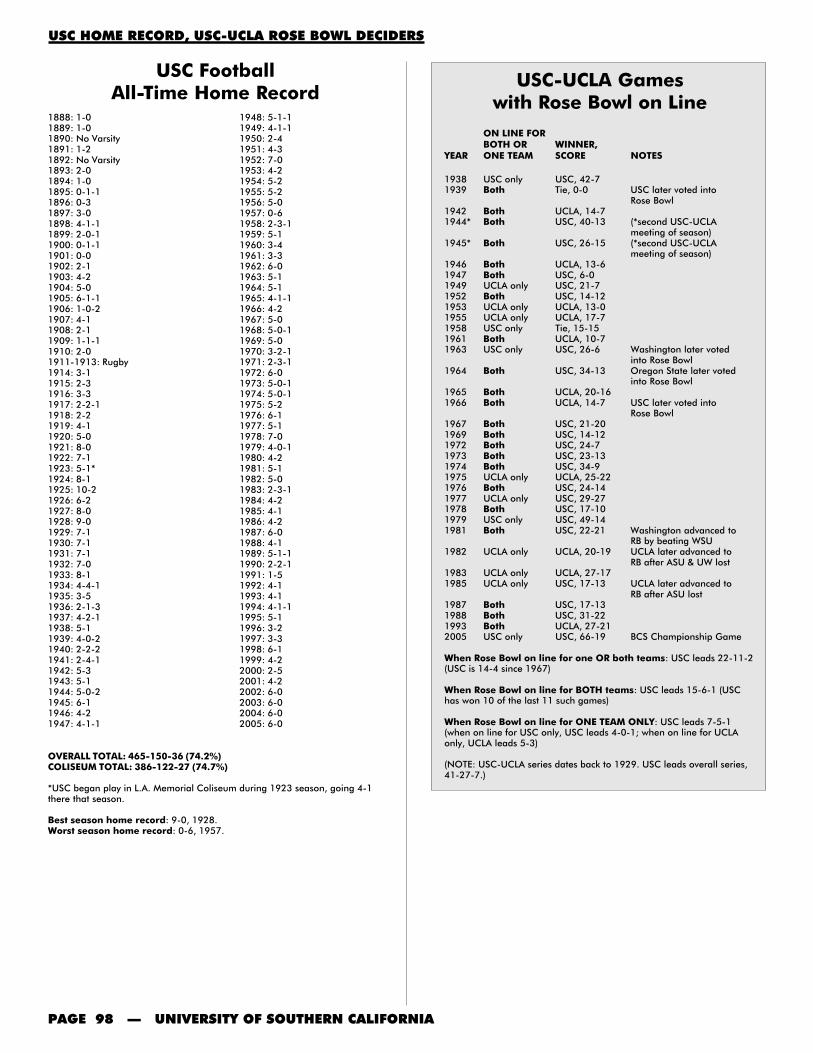
PAGE 98 — UNIVERSITY OF SOUTHERN CALIFORNIA
1948: 5-1-11949: 4-1-11950: 2-41951: 4-31952: 7-01953: 4-21954: 5-21955: 5-21956: 5-01957: 0-61958: 2-3-11959: 5-11960: 3-41961: 3-31962: 6-01963: 5-11964: 5-11965: 4-1-11966: 4-21967: 5-01968: 5-0-11969: 5-01970: 3-2-11971: 2-3-11972: 6-01973: 5-0-11974: 5-0-11975: 5-21976: 6-11977: 5-11978: 7-01979: 4-0-11980: 4-21981: 5-11982: 5-01983: 2-3-11984: 4-21985: 4-11986: 4-21987: 6-01988: 4-11989: 5-1-11990: 2-2-11991: 1-51992: 4-11993: 4-11994: 4-1-11995: 5-11996: 3-21997: 3-31998: 6-11999: 4-22000: 2-52001: 4-22002: 6-02003: 6-02004: 6-02005: 6-0
USC-UCLA Gameswith Rose Bowl on Line
ON LINE FORBOTH OR WINNER,
YEAR ONE TEAM SCORE NOTES
1938 USC only USC, 42-71939 Both Tie, 0-0 USC later voted into
Rose Bowl1942 Both UCLA, 14-71944* Both USC, 40-13 (*second USC-UCLA
meeting of season)1945* Both USC, 26-15 (*second USC-UCLA
meeting of season)1946 Both UCLA, 13-61947 Both USC, 6-01949 UCLA only USC, 21-71952 Both USC, 14-121953 UCLA only UCLA, 13-01955 UCLA only UCLA, 17-71958 USC only Tie, 15-151961 Both UCLA, 10-71963 USC only USC, 26-6 Washington later voted
into Rose Bowl1964 Both USC, 34-13 Oregon State later voted
into Rose Bowl1965 Both UCLA, 20-161966 Both UCLA, 14-7 USC later voted into
Rose Bowl1967 Both USC, 21-201969 Both USC, 14-121972 Both USC, 24-71973 Both USC, 23-131974 Both USC, 34-91975 UCLA only UCLA, 25-221976 Both USC, 24-141977 UCLA only USC, 29-271978 Both USC, 17-101979 USC only USC, 49-141981 Both USC, 22-21 Washington advanced to
RB by beating WSU1982 UCLA only UCLA, 20-19 UCLA later advanced to
RB after ASU & UW lost1983 UCLA only UCLA, 27-171985 UCLA only USC, 17-13 UCLA later advanced to
RB after ASU lost1987 Both USC, 17-131988 Both USC, 31-221993 Both UCLA, 27-212005 USC only USC, 66-19 BCS Championship Game
When Rose Bowl on line for one OR both teams: USC leads 22-11-2(USC is 14-4 since 1967)
When Rose Bowl on line for BOTH teams: USC leads 15-6-1 (USChas won 10 of the last 11 such games)
When Rose Bowl on line for ONE TEAM ONLY: USC leads 7-5-1(when on line for USC only, USC leads 4-0-1; when on line for UCLAonly, UCLA leads 5-3)
(NOTE: USC-UCLA series dates back to 1929. USC leads overall series,41-27-7.)
USC HOME RECORD, USC-UCLA ROSE BOWL DECIDERS
1888: 1-01889: 1-01890: No Varsity1891: 1-21892: No Varsity1893: 2-01894: 1-01895: 0-1-11896: 0-31897: 3-01898: 4-1-11899: 2-0-11900: 0-1-11901: 0-01902: 2-11903: 4-21904: 5-01905: 6-1-11906: 1-0-21907: 4-11908: 2-11909: 1-1-11910: 2-01911-1913: Rugby1914: 3-11915: 2-31916: 3-31917: 2-2-11918: 2-21919: 4-11920: 5-01921: 8-01922: 7-11923: 5-1*1924: 8-11925: 10-21926: 6-21927: 8-01928: 9-01929: 7-11930: 7-11931: 7-11932: 7-01933: 8-11934: 4-4-11935: 3-51936: 2-1-31937: 4-2-11938: 5-11939: 4-0-21940: 2-2-21941: 2-4-11942: 5-31943: 5-11944: 5-0-21945: 6-11946: 4-21947: 4-1-1
USC FootballAll-Time Home Record
OVERALL TOTAL: 465-150-36 (74.2%)COLISEUM TOTAL: 386-122-27 (74.7%)
*USC began play in L.A. Memorial Coliseum during 1923 season, going 4-1there that season.
Best season home record: 9-0, 1928.Worst season home record: 0-6, 1957.

2006 FOOTBALL MEDIA GUIDE — PAGE 99
Over the years, USC has been involved in many games featuring dramaticfinishes at the end. Here’s a sampling of some of the more famous such contests.
1931--USC 16, Notre Dame 14. Johnny Baker kicked a game-winning 33-yard field goal with 1:00 remaining. All of USC’s points came in the fourth quarter.The win snapped Notre Dame’s 26-game unbeaten streak and was USC’s first-ever win in South Bend. Troy won the national championship.
1938--USC 7, Duke 3 (1939 Rose Bowl). Al Krueger, a second-team end,and fourth-string quarterback Doyle Nave came off the bench to connect on 4straight passes, the last a 19-yard TD with about 40 seconds left to upset previouslyunbeaten, untied and unscored-upon Duke.
1939--USC 0, UCLA 0. Bobby Robertson knocked down Ned Matthews’ 4-yard pass in the end zone with less than 5 minutes to play to preserve the tie forUSC, sending the Trojans to the Rose Bowl.
1941--USC 13, Oregon State 7. Doug Essick caught a game-winning 6-yard pass from Ray Woods with 13 seconds to play.
1951--USC 21, California 14. Leon Sellers scored on a 2-yard run with2:44 left to snap Cal’s 38-game regular season winning streak.
1953--USC 23, Stanford 20. Sam Tsagalakis kicked a victorious 38-yardfield goal with 14 seconds left.
1958--USC 15, UCLA 15. Luther Hayes returned a kickoff 74 yards for aTD and Tom Maudlin ran in for the 2-point conversion with 6:50 to play to get theTrojans a tie.
1964--USC 26, California 21. Behind 21-14 in the fourth quarter, USCscored twice late, the second time (while trailing 21-20) on a 22-yard pass fromCraig Fertig to Rod Sherman with 50 seconds to culminate a 95-yard drive.
1964--USC 20, Notre Dame 17. Rod Sherman caught a 15-yard TD passfrom Craig Fertig with 1:33 to play to upset unbeaten and top-ranked NotreDame. USC was down, 17-0, at halftime.
1967--USC 21, UCLA 20. O.J. Simpson ran 64 yards for a TD with 10:38left in the fourth quarter to give USC a Rose Bowl berth and the nationalchampionship. It is one of the most famous runs in college football history.
1969--USC 26, Stanford 24. Ron Ayala kicked a game-winning 34-yardfield goal with 0:00 on the clock.
1969--USC 14, UCLA 12. Jimmy Jones hit Sam Dickerson with a 32-yardTD pass in the corner of the end zone with 1:32 left, putting USC in the Rose Bowl.
1973--USC 27, Stanford 26. Chris Limahelu kicked a game-winning 34-yard field goal with 3 seconds to play.
1974--USC 18, Ohio State 17 (1975 Rose Bowl). Johnny McKay caughta 38-yard TD pass from Pat Haden with 2:03 remaining to pull USC to within apoint of Ohio State. Then Shelton Diggs grabbed the subsequent 2-pointconversion pass from Haden for the victory, which wrapped up a nationalchampionship for USC.
1977--USC 29, UCLA 27. Frank Jordan kicked a 38-yard field goal with 2seconds remaining, knocking UCLA out of the Rose Bowl.
1978--USC 27, Notre Dame 25. A year after his late game-winner againstUCLA, Frank Jordan kicked a nearly-identical 37-yard field goal with 2 secondsremaining to beat Notre Dame.
1979--USC 17, LSU 12. Kevin Williams caught a game-winning 8-yard TDpass from Paul McDonald with 32 seconds to play.
1979--USC 17, Ohio State 16 (1980 Rose Bowl). Charles White scoredon a 1-yard run with 1:32 remaining. USC drove 83 yards in 8 plays on the winningdrive, with White carrying 6 times for 71 yards.
1980--USC 20, Tennessee 17. Eric Hipp kicked a victorious 47-yard fieldgoal with 0:00 left.
1981--USC 28, Oklahoma 24. Fred Cornwell caught a 7-yard TD passfrom John Mazur with 2 seconds to play to give No. 1 USC the win over No. 2Oklahoma.
1981--USC 14, Notre Dame 7. Todd Spencer ran 26 yards for the game-winning TD with 4:52 to play.
1981--USC 22, UCLA 21. George Achica broke through the line on the finalplay of the game to block Norm Johnson’s 46-yard field goal try, preserving thewin and knocking UCLA out of the Rose Bowl.
1982--USC 17, Notre Dame 13. Michael Harper, fumbling as he doveover the goal line, scored on a controversial winning 1-yard run with 48 secondsto play. It was coach John Robinson’s last game of his first tenure at USC.
1983--USC 19, Florida 19. Timmie Ware caught a 25-yard pass from SeanSalisbury with no time on the clock, but USC botched the extra point attempt ascoach Ted Tollner’s debut ended in a tie.
1985--USC 17, UCLA 13. Rodney Peete scored the winning points on a 1-yard sneak at 1:13 to go.
1986--USC 17, Baylor 14. Don Shafer kicked a game-winning 32-yardfield goal in a driving rainstorm with 0:00 on the clock.
1987--USC 12, Arizona 10. Quin Rodriguez kicked an 18-yard field goalwith 1:11 remaining, his fourth three-pointer of the game.
1987--USC 17, UCLA 13. Erik Affholter made a juggling, corner-of-the-end zone 33-yard TD catch of a Rodney Peete pass with 7:59 to play in the game,bringing USC all the way back from a 13-0 third quarter deficit. The win put USCin the Rose Bowl.
1988--USC 24, Stanford 20. John Jackson caught a game-winning 10-yard TD pass from Rodney Peete with 1:19 remaining. USC trailed, 13-0, in thesecond quarter.
1989--USC 18, Washington State 17. Known as “The Drive,” ToddMarinovich guided USC 91 yards in 18 plays (all through the air) with 3:31remaining, culminating with a 2-yard TD pass to Ricky Ervins with 4 seconds toplay. Marinovich then hit Gary Wellman for the winning 2-point conversion.
1989--USC 10, UCLA 10. A 54-yard field goal try by UCLA’s AlfredoVelasco with 2 seconds to play hit the crossbar and bounced away, preserving thetie.
1989--USC 17, Michigan 10 (1990 Rose Bowl). Rose Bowl MVP RickyErvins ran 14 yards for the winning TD with 1:10 to play to cap a 75-yard drive.
1990--USC 35, Ohio State 26. The second half was played in heavy rainwith thunder and lightning, getting so bad that officials suspended the game with2:36 to play after USC recovered an onside kick.
1990--USC 31, California 31. Cal’s Robbie Keen missed a 43-yard fieldgoal try with 4 seconds remaining, ending the game in a tie.
1990--USC 45, UCLA 42. In the highest-scoring and perhaps most thrillingUSC-UCLA game, Todd Marinovich threw a game-winning 23-yard TD pass toJohnnie Morton with 16 seconds left. The contest featured a 42-point fourthquarter (including 3 TD’s in the final 3:09) with 4 lead changes. Morton also caughta 21-yard scoring TD from Marinovich with 3:09 to play to give USC a short-lived38-35 lead, but Kevin Smith scored on a 1-yard run with 1:19 to go to put theBruins up 42-38.
1992--USC 31, San Diego State 31. San Diego State's Andy Trakasmissed 2 field goals (30 and 55 yards) in the last 0:54 to allow USC to hold ontothe tie.
1992--USC 27, California 24. Down 24-13, Estrus Crayton scored twicein the final 5:45 on 2- and 1-yard runs, the second with 2:27 to play to give USCthe win. Brian Williams' interception with 2:19 to go sealed Troy's victory.
1995--USC 21, Washington 21. Down 21-0 going into the fourth quarter,USC scored 3 touchdowns, the last a 2-yard pass from Brad Otton to JohnnyMcWilliams with 33 seconds to go (Adam Rendon's PAT tied it), thus allowing theTrojans to keep hold of the inside track in the Rose Bowl race.
1995--USC 31, Stanford 30. A week after the dramatic Washington tie,USC--behind 16-0 in the second quarter--scored with 39 seconds to play on an8-yard Kyle Wachholtz pass to Keyshawn Johnson, who then came in as a safetyon defense and knocked down a Hail Mary pass at the goal line at the gun.
1996--USC 29, Washington State 24. Delon Washington's 17-yard TDrun with 2:05 to play proved decisive and then USC had to hold off the Cougars,who got to the Trojan 11-yard line with 39 seconds to go before fumbling the ballaway.
1996--USC 27, Notre Dame 20. In its first overtime win in 3 tries in 1996,Delon Washington scored on a 15-yard run with 1:50 to go in regulation and thenbarely edged the ball over the goal line on the ensuing 2-point conversion run totie the game at 20-20. After Rodney Sermons caught a 5-yard TD pass from BradOtton in the first overtime, Troy stopped the Irish, breaking USC's 13-game non-winning streak to Notre Dame.
1997--USC 20, Notre Dame 17. Adam Abrams' 37-yard field goal with1:05 to go--4 plays after Mark Cusano ran 27 yards with an interception--gaveUSC its first win in South Bend since 1981.
1997--USC 24, Oregon 22. Marc Matock partially deflected JoshuaSmith's 36-yard field goal try that fell just short with 8 seconds to play to preservethe win.
2000--USC 17, Colorado 14. David Newbury, who had missed a pair offield goals earlier in the game, nailed a 24-yarder with 13 seconds to play for thevictory.
2000--USC 34, San Jose State 24. USC, trailing by 12 points midwaythrough the fourth quarter, scored 22 unanswered points in the final 8:07 to win.
2000--USC 44, Arizona State 38. After Arizona State scored 29 consecu-tive second-half points to force overtime, Chad Pierson scored on a 2-yard run inthe second overtime and then Sultan Abdul-Malik forced a Sun Devil fumble whichMatt Childers recovered to seal the win.
2000--USC 38, UCLA 35. David Bell, USC's third string kicker at the startof the season, hit a game-winning 36-yard field goal with 9 seconds to play (it wasonly his second field goal in 6 career attempts, as he had missed 3 previous triesin 2000, including a 24-yarder earlier in the game's fourth quarter).
2001--USC 41, Arizona 34. Kris Richard returned an interception 58 yardsfor a TD with 1:50 to play after Arizona had battled back from a 21-point secondquarter deficit.
2001--USC 16, Oregon State 13. Carson Palmer ran 4 yards on a nakedbootleg for the game-winning touchdown in the first overtime period (USCdodged defeat twice late in regulation when Ryan Cesca missed 35- and 29-yardfield goals).
2002--USC 24, Auburn 17. Carson Palmer's 1-yard sneak with 1:26 toplay gave USC the victory.
2005--USC 34, Notre Dame 31. Matt Leinart twisted in from the 1-yardline with 3 seconds to play for the win (earlier in that 75-yard drive, he threadeda 61-yard audible pass to Dwayne Jarrett on fourth-and-9 from the USC 26).
• • •
DRAMATIC FINISHES

PAGE 100 — UNIVERSITY OF SOUTHERN CALIFORNIA
“THE COMEBACK”1974: USC 55, Notre Dame 24
In what is regarded as one of the most dramatic and incrediblecomebacks in the history of college football, the 1974 Trojans erased a 24-point deficit to beat Notre Dame, 55-24, in the Coliseum. In a December1998 list by SPORT magazine, the game was ranked as the No. 6 top collegefootball moment of the 20th century.
USC trailed the Irish, 24-0, late in the first half, and the Trojans’chances looked bleak because Notre Dame sported the nation’s top-rankeddefense. But with 10 seconds remaining before halftime, Anthony Davisscored on a 7-yard pass from Pat Haden (Troy missed the 2-point conver-sion) to send the Trojans into the lockerroom behind 24-6...but with aglimmer of hope.
Davis took the opening kickoff of the second half and raced 102 yardsfor a score, opening the floodgates as USC rallied for 35 points in the thirdquarter. Davis scored 2 more times that quarter, both on short runs, andHaden threw TD passes of 18 and 45 yards to Johnny McKay.
Then, before 2 minutes had elapsed in the fourth quarter, Haden hitShelton Diggs for a 16-yard score and Charles Phillips returned an intercep-tion 58 yards for a touchdown.
In all, USC blitzed to its 55 points in under 17 minutes.“We turned into madmen,” was how Davis described the
comeback.Added receiver Johnny McKay, son of USC coach John McKay,
right after the game: “I can’t understand it. I’m gonna sit downtonight and have a beer and think about it. Against Notre Dame?Maybe against Kent State...but Notre Dame?”
The victory propelled USC, which then beat Ohio State in the RoseBowl, 18-17, to the national championship.
Interestingly, that Rose Bowl win was dramatic, too. USC trailed, 17-10, with just minutes left. Then Haden teamed with McKay on a 38-yard TDpass with 2:03 to go, and followed that with a 2-point conversion toss toDiggs for the victory.
USC'S LAST MINUTEGAME-WINNING FIELD GOALS
Time FinalName Year Opponent Length Left ScoreJohnny Baker 1931 at Notre Dame 33 yards 1:00 16-14Sam Tsagalakis 1953 Stanford 38 yards 0:14 23-20Ron Ayala 1969 Stanford 34 yards 0:00 26-24Chris Limahelu 1973 Stanford 34 yards 0:03 27-26Frank Jordan 1977 UCLA 38 yards 0:02 29-27Frank Jordan 1978 Notre Dame 37 yards 0:02 27-25Eric Hipp 1980 at Tennessee 47 yards 0:00 20-17Don Shafer 1986 at Baylor 32 yards 0:00 17-14Quin Rodriguez 1987 Arizona 18 yards 1:11 12-10Adam Abrams 1997 at Notre Dame 37 yards 1:05 20-17David Newbury 2000 Colorado 24 yards 0:13 17-14David Bell 2000 at UCLA 36 yards 0:09 38-35
USC'S OVERTIME GAMES(3-5)
Year Opponent Score Overtimes1996 Arizona State L 48-35 21996 UCLA L 48-41 21996 Notre Dame W 27-20 11999 Oregon L 33-30 32000 Arizona State W 44-38 22001 Oregon State W 16-13 12002 Washington State L 30-27 12003 California L 34-31 3
Of course, USC has been on the wrong end of some dramatic last-minutefinishes, too. For instance, there was the 1926 Notre Dame game (Art Parisienthrew a 23-yard TD pass to Butch Niemiec with 2 minutes to go for a 13-12 Irishwin), the 1937 Notre Dame game (Mario Tonnelli ran 13 yards for a TD with 1:45left in the Irish’s 13-6 win), the 1944 UCLA game (Johnny Roesch scored twice inthe last 2 minutes, including an 80-yard punt return with no time on the clock, andthen Bob Waterfield’s extra point kick hit the crossbar but rolled over, to give UCLAa 13-13 tie), the 1948 Notre Dame game (Emil Sitko ran for a 2-yard TD with35 seconds to go and Steve Oracko hit the extra point as Notre Dame, riding a27-game unbeaten streak, escaped with a 14-14 tie), the 1954 Notre Damegame (Jim Morse caught a 72-yard pass from Ralph Guglielmi with 5:57 to go togive Notre Dame a 23-17 victory), the 1963 Notre Dame game (Ken Ivan kickeda 33-yard field goal with 6:38 to go as Notre Dame won, 17-14), the 1965 UCLAgame (Kurt Altenberg caught a 52-yard scoring bomb from Gary Beban with about4 minutes to play as UCLA overcame a 16-6 deficit and won, 20-16), the 1967Rose Bowl (USC’s 2-point conversion pass attempt with 2:28 to play wasintercepted by George Catavolos, allowing Purdue to hold onto a 14-13 win), the1975 Stanford game (Mike Langford kicked a 37-yard field goal with no time onthe clock as Stanford won, 13-10), the 1977 Alabama game (under pressurefrom Alabama's Wayne Hamilton, Rob Hertel's 2-point conversion pass to MosiTatupu with 35 seconds to play was intercepted by Barry Krauss, sealing the Tide's21-20 victory), the 1980 UCLA game (Freeman McNeil pulled down a tipped 58-yard pass from Jay Schroeder for the game-winner at 2:07 to play for a 20-17 win),the 1982 UCLA game (Bruin Karl Morgan preserved UCLA’s 20-19 win by sackingScott Tinsley on an attempted 2-point conversion pass after USC had scored at thegun), the 1986 Notre Dame game (the Irish rallied back from a 20-9 halftimedeficit, culminated by John Carney’s 19-yard field goal as time expired to giveNotre Dame a 38-37 win), the 1989 Illinois game (a pair of late fourth quarterJeff George TD passes, the second to Steve Williams with 2:19 to play, gave theIllini a 14-13 win), the 1991 Stanford game (USC went ahead 21-17 with 3:37to play only to see Steve Stenstrom hit Chris Walsh with a game-winning 12-yardTD pass with 1:11 left; USC's Cole Ford barely missed a 45-yard field goal at thegun), the 1992 UCLA game (UCLA came back from a 31-17 fourth quarter deficitto go ahead 38-31, only to see Rob Johnson score on a 1-yard sneak with 41seconds to play, but Johnson's 2-point conversion pass to Yonnie Jackson wasdeflected by Bruin Nkosi Littleton), the 1993 Penn State game (Rob Johnson's 2-point conversion pass to Johnny McWilliams with 37 seconds to go fell bouncedincomplete, allowing the Nittany Lions to hold on to a 21-20 win), the 1993 UCLAgame (a win or tie would have put USC in the Rose Bowl, but Rob Johnson's 3-yard,third-down pass with 56 seconds to play to Tyler Cashman was intercepted in theend zone by Bruin Marvin Goodwin to preserve UCLA's 27-21 victory), the 1996Arizona State game (after ASU tied the game at 28-28 with 1:30 to play, theteams went to double overtime with Sun Devil Courtney Jackson returning acontroversial Brad Otton fumble 85 yards for a TD in the second overtime to endthe game in ASU's favor, 48-35), the 1996 UCLA game (USC held a 17-point leadwith less than 7 minutes to play in regulation but couldn't hold on and then, in itssecond double overtime game of the season, the Trojans couldn't score in thesecond overtime after Skip Hicks' 25-yard TD run gave the Bruins a 48-41 victory),the 1997 Washington State game (Kevin McKenzie made a one-handed grabof a 51-yard Ryan Leaf TD pass with 4:18 to play to give WSU a 28-21 win), the1998 California game (the Bears scored 22 unanswered points in the final 19minutes, including a decisive 3-yard TD run by Marcus Fields with 3:30 to play),the 1999 Oregon game (third string kicker Josh Frankel hit a 27-yard field goalin the third overtime to give Oregon a 33-30 win), the 1999 Notre Dame game(the Irish scored 22 unanswered points in the second half, the last when JabariHolloway recovered a Notre Dame fumble in the end zone with 2:40 to go for a25-24 win), the 2000 Stanford game (backup Chris Lewis threw a 20-yard TDpass to Jamien McCullum on fourth-and-goal as time expired to give Stanford a32-30 win), the 2001 Oregon game (after Oregon drove 61 yards on 7 plays inthe final minute, Jared Siegel hit a 32-yard field goal with 12 seconds to play forthe 24-22 victory), the 2001 Washington game (John Anderson kicked a 32-yardfield goal at the gun to give Washington a 27-24 win), the 2001 WashingtonState game (Drew Dunning hit a 35-yard field goal with 1:50 to play to tie thegame and then hit another 35-yarder in the first overtime for the 30-27 victory,after USC's Ryan Killeen--who missed a fourth quarter PAT--missed a 52-yard tryin overtime), the 2003 California game (after USC's Ryan Killeen missed a 39-yard field goal in the third overtime, Tyler Fredrickson--who had his 2 previousfield goals blocked--hit a 38-yarder to give the Bears a 34-31 win, snapping USC's11-game winning streak), and the 2006 Rose Bowl (Vince Young scrambled foran 8-yard TD on fourth-and-5 with 19 seconds to go in the BCS ChampionshipGame as Texas denied USC an unprecedented third consecutive nationalchampionship and snapped Troy's 34-game winning streak).
DRAMATIC FINISHES, THE COMEBACK, LAST MINUTE FIELD GOALS, OVERTIME GAMES
2006 FOOTBALL MEDIA GUIDE — PAGE 101
USC: AMERICA’S BOWL TEAMUSC has a remarkable record in bowl games. The Trojans have the nation’s
sixth highest bowl winning percentage (.636) among the 68 schools which havemade at least 10 bowl appearances (behind Utah's .727, Toledo's .700, PennState's .658, Georgia Tech's .647 and Boston College's .647). USC is just 2 winsbehind Alabama for most bowl victories, 30 to 28. Troy’s 44 bowl appearancesrank fourth behind only Alabama (53), Tennessee (45) and Texas (45). USC oncewon 9 consecutive bowl games (the 1923-30-32-33-39-40-44-45 Rose Bowlsand 1924 Christmas Festival); only Florida State has won more in a row (11).
USC’s overall post-season record is 28-16. The Trojans were a bowlparticipant each year they were eligible from 1972 to 1990.
Troy has appeared in an unprecedented 30 Rose Bowls, where it has a 21-9 mark. That’s not only the most Rose Bowl wins of any team, but also the mostwins by a school in a single bowl. USC has won 8 of its last 11 Rose Bowls. USChas also appeared in 11 other bowls--the Christmas Festival, Liberty Bowl,Bluebonnet Bowl, Fiesta Bowl, Aloha Bowl, Florida Citrus Bowl, Sun (JohnHancock) Bowl (twice), Freedom Bowl (twice), Cotton Bowl, Las Vegas Bowl andOrange Bowl (twice).
USC’s Rose Bowl Record
1923--USC 14, Penn State 31930--USC 47, Pittsburgh 141932--USC 21, Tulane 121933--USC 35, Pittsburgh 01939--USC 7, Duke 31940--USC 14, Tennessee 01944--USC 29, Washington 01945--USC 25, Tennessee 01946--Alabama 34, USC 141948--Michigan 49, USC 01953--USC 7, Wisconsin 01955--Ohio State 20, USC 71963--USC 42, Wisconsin 371967--Purdue 14, USC 131968--USC 14, Indiana 31969--Ohio State 27, USC 161970--USC 10, Michigan 31973--USC 42, Ohio State 171974--Ohio State 42, USC 211975--USC 18, Ohio State 171977--USC 14, Michigan 61979--USC 17, Michigan 101980--USC 17, Ohio State 161985--USC 20, Ohio State 171988--Michigan State 20, USC 171989--Michigan 22, USC 141990--USC 17, Michigan 101996--USC 41, Northwestern 322004--USC 28, Michigan 142006--Texas 41, USC 38 (BCS Championship)
USC’s Record in Other Bowls
1924--USC 20, Missouri 7 (Christmas Festival)1975--USC 20, Texas A&M 0 (Liberty Bowl)1977--USC 47, Texas A&M 28 (Bluebonnet Bowl)1982--Penn State 26, USC 10 (Fiesta Bowl)1985--Alabama 24, USC 3 (Aloha Bowl)1987--Auburn 16, USC 7 (Florida Citrus Bowl)1990--Michigan State 17, USC 16 (John Hancock Bowl)1992--Fresno State 24, USC 7 (Freedom Bowl)1993--USC 28, Utah 21 (Freedom Bowl)1995--USC 55, Texas Tech 14 (Cotton Bowl)1998--TCU 28, USC 19 (Sun Bowl)2001--Utah 10, USC 6 (Las Vegas Bowl)2003--USC 38, Iowa 17 (Orange Bowl)2005--USC 55, Oklahoma 19 (Orange Bowl, BCS Championship)
2004 ROSE BOWLUSC 28, MICHIGAN 14
Nation’s Leading Bowl Teams(Based on total victories)
W L T PCT.Alabama 30 20 3 .594USC 28 16 0 .636Penn State 24 12 2 .658Oklahoma 24 14 1 .628Tennessee 24 21 0 .533
2005 BCS CHAMPIONSHIP GAMEORANGE BOWL
USC 55, OKLAHOMA 19
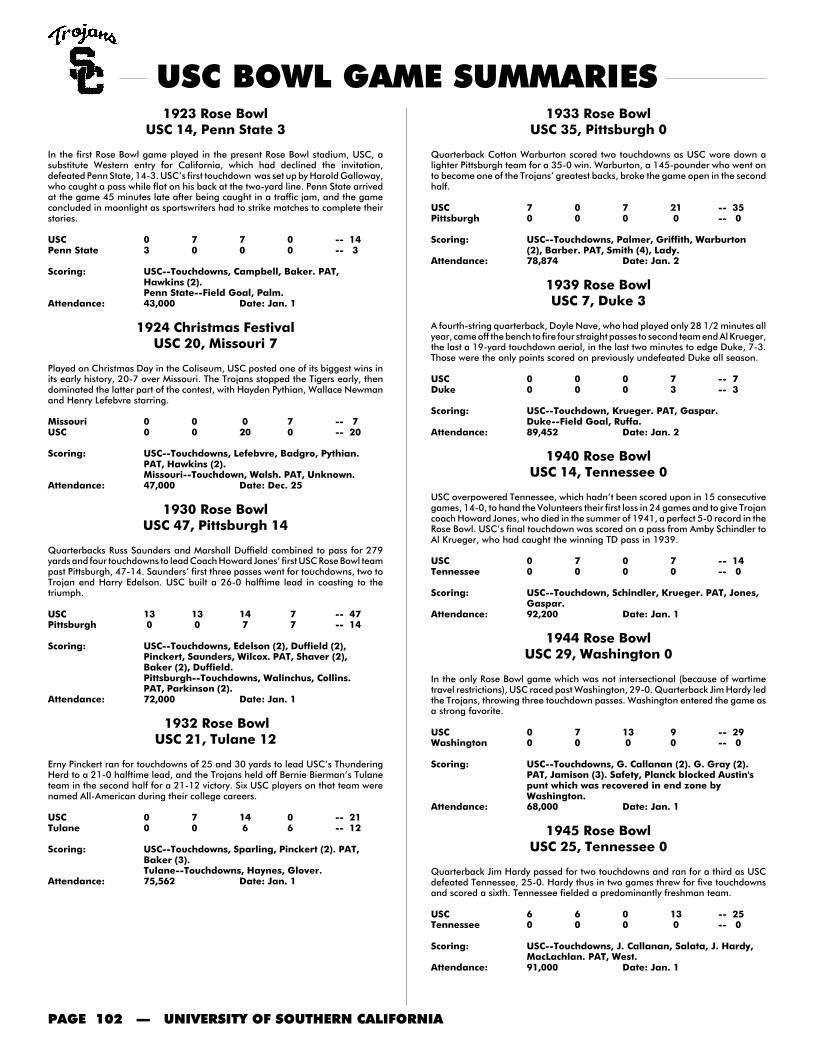
PAGE 102 — UNIVERSITY OF SOUTHERN CALIFORNIA
1923 Rose BowlUSC 14, Penn State 3
In the first Rose Bowl game played in the present Rose Bowl stadium, USC, asubstitute Western entry for California, which had declined the invitation,defeated Penn State, 14-3. USC’s first touchdown was set up by Harold Galloway,who caught a pass while flat on his back at the two-yard line. Penn State arrivedat the game 45 minutes late after being caught in a traffic jam, and the gameconcluded in moonlight as sportswriters had to strike matches to complete theirstories.
USC 0 7 7 0 -- 14Penn State 3 0 0 0 -- 3
Scoring: USC--Touchdowns, Campbell, Baker. PAT,Hawkins (2).Penn State--Field Goal, Palm.
Attendance: 43,000 Date: Jan. 1
1924 Christmas FestivalUSC 20, Missouri 7
Played on Christmas Day in the Coliseum, USC posted one of its biggest wins inits early history, 20-7 over Missouri. The Trojans stopped the Tigers early, thendominated the latter part of the contest, with Hayden Pythian, Wallace Newmanand Henry Lefebvre starring.
Missouri 0 0 0 7 -- 7USC 0 0 20 0 -- 20
Scoring: USC--Touchdowns, Lefebvre, Badgro, Pythian.PAT, Hawkins (2).Missouri--Touchdown, Walsh. PAT, Unknown.
Attendance: 47,000 Date: Dec. 25
1930 Rose BowlUSC 47, Pittsburgh 14
Quarterbacks Russ Saunders and Marshall Duffield combined to pass for 279yards and four touchdowns to lead Coach Howard Jones’ first USC Rose Bowl teampast Pittsburgh, 47-14. Saunders’ first three passes went for touchdowns, two toTrojan end Harry Edelson. USC built a 26-0 halftime lead in coasting to thetriumph.
USC 13 13 14 7 -- 47Pittsburgh 0 0 7 7 -- 14
Scoring: USC--Touchdowns, Edelson (2), Duffield (2),Pinckert, Saunders, Wilcox. PAT, Shaver (2),Baker (2), Duffield.Pittsburgh--Touchdowns, Walinchus, Collins.PAT, Parkinson (2).
Attendance: 72,000 Date: Jan. 1
1932 Rose BowlUSC 21, Tulane 12
Erny Pinckert ran for touchdowns of 25 and 30 yards to lead USC’s ThunderingHerd to a 21-0 halftime lead, and the Trojans held off Bernie Bierman’s Tulaneteam in the second half for a 21-12 victory. Six USC players on that team werenamed All-American during their college careers.
USC 0 7 14 0 -- 21Tulane 0 0 6 6 -- 12
Scoring: USC--Touchdowns, Sparling, Pinckert (2). PAT,Baker (3).Tulane--Touchdowns, Haynes, Glover.
Attendance: 75,562 Date: Jan. 1
1933 Rose BowlUSC 35, Pittsburgh 0
Quarterback Cotton Warburton scored two touchdowns as USC wore down alighter Pittsburgh team for a 35-0 win. Warburton, a 145-pounder who went onto become one of the Trojans’ greatest backs, broke the game open in the secondhalf.
USC 7 0 7 21 -- 35Pittsburgh 0 0 0 0 -- 0
Scoring: USC--Touchdowns, Palmer, Griffith, Warburton(2), Barber. PAT, Smith (4), Lady.
Attendance: 78,874 Date: Jan. 2
1939 Rose BowlUSC 7, Duke 3
A fourth-string quarterback, Doyle Nave, who had played only 28 1/2 minutes allyear, came off the bench to fire four straight passes to second team end Al Krueger,the last a 19-yard touchdown aerial, in the last two minutes to edge Duke, 7-3.Those were the only points scored on previously undefeated Duke all season.
USC 0 0 0 7 -- 7Duke 0 0 0 3 -- 3
Scoring: USC--Touchdown, Krueger. PAT, Gaspar.Duke--Field Goal, Ruffa.
Attendance: 89,452 Date: Jan. 2
1940 Rose BowlUSC 14, Tennessee 0
USC overpowered Tennessee, which hadn’t been scored upon in 15 consecutivegames, 14-0, to hand the Volunteers their first loss in 24 games and to give Trojancoach Howard Jones, who died in the summer of 1941, a perfect 5-0 record in theRose Bowl. USC’s final touchdown was scored on a pass from Amby Schindler toAl Krueger, who had caught the winning TD pass in 1939.
USC 0 7 0 7 -- 14Tennessee 0 0 0 0 -- 0
Scoring: USC--Touchdown, Schindler, Krueger. PAT, Jones,Gaspar.
Attendance: 92,200 Date: Jan. 1
1944 Rose BowlUSC 29, Washington 0
In the only Rose Bowl game which was not intersectional (because of wartimetravel restrictions), USC raced past Washington, 29-0. Quarterback Jim Hardy ledthe Trojans, throwing three touchdown passes. Washington entered the game asa strong favorite.
USC 0 7 13 9 -- 29Washington 0 0 0 0 -- 0
Scoring: USC--Touchdowns, G. Callanan (2). G. Gray (2).PAT, Jamison (3). Safety, Planck blocked Austin'spunt which was recovered in end zone byWashington.
Attendance: 68,000 Date: Jan. 1
1945 Rose BowlUSC 25, Tennessee 0
Quarterback Jim Hardy passed for two touchdowns and ran for a third as USCdefeated Tennessee, 25-0. Hardy thus in two games threw for five touchdownsand scored a sixth. Tennessee fielded a predominantly freshman team.
USC 6 6 0 13 -- 25Tennessee 0 0 0 0 -- 0
Scoring: USC--Touchdowns, J. Callanan, Salata, J. Hardy,MacLachlan. PAT, West.
Attendance: 91,000 Date: Jan. 1
USC BOWL GAME SUMMARIES

2006 FOOTBALL MEDIA GUIDE — PAGE 103
1946 Rose BowlAlabama 34, USC 14
Harry Gilmer, known more as a passer, ran for 113 yards while Alabama’s defensechoked off USC to give the Crimson Tide a 34-14 victory. Alabama allowed USCjust six yards of rushing and 35 passing. It was USC’s first loss in the Rose Bowlfollowing eight victories.
Alabama 7 13 7 7 -- 34USC 0 0 0 14 -- 14
Scoring: Alabama--Touchdowns, Self (2), Gilmer, Tew,Hodges. PAT, Morrow (4).USC--Touchdowns, Adelman, Clark. PAT,Lillywhite (2).
Attendance: 93,000 Date: Jan. 1
1948 Rose BowlMichigan 49, USC 0
Michigan, under Coach Fritz Crisler gunning for the national championship,defeated USC, 49-0, to duplicate its 1902 triumph over Stanford. Halfback RobertChappuis ran for 91 yards, passed for 188, and made six key plays which set upor scored five touchdowns.
Michigan 7 14 7 21 -- 49USC 0 0 0 0 -- 0
Scoring: Michigan--Touchdowns, Weisenburger (3), C.Elliott, Yerges, Derricotte, Rifenburg. PAT,Brieske (7).
Attendance: 93,000 Date: Jan. 1
1953 Rose BowlUSC 7, Wisconsin 0
Substitute quarterback Rudy Bukich threw a 22-yard touchdown pass to Al“Hoagy” Carmichael in the third quarter which held up for a 7-0 USC triumph overWisconsin to give the Pacific Coast its first victory over the Big Ten since the twoconferences began their agreement in 1947. Jess Hill, the Trojan coach whoplayed on the 1929 USC team, became the first man to have played on andcoached winning Rose Bowl teams.
USC 0 0 7 0 -- 7Wisconsin 0 0 0 0 -- 0
Scoring: USC--Touchdown, Carmichael. PAT, Tsagalakis.Attendance: 101,500 Date: Jan. 1
1955 Rose BowlOhio State 20, USC 7
Woody Hayes made his first trek to the Rose Bowl as a coach and his nationalchampion Ohio State team defeated USC, 20-7, in the mud and rain. DaveLeggett quarterbacked the Buckeyes to three touchdowns and USC’s AramisDandoy returned a punt 86 yards for a touchdown. UCLA was PCC champion, butwas barred from returning by the conference’s “no-repeat” rule.
Ohio State 0 14 0 6 -- 20USC 0 7 0 0 -- 7
Scoring: Ohio State--Touchdowns, Leggett, Watkins,Harkrader. PAT, Weed, Watkins.USC--Touchdown, Dandoy. PAT, Tsagalakis.
Attendance: 89,191 Date: Jan. 1
1963 Rose BowlUSC 42, Wisconsin 37
John McKay made his debut in the Rose Bowl as USC coach and saw hisundefeated national champion Trojans outscore Wisconsin, 42-37. USC, withPete Beathard throwing four touchdown passes, ran up a 42-14 lead. ThenWisconsin’s Ron VanderKelen got hot, bringing the Badgers to within five pointswhen time ran out. VanderKelen completed 33 of 48 passes for 401 yards, and11 Rose Bowl records were broken.
USC 7 14 14 7 -- 42Wisconsin 7 0 7 23 -- 37
Scoring: USC--Touchdowns, Bedsole (2), Butcher, Wilson,Heller, F. Hill. PAT, Lupo (6).Wisconsin--Touchdowns, Kurek, VanderKelen,Holland, Korner, Richter. PAT, Korner (5).Safety, USC bad center snap downed in endzone by USC.
Attendance: 98,698 Date: Jan. 1
1967 Rose BowlPurdue 14, USC 13
A two-point conversion attempt by USC with less than three minutes remainingwas foiled and Purdue emerged a 14-13 victor. After Troy Winslow flipped a 19-yard touchdown pass to Rod Sherman, Boilermaker back George Catavolosintercepted the conversion pass. Perry Williams scored both Purdue touchdownson short bursts.
Purdue 0 7 7 0 -- 14USC 0 7 0 6 -- 13
Scoring: Purdue--Touchdowns, P. Williams (2). PAT,Griese (2).USC--Touchdowns, McCall, Sherman. PAT,Rossovich.
Attendance: 100,807 Date: Jan. 2
1968 Rose BowlUSC 14, Indiana 3
O.J. Simpson ran for 128 yards and scored both USC touchdowns on short blastsas the Trojans defeated Indiana, 14-3, to wrap up the national football title. USCstarted the game without five regulars and lost two more during the game, but hadenough depth to prevail.
USC 7 0 7 0 -- 14Indiana 0 3 0 0 -- 3
Scoring: USC--Touchdowns, Simpson (2). PAT, Aldridge (2).Indiana--Field Goal, Kornowa.
Attendance: 102,946 Date: Jan. 1
1969 Rose BowlOhio State 27, USC 16
Rex Kern quarterbacked national champion Ohio State to a 27-16 defeat of USC,overcoming a 10-0 deficit and heroics by Trojan O.J. Simpson. Simpson, theHeisman Trophy winner, rushed for 171 yards, including an 80-yard touchdownscamper. But five USC turnovers and Ohio State’s power proved too much.
Ohio State 0 10 3 14 -- 27USC 0 10 0 6 -- 16
Scoring: Ohio State--Touchdowns, Otis, Hayden, Gillian.Field Goals, Roman (2). PAT, Roman (2).USC--Touchdowns, Simpson, Dickerson. PAT,Ayala. Field Goal, Ayala.
Attendance: 102,063 Date: Jan. 1
1970 Rose BowlUSC 10, Michigan 3
A record fourth straight appearance by USC was culminated in a 10-3 victory overMichigan, whose coach Bo Schembechler suffered a heart attack and missed thegame. The Trojans’ “Wild Bunch” on defense held Michigan to a field goal whilea 33-yard pass from Jimmy Jones to Bobby Chandler was the margin of victory.
USC 3 0 7 0 -- 10Michigan 0 3 0 0 -- 3
Scoring: USC--Touchdown, Chandler. PAT, Ayala. FieldGoal, Ayala.Michigan--Field Goal, Gillian.
Attendance: 103,878 Date: Jan. 1
1973 Rose BowlUSC 42, Ohio State 17
Fullback Sam Cunningham, known primarily for his superb blocking, dived for fourtouchdowns, a modern era Rose Bowl record, as USC defeated Ohio State, 42-17, to win the national title. USC broke away after a 7-7 halftime tie as AnthonyDavis ran for 157 yards and Mike Rae threw for 229.
USC 7 0 21 14 -- 42Ohio State 0 7 3 7 -- 17
Scoring: USC--Touchdowns, Swann, Cunningham (4), Davis.PAT, Rae (6).Ohio State--Touchdowns, Keith, Bledsoe. PAT,Conway (2). Field Goal, Conway.
Attendance: 106,869 Date: Jan. 1
BOWL GAME SUMMARIES
PAGE 104 — UNIVERSITY OF SOUTHERN CALIFORNIA
1974 Rose BowlOhio State 42, USC 21
The 1974 game was a reverse of the 1973 contest as Ohio State, held to a 14-14 tie at halftime, exploded in the second half for a 42-21 win over USC. Freshmanfullback Pete Johnson scored three touchdowns and Archie Griffin ran for 149yards. But the Player of the Game was OSU quarterback Cornelius Greene, whocompleted six of eight passes for 129 yards and scrambled effectively.
Ohio State 7 7 13 15 -- 42USC 3 11 7 0 -- 21
Scoring: Ohio State--Touchdowns, Johnson (3), Greene,Elia, Griffin. PAT, Conway (4). Greene (2-pointer).USC--Touchdowns, McKay, Davis. PAT, Limahelu,McKay (2-pointer). Field Goals, Limahelu (2).
Attendance: 105,267 Date: Jan. 1
1975 Rose BowlUSC 18, Ohio State 17
Rhodes scholar Pat Haden threw a 38-yard touchdown pass late in the game toJohn McKay, the coach’s son, then fired a two-point conversion pass to SheltonDiggs to give USC a narrow 18-17 win over Ohio State and the national title.Haden threw for 181 yards and two touchdowns to offset the loss of AnthonyDavis, who suffered a rib injury.
USC 3 0 0 15 -- 18Ohio State 0 7 0 10 -- 17
Scoring: USC--Touchdowns, Obradovich, McKay. PAT,Limahelu, Diggs (2-pointer). Field Goal, Limahelu.Ohio State--Touchdowns, Henson, Greene.PAT, Klaban (2). Field Goal, Klaban.
Attendance: 106,721 Date: Jan. 1
1975 Liberty BowlUSC 20, Texas A&M 0
In coach John McKay’s final game at USC, his Trojans shook off a four-game losingstreak and surprised favored Texas A&M in Memphis, 20-0. USC’s defense cameup with many big plays, while the offense was able to move against the nationally-ranked Aggie defense. Vince Evans threw a 65-yard bomb to Randy Simmrin toset up one touchdown and Liberty Bowl MVP Ricky Bell ran 76 yards with a screenpass for another TD.
USC 3 17 0 0 -- 20Texas A&M 0 0 0 0 -- 0
Scoring: USC--Touchdowns, Tatupu, Bell. PAT, Walker (2).Field Goal, Walker.
Attendance: 52,129 Date: Dec. 22
1977 Rose BowlUSC 14, Michigan 6
After an opening game loss, USC won its 11th-straight game by grinding out a14-6 win over Michigan. Michigan’s Rob Lytle opened the scoring with a one-yardplunge, but Trojan quarterback Vince Evans got that back with a one-yard rollout.Freshman tailback Charles White, filling in for the injured Ricky Bell, rushed for 122yards, including a seven-yard scoring jaunt that closed out the scoring for USC.John Robinson became only the second rookie coach from the Pac-8 to capturea Rose Bowl.
Michigan 0 6 0 0 -- 6USC 0 7 0 7 -- 14
Scoring: Michigan--Touchdown, Lytle.USC--Touchdowns, Evans, White. PAT, Walker (2).
Attendance: 106,182 Date: Jan. 1
1977 Bluebonnet BowlUSC 47, Texas A&M 28
In a wild game in Houston’s Astrodome, USC beat Texas A&M, 47-28. Down 14-0 in the first quarter, the Trojans scored the next 34 points and coasted to victory.Both teams combined for 1,139 yards of total offense, including 620 by USC.Dwight Ford raced 94 yards for a score, a USC record, while Rob Hertel threw fourtouchdown passes (including two to Calvin Sweeney).
USC 7 13 14 13 -- 47Texas A&M 14 0 0 14 -- 28
Scoring: USC--Touchdowns, Sweeney (2), White, Simmrin,Ford, Tatupu. PAT, Jordan (3), Burns (2-pointer).Field Goals, Jordan (2).Texas A&M--Touchdowns, Woodard (2), Moseley,Armstrong. PAT, Franklin (4).
Attendance: 52,842 Date: Dec. 31
1979 Rose BowlUSC 17, Michigan 10
In a tough defensive struggle, the Pac-10 ran its victory string to five in a row asUSC outlasted Michigan 17-10. Trojan tailback Charles White rushed for 99 yardsand scored what proved to be the decisive touchdown on a disputed three-yardplunge in the second quarter. Michigan quarterback Rick Leach almost brought theWolverines back from a 14-point halftime deficit by completing eight of 11second-half passes, including a 44-yard scoring bomb to Roosevelt Smith. Whiteand Leach shared Player of the Game honors.
USC 7 10 0 0 -- 17Micigan 0 3 7 0 -- 10
Scoring: USC--Touchdowns, Brenner, White. PAT, Jordan(2). Field Goal, Jordan.Michigan--Touchdown, R. Smith. PAT, Willner.Field Goal, Willner.
Attendance: 105,629 Date: Jan. 1
1980 Rose BowlUSC 17, Ohio State 16
USC’s Heisman Trophy winning tailback Charles White stole the show as he ledthe Trojans to a come-from-behind win in one of the most exciting games in RoseBowl history. White, named Player of the Game for the second straight year,rushed for a Rose Bowl record 247 yards, including a one-yard touchdown divewith 1:32 remaining in the game that gave USC the win. The Trojans jumped outto an early 10-0 lead, but Ohio State came back to take a 16-10 lead in the fourthquarter. Then White took over. With 5:21 remaining in the game, the Trojans gotthe ball on their own 17-yard line. USC marched 83 yards in eight plays, all onthe ground. On the winning drive, White carried six times for 71 yards.
USC 3 7 0 7 -- 17Ohio State 0 10 3 3 -- 16
Scoring: USC--Touchdowns, K. Williams, White. PAT, Hipp(2). Field Goal, Hipp.Ohio State--Touchdown, G. Williams. PAT,Janakievski. Field Goals, Janakievski (3).
Attendance: 105,526 Date: Jan. 1
1982 Fiesta BowlPenn State 26, USC 10
Penn State’s fine defense and key Trojan miscues led to USC’s first non-Rose Bowlpost-season defeat, 26-10. Marcus Allen, who was held to 85 yards, fumbledaway the ball on USC’s first possession and the Lions’ Curt Warner, who gained145 yards, went in to score several plays later. USC’s only touchdown came on a20-yard interception by Chip Banks.
Penn State 7 10 9 0 -- 26USC 7 0 3 0 -- 10
Scoring: Penn State--Touchdowns, Warner (2), Garrity.PAT, Franco (3). Field Goal, Franco. Safety,Paffenroth blocked punt out of end zone.USC--Touchdown, Banks. PAT, Jordan. FieldGoal, Jordan.
Attendance: 71,053 Date: Jan. 1
BOWL GAME SUMMARIES
2006 FOOTBALL MEDIA GUIDE — PAGE 105
1985 Rose BowlUSC 20, Ohio State 17
USC’s defense prevailed over Ohio State’s potent offense featuring HeismanTrophy runnerup Keith Byars, 20-17. Interceptions set up USC’s two touchdownsand the Trojan defense also stopped two key Buckeye drives--one early in thecontest that got to the four-yard line and one late in the game which ended upat the 38. For USC, Tim Green threw touchdown passes to Joe Cormier andTimmie Ware while Steve Jordan kicked two 51-yard field goals. Most of OhioState’s points were provided by Rich Spangler, who hit three field goals.
Ohio State 3 3 3 8 -- 17USC 10 7 3 0 -- 20
Scoring: Ohio State--Touchdown, Carter. PAT, Tomczak(2-pointer). Field Goals, Spangler (3).USC--Touchdowns, Cormier, Ware. PAT, Jordan (2).Field Goals, Jordan (2).
Attendance: 102,594 Date: Jan. 1
1985 Aloha BowlAlabama 24, USC 3
The nation’s top two bowl teams (USC with the most wins and Alabama with themost appearances) faced off in balmy Honolulu. The score was tied at halftime,3-3, but the Crimson Tide rolled in the second half to win, 24-3. USC managedonly 197 total yards (just 61 rushing) and 10 first downs. On the other hand,Alabama had 317 total yards, 205 coming on the ground. Mike Shula, Al Bell,Gene Jelks, Cornelius Bennett and Jon Hand starred for the Crimson Tide.
USC 0 3 0 0 -- 3Alabama 3 0 7 14 -- 24
Scoring: USC--Field Goal, Shafer.Alabama--Touchdowns, Turner, Whitehurst, Bell.PAT, Tiffin (3). Field Goal, Tiffin.
Attendance: 35,183 Date: Dec. 28
1987 Florida Citrus BowlAuburn 16, USC 7
In Ted Tollner’s final game as USC’s head coach, his Trojan defense held downa high-powered Auburn offense (led by Brent Fullwood, the nation’s top runner).But Troy’s offense was ineffective and the Tigers won, 16-7, in chilly Orlando.Outside linebacker Marcus Cotton provided USC with its only score on aspectacular 24-yard scoring interception return early in the game. Two longsecond-quarter drives by Auburn, plus a safety late in the game, gave Auburn itsonly points. USC made it interesting at the end after Louis Brock blocked a Tigerpunt, but the Trojans couldn’t score on fourth-and-inches at the goal line.Fullwood had 152 yards rushing and one TD for Auburn, which had just 290 totalyards on the day.
Auburn 0 14 0 2 -- 16USC 7 0 0 0 -- 7
Scoring: Auburn--Touchdowns, Reeves, Fullwood. PAT,Knapp (2). Safety, Peete called for intentionallygrounding in end zone.USC--Touchdown, Cotton. PAT, Shafer.
Attendance: 51,113 Date: Jan. 1
1988 Rose BowlMichigan State 20, USC 17
For just the fifth time ever, teams that had played each other earlier in the season(Michigan State had beaten USC in the 1988 season opener, 27-13) faced off inthe Rose Bowl. The Spartans prevailed again, this time 20-17, breaking a six-game Big Ten losing streak in Pasadena. Despite getting more total yards (410 to276) and first downs (21 to 11) than Michigan State, the Trojans were hurt by fiveturnovers, including a lost fumble on a mishandled snap on the Spartan 30 with1:37 to play as Troy was marching downfield on an impressive drive. USC trailed14-3 at halftime, but two touchdowns passes from quarterback Rodney Peete tosplit end Ken Henry eventually evened the score at 17-17 midway through the lastquarter. On the next series, Michigan State moved into its winning field goalposition with the help of a spectacular 36-yard jump pass from quarterback BobbyMcAllister to split end Andre Rison. USC had to play Michigan State for the secondtime that season without star Trojan tailback Steven Webster (he sat out theopener with a sprained ankle and tore knee ligaments in the regular season finaleagainst UCLA).
USC 3 0 7 7 -- 17Michigan State 7 7 0 6 -- 20
Scoring: USC--Touchdowns, Henry (2). PAT, Rodriguez (2).Field Goal, Rodriguez.Michigan State--Touchdowns, White (2). PAT,Langeloh (2). Field Goals, Langeloh (2).
Attendance: 103,847 Date: Jan. 1
1989 Rose BowlMichigan 22, USC 14
In a “teacher-versus-pupil” matchup (USC coach Larry Smith served underWolverine coach Bo Schembechler at both Miami of Ohio and Michigan), theteacher got the better of it as Michigan came back from a 14-3 halftime deficit towin 22-14. It was a disappointing way for USC to conclude its 100th anniversaryof football. After falling behind 3-0 on a Mike Gillette field goal, USC charged backas quarterback Rodney Peete ran for a pair of short touchdowns (1 and 4 yards)in the second quarter. But it was all Michigan in the second half, as the Wolverinesamassed 230 of their 352 total yards then. They scored 3 times on long drives, thefirst on a 6-yard Demetrius Brown-to-Chris Calloway aerial that capped a 67-yarddrive to open the third quarter. Then Rose Bowl MVP Leroy Hoard scored twice forMichigan on 1-yard runs in the final period, coming off of 92 and 70-yard drives.Hoard had 142 yards rushing (the first time anyone broke the century rushing markagainst the Trojans all year), including a key 61-yard run to set up the Wolverines’final score. USC, which managed a season-low 296 total yards, didn’t help itscause with 5 turnovers, 11 penalties and numerous missed tackles. The win wasonly Schembechler’s second in 9 tries in Pasadena.
Michigan 3 0 6 13 -- 22USC 0 14 0 0 -- 14
Scoring: Michigan--Touchdowns, Calloway, Hoard (2).PAT, Gillette. Field Goal, Gillette.USC--Touchdowns, Peete (2). PAT, Rodriguez (2).
Attendance: 101,688 Date: Jan. 2
1990 Rose BowlUSC 17, Michigan 10
After losing the previous 2 Rose Bowls, USC beat Michigan, 17-10, in a rematchof the 1989 game. The win, in Bo Schembechler’s final game as Wolverine coach,ended Michigan’s national title hopes. It was a bittersweet victory for USC coachLarry Smith, who served 6 years as an assistant under Schembechler at Miami ofOhio and Michigan. Trojan tailback Ricky Ervins, the Rose Bowl MVP, scored thegame-winning TD on a 14-yard run with 1:10 to play. Ervins, who lives 5 minutesfrom the Rose Bowl and used to park cars there on New Year’s Day, ran for 126yards on 30 carries and caught 5 passes for 44 yards. USC, which dominated thestats, pulled off a key play early in the second quarter when defensive guard DanOwens blocked a punt. Six plays later, quarterback Todd Marinovich, who was 22-of-31 passing for 178 yards, scored on a 1-yard run. Kickers J.D. Carlson ofMichigan (19 yards) and USC’s Quin Rodriguez (34 yards) then matched fieldgoals prior to halftime. Michigan tied the score on a 2-yard run then matched fieldgoals prior to halftime. Michigan tied the score on a 2-yard run by tailback AllenJefferson in the third quarter and the game looked like it would end deadlocked.But, with less than 6 minutes to go, Michigan was called for holding on a successfulWolverine fake punt and USC took over at its 25-yard line. Troy then went 75 yardsin 11 plays for the winning score. Michigan tailback Leroy Hoard became the firstplayer to run for 100-plus yards against USC all season (he had 108 yards on 17carries).
USC 0 10 0 7 -- 17Michigan 0 3 7 0 -- 10
Scoring: USC--Touchdowns, Marinovich, Ervins. PAT,Rodriguez (2). Field Goal, Rodriguez.Michigan--Touchdown, Jefferson. PAT, Carlson.Field Goal, Carlson.
Attendance: 103,450 Date: Jan. 1
1990 John Hancock BowlMichigan State 17, USC 16
Playing in its eighth different bowl, USC lost to Michigan State, 17-16, in the JohnHancock Bowl in El Paso, Tex., on New Year’s Eve day. It was the 900th game inTrojan gridiron history. USC dominated the stats, getting more total yards (336-215), plays (76-52), first downs (21-12) and possession time (35:45-24:15). Troylimited the powerful Spartan rushing attack (which averaged 253.9 yards a gameto rank 10th nationally) to an MSU season-low 84 yards. Big Ten rushing champtailback Tico Duckett got just 18 yards. But Troy had 4 costly turnovers (including2 in MSU’s end zone) and converted only 5 of 14 first downs. USC scored first whenquarterback Todd Marinovich hit flanker Gary Wellman with a 7-yard TD pass latein the opening quarter. Marinovich was 18-of-30 for 174 yards, but threw 3interceptions (including 1 in the end zone) and also fumbled the ball on fourth-and-goal at the Spartan 1-yard line in the middle of the second quarter (which
BOWL GAME SUMMARIES

PAGE 106 — UNIVERSITY OF SOUTHERN CALIFORNIA
MSU recovered in the end zone). Michigan State marched 80 yards to a TD afterthat fumble recovery, with tailback Hyland Hickson scoring on an 18-yard run totie the score at 7-7 at halftime. After placekicker Quin Rodriguez hit a 20-yard fieldgoal on USC’s opening possession of the second half (which ended on the MSU3-yard line), the Spartans countered with a 21-yard TD pass from quarterback DanEnos to flanker Courtney Hawkins (the first TD reception by a MSU wide receiverall year), who was the game’s MVP with 6 catches for a season-high 106 yards,and a career-long 52-yard field goal by John Langeloh. Rodriguez capped USC’snext series with a career-long 54-yard field goal early in the fourth quarter. Then,down 17-13, cornerback Stephon Pace intercepted an Enos pass to give USC theball near midfield. But the Trojans could get no closer than the MSU 17 beforebackup quarterback Shane Foley’s errant pitch stalled the drive and USC had tosettle for another Rodriguez field goal, this one 43 yards with 5:54 to play. Troy,however, could never get the ball back. Tailback Mazio Royster had a game-high125 yards on 32 carries, only the second player to break the century rushing markagainst Michigan State in 1990. USC rushed for 156 yards versus an MSU defensewhich was ranked 17th nationally against the run (allowing just 113.2 yards agame). Trojan outside linebacker Craig Hartsuyker, who had 2 quarterback sacksand forced a fumble, was named the game’s Most Valuable Lineman.
USC 7 0 3 6 -- 16Michigan State 0 7 10 0 -- 17
Scoring: USC--Touchdown, Wellman. PAT, Rodriguez.Field Goals, Rodriguez (3).Michigan State--Touchdowns, Hickson, Hawkins.PAT, Langeloh (2). Field Goal, Langeloh.
Attendance: 50,562 Date: Dec. 31
1992 Freedom BowlFresno State 24, USC 7
USC, making its 35th bowl appearance, was stunned by unranked, 8-pointunderdog Fresno State, 24-7, in the ninth Freedom Bowl in Anaheim Stadium. Itwas the first meeting ever between the Trojans and Bulldogs. Fresno Statedominated, particularly in the second half. FSU, with the nation’s No. 1 scoringoffense (40.5) and No. 2 total offense (482.9), held the ball 15-plus minutes more(37:32-22:28), had 322 more total yards (405-183), 10 more first downs (24-14)and 34 more plays (84-50). USC’s 183 total yards were its fewest since getting163 at Washington in 1990 and its 95 passing yards were its fewest since getting74 at Oregon in 1991. The Trojans had 4 turnovers (FSU had none) and convertedjust 1-of-9 third downs. The first half, played in a steady rain, ended in a 7-7 tie.It was the fewest points FSU had scored in a half all season (and it was the firsttime the Bulldogs were shut out in the first quarter in 1992). USC tailback DeonStrother opened the scoring with a 1-yard plunge early in the second quarter, butFSU answered when fullback Lorenzo Neal ran for a 1-yard TD. While attemptingto catch a pass on the last play of the half, USC flanker Curtis Conway sprainedhis right knee and missed the second half (it was the first time in 23 games thathe didn’t catch a pass). After a 43-yard field goal by placekicker Derek Mahoneyin the third quarter, FSU scored twice late in the game on runs by tailbacks AnthonyDaigle (2 yards) and Ron Rivers (5 yards). Rivers had a game-high 104 yards on19 carries, while Freedom Bowl MVP Neal had 75 yards on 19 tries. Bulldogquarterback Trent Dilfer was 13-of-28 for 164 yards. Tailback Estrus Crayton,USC’s game MVP, led Troy with 79 yards on 19 attempts. Defensively, safety JasonSehorn had a game-high 10 tackles, while inside linebacker Brian Williams added9 stops, cornerback Jerald Henry had 8, and cornerback Jason Oliver had 7 alongwith a blocked field goal.
Fresno State 0 7 3 14 -- 24USC 0 7 0 0 -- 7
Scoring: Fresno State--Touchdowns, Neal, Daigle, Rivers.PAT, Mahoney (3). Field Goal, Mahoney.USC--Touchdown, Strother. PAT, Ford.
Attendance: 50,745 Date: Dec. 29
1993 Freedom BowlUSC 28, Utah 21
USC, exorcising the demons of Anaheim Stadium, scored 28 points in the first 17minutes of the game and then held off a furious Utah second-half rally to winFreedom Bowl X, 28-21, before 43,150 fans and a national Raycom televisionaudience. The Trojans, making their 36th bowl appearance, were playing inAnaheim Stadium for the third time in 14 games, but had yet to win there (losingin the 1992 Freedom Bowl to Fresno State and the 1993 season-openingDisneyland Pigskin Classic to North Carolina). It was the first USC-Utah meetingin 45 years. USC, a 17-point favorite, scored easily on its first 4 possessions. Inthe first quarter, quarterback Rob Johnson hit All-American wide receiver JohnnieMorton on TD throws of 31 and 9 yards, and tailback David Dotson dove over from2 yards out. Then, Johnson connected with tight endJohnny McWilliams on a 5-yard scoring toss just 1:26 into the second quarter. But after that, USC’s offense--hampered by an ineffective running game (the Trojans ran for just 91 yards)--stalled. Utah, playing in just its fourth bowl game, came alive after halftime,scoring on 3 of its first 5 possessions: a 59-yard TD pass from quarterback MikeMcCoy to slotback Henry Lusk, a 34-yard run by fullback Jamal Anderson and a1-yard run by tailback Keith Williams. But USC got the ball with 3:19 to play and
held it until just 8 seconds remained, when McCoy’s desperation pass wasintercepted by cornerback John Herpin (Herpin’s second pick of the game).Morton was named the game’s MVP as he caught a Freedom Bowl-record 10passes for 147 yards and the 2 scores (to tie a Freedom Bowl TD catch mark)despite playing weakened with the flu (7 of his catches for 121 yards and both TDswere in the first half). Johnson, who also had come down with a slight case of theflu, completed a Freedom Bowl-record 30 passes in 44 attempts for 345 yards andthe 3 TD aerials (in the first half, he was 17-of-25 for 255 with the 3 TDs). Mortonbecame the Pac-10’s No. 2 career receiver with 201 grabs, while Johnson setUSC’s season pass completion percentage mark (68.6%). USC tailback ShawnWalters ran for a game-high 70 yards on 19 carries, while fullback Deon Strotheradded 50 rushing yards on 9 attempts and caught 6 passes for 63 yards. USC widereceiver Ken Grace, who had 4 catches for 48 yards, returned a punt 31 yards, aFreedom Bowl mark. USC generated 436 yards of total offense on 82 plays andheld the ball 32:14. Utah threatened 3 times inside the USC 30-yard line in theopening half, but USC’s defense held each time, including an impressive goal linestand and an interception in the end zone by cornerback Jason Sehorn. Utah cameinto the game averaging 484.6 total yards (fifth in the U.S.), 324.3 passing yards(seventh in the U.S.) and 30.8 points, but was limited to 350 total yards (286through the air). McCoy, who was second nationally in total offense (330.8), was23-of-40 for 286 yards, 1 TD and 3 interceptions (at the half, he was 10-of-20 for81 yards with 2 picks). Lusk had 6 catches for 140 yards and the TD, whileAnderson ran for 67 yards and the TD on 16 carries and caught 7 passes for 61yards. Outside linebacker Brian Williams and safety Mike Salmon topped USC intackles with 9 each (both had 2 for losses). USC coach John Robinson, who hasled USC to at least 8 wins in each of his 8 seasons there, upped his bowl recordto 5-1.
Utah 0 0 13 8 -- 21USC 20 8 0 0 -- 28
Scoring: Utah--Touchdowns, He. Lusk, Anderson, Williams.PAT, Yergerson, Anderson (2-pointer).USC--Touchdowns, Morton (2), Dotson, McWilliams.PAT, Ford (2), Banta (2-pointer).
Attendance: 37,203 Date: Dec. 30
1995 Cotton BowlUSC 55, Texas Tech 14
USC (ranked 20th by UPI, 21st by AP and 22nd by USA Today/CNN) made quitean impression in its first visit to the Mobil Cotton Bowl Classic, smashing TexasTech, 55-14, in a record-filled performance before a sellout crowd of 70,218 andan NBC-TV national audience. It was USC’s 24th bowl victory, its 37th bowlappearance (in 10 different bowls), its 17th win in the last 19 games againstSouthwest Conference opponents, its third win in 3 tries over Texas Tech, andcoach John Robinson’s sixth bowl win in 7 trips (giving Robinson at least 8 winsin each of his 9 seasons at Troy). After 59 years, it was also the last Cotton Bowlwhere an SWC team served as host. Texas Tech was making only its second visitto the Cotton Bowl (the first was in 1939). The game was over quickly, as it was28-0 after the first quarter and 34-0 at halftime. USC led 48-0 before Texas Techscored against the Trojan reserves late in the third quarter. USC set Cotton Bowlrecords for most points in a game, most points in a quarter (USC’s most since alsoscoring 28 in the second quarter against California in 1978) and most touchdowns(7), while scoring its most points ever in a bowl and posting its biggest bowl victorymargin (second in Cotton Bowl history). It was the most points scored againstTexas Tech since Miami had 61 in 1986. Troy’s first 3 scores came in a 1:16 span.After tailback Shawn Walters, 1 of 8 Texans on the Trojan roster, ran 11 yards fora TD, USC recovered a fumble on the ensuing kickoff and, on the next play,quarterback Rob Johnson hit fullback Terry Barnum for a 19-yard score. Threeplays later, cornerback John Herpin, another Texas native, intercepted a ZebbieLethridge pass and returned it 26 yards for a TD. Herpin, who intercepted anotherpass in the second quarter to set up a field goal, was named the game’sOutstanding Defensive Player. USC’s next 3 TDs came on aerials to wide receiverKeyshawn Johnson of 12, 22 and 86 yards (the 86-yarder was 1 yard shy of thelongest pass in Cotton Bowl and USC history), the first 2 from Rob Johnson andthe third from quarterback Brad Otton. Keyshawn Johnson, selected as thegame’s Outstanding Offensive Player, had 8 catches overall for a Cotton Bowl-record 222 yards (just 7 yards shy of the Trojan single game record). His 3 TDcatches set a Cotton Bowl record and equalled a Trojan mark. Rob Johnson, whobecame USC’s career passing yardage leader and the Pac-10 and USC recordholderfor career completion percentage, was 16-of-21 for 289 yards (the second mostyards in Cotton Bowl history). The other Trojan scores came on a late 2-yard Ottonpass to tight end Jeff Diltz and second quarter field goals by placekicker Cole Fordof 39 and a career-best 42 yards. Ford’s 7 PAT kicks was a Cotton Bowl record.Walters ran for a game-best 82 yards on 14 carries. Otton was 8-of-14 for 146yards. USC thoroughly dominated the statistics, more than doubling Texas Techin total yardage (578-260) and possession time (40:02-19:58) while also havingmore first downs (21-14) and plays (80-63). USC, which averaged 7.2 yards perplay, set Cotton Bowl records for total yards, passing yards (a USC record 435) andcompletions (24). USC did this against a Texas Tech defense which entered thegame third nationally in pass efficiency defense (88.6), 10th in scoring defense(17.4) and 22nd in total defense (311.0). The Red Raiders had held 5 foes to singledigits in scoring and had given up just 47 points in their previous 5 games. Insidelinebacker Jeff Kopp led USC in tackles with 7, while safety Sammy Knight added6. Texas Tech, which punted 10 times, advanced into USC territory on just 4 ofits 16 possessions.
BOWL GAME SUMMARIES

2006 FOOTBALL MEDIA GUIDE — PAGE 107
USC 28 6 14 7 -- 55Texas Tech 0 0 7 7 -- 14
Scoring: USC--Touchdowns, K. Johnson (3), Herpin, Walters,Barnum, Diltz. PAT, Ford (7). Field Goals, Ford (2).Texas Tech--Touchdowns, Lethridge, Mitchell.PAT, Davis (2).
Attendance: 70,218 Date: Jan. 2
1996 Rose BowlUSC 41, Northwestern 32
Behind the stellar play of wide receiver Keyshawn Johnson and quarterback BradOtton, USC (ranked 15th by UPI and 17th by USA Today/CNN and AP) put an endto No. 3-ranked Northwestern’s Cinderella season with an exciting 41-32 RoseBowl win before a sellout crowd of 100,102 and a national ABC-TV audience. Itwas the 50th anniversary of the Pac-10/Big Ten agreement in the Rose Bowl. Itwas USC’s 20th victory in its unprecedented 28th trip to Pasadena (but its first sincethe 1990 game) and Troy’s first win over a Top 3 team since defeating Michiganin that 1990 Rose Bowl, while Northwestern--having its first winning season since1971 (the Wildcats came in with a 10-1 record)--was playing in only its second-ever bowl (its first since winning the 1949 Rose Bowl). It also gave USC coach JohnRobinson a 4-0 Rose Bowl record (and 7-1 in all bowls). The Trojans jumped offto a quick start, driving 83 yards with the opening kickoff while using a no-huddleoffense as running back LaVale Woods scored on a 1-yard plunge. ButNorthwestern answered on its first possession, as running back Darnell Autry ran3 yards for a TD to cap a 68-yard drive. USC then scored 17 unanswered secondquarter points: a scrambling 21-yard TD pass from Otton to running back TerryBarnum, a 30-yard field goal by placekicker Adam Abrams and, on Northwestern’snext possession, cornerback Daylon McCutcheon’s 53-yard fumble return aftersafety Sammy Knight knocked the ball loose from Wildcat wide receiver BrianMusso. Northwestern got a 29-yard field goal from placekicker Brian Gowins with2 seconds to go in the half following a Trojan fumble, but Troy led 24-10 atintermission (it was USC’s most first half points since scoring 34 against Texas Techin the 1995 Cotton Bowl). The Wildcats then scored on their first 4 possessionsof the second half: another Gowins field goal (this one from 28 yards), a 9-yardAutry run (after Northwestern recovered a surprise on-side kick), a 1-yard sneakby quarterback Steve Schnur (which followed a 56-yard Trojan scoring strike fromOtton to Johnson), and a 2-yard Autry run early in the fourth quarter that gaveNorthwestern its first lead of the day, 32-31. But USC came right back, gettinga 46-yard Abrams field goal (the longest by a Trojan since Quin Rodriguez hit a54-yarder against Michigan State in the 1990 John Hancock Bowl). Safety JesseDavis then sealed the victory for USC with an interception which led to a 5-yardTD by running back Delon Washington. Johnson, who served as a Trojan ballboyat the 1985 Rose Bowl, was named the Rose Bowl MVP, as he grabbed 12 passes(all for first downs) for a Rose Bowl record 216 yards (his 17th 100-yard outing inhis career and the eighth of 1995). Otton played the entire game for the first timein the 1995 season, hitting 29-of-44 passes for 391 yards (all career highs) with2 TDs and no interceptions; the yardage was 1 yard shy of Rob Johnson’s USCrecord and was the third most in Rose Bowl history. Autry had his 13th consecutive100-yard rushing game, getting 110 yards on 32 carries with the 3 TDs, whileSchnur was 23-of-39 for a career-best 336 yards (including 7 completions for 145yards to wide receiver D’Wayne Bates). Northwestern outgained USC in totalyards, 475-520, and limited Troy to just 29 rushing yards (its fewest since getting7 yards against UCLA in 1993), but the Wildcats’ uncharacteristic 2 turnovers ledto 14 Trojan points, proving costly to a team which was third nationally in turnovermargin (1.82). The Wildcats also had a TD pass called back because of a penaltylate in the game and missed 2 field goals, including a 49-yard attempt that hit theupright with 35 seconds to go. USC, on the other hand, had 11 penalties(including 9 in the second half). Trojan cornerback Brian Kelly had a game-high11 tackles (along with 2 deflections), while Knight and linebacker Scott Fieldsadded 7 stops each.
USC 7 17 7 10 -- 41Northwestern 7 3 16 6 -- 32
Scoring: USC--Touchdowns, L. Woods, Barnum, McCutcheon,K. Johnson, Washington. PAT, Abrams (5). FieldGoals, Abrams (2).Northwestern--Touchdowns, D. Autry (3), Schnur.PAT, Gowins (2). Field Goals, Gowins (2).
Attendance: 100,102 Date: Jan. 1
1998 Sun BowlTCU 28, USC 19
In a stunning upset, 16-point underdog TCU—which barely qualified for post-season play with a 6-5 record—used a potent option attack and a stingy rundefense to beat USC, 28-19, in the 65th Norwest Sun Bowl before 46,612 fans anda national CBS-TV audience. The Horned Frogs’ option offense gained 314 yardson the ground (the most against the Trojans since Notre Dame had 330 in 1992)and their defense limited Troy to a USC and Sun Bowl record low -23 rushing yards.It was TCU’s first bowl win since 1957. TCU, which scored touchdowns on its first3 possessions of the opening half on runs of 3 and 60 yards by TB Basil Mitchelland 7 yards by QB Patrick Batteaux, led 21-3 at intermission. USC’s only first-half
points came on a 35-yard field goal by PK Adam Abrams late in the second quarter.The Horned Frogs opened up a 25-point lead on their initial drive of the secondhalf as Batteaux scored on a 3-yard run. USC battled back by scoring on its first3 drives of the second half, first on a 23-yard pass from QB Carson Palmer to WRBilly Miller, then on a 1-yard run by TB Petros Papadakis and a 46-yard Abramsfield goal early in the fourth quarter (Abrams was the game’s Special Teams MVP).The Trojans got the ball back twice more, but those drives resulted in a loss of 30yards as Palmer was sacked 3 times. Mitchell, the game’s MVP rushed for 185yards on 19 carries (including 114 in the first half) for a 9.7 average per carry.Batteaux added 94 yards on 28 tries while executing the option to perfection (healso completed 4-of-5 passes for 51 yards). TCU stayed mainly on the ground,as 61 of its 67 plays were runs (the most rushes against USC since Penn State had66 in 1993). The Horned Frogs threw for only 51 yards (the fewest allowed by USCsince Oregon State had 29 in 1995). TCU amassed 365 total yards, converted 10-of-16 third downs (including 7-of-9 in the first half) and held the ball 35:51. USCmanaged just 257 total yards and 12 first downs on only 49 plays. Troy convertedjust 1-of-11 third downs (that came in the first quarter). Palmer was 17-of-28 fora career-best 280 yards, but was sacked 6 times (all in the second half). WR R.Jay Soward had a game-best 6 catches for 64 yards, WR Larry Parker added 4 for104 yards and Miller had 3 for 67 yards. LB Chris Claiborne had a game-best 13tackles and S Grant Pearsall added 11 stops.
USC 0 3 13 3 -- 19TCU 14 7 7 0 -- 28
Scoring: USC--Touchdowns, Miller, Papadakis. PAT, Abrams.Field Goals, Abrams (2).TCU--Touchdowns, Mitchell (2), Batteaux (2). PAT,Kaylakie(4).
Attendance: 46,612 Date: Dec. 31
2001 Las Vegas BowlUtah 10, USC 6
Behind a time-consuming, powerful running attack and a dominating defense,Utah beat USC, 10-6, in the 10th Sega Sports Las Vegas Bowl before 22,385 fansand a national ABC-TV audience. The outcome–the Trojans’ fifth loss of 2001 by5 or less points–snapped USC’s 4-game winning streak and Utah’s 2-game losingskid. It also ended the Utes’ 6-game losing streak to USC (Utah last beat Troy in1916). The defensive struggle produced the lowest scoring Las Vegas Bowl ever.But that figured, as both squads were highly-ranked nationally in scoring defense(USC was 11th at 17.9 and Utah was 13th at 18.6). Utah, which entered the gameranked in the Top 25 nationally in all 4 defensive categories, limited the Trojansto just 151 total yards, including only 1 yard rushing. It was USC’s fewest totalyards since getting 124 against Washington in 1996 and its fewest rushing yardssince having -20 at Arizona in 1999. USC had just 12 first downs, converted only2-of-12 third downs and was sacked 4 times (including twice by ROV SheldonDeckart, who had a team-high 6 tackles). USC punted on 8 of its 11 possessions(including on its first 4 drives and its final 4), went 3-and-out 5 times andpenetrated Utah territory only 4 times (getting inside the 30 just once). At halftime,USC had just 15 total yards (with -53 on the ground) and 3 first downs. On offense,Utah–which was 12th nationally in rushing offense at 218.9–controlled the clock(holding the ball 16 minutes more than USC, 38:01 to 21:59) by running 54 timesfor 222 of its 358 total yards. The Utes ran off 75 plays (USC had just 51). HBAdam Tate ran for a game-best 103 yards on 23 carries, while fellow HB DameonHunter (a 1,000-yard runner in 2001) rushed for 94 yards on 17 tries and wasnamed Utah’s game MVP. Utah QB Lance Rice was 12-of-21 for 136 yards whilehitting some timely passes, including a game-best 4 to WR Josh Lyman (for 41yards) and 3 to TE Michael Richardson (for 35 yards). Utah scored on its secondpossession of the game as Tate ran for a 3-yard TD to cap a 7-play, 48-yard drivelate in the first quarter. Then, after USC PK David Davis–the Pac-10’s mostaccurate field goal kicker in 2001–missed a 47-yarder (breaking his string of 12consecutive successful field goals), the Utes drove 61 yards in 12 plays to set upPK Ryan Kaneshiro’s 26-yard field goal with 29 seconds to play in the half. USCcame alive to start the second half, taking the opening kickoff and driving 80 yardsin 12 plays, finishing with a 2-yard scoring run by FB Sunny Byrd (but Davis missedthe PAT). But despite getting a pair of turnovers–CB Kris Richard recovered afumble and LB John Cousins intercepted a pass–on Utah’s next 2 possessions, theTrojans couldn’t get any closer than the Ute 40-yard line the rest of the way. TrojanQB Carson Palmer was 15-of-26 for 150 yards, while WRs Kareem Kelly (33 yards)and Devin Pitts (32 yards) each had 3 receptions. Trojan All-American safety TroyPolamalu–picked as USC’s game MVP–had a Las Vegas Bowl record and career-high 20 tackles (with a game record 12 solo), including 3 for losses, while SDeShaun Hill (14 stops and a forced fumble) and LB Frank Strong (12 tackles,including 4 for losses) also posted career bests in tackles. It was USC’s first gamein the state of Nevada and its sixth contest on Christmas Day (but its first since1934). The crowd was the smallest ever to see USC in a bowl and the fewest ata Trojan game since 20,938 showed up at Oregon State in 1997.
Utah 7 3 0 0 -- 10USC 0 0 6 0 -- 6
Scoring: Utah--Touchdown, Tate. PAT, Kaneshiro.Field Goal, Kaneshiro.USC--Touchdown, Byrd.
Attendance: 22,385 Date: Dec. 25
BOWL GAME SUMMARIES

PAGE 108 — UNIVERSITY OF SOUTHERN CALIFORNIA
2003 Orange BowlUSC 38, Iowa 17
No. 5-ranked USC–behind a balanced offense and a stingy defense–staked itsclaim as one of the nation’s top teams as it swamped No. 3 Iowa, 38-17, in the69th FedEx Orange Bowl before a sold out crowd of 75,971 fans under the lightsin Pro Player Stadium and a national ABC-TV audience. It was Pac-10 co-champion USC’s eighth win in a row (giving Troy its first 11-win season since 1979)and it snapped Big Ten co-champ Iowa’s 9-game winning streak. It was the firstmeeting between the teams in 26 years and the first trip to the Orange Bowl foreither school. It also was Troy’s first win ever in Florida in 5 tries and came againstthe ninth AP-ranked squad the Trojans played in the 2002 season. And USCscored at least 30 points for a school-record eighth consecutive game. USCdominated the Hawkeyes statistically, getting more total yards (550-323), firstdowns (30-18), plays (80-58) and possession time (38:06-21:54). It was the ninthgame in a row that USC had at least 400 yards of total offense. Despite facingan Iowa defense that was second nationally against the run (68.2), Troy rushedfor a season-best 247 yards and scored 4 TDs on the ground. And USC–playingwithout 2-time All-American S Troy Polamalu, who was held out with a sorehamstring–kept in check a Hawkeye offense that was sixth nationally in scoring(38.9). At the start, it looked like Iowa would provide a stiff challenge as WR C.J.Jones ran back the opening kickoff an Orange Bowl-record 100 yards for a TD.But USC responded quickly as QB Carson Palmer’s 65-yard bomb to WR KareemKelly on Troy’s first play set up TB Justin Fargas’ 4-yard scoring run just 3 playslater. Then, after Iowa had to settle for a 35-yard field goal by PK Nate Kaedingafter advancing to the USC 2-yard line on the ensuing drive, USC reeled off 31unanswered points. First, PK Ryan Killeen atoned for an earlier missed field goalby nailing a 35-yarder late in the half (DT Bernard Riley then blocked Kaeding’s28-yard field goal try at the end of the half to keep the score knotted at 10-10).Next, USC scored on its first 3 possessions of the second half, first an 18-yardPalmer TD pass to WR Mike Williams, then a career-long 50-yard TD run by Fargas(to cap a 99-yard drive) and a 5-yard run by TB Sultan McCullough at the top ofthe fourth quarter. FB Sunny Byrd added a 6-yard scoring run late in the gamebefore Iowa added a touchdown against USC’s reserves on an 18-yard pass fromQB Brad Banks to WR Maurice Brown. Palmer proved his Heisman Trophy was nofluke as he hit 21-of-31 passes for 303 yards to earn Orange Bowl MVP honors,while Heisman runnerup Banks–the nation’s passing efficiency leader–was just15-of-36 for 204 yards and an interception (his first pick in his last 104 attempts).Fargas ran for 122 yards on 20 carries and McCullough added 76 yards on 12 tries,while Iowa RB Fred Russell–12th in the nation in rushing–was held to just 45 yardson 9 carries. Florida native Williams (game-high 99 yards) and WR Keary Colbert(81 yards) each had 6 receptions, while Kelly had 3 for 74 yards to set an NCAArecord for consecutive games with a catch (47) en route to becoming USC’s careerreception leader (204). Williams set NCAA freshman records for receptions (81),receiving yards (1,265) and receiving TDs (14). Brown had 6 catches for 63 yardsfor Iowa. LBs Mike Pollard and Matt Grootegoed each had a team-best 6 tacklesfor USC, while S Jason Leach had an interception and fumble recovery while fillingin for Polamalu. Iowa hurt itself with 13 penalties and turned the ball over twice.
Iowa 10 0 0 7 -- 17USC 7 3 14 14 -- 38
Scoring: Iowa--Touchdowns, Jones, Brown. PAT, Kaeding(2). Field Goal, Kaeding.USC--Touchdowns, Fargas (2), M. Williams,McCullough, Byrd. PAT, Killeen (5). Field Goal,Killeen.
Attendance: 75,971 Date: Jan. 2
2004 Rose BowlUSC 28, Michigan 14
QB Matt Leinart threw 3 touchdowns and caught another and the relentless Trojandefense recorded a season-high 9 sacks as No. 1 USC dominated No. 4 Michigan,28-14, in the 90th Rose Bowl before a soldout crowd of 93,849 and an ABC-TVnational audience. The victory (USC’s 21st Rose Bowl win) virtually guaranteedTroy the AP national championship, 25 years after its last national crown, and gaveUSC its first 12-win season since 1978. And it snapped Michigan’s 6-gamewinning streak. The Trojans built a 21-0 lead before Michigan scored late in thethird quarter. After DT Shaun Cody blocked a Wolverine field goal attempt earlyin the game, USC scored 4 plays into its first possession when WR Keary Colbertmade an over-the-shoulder fingertip grab of Leinart’s 25-yard aerial. Then, latein the first half following LB Lofa Tatupu’s interception (he grabbed a ball thatbounced off of SE Braylon Edwards’ foot and returned it 26 yards to the Michigan3), TB LenDale White took a Leinart toss 6 yards for another TD. Then, on theopening drive of the second half, Colbert made a spectacular one-handed grabof a 47-yard Leinart bomb (despite being interfered with) to up Troy’s cushion.However, Michigan answered on its next series with a scoring drive that tooknearly 8 minutes, capped by QB John Navarre’s 5-yard pass to TE Tim Massaquoi.But USC responded right back, scoring on a tricky 15-yard reverse pass from WRMike Williams to an unguarded Leinart. Wolverine TB Chris Perry ran 2 yards fora TD early in final quarter, but Michigan had the ball for only 4:12 in that quarterand never threatened again. Leinart was named the Rose Bowl MVP as heconnected on 23-of-34 passes for 327 yards with the 3 scores (and no intercep-tions), along with his TD catch. Colbert, who became USC’s career reception
leader (with 207 catches), had 6 catches for a career-best 149 yards. Williamsadded a team-best 8 catches for 88 yards. White’s TD was his 14th of the year,tying the USC freshman season record, while TB Reggie Bush–who had 41 yardsrushing, 42 receiving and 49 on returns–set the USC freshman season all-purposeyardage mark (1,331 yards). Tatupu had a team-high 12 tackles, CB Will Pooleadded 10 stops (including 2 sacks) with 5 deflections and DE Kenechi Udeze had3 sacks. USC’s 9 sacks were its most since getting 13 against Oregon in 1992.Although Michigan held the ball 34:26 and had more plays (84 to 60) and firstdowns (25 to 19), the Trojans accumulated 410 total yards to UM’s 320 (only 49rushing). Michigan came into the game having allowed just 15 sacks and 5 TDpasses all season. Navarre was 27-of-46 for 271 yards, Perry ran for 85 yards on23 tries and Edwards had a game-high 10 receptions for 107 yards. USC setschool overall attendance (946,482) and average (72,368) records.
USC 7 7 14 0 -- 28Michigan 0 0 7 7 -- 14
Scoring: USC--Touchdowns, Colbert (2), White, Leinart. PAT,Killeen (4).Michigan--Touchdowns, Massaquoi, Perry. PAT,Rivas (2).
Attendance: 93,849 Date: Jan. 1
2005 Orange BowlUSC 55, Oklahoma 19
Top-ranked USC won its 11th national championship–and second consecutive–inoverwhelming fashion by thumping No. 2 Oklahoma, 55-19, in the BCSChampionship Game in the 2005 Orange Bowl before a sold-out crowd of 77,912in Miami’s Pro Player Stadium and a national prime time ABC-TV audience. USCbecame just the second team ever to hold the AP No. 1 ranking from the pre-season through the bowl (Florida State did it in 1999). The Trojans also becamethe 10th team to win consecutive AP national championships. It was Troy’s 22nd
victory in a row, including a school-record 13 in 2004. USC’s 55 points tied its mostever in a bowl (and were the most ever allowed in a bowl by Oklahoma). It wasa school-record eighth time in the season that USC won by 30-plus points. USCscored 38 of its points off of OU turnovers. QB Matt Leinart, the game’s MVP, threwan Orange Bowl record (and USC record-tying) 5 touchdowns, including 3 to WRSteve Smith (tying both an Orange Bowl and USC record). PK Ryan Killeen set theUSC career scoring record (with 329 points). Oklahoma looked impressive early,driving 92 yards for the game’s first score midway through the opening quarteron a 5-yard pass from QB Jason White to WR Travis Wilson. But USC counteredon the ensuing possession to start a 28-point scoring run, as TE Dominique Byrdmade a spectacular one-handed TD grab of a 33-yard Leinart aerial. Then, latein the quarter, USC S Josh Pinkard recovered a botched OU punt return and TBLenDale White ran for a 6-yard TD on the next play. S Jason Leach interceptedWhite’s desperation heave on Oklahoma’s next series and Leinart soon after hitWR Dwayne Jarrett on a 54-yard scoring bomb. White was picked off again onOU’s next drive, this time by CB Eric Wright, and 3 plays later Leinart hit Smith fora 5-yard score with 9:17 to go in the half. After Oklahoma responded with a 29-yard field goal by PK Garrett Hartley, USC took just 4 plays to score again, this timeon Smith’s impressive one-armed reception of a 33-yard Leinart pass. WhenOklahoma fumbled the ball away on its following possession (LB Matt Grootegoedhad the recovery), Killeen nailed a 44-yard field goal with 3 seconds to go to putUSC up 38-10 at halftime. USC scored on its first 2 drives of the second half: a4-yard Leinart-to-Smith pass and a 42-yard Killeen field goal. The Trojans cappeda 27-point scoring outburst when White ran for an 8-yard TD just 5 plays afterGrootegoed intercepted White early in the fourth quarter. The Sooners scoredtwice late in the game against mostly Trojan reserves, getting a safety when Leinartfell on a fumbled snap in the end zone and then on White’s 9-yard pass to Wilson.USC piled up 525 total yards (averaging 8.3 yards per play) to the Sooners’ 372,even though OU ran off 13 more plays (76 to 63) and held the ball for 35:06. ButUSC didn’t turn the ball over, while Oklahoma had 5 giveaways. For USC, Leinartwas 18-of-35 for 332 yards, White ran for 118 yards on 15 carries, Smith had 7catches for 113 yards, Jarrett had 5 receptions for 115 yards and TB Reggie Bushhad 149 all-purpose yards (75 yards on 6 rushes, 36 yards on 2 kickoff returns,31 yards on 2 catches and a 7-yard punt return). LB Lofa Tatupu had a game-best12 tackles, S Darnell Bing added 10 stops and Leach and Grootegoed each had7. OU’s White was 24-of-36 for 244 yards, but threw 3 interceptions, Wilsoncaught 7 passes for 59 yards and TB Adrian Peterson ran for 82 yards on 25 tries.It marked the first time that a pair of Heisman Trophy winners (Leinart and White)faced each other in a game (in fact, 4 of the 2004 Heisman finalists played in thegame, including Bush and Peterson).
Oklahoma 7 3 0 9 -- 19USC 14 24 10 7 -- 14
Scoring: USC--Touchdowns, S. Smith (3), White (2), Byrd,Jarrett. PAT, Killeen (7). Field Goal, Killeen (2).Oklahoma--Touchdowns, Wilson (2). PAT, Hartley.Field Goal, Hartley. Safety, Team.
Attendance: 77,912 Date: Jan. 4
BOWL GAME SUMMARIES

2006 FOOTBALL MEDIA GUIDE — PAGE 109
2006 Rose BowlTexas 41, USC 38
QB Vince Young ran for a pair of touchdowns in the final minutes—including an8-yard scrambling game-winner on fourth-and-5 with 19 seconds to go—to helpNo. 2 Texas overcome a 12-point deficit and upend top-ranked USC, 41-38, inthe BCS Championship Game in the 2006 Rose Bowl before a sold-out crowd of93,986 and a national prime time ABC-TV audience. The win was Texas’s 20th ina row and snapped USC’s 34-game winning streak, denying the Trojans anunprecedented third consecutive national championship (it was also Troy’s firstloss after 16 straight non-conference wins and 16 consecutive victories over APTop 25 teams). Young, the 2005 Heisman Trophy runnerup and Rose BowlOffensive MVP, accounted for 467 yards of total offense, including 200 rushing(the most by a runner against USC since Oregon State’s Ken Simonton had 234in 2000) with 3 TDs and 267 through the air on 30-of-40 passing. After USC tooka 38-26 lead with 6:42 to play on QB Matt Leinart’s 22-yard scoring pass to WRDwayne Jarrett (Jarrett’s USC season record-tying 16th touchdown reception),Young marched the Longhorns down the field in 8 plays as he scrambled for a 17-yard TD with 4:03 to play. Then, after USC failed to convert a fourth-and-2 runat midfield on the ensuing possession, Texas took over with 2:09 remaining andtook 11 plays to score the clincher. After USC opened the game’s scoring on a4-yard run by TB LenDale White following LB Kaluka Maiava’s recovery of afumbled Texas punt return, the Longhorns scored the next 16 points on 3 straightpossessions. First, PK David Pino hit a 46-yard field goal after Texas recovered aUSC fumble at the UT 19-yard line, then TB Selvin Young took a lateral from Youngand went the remaining 12 yards for a score (coming after Texas intercepted aTrojan pass in the end zone), but Pino’s PAT missed. Then, TB Ramonce Taylorraced 30 yards for a TD. USC responded as PK Mario Danelo nailed a career-long43-yard field goal with 2 seconds to go in the half. The teams scored 53 pointsin the second half (the most points in a half ever at the Rose Bowl), when there were4 lead changes. After White ran 3 yards for a TD early in the half to give Troy a17-16 edge, Young answered with a 14-yard scoring run, but the Trojans cameright back on White’s 12-yard TD rumble late in the third quarter. After Pinomissed a field goal on the first play of the fourth quarter, USC drove 80 yards,culminating in TB Reggie Bush’s 26-yard scoring run. Texas narrowed the gap to31-26 on its next series as Pino hit a 34-yard field goal with 8:46 to play, but USCresponded on the ensuing drive with the Leinart-to-Jarrett TD for what appearedto be a comfortable lead before Young took over. The teams produced a RoseBowl-record 1,130 yards of combined total offense (the 9 combined rushing TDsand 60 combined first downs were also Rose Bowl marks). USC had a Rose Bowl-record 574 total yards (including 365 passing) and averaged 7.0 yards per play.Its 38 points were the most by a losing team in the Rose Bowl. Texas had 556 totalyards (the most against USC since California’s 601 in 1991), including 289 rushing(the most allowed by USC since Kansas State had 340 in 2001), while averaging7.3 yards per play (8.0 rushing). UT’s 30 first downs were the most against theTrojans since UCLA had a USC opponent record-tying 32 in 1970. White ran for124 yards and 20 carries with the 3 touchdowns (setting USC and Pac-10 recordsfor season and career rushing and overall TDs), Leinart was 29-of-40 for 365 yards(he was 16-of-19 for 218 yards in the second half) and at one point connected ona Rose Bowl-record 11 consecutive passes, Bush had 279 all-purpose yards (82on 13 carries, 95 on a season-best 6 receptions and 102 on 5 kickoff returns) andJarrett had 10 catches for 121 yards. Bush and White set an NCAA record forcareer touchdowns by teammates (99). S Darnell Bing led USC with 9 tackles, CBJosh Pinkard added 7 stops and LB Oscar Lua had 6. USC limited Texas to just3-of-11 third down conversions. Texas TE David Thomas had 10 catches for 88yards, while WR Limas Sweed added 8 receptions for 65 yards. S Michael Huff,the 2005 Thorpe Award winner and Rose Bowl Defensive MVP, had a game-best12 tackles with a fumble recovery. The game marked the first time that a teamfielded a pair of already-named Heisman winners (Leinart and Bush). It also wasUSC’s first loss to Texas in 5 meetings, its first defeat in 6 bowl appearances whenranked No. 1 and its first post-season loss to a Big 12 team in 6 bowl trips. USCset a school record for overall season attendance (1,037,565), the first time it wasover the million mark, and overall season attendance average (79,813). Thegame was viewed on ABC-TV by 35.6 million fans, making it the highest-ratedcollege football game since the 1987 Fiesta Bowl.
Texas 0 16 7 18 -- 41USC 7 3 14 14 -- 38
Scoring: USC--Touchdowns, White (3), Bush, Jarrett. PAT, Danelo(5). Field Goal, Danelo.Texas--Touchdowns, V. Young (3), S. Young, Taylor.PAT, Pino (3), V. Young (2-pointer). Field Goal, Pino (2).
Attendance: 93,926 Date: Jan. 4
BOWL GAME SUMMARIES, 2006 BOWL SCHEDULE
2006 Bowl GamesDec. 19 San Diego Co. Credit Union Poinsettia Bowl, San Diego, Calif.Dec. 20 GMAC Bowl, Mobile, Ala.Dec. 21 Pioneer PureVision Las Vegas Bowl, Las Vegas, Nev.Dec. 22 New Orleans Bowl, New Orleans, La.Dec. 23 Birmingham Bowl, Birmingham, Ala.Dec. 23 New Mexico Bowl, Albuquerque, N.M.Dec. 23 Fort Worth Bowl, Fort Worth, Tex.Dec. 24 Sheraton Hawaii Bowl, Honolulu, Hi.Dec. 26 Motor City Bowl, Detroit, Mich.Dec. 27 Independence Bowl, Shreveport, La.Dec. 27 Emerald Bowl, San Francisco, Calif.Dec. 28 Pacific Life Holiday Bowl, San Diego, Calif.Dec. 29 Gaylord Hotels Music City Bowl, Nashville, Tenn.Dec. 29 Vitalis Sun Bowl, El Paso, Tex.Dec. 29 AutoZone Liberty Bowl, Memphis, Tenn.Dec. 29 Champs Sports Bowl, Orlando, Fla.Dec. 29 Insight Bowl, Phoenix, Ariz.Dec. 30 Meineke Car Bowl, Charlotte, N.C.Dec. 30 MasterCard Alamo Bowl, San Antonio, Tex.Dec. 30 Chick-fil-A Bowl, Atlanta, Ga.Dec. 31 MPC Computers Bowl, Boise, Ida.Jan. 1 Outback Bowl, Tampa, Fla.Jan. 1 AT&T Cotton Bowl Classic, Dallas, Tex.Jan. 1 Capital One Bowl, Orlando, Fla.Jan. 1 Toyota Gator Bowl, Jacksonville, Fla.Jan. 1 Rose Bowl presented by Citi, Pasadena, Calif.Jan. 1 Tostitos Fiesta Bowl, Tempe, Ariz.Jan. 2 FedEx Orange Bowl, Miami, Fla.Jan. 3 Allstate Sugar Bowl, New Orleans, La.Jan. 6 International Bowl, Toronto, CanadaJan. 8 BCS National Championship Game, Glendale, Ariz.(Note: Subject to change)