Usability testing
42
USABILITY TESTING - Punto Damar P -
-
Upload
gamelanyk -
Category
Technology
-
view
578 -
download
0
Transcript of Usability testing

USABILITY TESTING- Punto Damar P -
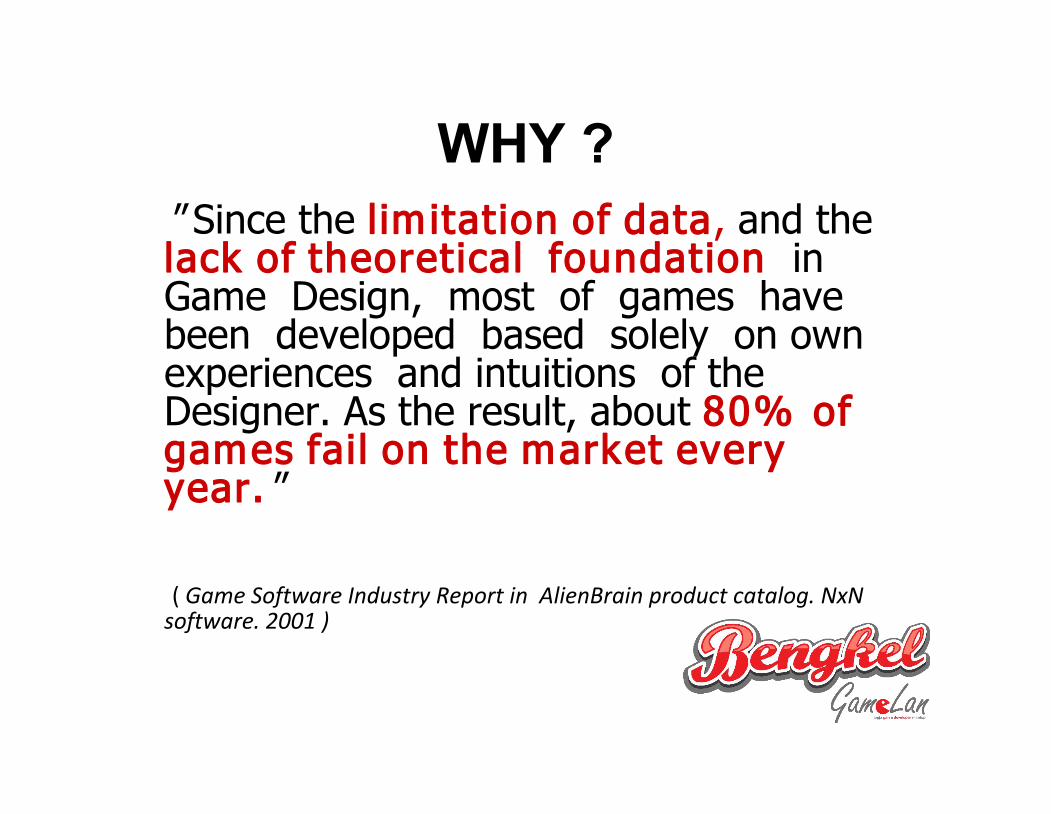
WHY ?" Since the limitation of data, and the lack of theoretical foundation in Game Design, most of games have been developed based solely on own experiences and intuitions of the Designer. As the result, about 80% of games fail on the market every year."
( Game Software Industry Report in AlienBrain product catalog. NxN software. 2001 )
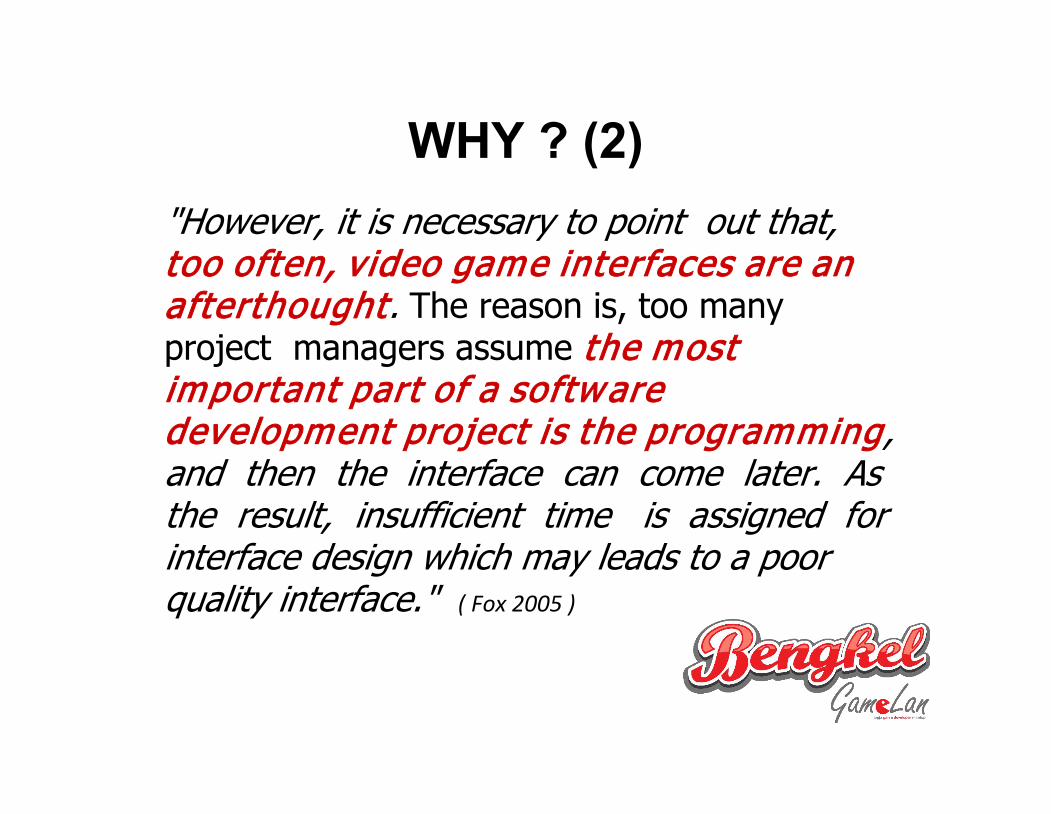
WHY ? (2)"However, it is necessary to point out that, too often, video game interfaces are an afterthought. The reason is, too many project managers assume the most important part of a software development project is the programming, and then the interface can come later. As the result, insufficient time is assigned for interface design which may leads to a poor quality interface." ( Fox 2005 )

MORE INFORMATION ...
"Human Computer Interaction in Game Design"
- Nguyen Hung -
http://www.theseus.fi/bitstream/handle/10024/43234/Nguyen_Hung.pdf?sequence=1

MORE INFORMATION ... (2)
"Quantifying The User Experince"
- Jeff Sauro / James R. Lewis -

USABILITY TESTING ?
DEBUGGING != USABILITY TESTING
BUG FREE != USABLE


HOW DO WE DO IT ?• Compare it to a specific benchmark or
goal.
• Get stastistical ways to get more precise answers.
• Get statistically significant evidence from small samples.
HOW DO WE SET A BENCHMARK ?
• Based on historical data obtained from previous test that included the task.
• Based on findings reported in published scientific or marketing research.
• Negotiate criteria with the stakeholders who are responsible for the product.
HOW DO WE SET A BENCHMARK ? (2)
Some suggestions :• The best objective basis are data from previous
usability studies of predecessor or competitive products.
• The source of historical data should be studies of similiar types of participans, completing the same tasks, under the same conditions.
• Negotiate with other stakeholders for the final set of shared goals.
HOW DO WE SET A BENCHMARK ? (2)
Some other suggestions :• Establish some specific objectives
immediately, so you can measure improvements.
• Revise your product in the early stages.
• Do not change reasonable goals to accomodate an unusable product.
COMPARING A COMPLETION RATE TO A BENCHMARK
small sample test & largle sample test
SMALL SAMPLE TEST
• success / fail
• "small" sample size = the total number of users tested is less than 30.

HERE'S THE FORMULA
( brace yourselves )
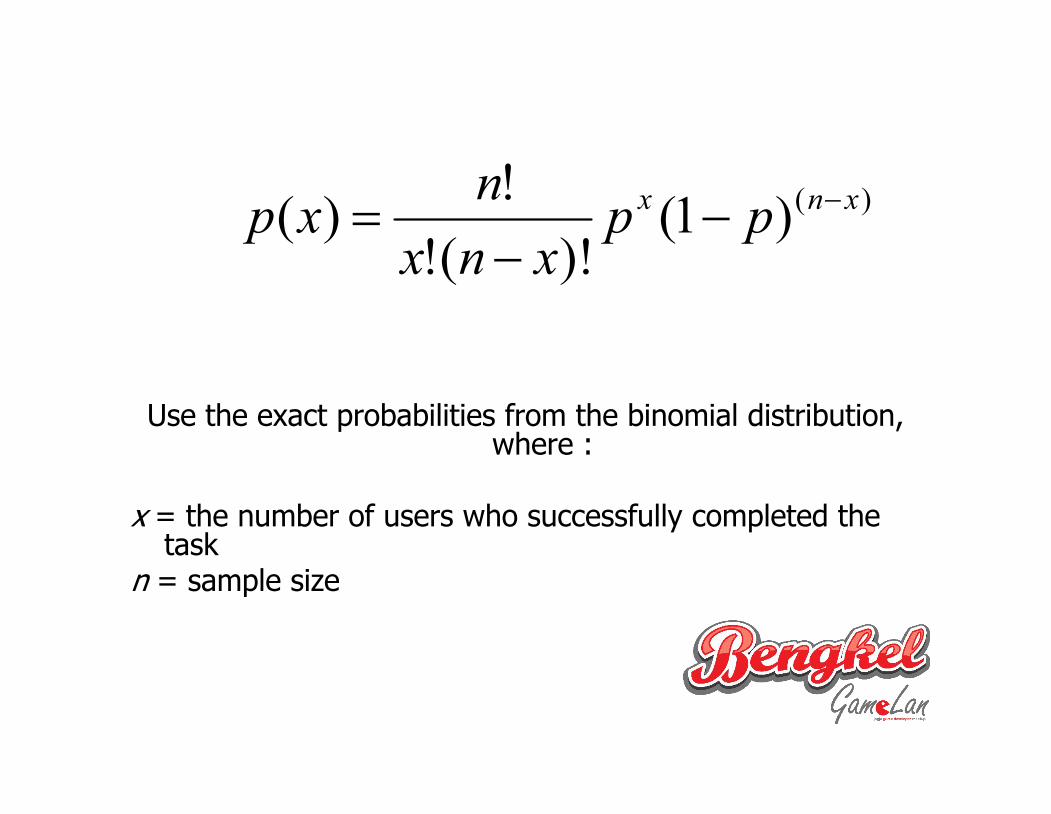
Use the exact probabilities from the binomial distribution, where :
x = the number of users who successfully completed the task
n = sample size
)()1()!(!
!)( xnx ppxnx
nxp

LIFE HACK ..
Use Microsoft Excel's function :BINOMDST()
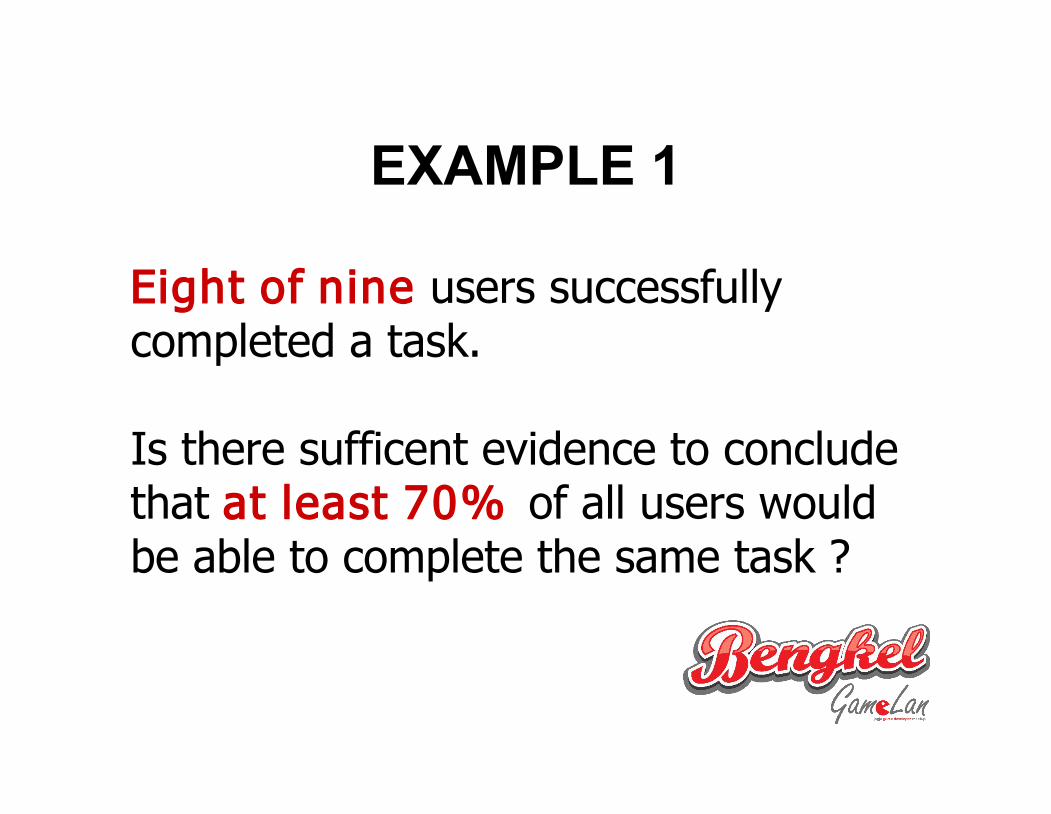
EXAMPLE 1
Eight of nine users successfully completed a task.
Is there sufficent evidence to conclude that at least 70% of all users would be able to complete the same task ?
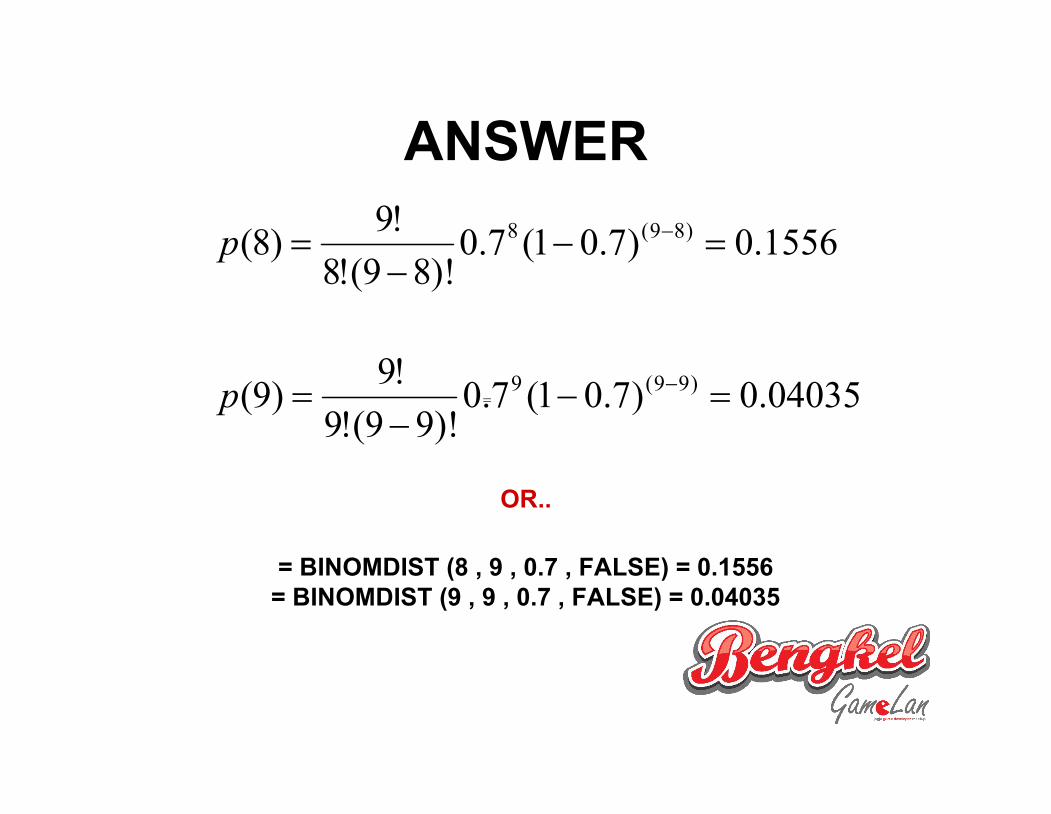
ANSWER1556.0)7.01(7.0
)!89(!8!9)8( )89(8
p
04035.0)7.01(7.0)!99(!9
!9)9( )99(9
p
OR..
= BINOMDIST (8 , 9 , 0.7 , FALSE) = 0.1556= BINOMDIST (9 , 9 , 0.7 , FALSE) = 0.04035
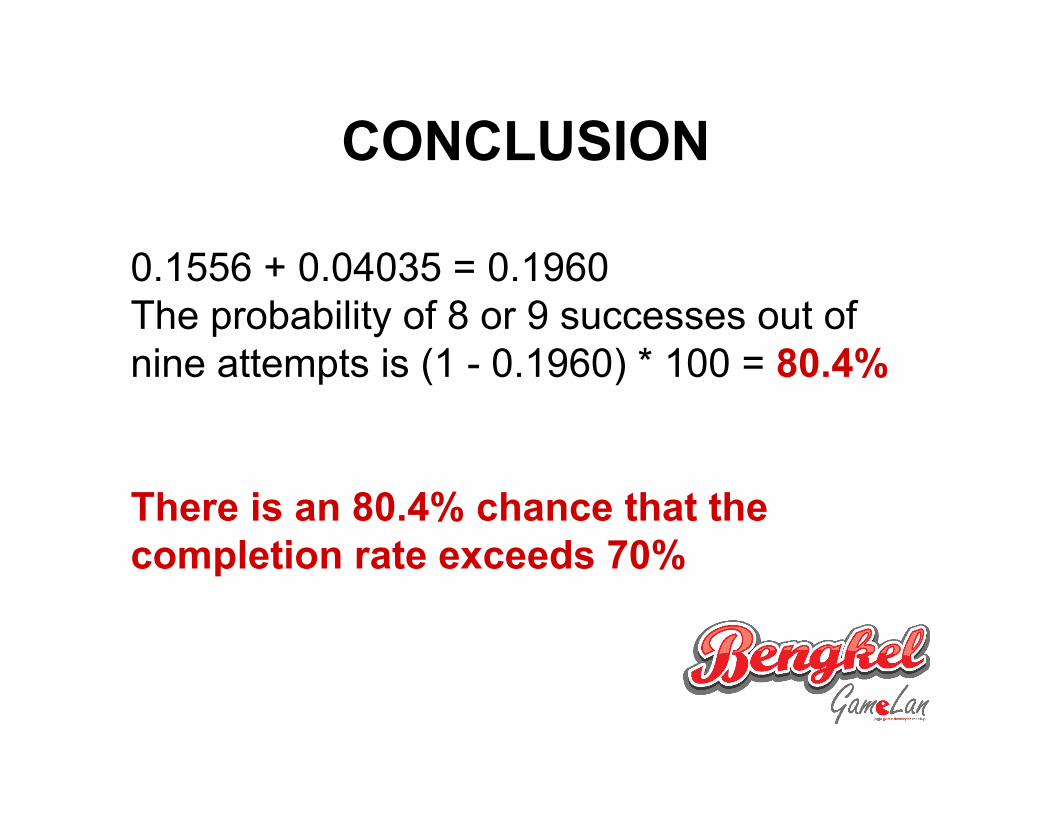
CONCLUSION
0.1556 + 0.04035 = 0.1960The probability of 8 or 9 successes out of nine attempts is (1 - 0.1960) * 100 = 80.4%
There is an 80.4% chance that the completion rate exceeds 70%

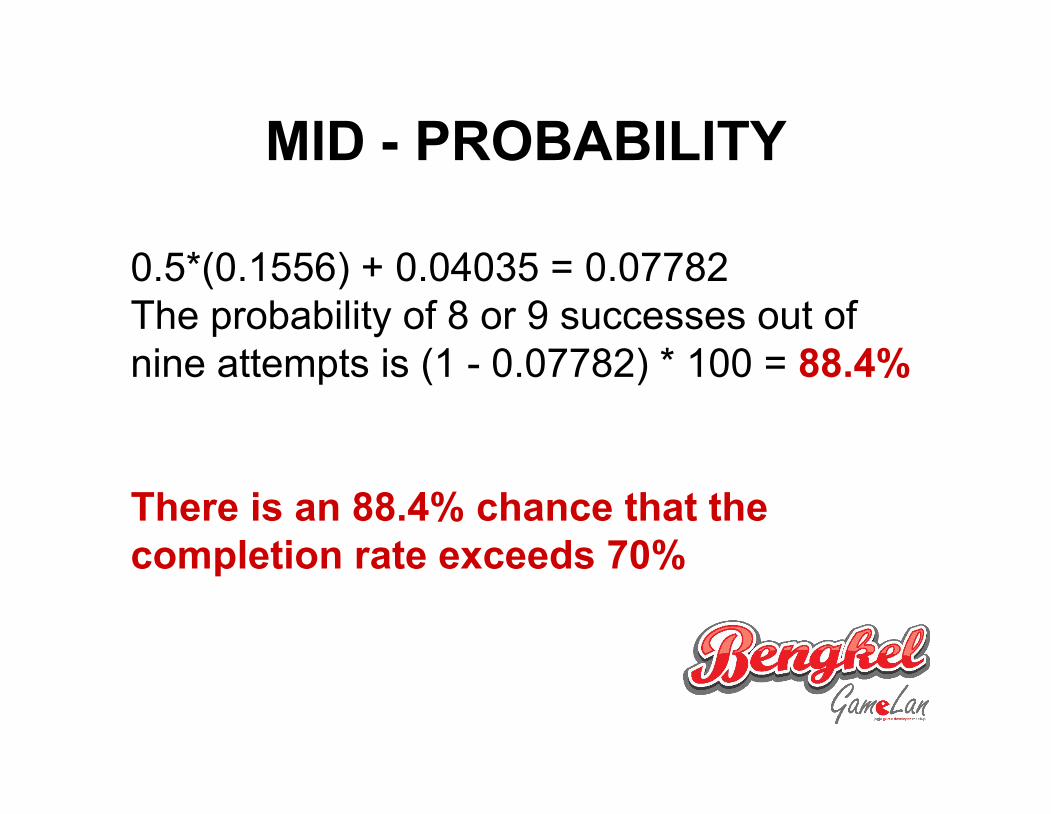
MID - PROBABILITY
0.5*(0.1556) + 0.04035 = 0.07782The probability of 8 or 9 successes out of nine attempts is (1 - 0.07782) * 100 = 88.4%
There is an 88.4% chance that the completion rate exceeds 70%
MID - PROBABILITY
0.5*(0.1556) + 0.04035 = 0.07782The probability of 8 or 9 successes out of nine attempts is (1 - 0.07782) * 100 = 88.4%
There is an 88.4% chance that the completion rate exceeds 70%
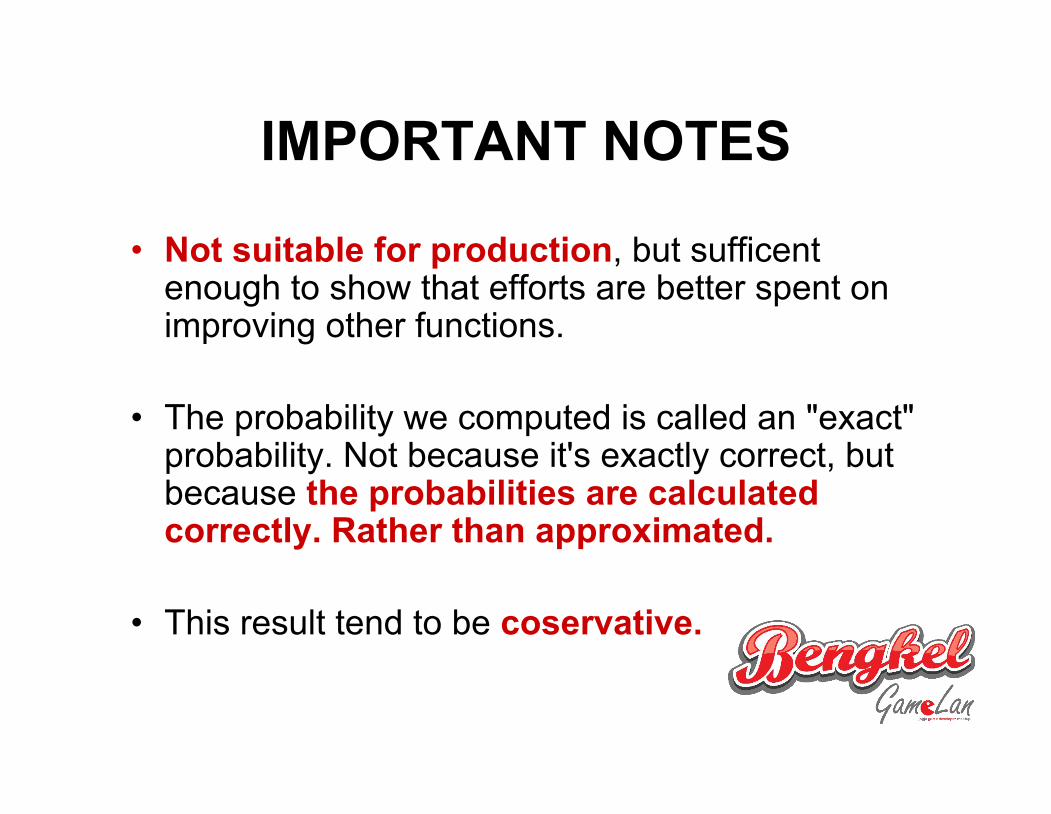
• Not suitable for production, but sufficent enough to show that efforts are better spent on improving other functions.
• The probability we computed is called an "exact" probability. Not because it's exactly correct, but because the probabilities are calculated correctly. Rather than approximated.
• This result tend to be coservative.
IMPORTANT NOTES
LARGE SAMPLE TEST
• success / fail
• "large" sample size = at least 15 failures and 15 successes.

HERE'S THE FORMULA
( brace yourselves again)
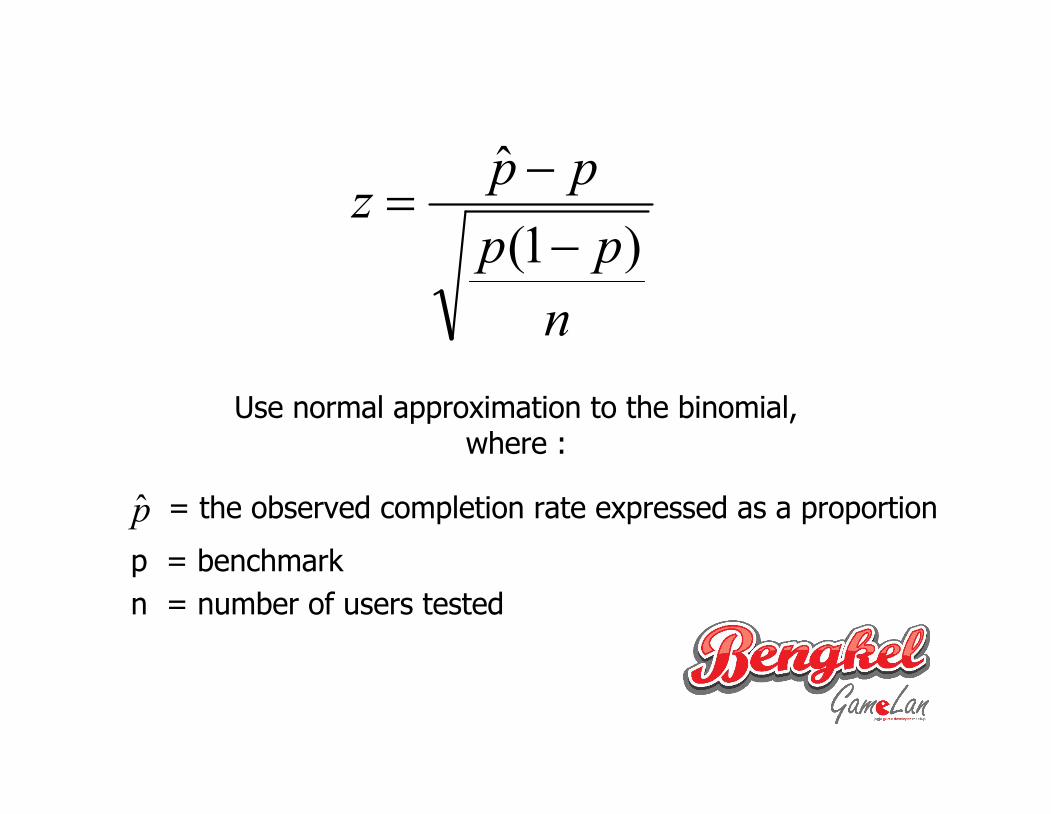
p̂
nppppz)1(
ˆ
Use normal approximation to the binomial,where :
= the observed completion rate expressed as a proportionp = benchmarkn = number of users tested

EXAMPLE 285 out of 100 users were able to successfully locate a specific product and add it to their shopping cart.
Is there enough evidence to conclude that at least 75% of all users can complete this task successfully ?
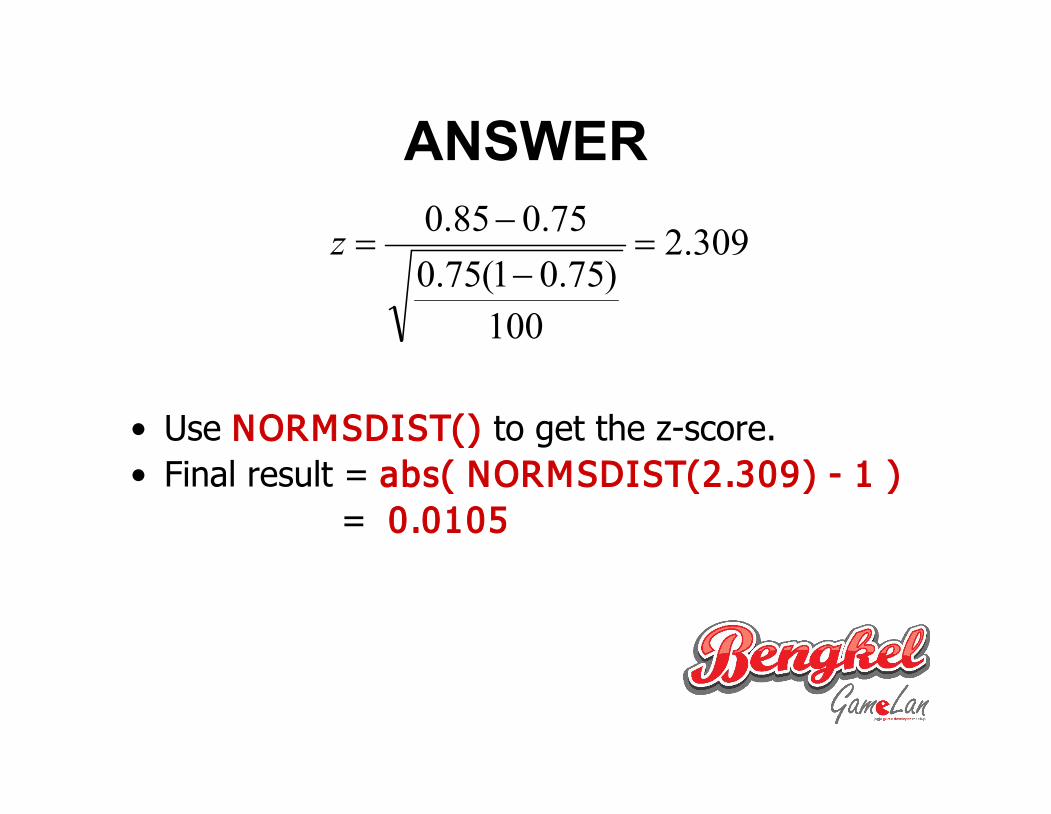
ANSWER309.2
100)75.01(75.0
75.085.0
z
• Use NORMSDIST() to get the z-score.• Final result = abs( NORMSDIST(2.309) - 1 )
= 0.0105
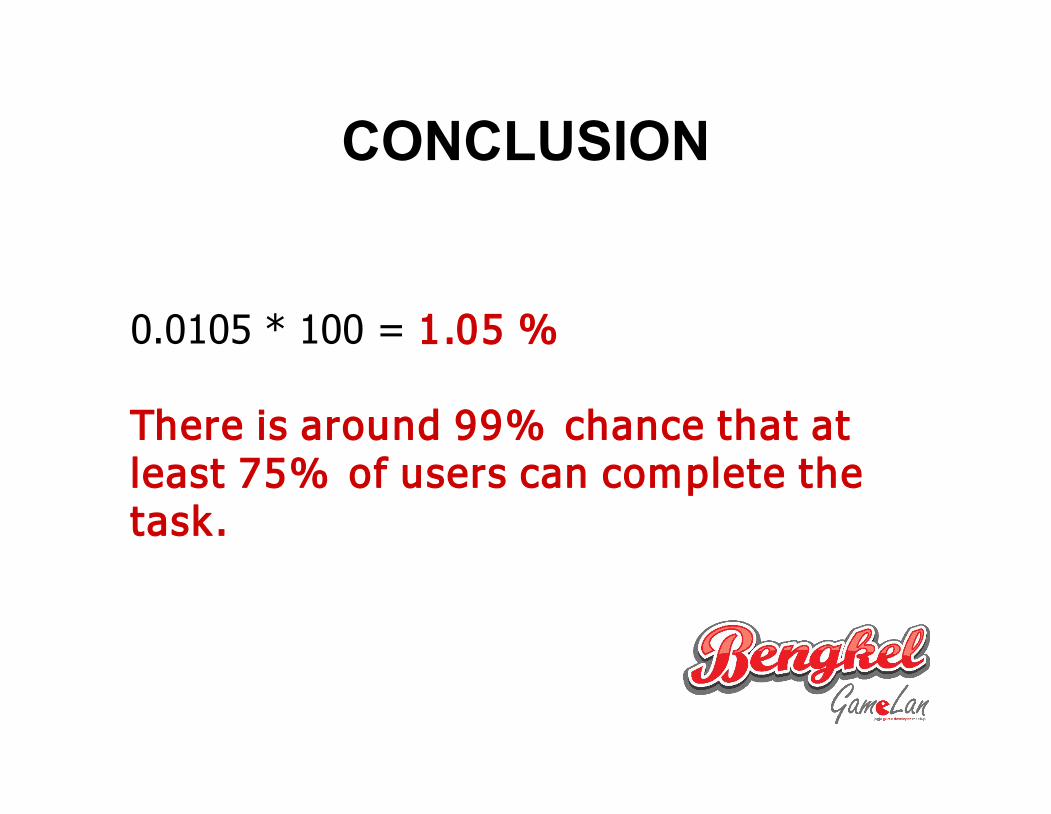
CONCLUSION
0.0105 * 100 = 1.05 %
There is around 99% chance that at least 75% of users can complete the task.
COMPARING A TASK TIME TO A BENCHMARK

HERE'S THE FORMULA
where :
nsxt
ln
lnˆ)ln(
lnx̂
lns= mean of the log values
= standar deviation of the log values
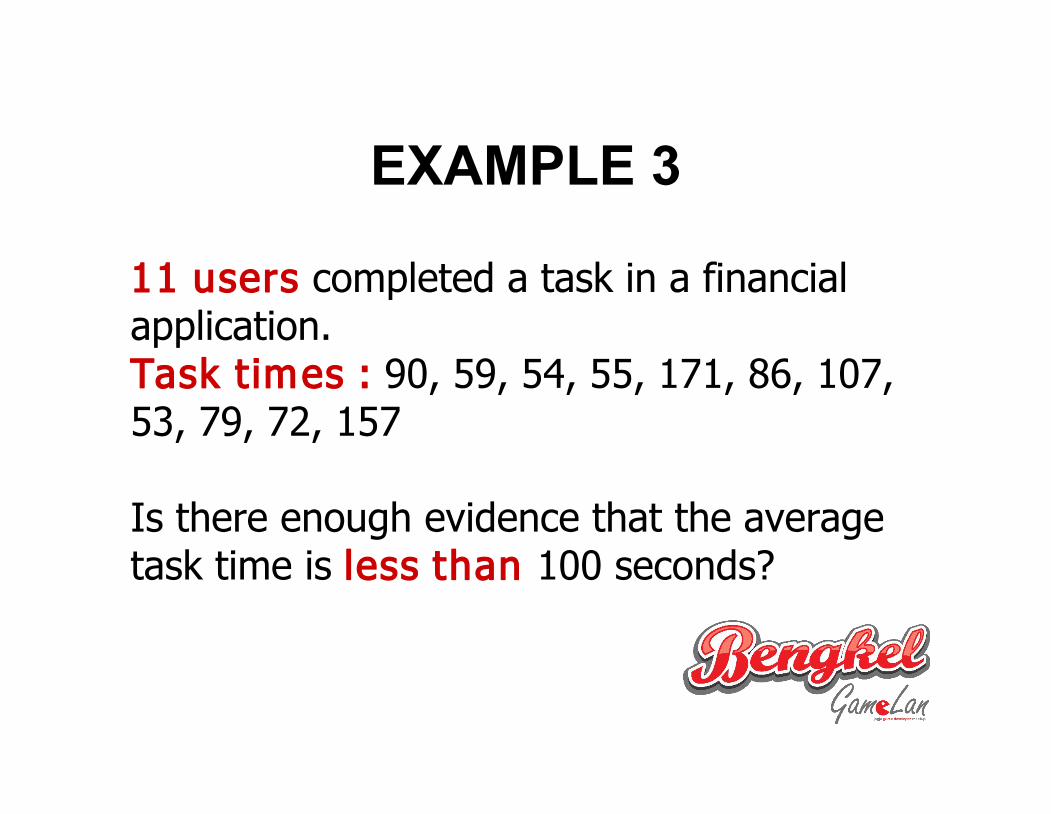
EXAMPLE 3
11 users completed a task in a financial application.Task times : 90, 59, 54, 55, 171, 86, 107, 53, 79, 72, 157
Is there enough evidence that the average task time is less than 100 seconds?
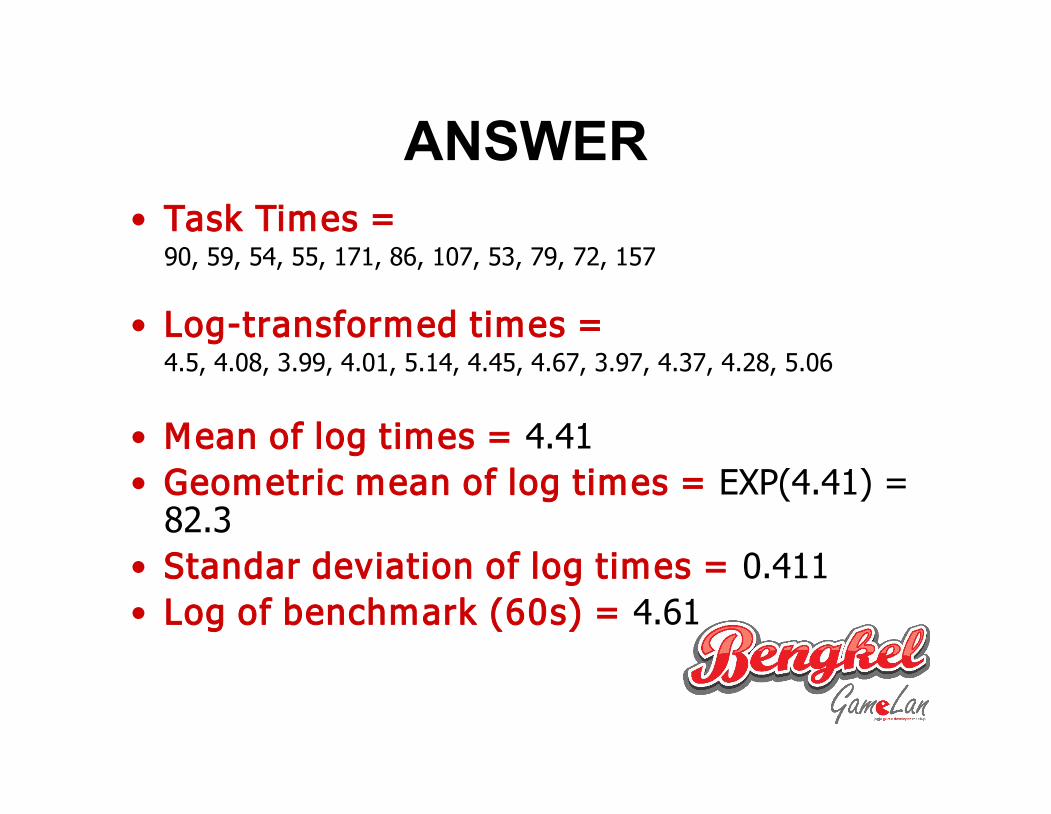
ANSWER• Task Times =
90, 59, 54, 55, 171, 86, 107, 53, 79, 72, 157
• Log-transformed times = 4.5, 4.08, 3.99, 4.01, 5.14, 4.45, 4.67, 3.97, 4.37, 4.28, 5.06
• Mean of log times = 4.41• Geometric mean of log times = EXP(4.41) =
82.3• Standar deviation of log times = 0.411• Log of benchmark (60s) = 4.61
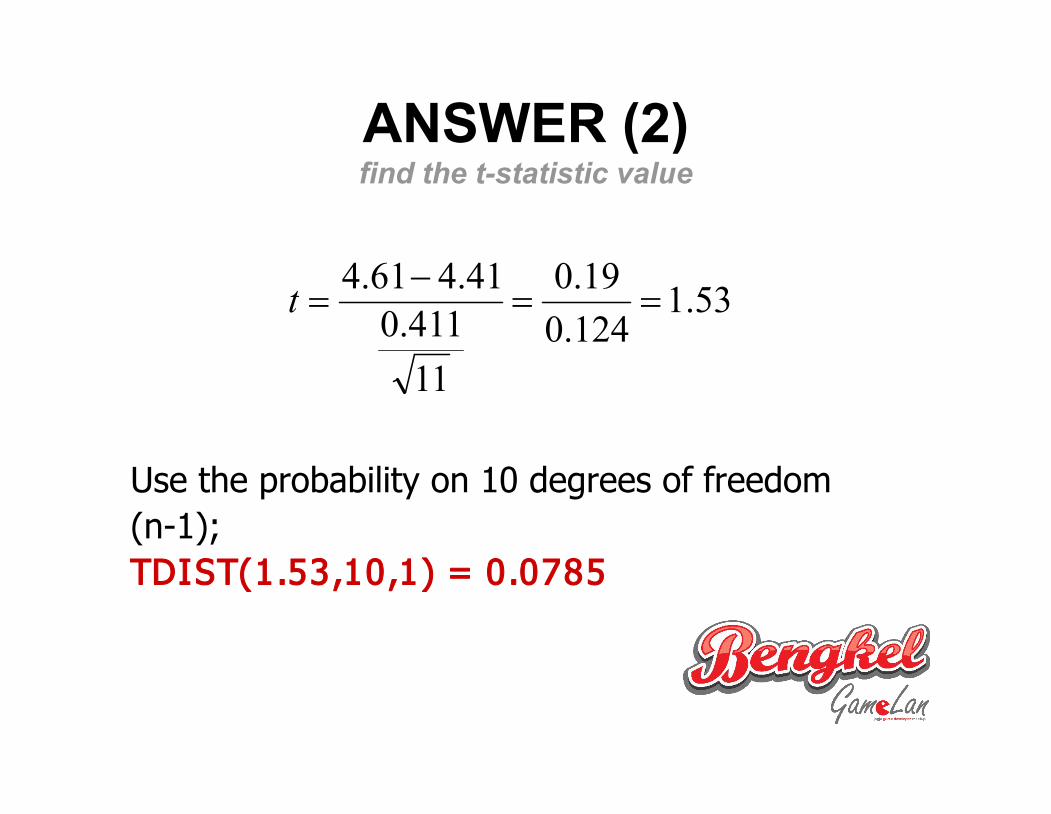
ANSWER (2)find the t-statistic value
Use the probability on 10 degrees of freedom (n-1);TDIST(1.53,10,1) = 0.0785
53.1124.019.0
11411.041.461.4
t
CONCLUSIONThe probability of seeing an average time of 82.3 seconds if the actual population time is greater than 100 seconds is around 7.87%
OR
We can be 92.15% confident that users can complete this task in less than 100 seconds.
• What is geometric mean?The best estimate of the middle task time for small-sample usability data (less than 25).
• How about large-sample usability data?Use sample median method.(won't be explained here)
IMPORTANT NOTES
TOOLS
http://pencil.evolus.vn/
https://marvelapp.com/ https://proto.io/
http://www.invisionapp.com/
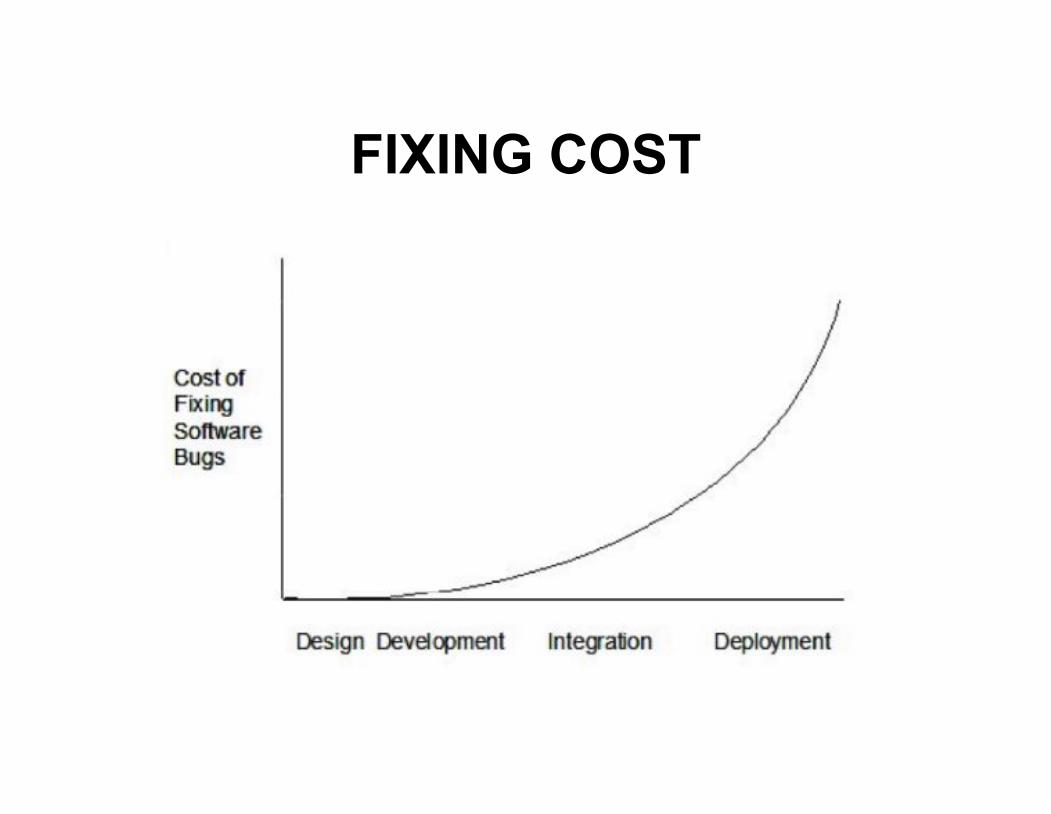
FIXING COST
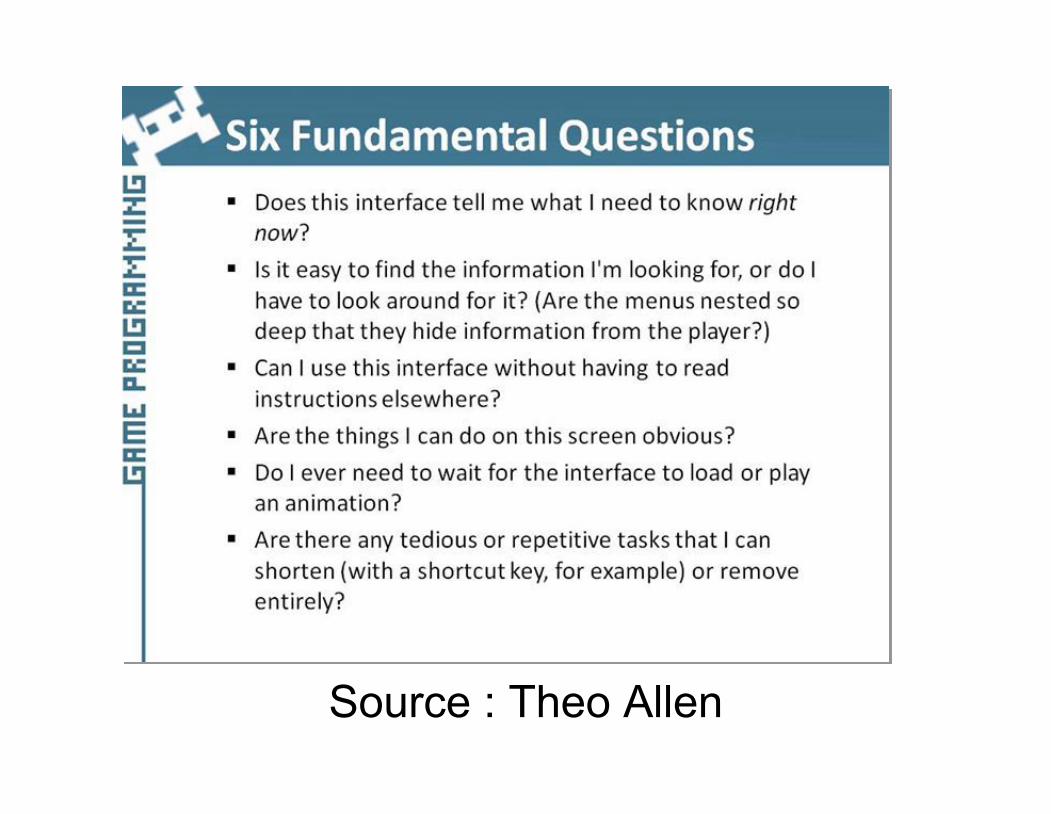
Source : Theo Allen
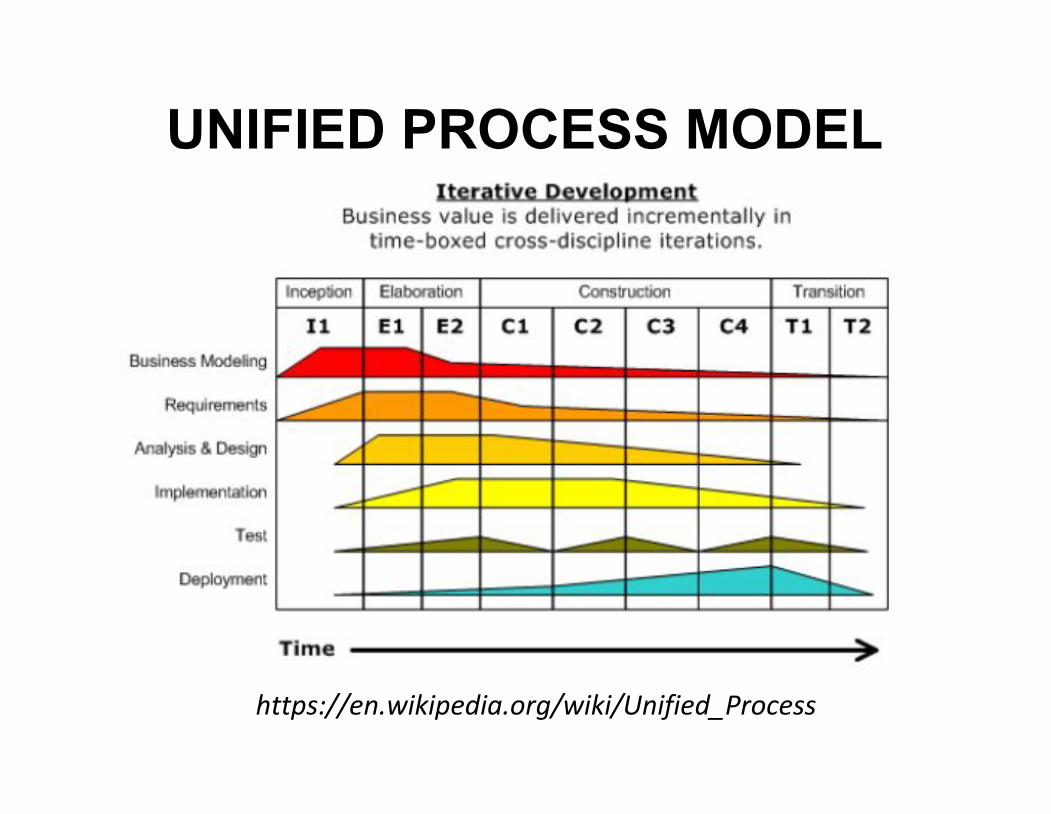
UNIFIED PROCESS MODEL
https://en.wikipedia.org/wiki/Unified_Process

THANK YOUPunto Damar P.facebook.com/puntodamar@ puntodamarBikinGame.com