U.S. Withdrawal from Afghanistan
18
August 24, 2021 APPROVAL OF BIDENDROPS INNEWHAMPSHIRE AMIDAFGHANISTANWOES BUT MAJORITY AGREE WITHDECISIONTOWITHDRAW DURHAM, NH - Six in ten NewHampshire residents disapprove of President Biden's handling of foreign affairs and for the first Ɵme, a majority disapprove of his overall job performance. Most Granite Staters say he is at least somewhat to blame for the takeover of Afghanistan by the Taliban while others also blame the Afghan government and former U.S. presidents. Despite this, a majority support Biden's decision overall to withdrawfromAfghanistan. These findings are based on the latest Granite State Poll* , conducted by the University of NewHampshire Survey Center. Nine hundred and seventy-seven (977) Granite State Panel members completed the survey online between August 19 and August 23, 2021. The margin of sampling error for the survey is +/- 2.7 percent. Data were weighted by respondent sex, age, educaƟon, and region of the state to targets fromthe most recent American Community Survey (ACS) conducted by the U.S. Census Bureau, as well as party registraƟon levels provided by the NH Secretary of State and 2020 elecƟon results in NH. Granite State Panel members are recruited from randomly-selected landline and cell phone numbers across NewHampshire and surveys are sent periodically to panel members. PresidenƟal Approval President Joe Biden's approval raƟng in NewHampshire has declined markedly since the takeover of Afghanistan by the Taliban: 44%of Granite Staters currently approve of Biden's performance as president, 54%disapprove, and 2%are unsure. Biden's net approval raƟng (the percentage who approve minus the percentage who disapprove) among Granite Staters is -10, down from+1 in July but higher than President Trump's net approval raƟng in August 2017 (-21). Biden's net approval raƟng is +91 among Democrats, -63 among Independents, and -93 among Republicans. Sean P. McKinley, M.A. Zachary S. Azem, M.A. AndrewE. Smith, Ph.D. [email protected] 603-862-2226 cola.unh.edu/unh-survey-center Approval of President Biden's Job Performance * We ask that this copyrighted informaƟon be referred to as the Granite State Poll, conducted by the University of NewHampshire Survey Center. By: JanuaryFebruary March April May June July August 0% 10% 20% 30% 40% 50% 60% 70% 80% 90% 100% 37% 47% 44% 47% 48% 51% 45% 51% 45% 7% 54% 49% 50% 52% 2% 53% 2% 2% 53% 1% 1% 1% 55% 1% May 2021 Jun 2021 Jul 2021 Aug 2021 33% 17% 41% 35% 14% 41% 31% 18% 41% 6% 19% 20% 12% 42% Strongly approve Somewhat approve Lean toward approving Neither/DK Lean toward disapproving Somewhat disapprove Strongly disapprove
Transcript of U.S. Withdrawal from Afghanistan

August 24, 2021
APPROVAL OF BIDEN DROPS IN NEW HAMPSHIRE AMID AFGHANISTAN WOES BUT MAJORITY AGREE WITH DECISION TO WITHDRAW
DURHAM, NH - Six in ten New Hampshire residents disapprove of President Biden's handling of foreign affairs and for the first me, amajority disapprove of his overall job performance. Most Granite Staters say he is at least somewhat to blame for the takeover ofAfghanistan by the Taliban while others also blame the Afghan government and former U.S. presidents. Despite this, a majority supportBiden's decision overall to withdraw from Afghanistan.
These findings are based on the latest Granite State Poll*, conducted by the University of New Hampshire Survey Center. Nine hundredand seventy-seven (977) Granite State Panel members completed the survey online between August 19 and August 23, 2021. The marginof sampling error for the survey is +/- 2.7 percent. Data were weighted by respondent sex, age, educaon, and region of the state totargets from the most recent American Community Survey (ACS) conducted by the U.S. Census Bureau, as well as party registraon levelsprovided by the NH Secretary of State and 2020 elecon results in NH. Granite State Panel members are recruited fromrandomly-selected landline and cell phone numbers across New Hampshire and surveys are sent periodically to panel members.
Presidenal Approval
President Joe Biden's approval rang in New Hampshire has declined markedly since the takeover of Afghanistan by the Taliban: 44% ofGranite Staters currently approve of Biden's performance as president, 54% disapprove, and 2% are unsure. Biden's net approval rang(the percentage who approve minus the percentage who disapprove) among Granite Staters is -10, down from +1 in July but higher thanPresident Trump's net approval rang in August 2017 (-21). Biden's net approval rang is +91 among Democrats, -63 amongIndependents, and -93 among Republicans.
Sean P. McKinley, M.A.Zachary S. Azem, M.A.Andrew E. Smith, Ph.D.
cola.unh.edu/unh-survey-center
Approval of President Biden's Job Performance
* We ask that this copyrighted informaon be referred to as the Granite State Poll, conducted by the University of New Hampshire Survey Center.
By:
JanuaryFebruaryMarch April May June July August
0%
10%
20%
30%
40%
50%
60%
70%
80%
90%
100%
37%
47%44%
47% 48%
51%
45%
51%
45%
7%
54%
49%
50%52%
2%
53%
2% 2%
53%
1% 1%1%
55%
1%
May2021
Jun2021
Jul2021
Aug2021
33%
17%
41%
35%
14%
41%
31%
18%
41%
6%
19%
20%
12%
42%
Strongly approve
Somewhat approve
Lean toward approving
Neither/DK
Lean toward disapproving
Somewhat disapprove
Strongly disapprove
U.S. Withdrawal from Afghanistan
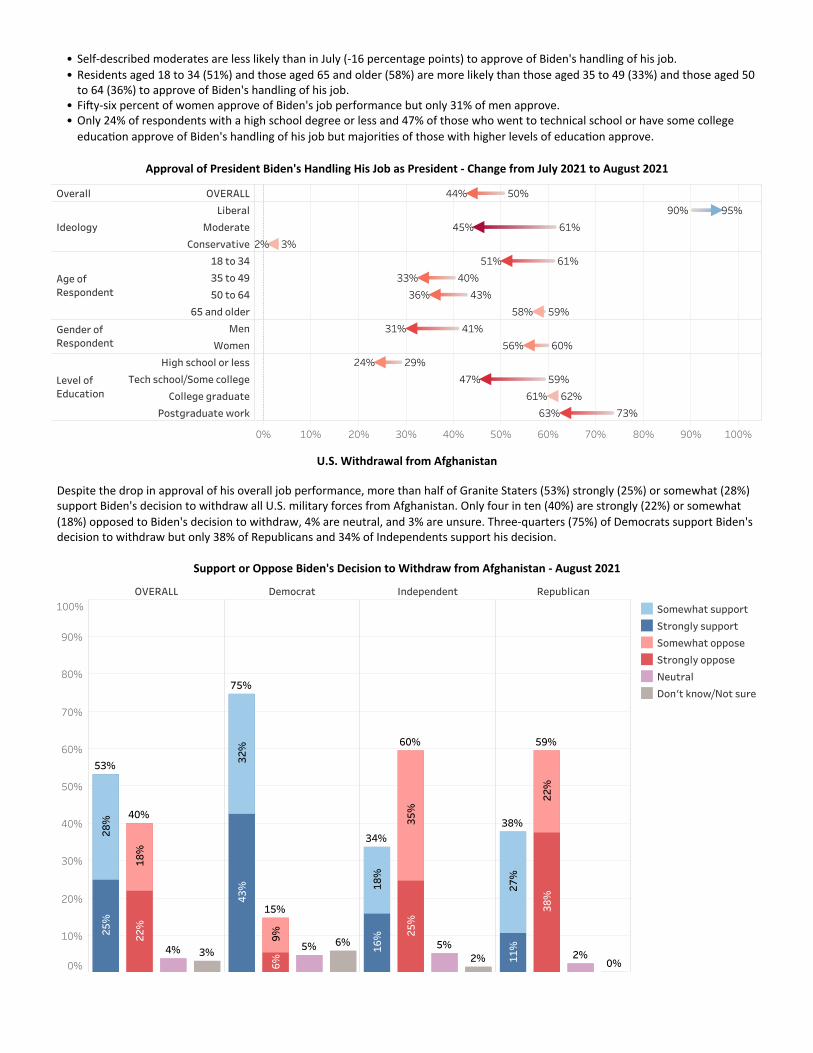
Despite the drop in approval of his overall job performance, more than half of Granite Staters (53%) strongly (25%) or somewhat (28%)support Biden's decision to withdraw all U.S. military forces from Afghanistan. Only four in ten (40%) are strongly (22%) or somewhat(18%) opposed to Biden's decision to withdraw, 4% are neutral, and 3% are unsure. Three-quarters (75%) of Democrats support Biden'sdecision to withdraw but only 38% of Republicans and 34% of Independents support his decision.
0% 10% 20% 30% 40% 50% 60% 70% 80% 90% 100%
Overall OVERALL
Ideology
Liberal
Moderate
Conservative
Age ofRespondent
18 to 34
35 to 49
50 to 64
65 and older
Gender ofRespondent
Men
Women
Level ofEducation
High school or less
Tech school/Some college
College graduate
Postgraduate work
44% 50%
95%90%
45% 61%
2% 3%
51% 61%
33% 40%
36% 43%
58% 59%
31% 41%
56% 60%
24% 29%
47% 59%
61% 62%
63% 73%
Approval of President Biden's Handling His Job as President - Change from July 2021 to August 2021
Self-described moderates are less likely than in July (-16 percentage points) to approve of Biden's handling of his job.Residents aged 18 to 34 (51%) and those aged 65 and older (58%) are more likely than those aged 35 to 49 (33%) and those aged 50to 64 (36%) to approve of Biden's handling of his job.Fiy-six percent of women approve of Biden's job performance but only 31% of men approve.Only 24% of respondents with a high school degree or less and 47% of those who went to technical school or have some collegeeducaon approve of Biden's handling of his job but majories of those with higher levels of educaon approve.
•••••
OVERALL Democrat Independent Republican
0%
10%
20%
30%
40%
50%
60%
70%
80%
90%
100%
53%
40%
4% 3%
28%
25%
18%
22%
75%
15%
5% 6%
32%
43%
9%6%
34%
60%
5%2%
18%
16%
35%
25%
38%
59%
2%0%
27%
11%
22%
38%
Somewhat support
Strongly support
Somewhat oppose
Strongly oppose
Neutral
Don't know/Not sure
Support or Oppose Biden's Decision to Withdraw from Afghanistan - August 2021

Overall, only 36% of Granite Staters say that they approve of Biden's handling of foreign affairs, 60% disapprove, and 5% are unsure. Netapproval of Biden's handling of foreign affairs (-24) has fallen dramacally since July (+2). Three-quarters (75%) of Democrats approve ofBiden’s handling of foreign affairs but only 16% of Independents approve, down from 51% in July, and only 2% of Republicans approve,an all-me low.
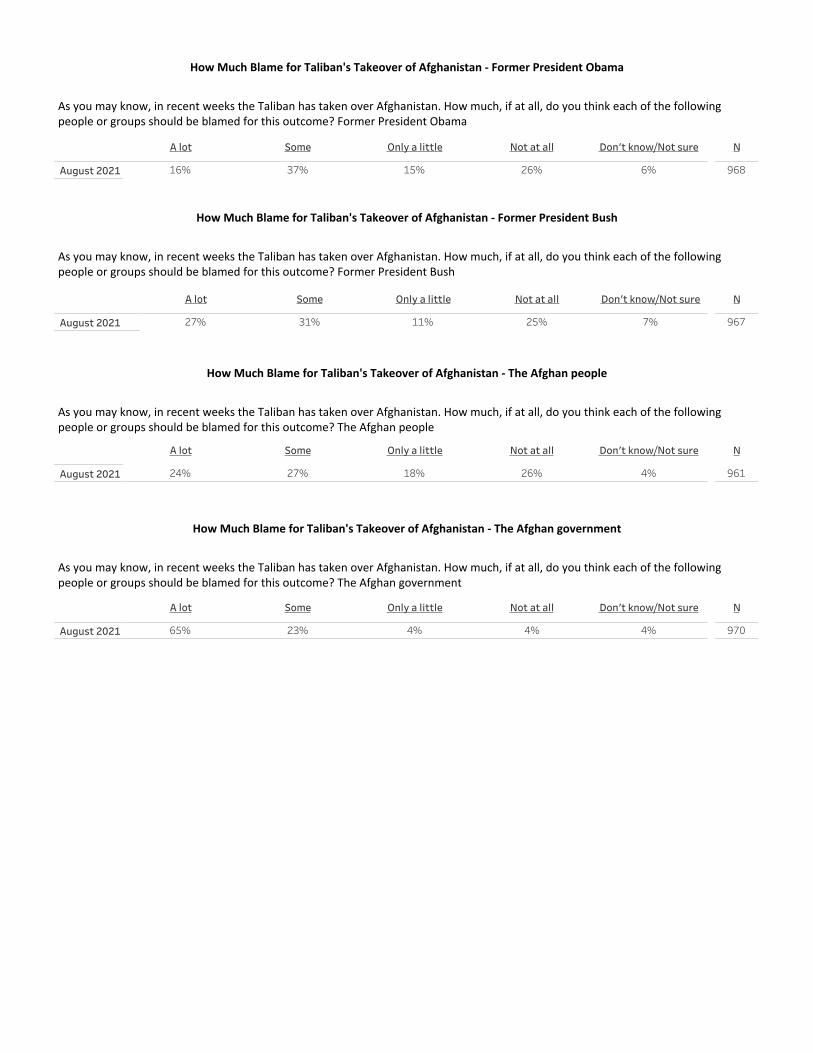
When asked whom they blame for the Taliban's takeover of Afghanistan, 88% of New Hampshire residents say that the Afghangovernment bears a lot or some of the blame for this occurrence, while 71% say that President Biden bears a lot or some of the blame.Among former Presidents during the Afghan War, just over half say that former President George W. Bush (58%), former PresidentDonald Trump (53%), and former President Barack Obama (53%) bear a lot or some blame for the Taliban's takeover of the country, while51% say that the Afghan people bear a lot (24%) or some (27%) blame. Others blame the Afghan military, Pakistan, former Vice PresidentDick Cheney, or former Secretary of State Mike Pompeo.
Democrats, Independents, and Republicans are about equally likely to blame the Afghan government and people, but responses differ byparty when asked how much they blame President Biden and past presidents. The vast majority of Republicans (93%) and Independents(85%) blame President Biden a lot or some for the Taliban's takeover of Afghanistan, but only 45% of Democrats feel like this way. On theother hand, most Democrats and Independents blame former Presidents Trump and Bush a lot or some for this outcome, but only aboutone-third of Republicans blame them.
Approval of President Biden's Handling of Foreign Affairs
Feb 2021 Apr 2021 Jun 2021 Aug 2021
0%
20%
40%
60%
80%
100%
60%
47%
36%
47% 46%46%
17%
48%
36%
8%
45%47% 47%
8%6%
47%
43%
48%
5%
5%5%
5%
49% 49%
May2021
Jun2021
Jul2021
Aug2021
22%
18%
42%
7%
5%
31%
10%
41%
6%
5%
5%
26%
19%
41%
6%
14%
17%
52%
5%
6%
Strongly approve
Somewhat approve
Lean toward approving
Neither/DK
Lean toward disapproving
Somewhat disapprove
Strongly disapprove
0% 10% 20% 30% 40% 50% 60% 70% 80% 90% 100%
The Afghan government
President Biden
Former President Bush
Former President Trump
Former President Obama
The Afghan people
23%65% 4%4%4%
11%13%24%46% 6%
25%11%31%27% 7%
32%30%23% 6%9%
26%15%37%16% 6%
26%18%27%24% 4%
A lot Some Only a little Not at all Don't know/Not sure
How Much Blame for Taliban's Takeover of Afghanistan - August 2021

U.S. Heading in Right Direcon or On Wrong Track
Only 32% of New Hampshire residents believe that things in the United States are headed in the right direcon, 59% believe things areseriously off on the wrong track, and 9% are unsure. The percentage of Granite Staters who say the country is on the wrong track (59%)has increased slightly since July (54%).
2003 2004 2005 2006 2007 2008 2009 2010 2011 2012 2013 2014 2015 2016 2017 2018 2019 2020 2021 2022
0%
20%
40%
60%
80%
100%
5%9%
38%
59%56%
32%
George W. Bush Barack Obama Donald Trump Joe BidenGeorge W. Bush Barack Obama Donald Trump Joe Biden
Right Direcon or Wrong Track
Right direction Wrong track Don't know/Not sure
More than half (58%) of Democrats say the country is headed in the right direcon, down from 80% in March. Forty-three percent ofIndependents and only 2% of Republicans feel the country is headed in the right direcon.
2003 2004 2005 2006 2007 2008 2009 2010 2011 2012 2013 2014 2015 2016 2017 2018 2019 2020 2021 2022
0%
20%
40%
60%
80%
100%
2%
80%
44% 43%
34%
58%
56%
32%
George W. Bush Barack Obama Donald Trump Joe BidenGeorge W. Bush Barack Obama Donald Trump Joe Biden
Right Direcon - by Party ID
OVERALL Democrat Independent Republican

Granite State Poll Methodology
These findings are based on the latest Granite State Poll, conducted by the University of New Hampshire Survey Center. Nine hundredand seventy-seven (977) Granite State Panel members completed the survey online between August 19 and August 23, 2021. Themargin of sampling error for the survey is +/- 2.7 percent. These MSE's have not been adjusted for design effect. The response rate forthe August 2021 Granite State Poll is 31%. The design effect for the survey is 2.7%.
Data were weighted by respondent sex, age, educaon, and region of the state to targets from the most recent American CommunitySurvey (ACS) conducted by the U.S. Census Bureau, as well as party registraon levels provided by the NH Secretary of State and to2020 elecon results in New Hampshire.
The Granite State Panel is part of an effort by the University of New Hampshire Survey Center to invesgate new ways of gathering andunderstanding the opinion of New Hampshire residents. Approximately 6,750 New Hampshire adults were recruited from randomlyselected landline and cell phone numbers to parcipate in the panel. Panelists are then asked to parcipate in online surveys sponsoredby the UNH Survey Center.
The number of respondents in each demographic below may not equal the number reported in cross-tabulaon tables as somerespondents choose not to answer some quesons. Due to rounding, percentages may not sum to 100%.
For more informaon about the methodology used in the Granite State Panel, contact Dr. Andrew Smith at (603) 862-2226 or by emailat [email protected].
% N
Gender ofRespondent
Men
Women
Age ofRespondent
18 to 34
35 to 49
50 to 64
65 and older
Level ofEducation
High school or less
Tech school/Some college
College graduate
Postgraduate work
Region ofState
Connecticut Valley
Manchester Area
Mass Border
North Country
Seacoast
Central/Lakes
Party ID Democrat
Independent
Republican
Ideology Liberal
Moderate
Conservative
VotingRegistration
Registered Democrat
Registered Undeclared/Not Reg.
Registered Republican
2020PresidentialVote
Voted for Trump
Voted for Biden
Voted for other 2020 candidate
Did not vote in 2020
485
468
51%
49%
197
303
205
257
21%
32%
21%
27%
122
200
299
348
13%
21%
31%
36%
163
156
94
236
185
134
17%
16%
10%
24%
19%
14%
406
136
403
43%
14%
43%
256
470
194
28%
51%
21%
276
395
264
29%
42%
28%
19
15
493
425
2%
2%
52%
45%
August 2021 Granite State Poll Demographics

Approve Disapprove Neither/DK
January 2021
February 2021
March 2021
April 2021
May 2021
June 2021
July 2021
August 2021 2%54%44%
1%49%50%
1%48%51%
1%47%52%
1%47%51%
2%45%53%
2%45%53%
7%37%55%
N
974
1,793
1,592
1,816
1,939
1,741
1,839
2,008
Strongly support Somewhat support Neutral Somewhat oppose Strongly opposeDon't know/Not
sure
August 2021 3%22%18%4%28%25%
N
975
Approval of President Biden's Job Performance
Generally speaking, do you approve or disapprove of the way Joe Biden is handling his job as president?
Support or Oppose Biden's Decision to Withdraw from Afghanistan
Do you support or oppose Biden's decision to withdraw all U.S. military forces from Afghanistan?
How Much Blame for Taliban's Takeover of Afghanistan - President Biden
As you may know, in recent weeks the Taliban has taken over Afghanistan. How much, if at all, do you think each of the followingpeople or groups should be blamed for this outcome? President Biden
A lot Some Only a little Not at all Don't know/Not sure
August 2021 6%11%13%24%46%
N
971
How Much Blame for Taliban's Takeover of Afghanistan - Former President Trump
As you may know, in recent weeks the Taliban has taken over Afghanistan. How much, if at all, do you think each of the followingpeople or groups should be blamed for this outcome? Former President Trump
A lot Some Only a little Not at all Don't know/Not sure
August 2021 6%32%9%30%23%
N
969
Approval of President Biden's Handling of Foreign Affairs
Generally speaking, do you approve or disapprove of the way President Biden is handling foreign affairs?Approve Disapprove Neither/DK
January 2021
February 2021
March 2021
April 2021
May 2021
June 2021
July 2021
August 2021 5%60%36%
6%46%48%
5%47%47%
5%48%47%
5%46%49%
8%47%45%
8%43%49%
17%36%47%
N
975
1,790
1,597
1,815
1,940
1,740
1,838
2,011
A lot Some Only a little Not at all Don't know/Not sure
August 2021 7%25%11%31%27%
N
967
A lot Some Only a little Not at all Don't know/Not sure
August 2021 6%26%15%37%16%
N
968
A lot Some Only a little Not at all Don't know/Not sure
August 2021 4%26%18%27%24%
N
961
How Much Blame for Taliban's Takeover of Afghanistan - Former President Obama
As you may know, in recent weeks the Taliban has taken over Afghanistan. How much, if at all, do you think each of the followingpeople or groups should be blamed for this outcome? Former President Obama
How Much Blame for Taliban's Takeover of Afghanistan - Former President Bush
As you may know, in recent weeks the Taliban has taken over Afghanistan. How much, if at all, do you think each of the followingpeople or groups should be blamed for this outcome? Former President Bush
How Much Blame for Taliban's Takeover of Afghanistan - The Afghan people
As you may know, in recent weeks the Taliban has taken over Afghanistan. How much, if at all, do you think each of the followingpeople or groups should be blamed for this outcome? The Afghan people
How Much Blame for Taliban's Takeover of Afghanistan - The Afghan government
As you may know, in recent weeks the Taliban has taken over Afghanistan. How much, if at all, do you think each of the followingpeople or groups should be blamed for this outcome? The Afghan government
A lot Some Only a little Not at all Don't know/Not sure
August 2021 4%4%4%23%65%
N
970

Rightdirection Wrong track
Don'tknow/Notsure
June 2003
October 2003
February 2004
April 2004
July 2004
October 2004
February 2005
May 2005
July 2005
October 2005
February 2006
April 2006
July 2006
September 2006
February 2007
April 2007
July 2007
September 2007
January 2008
April 2008
July 2008
September 2008
February 2009
April 2009
July 2009
October 2009
February 2010
April 2010
July 2010
September 2010
February 2011
April 2011
June 2011
October 2011
February 2012
April 2012
July 2012
September 2012
October 2012 3%
3%
5%
6%
8%
8%
6%
5%
9%
7%
6%
4%
5%
9%
5%
7%
11%
10%
8%
5%
7%
8%
6%
8%
7%
10%
11%
8%
7%
7%
6%
11%
7%
4%
10%
8%
8%
6%
5%
49%
48%
57%
52%
54%
70%
59%
63%
54%
55%
55%
51%
54%
45%
43%
43%
51%
69%
73%
74%
71%
62%
59%
55%
53%
56%
51%
62%
53%
55%
47%
43%
40%
50%
43%
48%
49%
43%
38%
48%
49%
38%
42%
38%
22%
35%
32%
37%
38%
39%
44%
41%
46%
51%
51%
38%
21%
19%
21%
23%
30%
34%
37%
40%
34%
38%
30%
40%
38%
47%
46%
53%
46%
48%
44%
43%
51%
56%
N
578
630
512
525
514
553
507
496
513
512
491
502
484
496
555
498
610
540
508
487
553
505
516
510
516
510
496
501
487
498
492
487
535
574
500
535
503
487
511
Rightdirection Wrong track
Don'tknow/Notsure
February 2013
April 2013
July 2013
August 2013
October 2013
January 2014
April 2014
July 2014
October 2014
February 2015
May 2015
July 2015
October 2015
February 2016
April 2016
July 2016
October 2016
February 2017
May 2017
August 2017
October 2017
February 2018
April 2018
August 2018
October 2018
February 2019
April 2019
August 2019
October 2019
February 2020
July 2020
November 2020
December 2020
January 2021
February 2021
March 2021
July 2021
August 2021 9%
9%
11%
11%
11%
8%
9%
5%
6%
4%
6%
5%
4%
7%
6%
5%
7%
6%
9%
6%
8%
5%
4%
6%
7%
9%
7%
5%
4%
6%
6%
6%
8%
6%
6%
5%
6%
4%
59%
54%
48%
49%
50%
65%
65%
71%
53%
58%
57%
56%
57%
54%
56%
50%
57%
61%
50%
50%
52%
55%
65%
56%
61%
55%
51%
64%
57%
58%
59%
62%
58%
67%
58%
56%
50%
49%
32%
38%
41%
40%
39%
27%
26%
24%
41%
38%
37%
38%
39%
39%
38%
45%
36%
33%
41%
44%
41%
40%
30%
38%
32%
35%
42%
31%
40%
36%
35%
32%
34%
27%
36%
39%
44%
47%
N
977
1,794
1,744
1,857
2,020
773
1,912
2,007
602
1,248
496
537
588
632
492
207
515
562
498
506
499
897
522
604
672
580
528
562
498
677
654
501
569
645
498
511
498
573
U.S. Heading in Right Direcon or On Wrong Track
Do you think things in this country are generally going in the right direcon or are they seriously off on the wrong track?

Approve Disapprove Neither/DK
STATEWIDE August 2021 2%54%44%
N
974
VotingRegistration
Registered Democrat
Registered Undeclared/Not Reg.
Registered Republican
Party ID Democrat
Independent
Republican
Ideology Liberal
Moderate
Conservative
Media Usage Boston Globe reader
NHPR listener
Union Leader reader
WMUR viewer
Fox News viewer
Conservative radio listener
Local newspapers reader
Age ofRespondent
18 to 34
35 to 49
50 to 64
65 and older
Gender ofRespondent
Men
Women
Level ofEducation
High school or less
Tech school/Some college
College graduate
Postgraduate work
Region ofState
Connecticut Valley
Manchester Area
Mass Border
North Country
Seacoast
Central/Lakes
2020PresidentialVote
Voted for Trump
Voted for Biden
Voted for other 2020 candidate
Did not vote in 2020
3%
1%
3%
94%
60%
7%
3%
39%
90%
2%
1%
1%
96%
81%
4%
2%
18%
95%
4%
2%
0%
95%
53%
4%
2%
45%
95%
0%
0%
1%
0%
0%
1%
37%
85%
86%
50%
45%
32%
11%
63%
15%
13%
49%
55%
67%
89%
0%
1%
1%
6%
42%
63%
65%
43%
58%
36%
33%
51%
0%
4%
44%
65%
56%
31%
1%
2%
5%
35%
37%
48%
76%
63%
61%
47%
24%
0%
11%
1%
0%
0%
0%
50%
45%
69%
59%
36%
75%
50%
44%
30%
40%
64%
25%
32%
1%
3%
64%
88%
15%
97%
4%
12%
84%
0%
275
395
262
405
136
401
256
468
194
189
264
351
694
163
453
68
196
302
205
257
483
467
122
200
297
348
163
156
93
236
184
133
19
15
491
425
Approval of President Biden's Job Performance

Stronglysupport
Somewhatsupport Neutral
Somewhatoppose
Stronglyoppose
Don'tknow/Notsure
STATEWIDE August 2021 3%22%18%4%28%25%
N
975
VotingRegistration
Registered Democrat
Registered Undeclared/Not Reg.
Registered Republican
Party ID Democrat
Independent
Republican
Ideology Liberal
Moderate
Conservative
Media Usage Boston Globe reader
NHPR listener
Union Leader reader
WMUR viewer
Fox News viewer
Conservative radio listener
Local newspapers reader
Age ofRespondent
18 to 34
35 to 49
50 to 64
65 and older
Gender ofRespondent
Men
Women
Level ofEducation
High school or less
Tech school/Some college
College graduate
Postgraduate work
Region ofState
Connecticut Valley
Manchester Area
Mass Border
North Country
Seacoast
Central/Lakes
2020PresidentialVote
Voted for Trump
Voted for Biden
Voted for other 2020 candidate
Did not vote in 2020
1%
8%
46%
16%
3%
23%
21%
11%
2%
5%
4%
18%
31%
34%
11%
26%
40%
0%
2%
6%
38%
25%
6%
22%
35%
9%
2%
5%
5%
27%
18%
32%
11%
16%
43%
0%
12%
50%
16%
1%
24%
20%
9%
2%
3%
8%
14%
32%
35%
11%
29%
36%
2%
0%
3%
13%
2%
2%
18%
43%
41%
25%
18%
15%
26%
18%
19%
18%
13%
9%
16%
9%
6%
1%
4%
3%
4%
3%
1%
37%
25%
28%
29%
38%
30%
27%
20%
12%
9%
27%
18%
34%
35%
1%
2%
2%
8%
24%
29%
21%
12%
5%
16%
21%
28%
2%
3%
5%
4%
26%
25%
30%
33%
42%
25%
22%
15%
6%
1%
19%
25%
16%
21%
3%
3%
32%
25%
24%
25%
3%
1%
8%
14%
15%
19%
31%
11%
13%
17%
24%
6%
10%
2%
1%
36%
29%
26%
27%
31%
31%
28%
16%
0%
3%
0%
0%
11%
2%
28%
21%
32%
13%
10%
40%
29%
12%
5%
30%
9%
15%
5%
2%
2%
6%
4%
2%
15%
30%
41%
26%
32%
32%
23%
32%
20%
26%
34%
10%
6%
0%
3%
34%
4%
42%
13%
10%
16%
21%
0%
5%
3%
76%
14%
31%
24%
7%
41%
37%
10%
275
393
264
406
134
403
256
468
194
190
262
350
694
163
453
69
195
303
205
257
483
468
122
200
297
348
163
156
94
234
185
134
19
15
493
423
Support or Oppose Biden's Decision to Withdraw from Afghanistan

Approve Disapprove Neither/DK
STATEWIDE August 2021 5%60%36%
N
975
VotingRegistration
Registered Democrat
Registered Undeclared/Not Reg.
Registered Republican
Party ID Democrat
Independent
Republican
Ideology Liberal
Moderate
Conservative
Media Usage Boston Globe reader
NHPR listener
Union Leader reader
WMUR viewer
Fox News viewer
Conservative radio listener
Local newspapers reader
Age ofRespondent
18 to 34
35 to 49
50 to 64
65 and older
Gender ofRespondent
Men
Women
Level ofEducation
High school or less
Tech school/Some college
College graduate
Postgraduate work
Region ofState
Connecticut Valley
Manchester Area
Mass Border
North Country
Seacoast
Central/Lakes
2020PresidentialVote
Voted for Trump
Voted for Biden
Voted for other 2020 candidate
Did not vote in 2020
3%
2%
10%
93%
64%
15%
4%
34%
75%
3%
2%
7%
95%
81%
17%
2%
16%
75%
4%
1%
14%
95%
60%
14%
1%
39%
73%
1%
0%
1%
4%
13%
2%
0%
50%
91%
89%
55%
46%
42%
45%
49%
9%
11%
41%
41%
57%
54%
1%
2%
3%
13%
46%
66%
70%
54%
53%
32%
28%
33%
7%
3%
50%
69%
43%
29%
3%
5%
11%
38%
48%
52%
81%
59%
47%
37%
19%
3%
9%
0%
1%
12%
2%
71%
47%
67%
63%
39%
75%
26%
44%
33%
36%
49%
23%
2%
7%
3%
60%
71%
27%
97%
40%
27%
66%
1%
275
394
263
405
136
402
256
468
194
188
264
351
696
164
453
68
196
302
205
257
483
468
122
200
298
348
162
156
94
236
184
134
19
15
492
425
Approval of President Biden's Handling of Foreign Affairs

A lot Some Only a little Not at allDon't know/Not
sure
STATEWIDE August 2021 6%11%13%24%46%
N
971
VotingRegistration
Registered Democrat
Registered Undeclared/Not Reg.
Registered Republican
Party ID Democrat
Independent
Republican
Ideology Liberal
Moderate
Conservative
Media Usage Boston Globe reader
NHPR listener
Union Leader reader
WMUR viewer
Fox News viewer
Conservative radio listener
Local newspapers reader
Age ofRespondent
18 to 34
35 to 49
50 to 64
65 and older
Gender ofRespondent
Men
Women
Level ofEducation
High school or less
Tech school/Some college
College graduate
Postgraduate work
Region ofState
Connecticut Valley
Manchester Area
Mass Border
North Country
Seacoast
Central/Lakes
2020PresidentialVote
Voted for Trump
Voted for Biden
Voted for other 2020 candidate
Did not vote in 2020
0%
5%
11%
6%
9%
21%
1%
10%
30%
12%
32%
29%
81%
44%
10%
2%
5%
7%
4%
4%
21%
1%
6%
26%
21%
12%
33%
72%
73%
12%
0%
4%
13%
4%
16%
10%
1%
9%
36%
10%
28%
33%
85%
44%
8%
1%
3%
2%
6%
14%
3%
1%
12%
4%
1%
12%
7%
14%
5%
19%
2%
4%
14%
16%
21%
20%
29%
10%
22%
26%
30%
30%
46%
39%
81%
72%
43%
32%
32%
29%
7%
2%
4%
10%
13%
13%
4%
13%
17%
8%
12%
16%
27%
22%
37%
15%
36%
55%
42%
47%
8%
3%
15%
7%
15%
11%
29%
19%
34%
60%
3%
5%
10%
3%
18%
9%
13%
8%
17%
22%
16%
3%
35%
34%
17%
21%
27%
30%
44%
65%
0%
7%
0%
5%
14%
3%
11%
12%
3%
6%
23%
9%
9%
13%
12%
10%
23%
6%
26%
25%
45%
31%
10%
14%
54%
43%
40%
47%
30%
69%
32%
7%
3%
18%
3%
6%
17%
23%
0%
6%
40%
32%
16%
56%
43%
19%
78%
275
394
259
405
136
398
256
466
192
187
263
351
690
162
448
68
193
301
204
257
479
467
121
199
295
348
161
155
91
235
185
133
19
15
488
424
How Much Blame for Taliban's Takeover of Afghanistan - President Biden

A lot Some Only a little Not at allDon't know/Not
sure
STATEWIDE August 2021 6%32%9%30%23%
N
969
VotingRegistration
Registered Democrat
Registered Undeclared/Not Reg.
Registered Republican
Party ID Democrat
Independent
Republican
Ideology Liberal
Moderate
Conservative
Media Usage Boston Globe reader
NHPR listener
Union Leader reader
WMUR viewer
Fox News viewer
Conservative radio listener
Local newspapers reader
Age ofRespondent
18 to 34
35 to 49
50 to 64
65 and older
Gender ofRespondent
Men
Women
Level ofEducation
High school or less
Tech school/Some college
College graduate
Postgraduate work
Region ofState
Connecticut Valley
Manchester Area
Mass Border
North Country
Seacoast
Central/Lakes
2020PresidentialVote
Voted for Trump
Voted for Biden
Voted for other 2020 candidate
Did not vote in 2020
1%
5%
11%
68%
25%
3%
9%
9%
9%
16%
33%
41%
5%
28%
37%
1%
4%
8%
62%
14%
8%
9%
9%
9%
24%
33%
36%
3%
40%
39%
0%
3%
12%
72%
25%
1%
10%
8%
10%
14%
36%
39%
5%
28%
37%
1%
0%
1%
5%
14%
3%
1%
34%
65%
53%
31%
15%
21%
26%
8%
7%
13%
10%
10%
10%
6%
25%
21%
24%
31%
19%
37%
37%
32%
6%
9%
23%
42%
29%
30%
4%
2%
6%
12%
30%
43%
30%
22%
9%
7%
10%
9%
21%
30%
44%
28%
37%
19%
10%
29%
9%
2%
32%
32%
6%
12%
30%
31%
23%
24%
3%
8%
10%
2%
19%
15%
30%
48%
10%
17%
10%
3%
41%
38%
26%
25%
26%
22%
24%
22%
1%
7%
0%
5%
15%
2%
51%
37%
26%
18%
25%
43%
16%
13%
13%
5%
6%
4%
22%
23%
42%
33%
26%
41%
11%
20%
19%
39%
29%
10%
32%
8%
2%
5%
21%
7%
62%
2%
18%
8%
10%
61%
29%
35%
23%
0%
32%
42%
2%
271
392
264
401
133
403
253
465
194
190
257
345
689
161
452
69
192
300
205
257
480
465
121
199
294
348
161
156
94
231
185
134
19
15
493
418
How Much Blame for Taliban's Takeover of Afghanistan - Former President Trump

A lot Some Only a little Not at allDon't know/Not
sure
STATEWIDE August 2021 6%26%15%37%16%
N
968
VotingRegistration
Registered Democrat
Registered Undeclared/Not Reg.
Registered Republican
Party ID Democrat
Independent
Republican
Ideology Liberal
Moderate
Conservative
Media Usage Boston Globe reader
NHPR listener
Union Leader reader
WMUR viewer
Fox News viewer
Conservative radio listener
Local newspapers reader
Age ofRespondent
18 to 34
35 to 49
50 to 64
65 and older
Gender ofRespondent
Men
Women
Level ofEducation
High school or less
Tech school/Some college
College graduate
Postgraduate work
Region ofState
Connecticut Valley
Manchester Area
Mass Border
North Country
Seacoast
Central/Lakes
2020PresidentialVote
Voted for Trump
Voted for Biden
Voted for other 2020 candidate
Did not vote in 2020
3%
4%
10%
37%
12%
33%
10%
16%
20%
22%
56%
30%
29%
12%
7%
3%
5%
9%
31%
6%
28%
10%
12%
21%
32%
62%
35%
24%
15%
7%
3%
3%
14%
32%
26%
22%
8%
17%
20%
23%
45%
37%
34%
9%
7%
5%
1%
4%
7%
12%
6%
2%
41%
33%
25%
27%
27%
29%
33%
21%
14%
12%
14%
10%
17%
14%
29%
33%
38%
36%
35%
40%
45%
5%
20%
20%
16%
15%
8%
6%
6%
5%
6%
8%
13%
28%
25%
36%
15%
13%
12%
20%
46%
30%
50%
29%
21%
24%
7%
7%
9%
3%
30%
22%
13%
17%
34%
41%
14%
17%
5%
5%
11%
3%
24%
18%
27%
31%
22%
22%
19%
5%
41%
41%
32%
38%
7%
14%
11%
23%
2%
8%
4%
4%
13%
3%
35%
39%
15%
12%
35%
20%
27%
12%
8%
10%
16%
16%
25%
33%
47%
60%
20%
33%
11%
8%
25%
14%
16%
28%
10%
9%
3%
32%
5%
25%
28%
2%
29%
18%
12%
19%
36%
42%
33%
47%
20%
6%
24%
273
393
259
403
135
398
253
463
194
186
262
349
687
163
449
68
190
302
204
257
479
464
120
199
293
348
161
155
93
234
184
131
19
14
487
422
How Much Blame for Taliban's Takeover of Afghanistan - Former President Obama

A lot Some Only a little Not at allDon't know/Not
sure
STATEWIDE August 2021 7%25%11%31%27%
N
967
VotingRegistration
Registered Democrat
Registered Undeclared/Not Reg.
Registered Republican
Party ID Democrat
Independent
Republican
Ideology Liberal
Moderate
Conservative
Media Usage Boston Globe reader
NHPR listener
Union Leader reader
WMUR viewer
Fox News viewer
Conservative radio listener
Local newspapers reader
Age ofRespondent
18 to 34
35 to 49
50 to 64
65 and older
Gender ofRespondent
Men
Women
Level ofEducation
High school or less
Tech school/Some college
College graduate
Postgraduate work
Region ofState
Connecticut Valley
Manchester Area
Mass Border
North Country
Seacoast
Central/Lakes
2020PresidentialVote
Voted for Trump
Voted for Biden
Voted for other 2020 candidate
Did not vote in 2020
6%
3%
13%
52%
16%
5%
18%
11%
6%
16%
50%
21%
9%
20%
55%
5%
5%
8%
46%
14%
8%
16%
8%
7%
23%
56%
31%
10%
18%
46%
6%
3%
14%
51%
20%
3%
16%
11%
6%
17%
40%
27%
10%
26%
51%
2%
0%
2%
5%
12%
3%
1%
29%
35%
41%
28%
21%
17%
28%
12%
20%
14%
9%
6%
12%
4%
28%
27%
30%
29%
32%
33%
25%
29%
17%
14%
29%
30%
35%
41%
5%
6%
6%
10%
22%
32%
29%
15%
12%
7%
8%
17%
36%
29%
30%
28%
25%
25%
26%
30%
11%
2%
23%
27%
10%
12%
31%
29%
25%
29%
4%
5%
11%
5%
16%
13%
22%
36%
17%
11%
17%
4%
32%
30%
23%
37%
31%
41%
27%
17%
3%
7%
1%
3%
14%
12%
32%
37%
31%
12%
17%
26%
24%
6%
6%
8%
14%
5%
23%
30%
38%
44%
18%
31%
17%
19%
24%
34%
37%
26%
32%
11%
8%
4%
1%
15%
8%
46%
35%
7%
15%
19%
20%
37%
25%
48%
19%
40%
10%
273
392
260
403
133
399
254
463
194
185
261
347
686
162
449
69
192
300
202
257
479
463
121
199
292
348
160
156
93
231
184
133
19
12
489
421
How Much Blame for Taliban's Takeover of Afghanistan - Former President Bush

A lot Some Only a little Not at allDon't know/Not
sure
STATEWIDE August 2021 4%26%18%27%24%
N
961
VotingRegistration
Registered Democrat
Registered Undeclared/Not Reg.
Registered Republican
Party ID Democrat
Independent
Republican
Ideology Liberal
Moderate
Conservative
Media Usage Boston Globe reader
NHPR listener
Union Leader reader
WMUR viewer
Fox News viewer
Conservative radio listener
Local newspapers reader
Age ofRespondent
18 to 34
35 to 49
50 to 64
65 and older
Gender ofRespondent
Men
Women
Level ofEducation
High school or less
Tech school/Some college
College graduate
Postgraduate work
Region ofState
Connecticut Valley
Manchester Area
Mass Border
North Country
Seacoast
Central/Lakes
2020PresidentialVote
Voted for Trump
Voted for Biden
Voted for other 2020 candidate
Did not vote in 2020
3%
2%
9%
43%
13%
32%
11%
24%
16%
26%
32%
21%
16%
29%
22%
2%
0%
7%
32%
8%
28%
14%
43%
13%
25%
38%
25%
27%
11%
27%
3%
1%
13%
42%
16%
33%
7%
22%
19%
28%
29%
20%
20%
33%
15%
1%
2%
5%
12%
2%
2%
32%
29%
27%
27%
26%
31%
12%
10%
17%
18%
13%
8%
13%
5%
28%
30%
32%
29%
40%
33%
39%
29%
24%
20%
27%
14%
21%
42%
2%
4%
3%
8%
27%
24%
23%
31%
15%
9%
16%
31%
30%
32%
35%
11%
26%
30%
23%
18%
8%
1%
29%
23%
11%
25%
28%
25%
24%
26%
3%
3%
8%
2%
25%
24%
25%
29%
16%
17%
22%
16%
32%
42%
24%
18%
23%
14%
20%
35%
1%
4%
0%
2%
16%
2%
22%
38%
30%
17%
35%
19%
21%
13%
3%
31%
16%
12%
24%
19%
18%
31%
20%
46%
32%
26%
48%
19%
13%
22%
0%
6%
2%
14%
20%
24%
30%
49%
29%
21%
12%
1%
36%
25%
29%
36%
15%
23%
26%
271
394
254
401
135
393
253
459
193
188
253
346
681
163
451
68
192
293
205
257
478
459
121
197
294
342
159
155
94
226
185
133
19
15
483
419
How Much Blame for Taliban's Takeover of Afghanistan - The Afghan people

A lot Some Only a little Not at allDon't know/Not
sure
STATEWIDE August 2021 4%4%4%23%65%
N
970
VotingRegistration
Registered Democrat
Registered Undeclared/Not Reg.
Registered Republican
Party ID Democrat
Independent
Republican
Ideology Liberal
Moderate
Conservative
Media Usage Boston Globe reader
NHPR listener
Union Leader reader
WMUR viewer
Fox News viewer
Conservative radio listener
Local newspapers reader
Age ofRespondent
18 to 34
35 to 49
50 to 64
65 and older
Gender ofRespondent
Men
Women
Level ofEducation
High school or less
Tech school/Some college
College graduate
Postgraduate work
Region ofState
Connecticut Valley
Manchester Area
Mass Border
North Country
Seacoast
Central/Lakes
2020PresidentialVote
Voted for Trump
Voted for Biden
Voted for other 2020 candidate
Did not vote in 2020
3%
0%
9%
10%
3%
1%
2%
6%
2%
32%
21%
20%
53%
70%
67%
3%
6%
8%
6%
1%
5%
2%
3%
29%
15%
20%
55%
77%
71%
3%
1%
12%
12%
2%
0%
3%
5%
1%
33%
15%
31%
48%
77%
55%
1%
3%
3%
5%
12%
3%
1%
3%
2%
4%
4%
2%
2%
6%
5%
3%
1%
2%
23%
24%
32%
22%
15%
23%
22%
71%
66%
55%
67%
73%
71%
77%
4%
2%
3%
8%
0%
9%
1%
4%
2%
2%
2%
7%
23%
24%
30%
17%
70%
63%
65%
65%
8%
0%
4%
4%
3%
4%
23%
22%
62%
70%
1%
2%
8%
2%
1%
1%
5%
7%
4%
6%
5%
1%
25%
30%
25%
18%
69%
62%
57%
72%
5%
3%
0%
12%
1%
4%
7%
21%
1%
0%
1%
3%
2%
3%
4%
8%
0%
35%
26%
12%
19%
21%
24%
52%
62%
65%
76%
59%
73%
6%
2%
1%
0%
9%
13%
3%
2%
5%
1%
33%
18%
28%
86%
63%
74%
55%
274
391
262
400
136
402
250
469
194
190
262
346
690
160
454
69
191
302
205
257
483
463
121
199
298
344
158
156
94
235
184
134
19
14
493
420
How Much Blame for Taliban's Takeover of Afghanistan - The Afghan government

Right direction Wrong track Don't know/Not sure
STATEWIDE August 2021 9%59%32%
N
977
VotingRegistration
Registered Democrat
Registered Undeclared/Not Reg.
Registered Republican
Party ID Democrat
Independent
Republican
Ideology Liberal
Moderate
Conservative
Media Usage Boston Globe reader
NHPR listener
Union Leader reader
WMUR viewer
Fox News viewer
Conservative radio listener
Local newspapers reader
Age ofRespondent
18 to 34
35 to 49
50 to 64
65 and older
Gender ofRespondent
Men
Women
Level ofEducation
High school or less
Tech school/Some college
College graduate
Postgraduate work
Region ofState
Connecticut Valley
Manchester Area
Mass Border
North Country
Seacoast
Central/Lakes
2020PresidentialVote
Voted for Trump
Voted for Biden
Voted for other 2020 candidate
Did not vote in 2020
2%
8%
10%
96%
55%
31%
3%
36%
60%
2%
3%
17%
96%
55%
25%
2%
43%
58%
1%
10%
15%
97%
51%
31%
2%
39%
54%
19%
8%
2%
10%
5%
13%
34%
39%
83%
87%
59%
57%
43%
22%
42%
9%
10%
31%
38%
44%
44%
7%
5%
7%
16%
50%
72%
68%
44%
43%
23%
25%
41%
11%
5%
54%
64%
34%
31%
14%
14%
6%
6%
42%
44%
62%
72%
44%
42%
32%
22%
19%
7%
8%
8%
3%
7%
57%
53%
75%
46%
64%
74%
24%
40%
17%
46%
33%
19%
0%
15%
1%
67%
86%
25%
98%
33%
14%
60%
1%
276
395
264
406
136
403
256
470
194
190
264
352
696
165
455
69
197
303
205
257
485
468
122
200
299
348
163
156
94
236
185
134
19
15
493
425
U.S. Heading in Right Direcon or On Wrong Track