US vs. EU · 2017-06-21 · US vs. EU ABOUT STARTUP EUROPE PARTNERSHIP Established by the European...
24
Startup Transatlantic M&As US vs. EU
Transcript of US vs. EU · 2017-06-21 · US vs. EU ABOUT STARTUP EUROPE PARTNERSHIP Established by the European...

Startup Transatlantic M&AsUS vs. EU
Startup Transatlantic M&AsUS vs. EU
ABOUT STARTUP EUROPE PARTNERSHIP
Establ ished by the European Commiss ion in January 2014 at the Wor ld Economic Forum in Davos, SEP i s the first pan-European plat form dedicated to t ransforming European startups into scaleups by l ink ing them with g lobal corporat ions. By part ic ipat ing in the SEP program, g lobal companies can ease the scale up process v ia business partnerships and strategic and venture corporate investments, prov id ing them with access to the best technologies and ta lents through procurement of serv ices and products, corporate acquis i t ion or “acqui-h i r ing”.
SEP is led by Mind the Br idge, a g lobal organizat ion based in Europe and the Uni ted States, wi th the support of Nesta ( the UK’s innovat ion foundat ion) , Factory (an accelerat ion program and campus for tech companies of any stage, based in Ber l in ) , and Bis i te Accelerator (Madr id/Salamanca) .
SEP is a Startup Europe in i t iat ive. Partners inc lude Telefónica, Orange, BBVA (Founding) , and Telecom I ta l ia , SKY, Unipol Group, Microsoft and Enel (SEP Corporate Member) , wi th the inst i tut ional support of the European Investment Fund/ European Investment Bank Group, London Stock Exchange Group, EBAN, Cambr idge Univers i ty, IE Business School and Alexander von Humboldt Inst i tute for Internet and Society.
“Startup Transatlant ic M&As: US vs. EU”has been presented by Mind the Bridge and CrunchBaseat European Innovation Day on September 12th in Mountain View.
European Innovat ion Day is the opening conference
of Startup Europe Comes to Si l icon Val ley (SEVC2SV) annual miss ion
organized by Mind the Br idge as part of Startup Europe Partnership in i t iat ive.
Startup Transatlantic M&AsUS vs. EU
6K STARTUPS EXITED IN US AND EUROPE SINCE 2012.
$625B INVESTED
LEADING STARTUP ACQUISITIONS...
82%
18%
...and SHOPPING IN EUROPE.
44%
...WHILELONDONIS THE EXIT CAPITALOF EUROPE.
261
7251
BE
RLI
NPA
RIS
EUROPE SHOWS A NEGATIVE
M&A BALANCE.1.0
1.22
0.95* Exits/Acquisitions Ratio
SILICON VALLEY RUNSTHE M&A SHOW
USCOMPANIES
21%OF ALL DEALS
with
1264
1045
OF ALL ACQUISITIONS
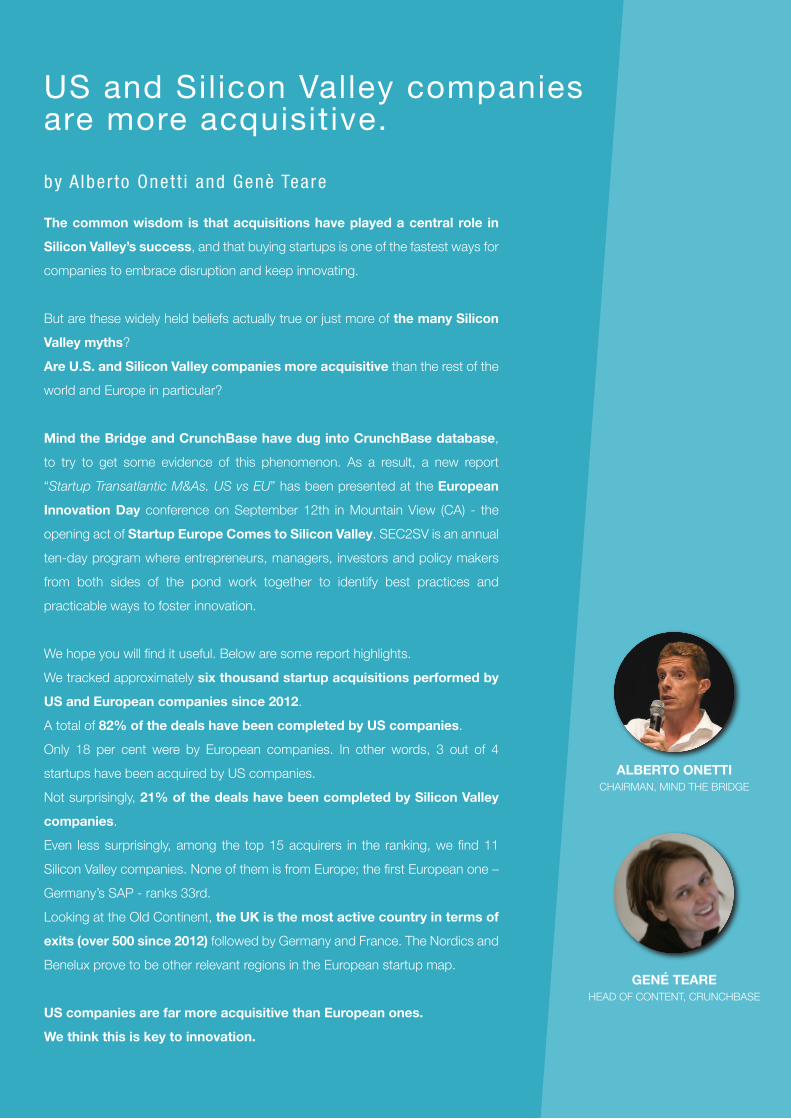
US and Silicon Valley companiesare more acquisitive.
The common wisdom is that acquisitions have played a central role in
Silicon Valley’s success, and that buying startups is one of the fastest ways for
companies to embrace disruption and keep innovating.
But are these widely held beliefs actually true or just more of the many Silicon
Valley myths?
Are U.S. and Silicon Valley companies more acquisitive than the rest of the
world and Europe in particular?
Mind the Bridge and CrunchBase have dug into CrunchBase database,
to try to get some evidence of this phenomenon. As a result, a new report
“Startup Transatlantic M&As. US vs EU” has been presented at the European
Innovation Day conference on September 12th in Mountain View (CA) - the
opening act of Startup Europe Comes to Silicon Valley. SEC2SV is an annual
ten-day program where entrepreneurs, managers, investors and policy makers
from both sides of the pond work together to identify best practices and
practicable ways to foster innovation.
We hope you will find it useful. Below are some report highlights.
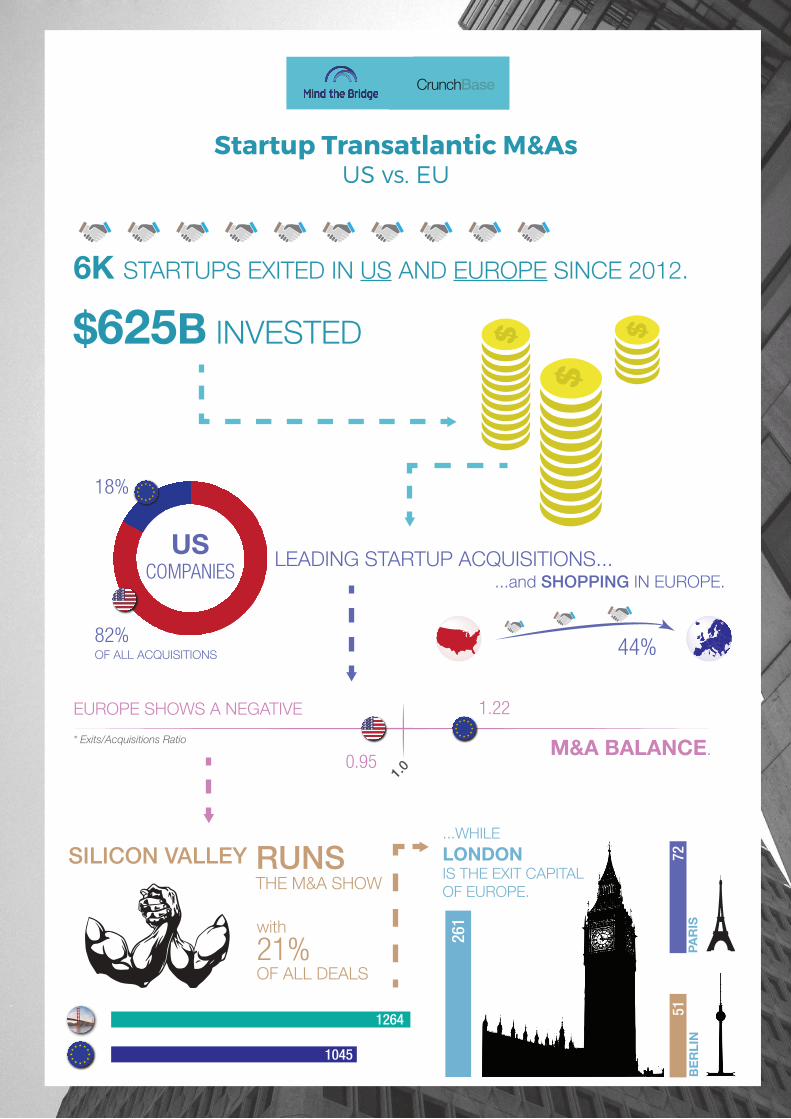
We tracked approximately six thousand startup acquisitions performed by
US and European companies since 2012.
A total of 82% of the deals have been completed by US companies.
Only 18 per cent were by European companies. In other words, 3 out of 4
startups have been acquired by US companies.
Not surprisingly, 21% of the deals have been completed by Silicon Valley
companies.
Even less surprisingly, among the top 15 acquirers in the ranking, we find 11
Silicon Valley companies. None of them is from Europe; the first European one –
Germany’s SAP - ranks 33rd.
Looking at the Old Continent, the UK is the most active country in terms of
exits (over 500 since 2012) followed by Germany and France. The Nordics and
Benelux prove to be other relevant regions in the European startup map.
US companies are far more acquisitive than European ones.
We think this is key to innovation.
by A lber to Onet t i and Genè Teare
GENÉ TEAREHEAD OF CONTENT, CRUNCHBASE
ALBERTO ONETTICHAIRMAN, MIND THE BRIDGE
Editorial Notes
This study is based on the CrunchBase dataset. The study is not exhaustive,
however we believe that the present research is based on a representative set of
companies that allow the collected results and trends to be generalized to a larger
population.
To finalize the research, we analyzed over 15,230 M&A transactions completed
since 2012 and tracked in CrunchBase. Since the scope of the research is focused
on the acquisition of startups, we decided to include M&A transactions involving
startups founded after 1995. As a consequence, we restricted the analysis to
approximately six thousand transactions.
It is also important to note that, when we refer in the report to M&A values, we are
referring to acquisition prices. Numbers include only transactions with disclosed
amounts, which constitute approximately 16% of the total number of analyzed
transactions. Although values for major transactions are usually revealed, values
indicated in this study are structurally underestimated since a large percentage of
startups do not disclose the price of the transaction.

“Acquisitions have been key to Silicon Valley’s continued success.
Acquiring startups is considered to be one of the fastest way
for companies to embrace disruption and to keep innovating.
OK

We tracked 6,414 exits of US and European startups since 2012 for a total value
of 625 billion dollars1.
A total of 5,925 (92%) acquisitions of US and European startups were performed by
US and European companies, while the remaining 8% (489 transactions) were from
the rest of the world.
6k Startups exited in theUS and Europe since 2012.$625B invested.
“
8%Rest of the World
92%US & EU Companies6,414
startup acquisitions
ACQUISITIONS OF US AND EUROPEAN STARTUPS
Additionally, we found that US and European companies acquired an additional
576 startups outside the US and Europe, spending $25 billion dollars for deals
with disclosed amounts.
1
576 acquisitions
$25B invested
US AND EUROPEAN ACQUISITIONS OF STARTUPSOUTSIDE THE US AND EUROPE
Exits? How Many?Who’s Buying US and European Startups?
$625BCapital Invested
1 The exited values for this report includes only transactions with disclosed amounts.
This represents approximately 16% of all exits. Amounts for major transactions are often disclosed, but for the majority
of acquisitions amounts are not disclosed
OK

US AND EUROPEAN ACQUISITIONS ACROSS THE ATLANTIC
96%of capitalinvested
91%of all deals
US and European companies focus their M&A activity in the US and Europe: 91% of
the acquisitions performed by US and European companies - and 96% of the
price paid - refer to US and European startups.
Consequently, our analysis will focus on these two regions with the goal to compare
the US and European approach to startup acquisitions and the innovation ties
between the United States and Europe.
For the sake of clarity, “transatlantic” will be referred to in this report to describe
activities involving US and European entities, either companies or startups.
US Companies Are More Acquisitive
The data shows a clear lead for US companies in acquiring startups. This
supports the thesis that US companies have a more acquisitive approach than
European companies.
5,925startup acquisitions
18%by EU Companies
82%by US Companies
number of deals 1045
number of deals 4880
US AND EUROPEAN EXITS: BREAKDOWN BY ACQUIRER
The data shows a clearlead of US companies in startup acquisitions.
2
Startup Transatlantic M&AsUS vs. EU
“
OK
3
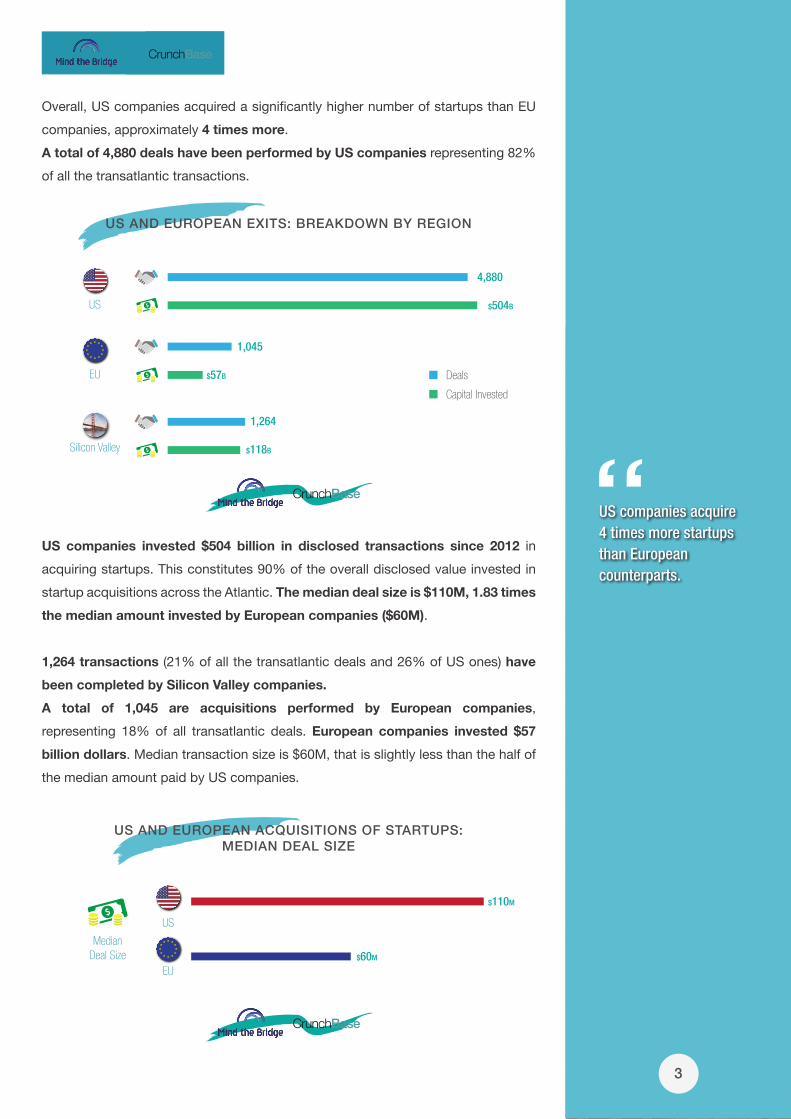
Overall, US companies acquired a significantly higher number of startups than EU
companies, approximately 4 times more.
A total of 4,880 deals have been performed by US companies representing 82%
of all the transatlantic transactions.
4,880
$504B
1,045
$57B
1,264
$118B
US
EU
Silicon Valley
Deals
Capital Invested
US AND EUROPEAN EXITS: BREAKDOWN BY REGION
US companies invested $504 billion in disclosed transactions since 2012 in
acquiring startups. This constitutes 90% of the overall disclosed value invested in
startup acquisitions across the Atlantic. The median deal size is $110M, 1.83 times
the median amount invested by European companies ($60M).
1,264 transactions (21% of all the transatlantic deals and 26% of US ones) have
been completed by Silicon Valley companies.
A total of 1,045 are acquisitions performed by European companies,
representing 18% of all transatlantic deals. European companies invested $57
billion dollars. Median transaction size is $60M, that is slightly less than the half of
the median amount paid by US companies.
US
EU
MedianDeal Size
$110M
$60M
US AND EUROPEAN ACQUISITIONS OF STARTUPS:MEDIAN DEAL SIZE
US companies acquire4 times more startupsthan Europeancounterparts.
“
OK
M&A Activities Across The Pond
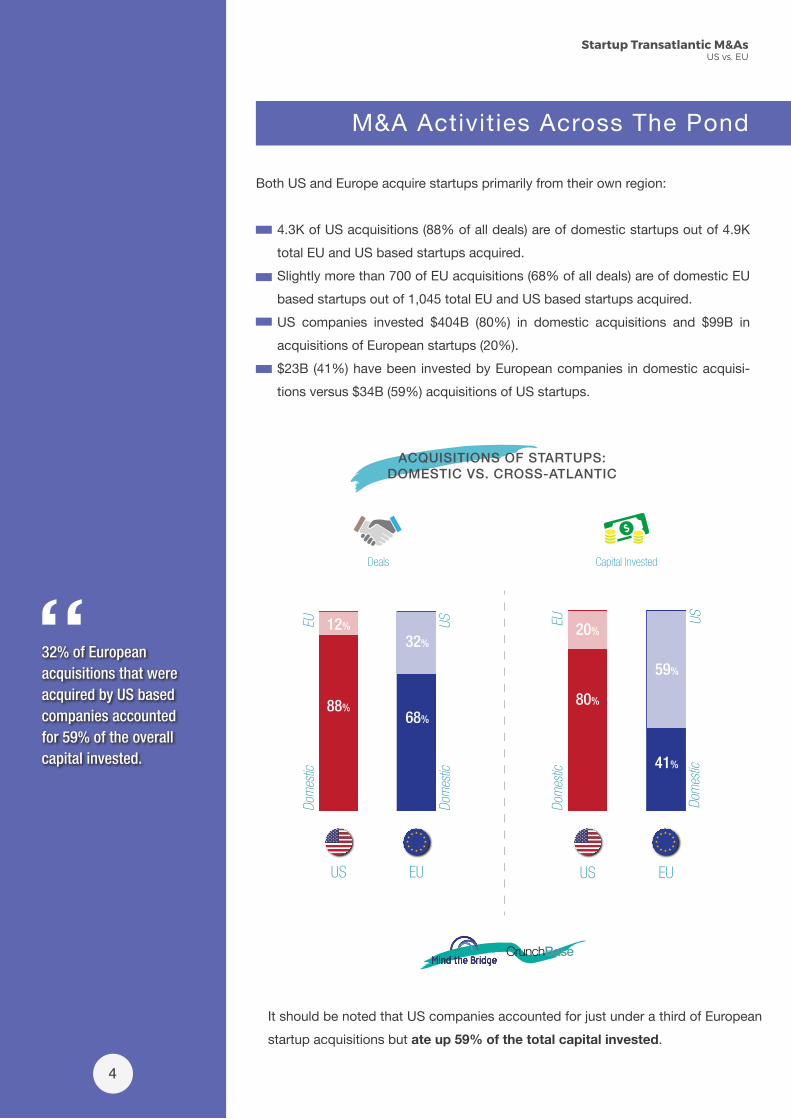
Both US and Europe acquire startups primarily from their own region:
4.3K of US acquisitions (88% of all deals) are of domestic startups out of 4.9K
total EU and US based startups acquired.
Slightly more than 700 of EU acquisitions (68% of all deals) are of domestic EU
based startups out of 1,045 total EU and US based startups acquired.
US companies invested $404B (80%) in domestic acquisitions and $99B in
acquisitions of European startups (20%).
$23B (41%) have been invested by European companies in domestic acquisi-
tions versus $34B (59%) acquisitions of US startups.
US EU
88%
12%
68%
32%
Dom
estic
Dom
estic
EU US
US EU
80%
20%
41%
59%
Dom
estic
Dom
estic
EU US
Deals Capital Invested
ACQUISITIONS OF STARTUPS:DOMESTIC VS. CROSS-ATLANTIC
Startup Transatlantic M&AsUS vs. EU
4
32% of Europeanacquisitions that wereacquired by US basedcompanies accountedfor 59% of the overallcapital invested.
“
It should be noted that US companies accounted for just under a third of European
startup acquisitions but ate up 59% of the total capital invested.
OK
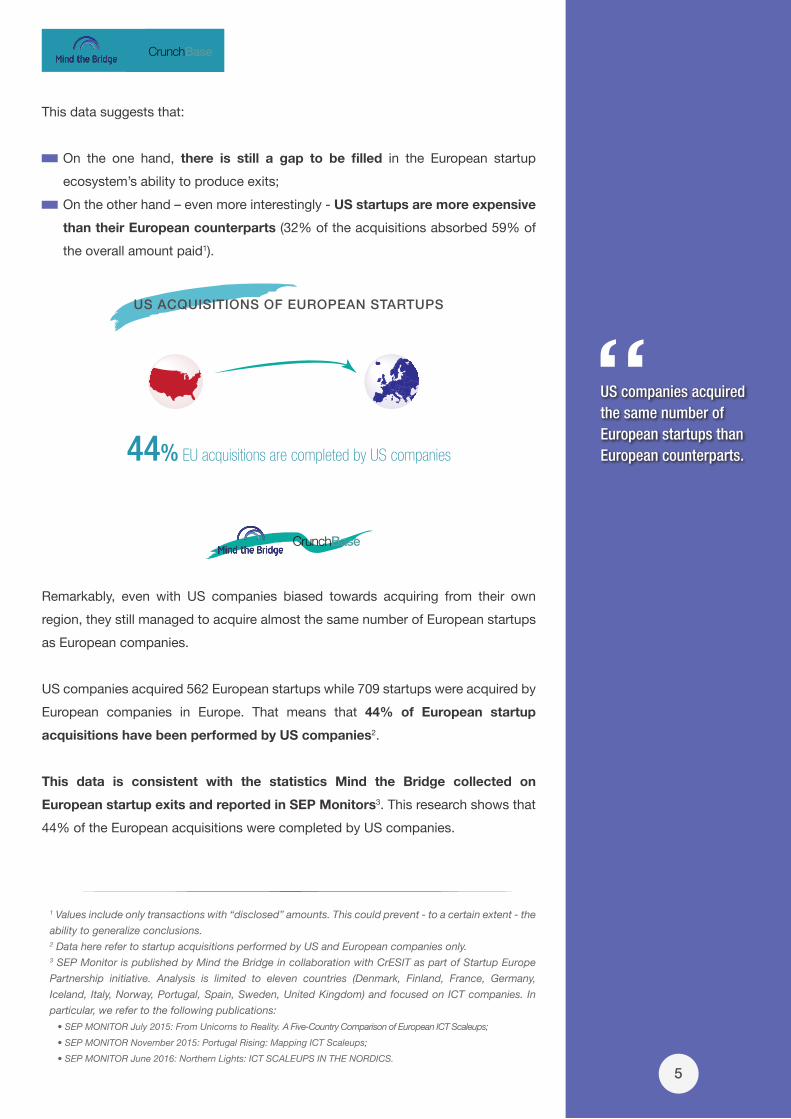
This data suggests that:
On the one hand, there is still a gap to be filled in the European startup
ecosystem’s ability to produce exits;
On the other hand – even more interestingly - US startups are more expensive
than their European counterparts (32% of the acquisitions absorbed 59% of
the overall amount paid1).
5
44% EU acquisitions are completed by US companies
US ACQUISITIONS OF EUROPEAN STARTUPS
Remarkably, even with US companies biased towards acquiring from their own
region, they still managed to acquire almost the same number of European startups
as European companies.
US companies acquired 562 European startups while 709 startups were acquired by
European companies in Europe. That means that 44% of European startup
acquisitions have been performed by US companies2.
This data is consistent with the statistics Mind the Bridge collected on
European startup exits and reported in SEP Monitors3. This research shows that
44% of the European acquisitions were completed by US companies.
1 Values include only transactions with “disclosed” amounts. This could prevent - to a certain extent - the
ability to generalize conclusions.2 Data here refer to startup acquisitions performed by US and European companies only.3 SEP Monitor is published by Mind the Bridge in collaboration with CrESIT as part of Startup Europe
Partnership initiative. Analysis is limited to eleven countries (Denmark, Finland, France, Germany,
Iceland, Italy, Norway, Portugal, Spain, Sweden, United Kingdom) and focused on ICT companies. In
particular, we refer to the following publications:
• SEP MONITOR July 2015: From Unicorns to Reality. A Five-Country Comparison of European ICT Scaleups;
• SEP MONITOR November 2015: Portugal Rising: Mapping ICT Scaleups;
• SEP MONITOR June 2016: Northern Lights: ICT SCALEUPS IN THE NORDICS.
US companies acquiredthe same number ofEuropean startups thanEuropean counterparts.
“
OK
Startup Transatlantic M&AsUS vs. EU
6
The More Buyers, The More Exits
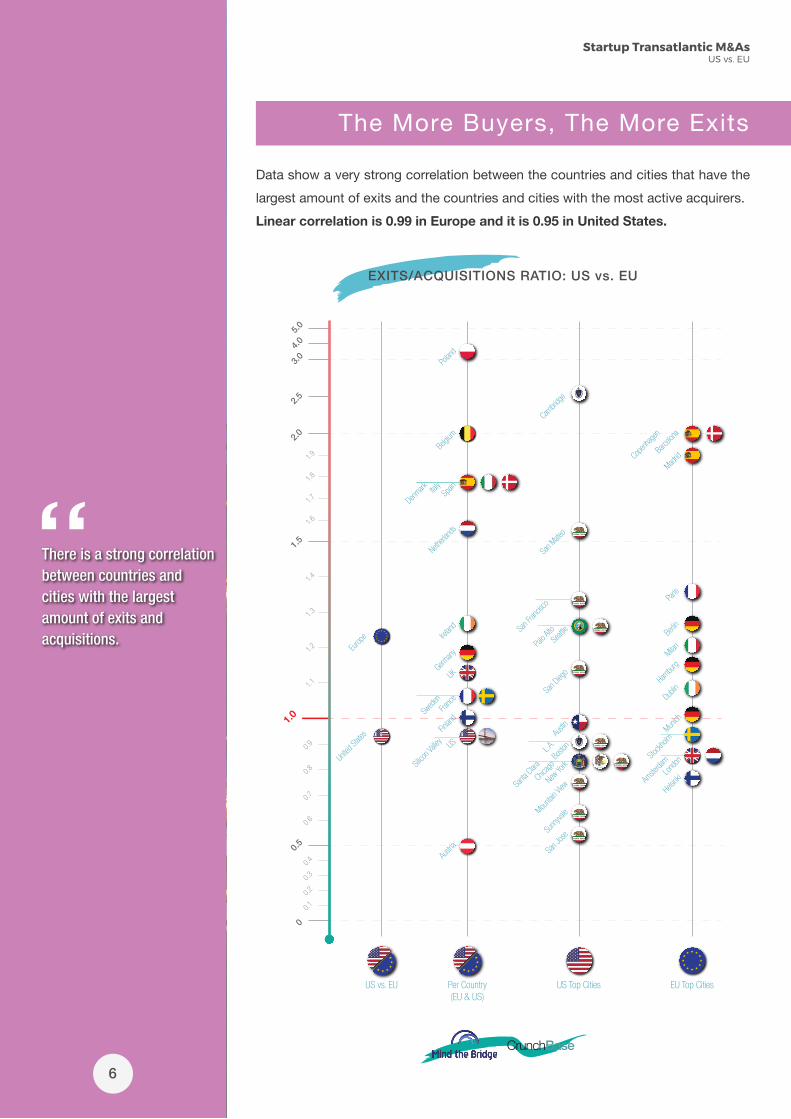
Data show a very strong correlation between the countries and cities that have the
largest amount of exits and the countries and cities with the most active acquirers.
Linear correlation is 0.99 in Europe and it is 0.95 in United States.
EXITS/ACQUISITIONS RATIO: US vs. EU
New Yo
rk
Chica
go
San J
ose
L.A.
Bosto
n
Sunn
yvaleMou
ntain V
iew
Austin
Palo A
ltoSe
attleSa
n Fran
cisco
San D
iego
1.0
1.1
1.2
1.3
1.4
1.5
1.6
1.7
1.8
1.9
2.0
2.5
3.04.05.0
0.5
0
0.6
0.7
0.8
0.9
0.1
0.2
0.3
0.4
United
State
s
Europ
e
Stockh
olm
Helsink
i
Munich
Lond
on
Paris
Amste
rdam
Berlin
Dublin
Hambu
rg
Cope
nhag
en
Madrid
Per Country(EU & US)
US Top CitiesUS vs. EU EU Top Cities
Santa
Clara
Swed
en
US
Silico
n Valle
y
France
Finlan
d
Irelan
d
Austri
a
Germany
UK
Netherla
nds
Spain
Denmark Ital
y
Belgiu
m
Polan
d
Milan
Barce
lona
There is a strong correlationbetween countries and cities with the largestamount of exits andacquisitions.
“ San M
ateo
Cambri
dge
OK

7
How can we interpret this data?
Acquirers prefer to buy local companies (e.g. 56% of Twitter’s acquired firms
were based in California).
Startups are encouraged to locate closer to the acquirers to maximize their
exit opportunities.
Startup ecosystems thrive where both sides (acquirers and startups) are well
represented.
That said, not all ecosystems show a positive balance between the sell (exits) and
buy (acquisitions) side.
We calculated - by geographical area (at the continental, country, and city level) the
ratio between the number of exits and number of acquisitions.
Values above 1 show ecosystems with a “negative M&A balance”, i.e. where
the number of startups that have been sold is larger than the number of startups
that have been acquired by companies in the region.
A negative M&A balance is typical of emerging ecosystems that are able to
generate a lot of startups, but they don’t have a critical mass of large corporates
active in open innovation and acquisitions.
Values below 1 show ecosystems with a “positive M&A balance”, i.e. where
the number of startups that have been acquired by companies in the region is
larger than the number of startups that have been sold in the same region.
A positive M&A balance is characteristic of ecosystems with a strong corporate
presence but a not yet properly developed startup community.
While the US shows a certain equilibrium between exits and acquisitions (0.95),
Europe is still characterized by a negative M&A balance: the 1.22 ratio indicates
a situation where the overall number of startups that have been sold is larger than
the ones that have been acquired by regional companies.
This situation is clearly evident in the youngest ecosystems (Spain and Italy and
the Benelux). The Nordics, France, Germany and UK show lower values (between 1
and 1.2, below European average).
When broken down by city, the US situation looks quite different. New York,
Chicago and some municipalities of the Silicon Valley (including Mountain View,
Sunnyvale and San Jose), and to a lesser extent Los Angeles, Austin and Boston are
“net acquirers” of startups (the number of startups acquired is larger than the ones
that have been sold).
San Francisco, Seattle and Palo Alto are “net sellers” of startups.
Silicon Valley, when considered as a whole, demonstrates a healthy balance
(0.95), slightly below the parity.
Startup ecosystemsthrive where both sides(acquirers and startups)are well represented.
“
OK

Startup Transatlantic M&AsUS vs. EU
US and Silicon Valley Run the M&A Show
Not surprisingly the top 15 acquirers in the transatlantic ranking are all US
companies. Even less surprisingly, 11 out of the top 15 are from the Silicon Valley.
The first European company in the ranking is SAP that only ranks 33rd.
Yahoo!
Apple
Cisco
IBM
Microsoft
Oracle
Amazon
Salesforce
Dropbox
Groupon
Intel
Intuit
1
2
3
4
5
6
7
8
9
10
11
12
13
14
15
Mountain View, CA
Sunnyvale, CA
Cupertino, CA
San Jose, CA
Armonk, NY
Menlo Park, CA
Redmond, WA
Redwood City, CA
San Francisco, CA
Seattle, WA
San Francisco, CA
San Francisco, CA
Chicago, IL
Santa Clara, CA
Mountain View, CA
US TOP ACQUIRERS
US Top 15 Acquirers On average, the top 15 US-based companies
acquire 6 times more startups than the top
European companies. If we restrict the analysis to
the top 3 companies per region, the ratio increases to
7.5 times.
Altogether, the top 15 most active European
companies have acquired approximately the same
number of startups that Google bought in the same
period.
Interestingly, 5 out of the top 15 European
acquirers are companies founded in the new
Millennium. “New economy” companies seem to
have a more acquisitive approach than traditional
established companies.
8
It takes 15 Europeancompanies (the top ones)to acquire the samenumber of startupsthan Google does.
“
OK
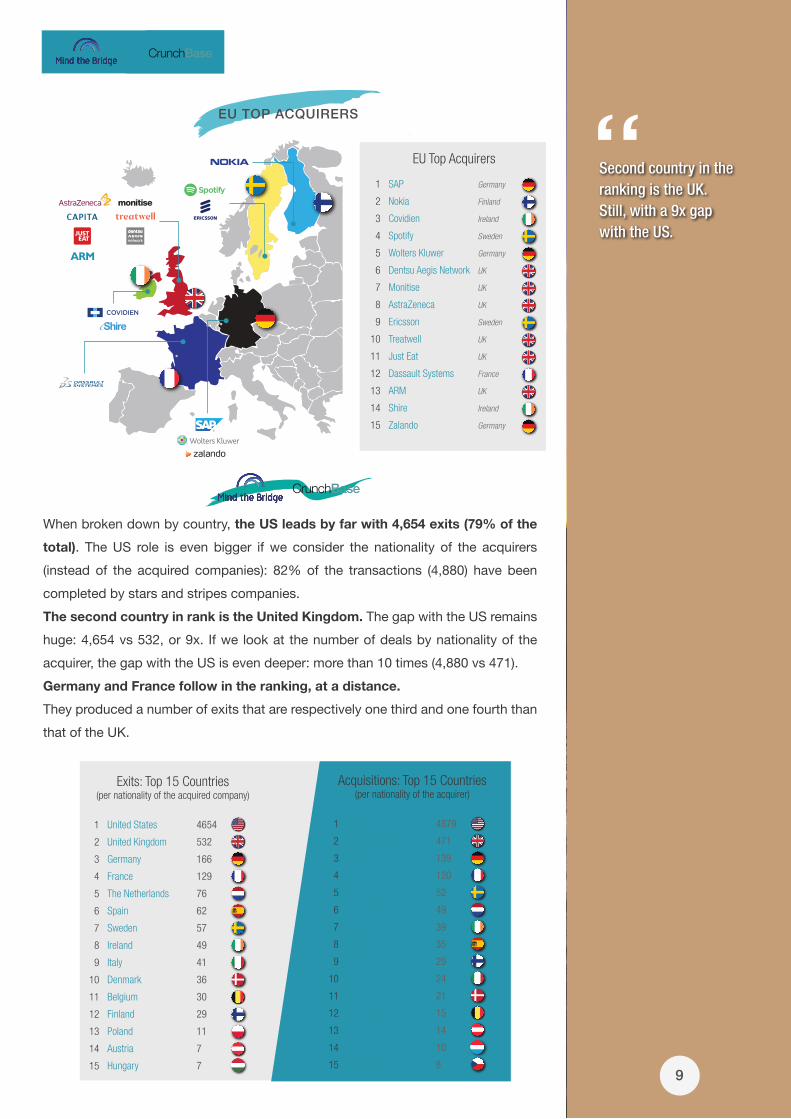
EU TOP ACQUIRERS
SAP
Nokia
Covidien
Spotify
Wolters Kluwer
Dentsu Aegis Network
Monitise
AstraZeneca
Ericsson
Treatwell
Just Eat
Dassault Systems
ARM
Shire
Zalando
1
2
3
4
5
6
7
8
9
10
11
12
13
14
15
Germany
Finland
Ireland
Sweden
Germany
UK
UK
UK
Sweden
UK
UK
France
UK
Ireland
Germany
EU Top Acquirers
When broken down by country, the US leads by far with 4,654 exits (79% of the
total). The US role is even bigger if we consider the nationality of the acquirers
(instead of the acquired companies): 82% of the transactions (4,880) have been
completed by stars and stripes companies.
The second country in rank is the United Kingdom. The gap with the US remains
huge: 4,654 vs 532, or 9x. If we look at the number of deals by nationality of the
acquirer, the gap with the US is even deeper: more than 10 times (4,880 vs 471).
Germany and France follow in the ranking, at a distance.
They produced a number of exits that are respectively one third and one fourth than
that of the UK.
United States
United Kingdom
Germany
France
The Netherlands
Spain
Sweden
Ireland
Italy
Denmark
Belgium
Finland
Poland
Austria
Hungary
1
2
3
4
5
6
7
8
9
10
11
12
13
14
15
4654
532
166
129
76
62
57
49
41
36
30
29
11
7
7
Exits: Top 15 Countries(per nationality of the acquired company)
United States
United Kingdom
Germany
France
Sweden
The Netherlands
Ireland
Spain
Finland
Italy
Denmark
Belgium
Austria
Luxembourg
Czech Republic
1
2
3
4
5
6
7
8
9
10
11
12
13
14
15
4879
471
139
120
52
49
39
35
29
24
21
15
14
10
8
Acquisitions: Top 15 Countries(per nationality of the acquirer)
9
Second country in theranking is the UK.Still, with a 9x gapwith the US.
“
OK

10
Startup Transatlantic M&AsUS vs. EU
Europe: UK Leads By Far in the M&A Game
In terms of exits, the UK is the leading country in Europe with 532 startup
acquisitions since 2012.
STARTUP ACQUISITIONS: MOST ACTIVE COUNTRIES IN EUROPE(NUMBER OF EXITS)
UK
German
y
Fran
ce
Sweden
Netherl
ands
Irelan
dSpa
in
Finlan
dIta
ly
Denmark
Belgium
Austria
Luxe
mbour
g
Czech
Rep
.
Poland
STARTUP ACQUISITIONS: MOST ACTIVE REGIONS IN EUROPE(NUMBER OF EXITS)
581
128
107
295
43
117
In terms of exits, UK isthe leading countryin Europe.
“
OK

11
The UK has acquired more startups than Germany, France, Benelux, Spain and
Italy combined.
The UK shows 3x the number of exits compared with Germany, 4x France, 9x
Spain, 13x Italy all did.
There is a similar ranking if we look at the countries of the acquirers instead of the
acquired companies. The UK is at the top with 471 transactions, followed by
Germany (139) and France (120).
When broken down by sub-region, the UK+Ireland produced 581 exits, Continental
Europe (Germany and France) follows with 295, Nordics+Baltics with 128, Benelux
106, Southern Europe (Spain, Italy, Portugal and Greece, plus Cyprus and Malta)
with 103 and CEECs with 43.
Guess What? 21% of Exits Happen in Silicon Valley
San Francisco
New York
Chicago
Austin
Mountain View
Seattle
Palo Alto
Boston
San Diego
Los Angeles
1
2
3
4
5
6
7
8
9
10
606
454
118
112
111
105
104
83
79
71
Exits: Top 10 Locations (US)(per location of the acquired company)
New York
San Francisco
Mountain View
Chicago
Austin
San Jose
Sunnyvale
Atlanta
Boston
Seattle
1
2
3
4
5
5
7
8
9
10
522
457
146
137
114
114
100
95
89
85
Acquisitions: Top 15 Locations (US)(per location of the acquirer)
When broken down by city, Silicon Valley rules the world. A total of 1,264 exits
were reported in the San Francisco Bay Area. This accounts for 26% of all US
acquisitions.
San Francisco
Mountain View
Palo Alto
Sunnyvale
San Jose
San Mateo
Santa Clara
Redwood City
Menlo Park
Cupertino
1
2
3
4
5
6
7
8
9
10
606
111
104
64
61
58
50
42
32
15
Exits:Top 10 Locations (Silicon Valley)
(per location of the acquired company)
San Francisco
Mountain View
San Jose
Sunnyvale
Palo Alto
Santa Clara
Redwood City
Menlo Park
Cupertino
San Mateo
1
2
3
4
5
6
7
8
9
10
457
146
114
100
82
62
58
53
48
38
Acquisitions:Top 15 Locations (Silicon Valley)
(per location of the acquirer)
When broken downby city, Silicon Valleyrules the world, with around 1.2k exits.
“
OK
Startup Transatlantic M&AsUS vs. EU
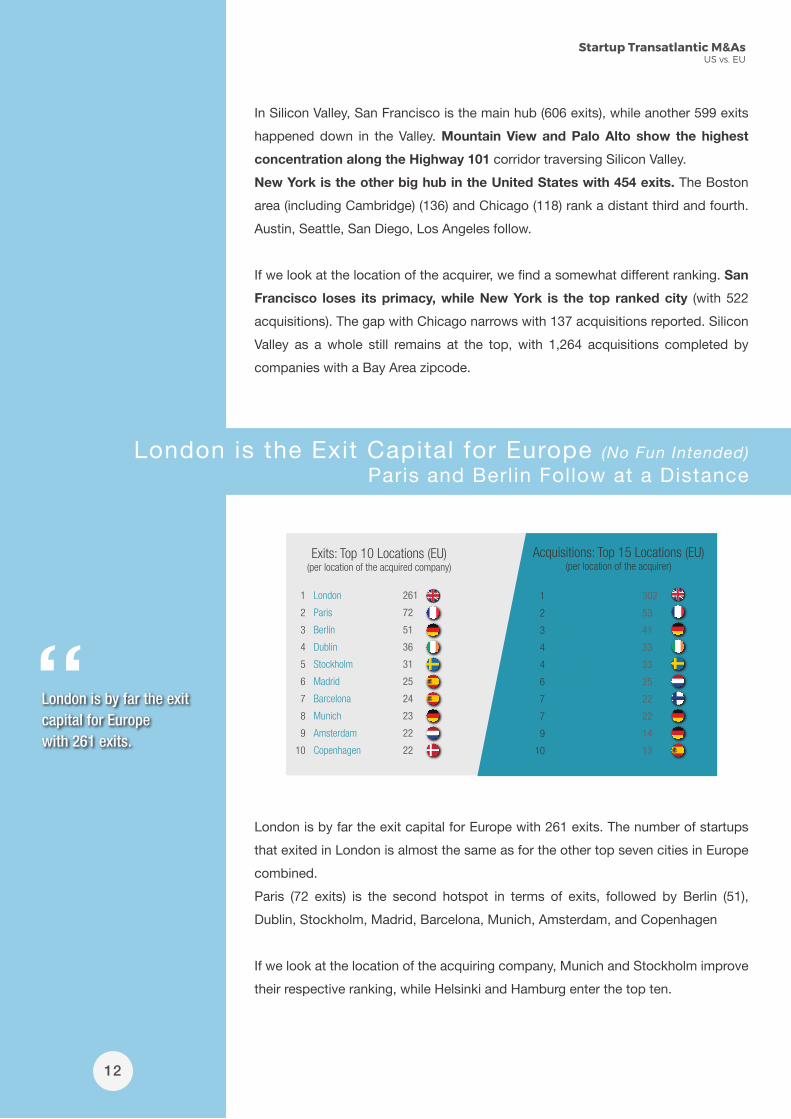
12
In Silicon Valley, San Francisco is the main hub (606 exits), while another 599 exits
happened down in the Valley. Mountain View and Palo Alto show the highest
concentration along the Highway 101 corridor traversing Silicon Valley.
New York is the other big hub in the United States with 454 exits. The Boston
area (including Cambridge) (136) and Chicago (118) rank a distant third and fourth.
Austin, Seattle, San Diego, Los Angeles follow.
If we look at the location of the acquirer, we find a somewhat different ranking. San
Francisco loses its primacy, while New York is the top ranked city (with 522
acquisitions). The gap with Chicago narrows with 137 acquisitions reported. Silicon
Valley as a whole still remains at the top, with 1,264 acquisitions completed by
companies with a Bay Area zipcode.
London is the Exit Capital for Europe (No Fun Intended)
Paris and Berlin Follow at a Distance
London
Paris
Berlin
Dublin
Stockholm
Madrid
Barcelona
Munich
Amsterdam
Copenhagen
1
2
3
4
5
6
7
8
9
10
261
72
51
36
31
25
24
23
22
22
Exits: Top 10 Locations (EU)(per location of the acquired company)
London
Paris
Berlin
Dublin
Stockholm
Amsterdam
Helsinki
Munich
Hamburg
Madrid
1
2
3
4
4
6
7
7
9
10
302
53
41
33
33
25
22
22
14
13
Acquisitions: Top 15 Locations (EU)(per location of the acquirer)
London is by far the exit capital for Europe with 261 exits. The number of startups
that exited in London is almost the same as for the other top seven cities in Europe
combined.
Paris (72 exits) is the second hotspot in terms of exits, followed by Berlin (51),
Dublin, Stockholm, Madrid, Barcelona, Munich, Amsterdam, and Copenhagen
If we look at the location of the acquiring company, Munich and Stockholm improve
their respective ranking, while Helsinki and Hamburg enter the top ten.
London is by far the exitcapital for Europewith 261 exits.
“
OK
OK

“The numbers of startups that exited in London
is almost the same number than the other
top seven cities in Europe all together.
OK
Methodology
Stats have been elaborated by Mind the Bridge based on data provided by
CrunchBase.
This report is based on public available information and disclosed data that is
collected by CrunchBase. While the data and the timeframe of the analysis is not
exhaustive, the main purpose of the report is to provide insights and show trends.
Timeframe:
Data refer to acquisitions completed since 2012 & afterwards, involving US &
European companies.
Geography:
This report is focused on US and Europe. Europe includes the 28 countries that are
part of European Union (UK is considered). Russia, Israel, Switzerland, and Turkey
are not considered.
For the sake of clarity, we refer as “transatlantic” to describe activities involving US
and European entities, either companies or startups.
Target Companies:
The study included startups founded after 1995.
Deal Values:
Data about deal amounts only include transactions with “disclosed” amounts. A
large percentage of companies do not disclose price. 16.3% of acquired startups
in this study have a price associated.
“When broken down by city, Silicon Valley rules the world.
1,205 exits are reported in the Bay Area.
This accounts for 26% of all US acquisitions.


First published in San Francisco, CA by Mind the BridgeCopyright © by Mind the Bridge

About Mind the Bridge
Founded in 2007, Mind the Bridge is a Silicon Valley/European organization dedicated to developing, promoting, and supporting sustainable entrepreneurial ecosystems around the world and bridging them to the world’s most innova-tive center – the Silicon Valley.
Mind the Bridge offers a suite of programs and services (Startup School, Investors Program, Scaleup Mastery Program, Corporate Executive Program, Technology Scouting) with partnerships and operations in Europe, Asia, MENA, and LATAM.
Mind the Bridge has also been chosen by the European Commission to drive “Startup Europe Partnership (SEP)”, the pan-European open innovation platform to connect startups to large corporates. It is also the host of Startup Europe Comes to Silicon Valley (SEC2SV), an intense week of activities in Silicon Valley for top EU scaleups, corporates and policy makers.
www.mindthebridge.comwww.startupeuropepartnership.eu@mindthebridge
About CrunchBase
CrunchBase is the destination for learning about companies, discovering investments and industry trends, and finding news about hundreds of thousands of public and private companies globally.
From startups to Fortune 500s, CrunchBase provides a depth and breadth of knowledge that ensures its data is recognized as the primary source of business information by millions of users globally.
www.crunchbase.com@crunchbase