U.S. Treasury Futures 1 - cmegroup.com trading is not suitable for all investors, involves the risk...
63
© 2018 CME Group. All rights reserved. U.S. Treasury Futures 1.0 January 2018 Foundational Concepts
Transcript of U.S. Treasury Futures 1 - cmegroup.com trading is not suitable for all investors, involves the risk...
© 2018 CME Group. All rights reserved.
U.S. Treasury Futures 1.0
January 2018
Foundational Concepts
© 2018 CME Group. All rights reserved.
1 Delivery Process
2 Treasury Basis
3 Cheapest-to-deliver (CTD)
4 Measuring risk, BPV, Hedge Ratio (HR)
5 Review and Q&A
Agenda

© 2018 CME Group. All rights reserved.
Futures trading is not suitable for all investors, and involves the risk of loss. Futures are a leveraged investment, and because only a percentage of a contract’s value is required to trade, it is possible to lose more than the amount of money deposited for a futures position. Therefore, traders should only use funds that they can afford to lose without affecting their lifestyles. And only a portion of those funds should be devoted to any one trade because they cannot expect to profit on every trade. All references to options refer to options on futures.
Swaps trading is not suitable for all investors, involves the risk of loss and should only be undertaken by investors who are ECPs within the meaning of section 1(a)12 of the Commodity Exchange Act. Swaps are a leveraged investment, and because only a percentage of a contract’s value is required to trade, it is possible to lose more than the amount of money deposited for a swaps position. Therefore, traders should only use funds that they can afford to lose without affecting their lifestyles. And only a portion of those funds should be devoted to any one trade because they cannot expect to profit on every trade.
Any research views expressed are those of the individual author and do not necessarily represent the views of the CME Group or its affiliates.
CME Group is a trademark of CME Group Inc. The Globe Logo, CME, Globex and Chicago Mercantile Exchange are trademarks of Chicago Mercantile Exchange Inc. CBOT and the Chicago Board of Trade are trademarks of the Board of Trade of the City of Chicago, Inc. NYMEX, New York Mercantile Exchange and ClearPort are registered trademarks of New York Mercantile Exchange, Inc. COMEX is a trademark of Commodity Exchange, Inc. KCBOT, KCBT and Kansas City Board of Trade are trademarks of The Board of Trade of Kansas City, Missouri, Inc. All other trademarks are the property of their respective owners.
The information within this presentation has been compiled by CME Group for general purposes only. CME Group assumes no responsibility for any errors or omissions. Additionally, all examples in this presentation are hypothetical situations, used for explanation purposes only, and should not be considered investment advice or the results of actual market experience. All matters pertaining to rules and specifications herein are made subject to and are superseded by official Exchange rules. Current rules should be consulted in all cases concerning contract specifications.
Copyright © 2018 CME Group. All rights reserved.
Disclaimer
© 2018 CME Group. All rights reserved. 4
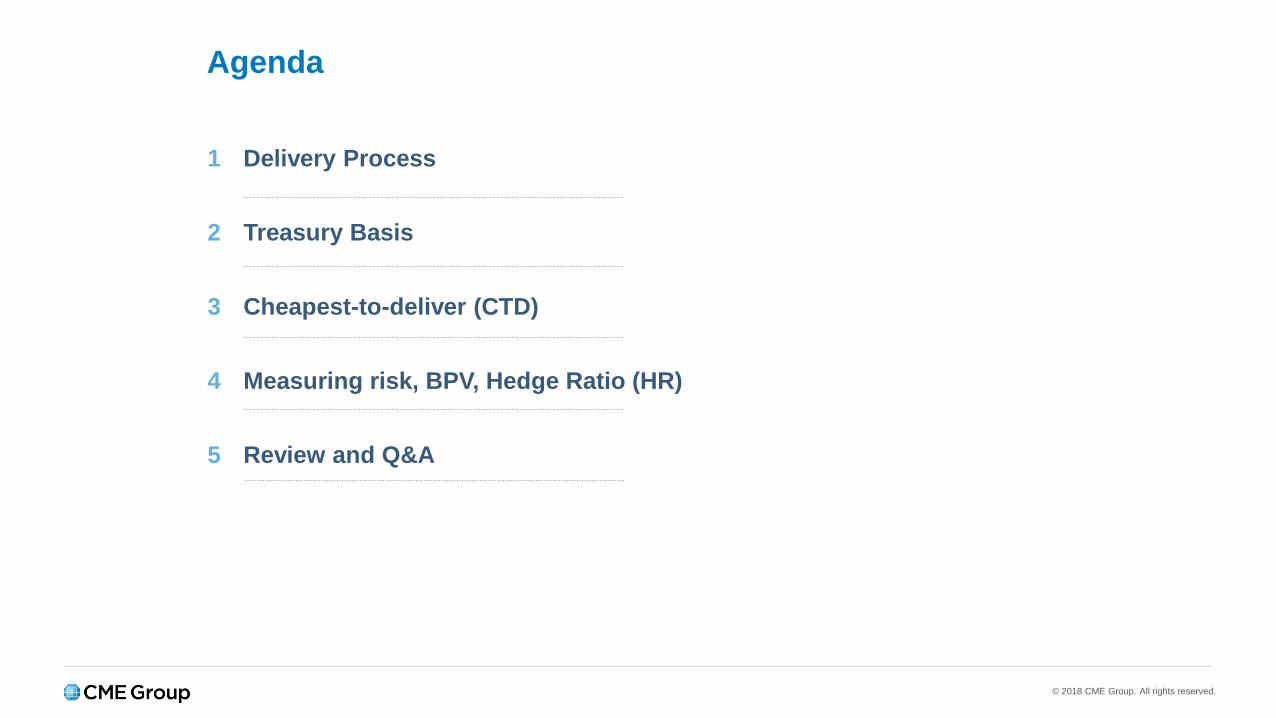
U.S. Treasury Building, Washington DC

© 2018 CME Group. All rights reserved. 5
CME Group Interest Rate Products
0.00%
0.50%
1.00%
1.50%
2.00%
2.50%
3.00%
3.50%
0 2 5 7 10 20 30
30-Day Fed Funds0-3 Years
Ultra 10-YearT-note
2-YearT-note
5-YearT-note
10-YearT-note
ClassicLong Bond
UltraLong Bond
30-Year MAC
2-Year MAC
5-Year MAC
7-Year MAC
10-Year MAC
20-Year MAC
CME Group Interest Rate futures include Fed Funds, Eurodollars, US Treasury, and Swap based products.
Eurodollars 0-10 Years
© 2018 CME Group. All rights reserved. 6
“Begin with the end in mind.”Dr. Stephen R. Covey“The Seven Habits of Highly Effective People”
© 2018 CME Group. All rights reserved. 7
“Anyone holding a position in an expiring Treasury futures contract during its delivery month must be prepared to fulfill the contractual obligation to deliver, or take delivery of, the underlying deliverable grade Treasury securities. For this reason delivery on the contract – or the prospect of it – is the chief determinant of prices at which Treasury futures trade.”
CME Group Publication, “The U.S. Treasury Futures Delivery Process”December 2011
© 2018 CME Group. All rights reserved. 8
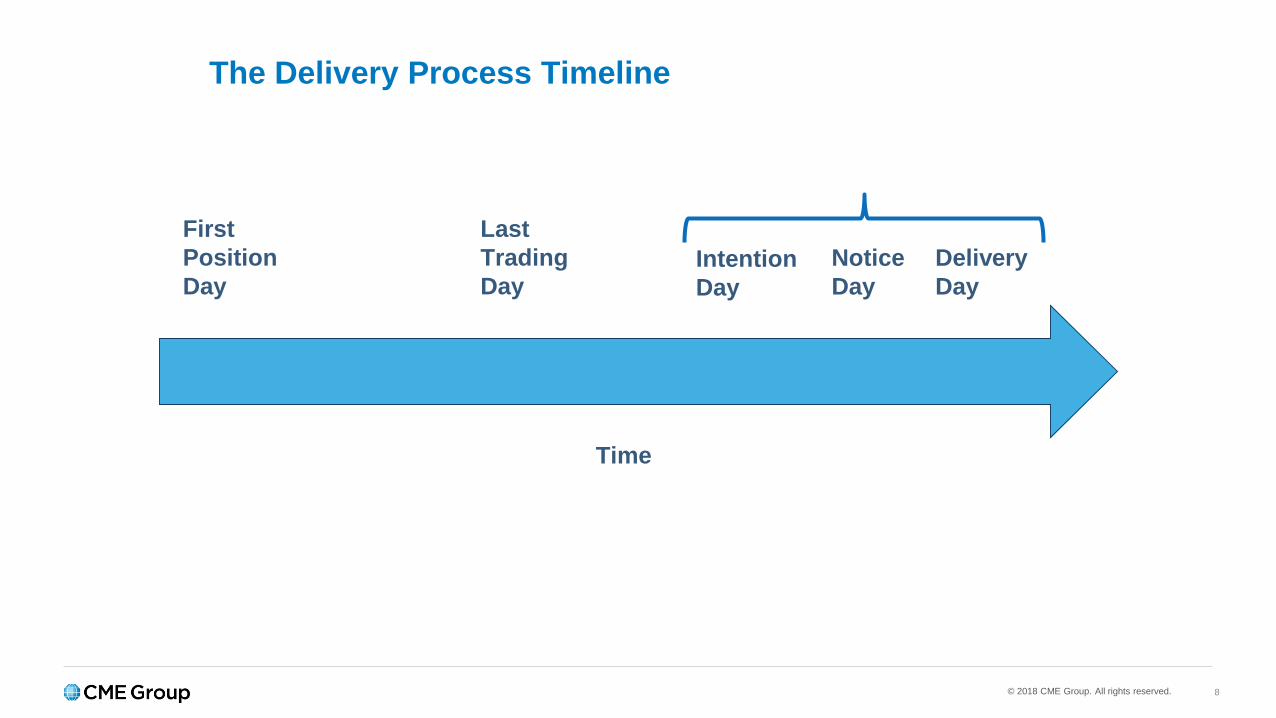
The Delivery Process Timeline
First Position Day
Intention Day
Notice Day
Delivery Day
Last Trading Day
Time
© 2018 CME Group. All rights reserved. 9
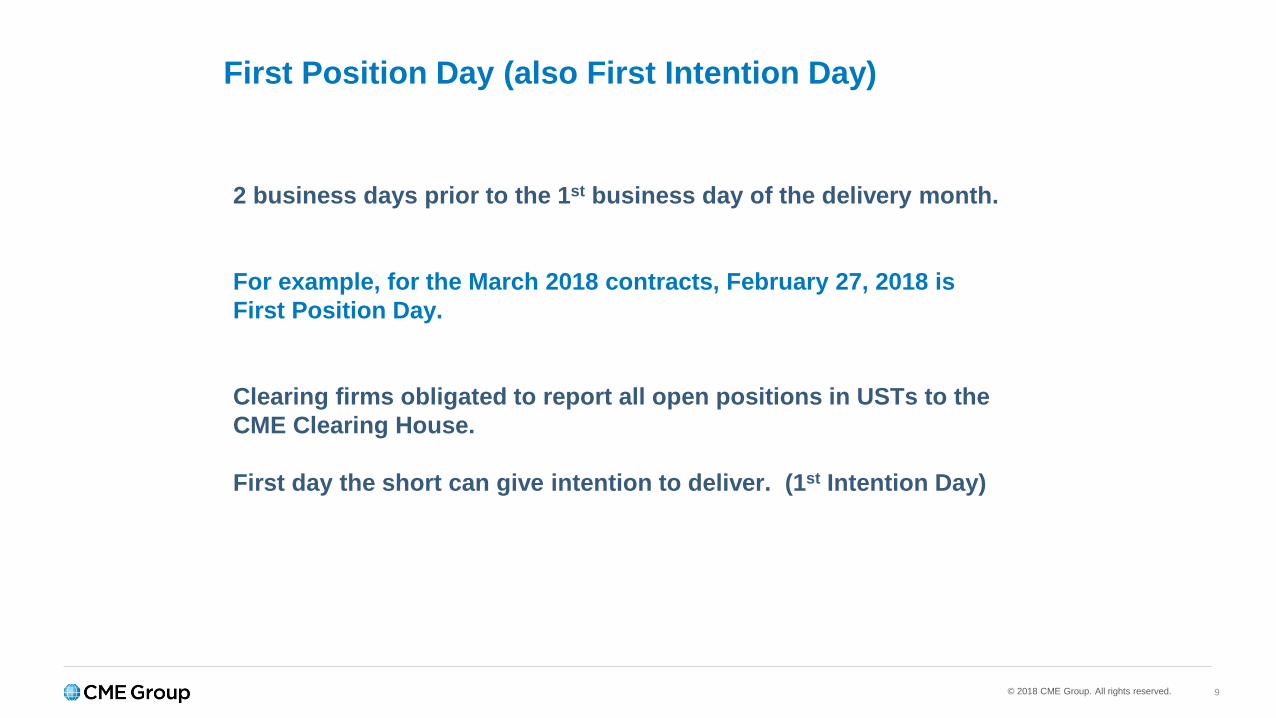
First Position Day (also First Intention Day)
2 business days prior to the 1st business day of the delivery month.
For example, for the March 2018 contracts, February 27, 2018 is First Position Day.
Clearing firms obligated to report all open positions in USTs to the CME Clearing House.
First day the short can give intention to deliver. (1st Intention Day)
© 2018 CME Group. All rights reserved. 10
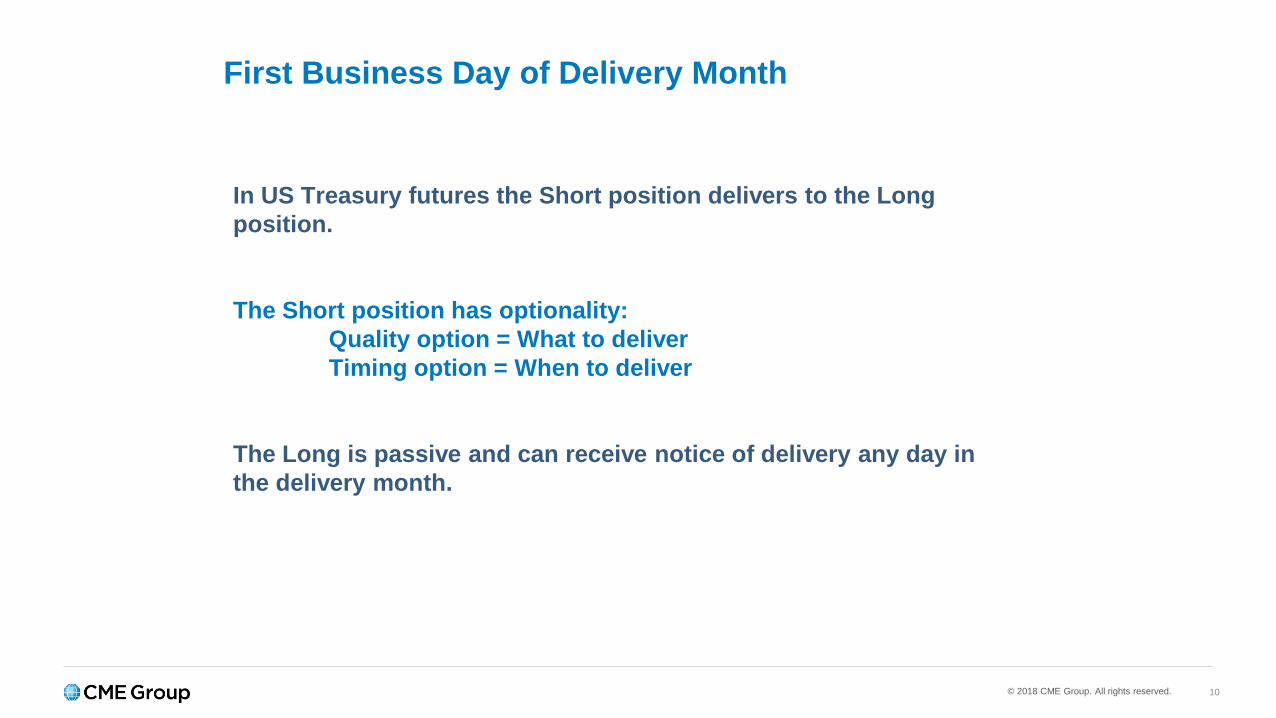
First Business Day of Delivery Month
In US Treasury futures the Short position delivers to the Long position.
The Short position has optionality:Quality option = What to deliverTiming option = When to deliver
The Long is passive and can receive notice of delivery any day in the delivery month.
© 2018 CME Group. All rights reserved. 11
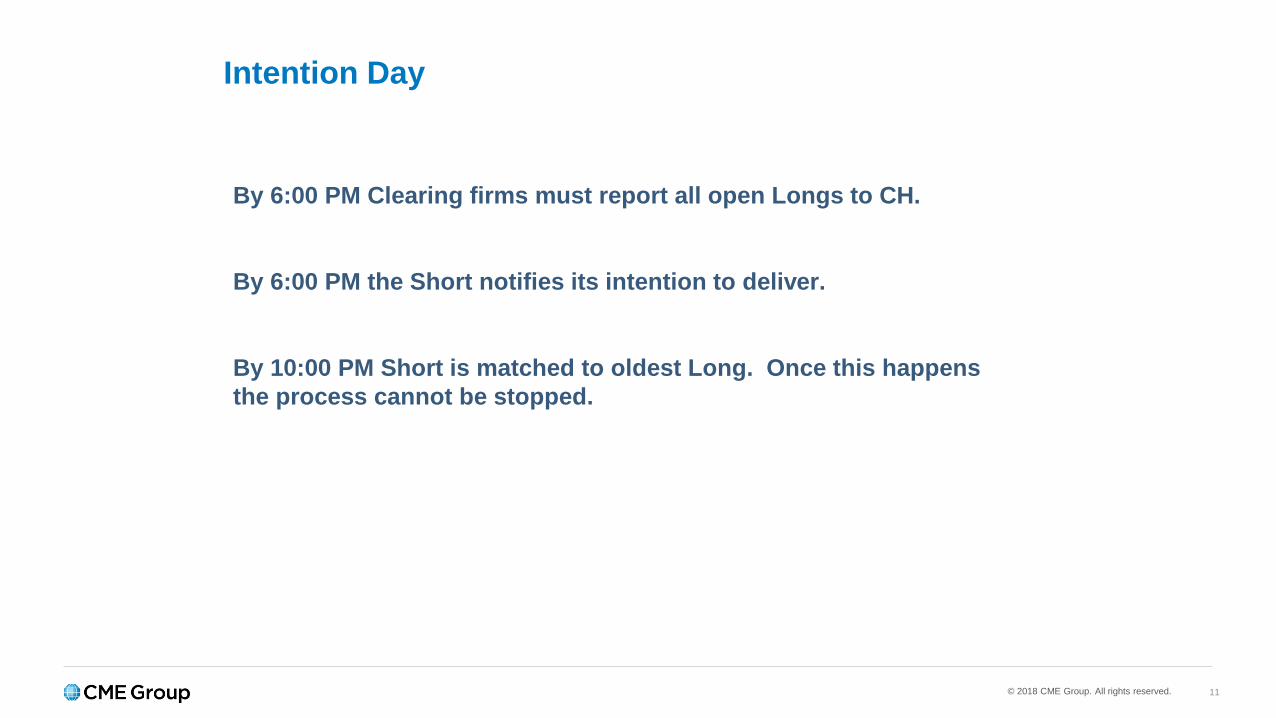
Intention Day
By 6:00 PM Clearing firms must report all open Longs to CH.
By 6:00 PM the Short notifies its intention to deliver.
By 10:00 PM Short is matched to oldest Long. Once this happens the process cannot be stopped.
© 2018 CME Group. All rights reserved. 12
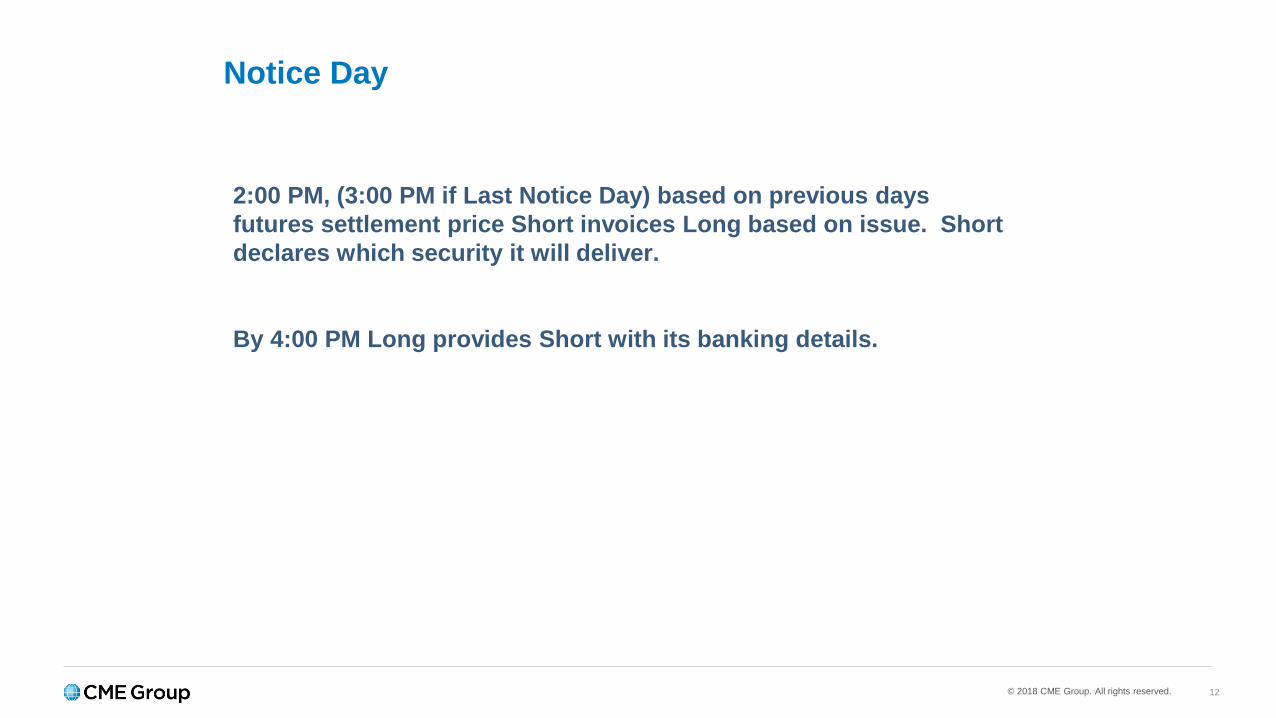
Notice Day
2:00 PM, (3:00 PM if Last Notice Day) based on previous days futures settlement price Short invoices Long based on issue. Short declares which security it will deliver.
By 4:00 PM Long provides Short with its banking details.
© 2018 CME Group. All rights reserved. 13
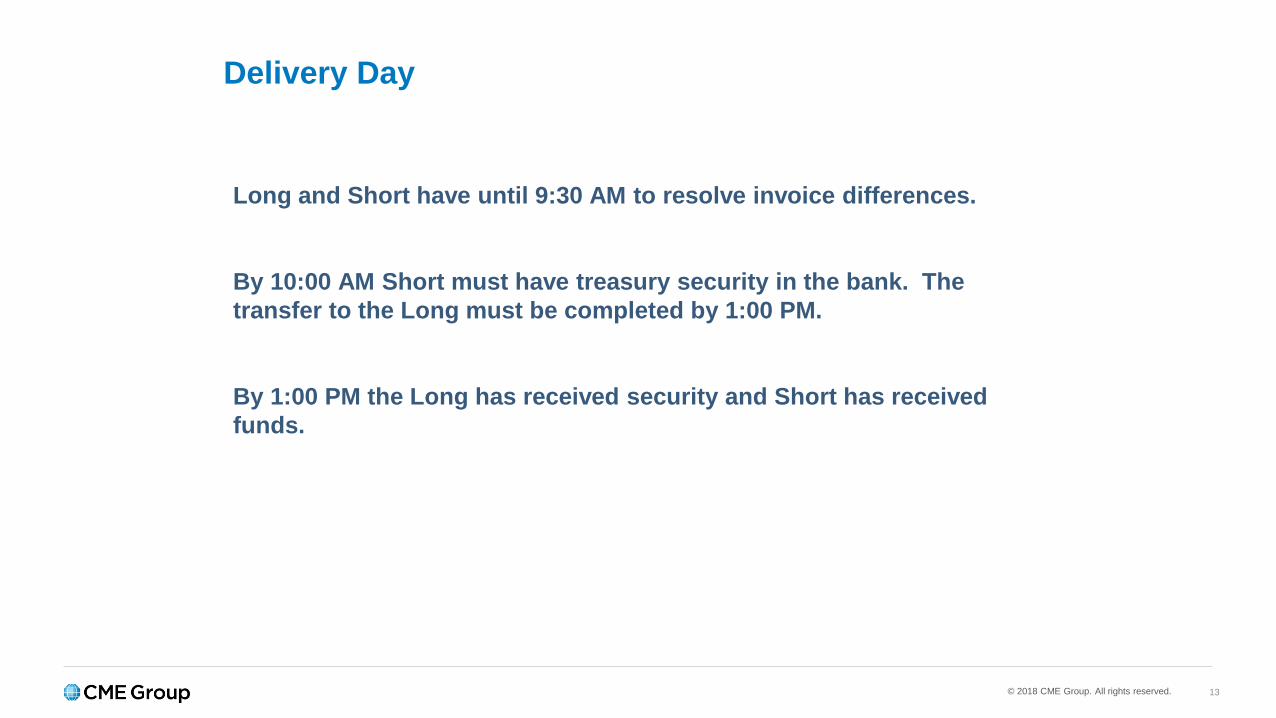
Delivery Day
Long and Short have until 9:30 AM to resolve invoice differences.
By 10:00 AM Short must have treasury security in the bank. The transfer to the Long must be completed by 1:00 PM.
By 1:00 PM the Long has received security and Short has received funds.
© 2018 CME Group. All rights reserved.
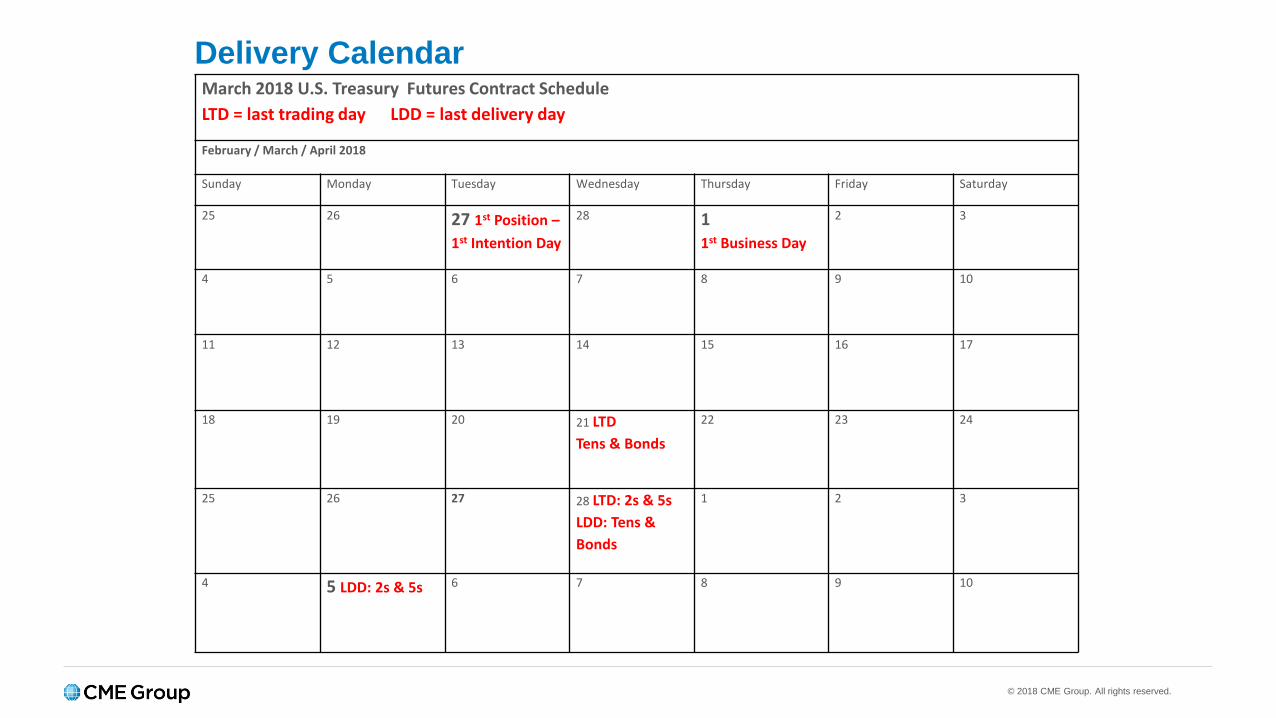
Delivery CalendarMarch 2018 U.S. Treasury Futures Contract ScheduleLTD = last trading day LDD = last delivery day
February / March / April 2018
Sunday Monday Tuesday Wednesday Thursday Friday Saturday
25 26 27 1st Position –1st Intention Day
28 11st Business Day
2 3
4 5 6 7 8 9 10
11 12 13 14 15 16 17
18 19 20 21 LTDTens & Bonds
22 23 24
25 26 27 28 LTD: 2s & 5s LDD: Tens & Bonds
1 2 3
4 5 LDD: 2s & 5s 6 7 8 9 10
© 2018 CME Group. All rights reserved.
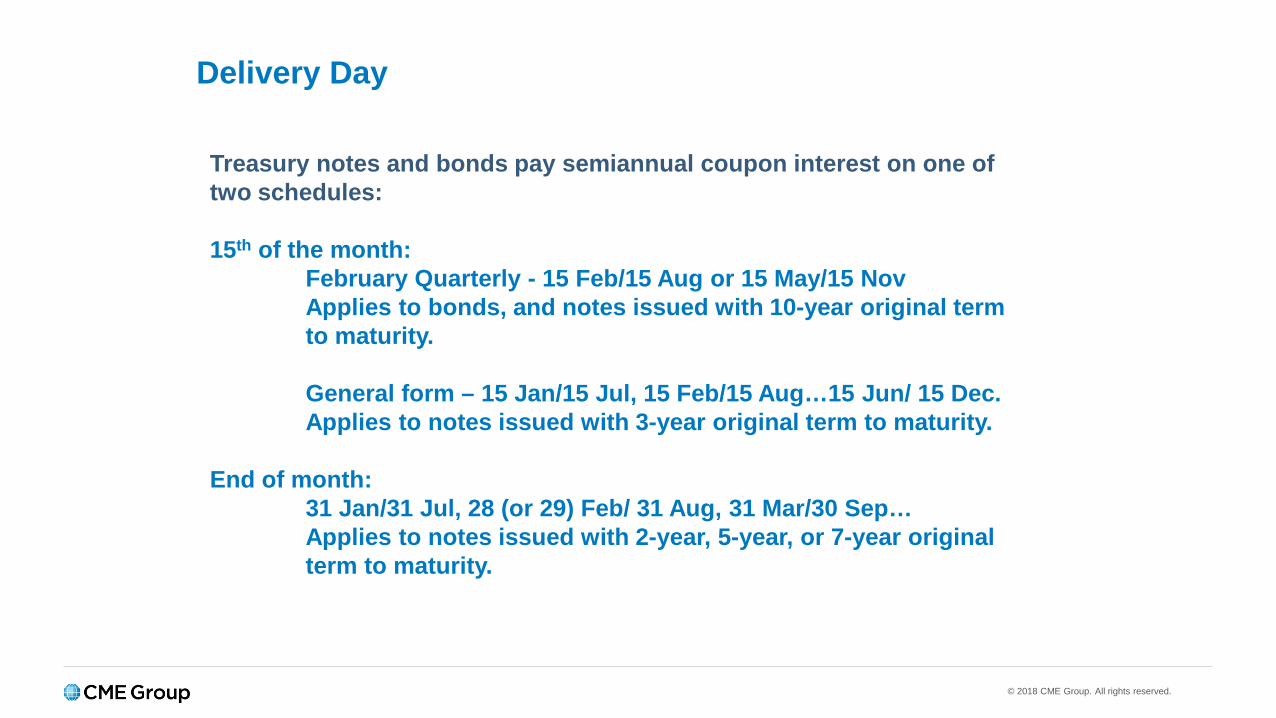
Delivery Day
Treasury notes and bonds pay semiannual coupon interest on one of two schedules:
15th of the month:February Quarterly - 15 Feb/15 Aug or 15 May/15 NovApplies to bonds, and notes issued with 10-year original term to maturity.
General form – 15 Jan/15 Jul, 15 Feb/15 Aug…15 Jun/ 15 Dec.Applies to notes issued with 3-year original term to maturity.
End of month:31 Jan/31 Jul, 28 (or 29) Feb/ 31 Aug, 31 Mar/30 Sep…Applies to notes issued with 2-year, 5-year, or 7-year original term to maturity.

© 2018 CME Group. All rights reserved. 16
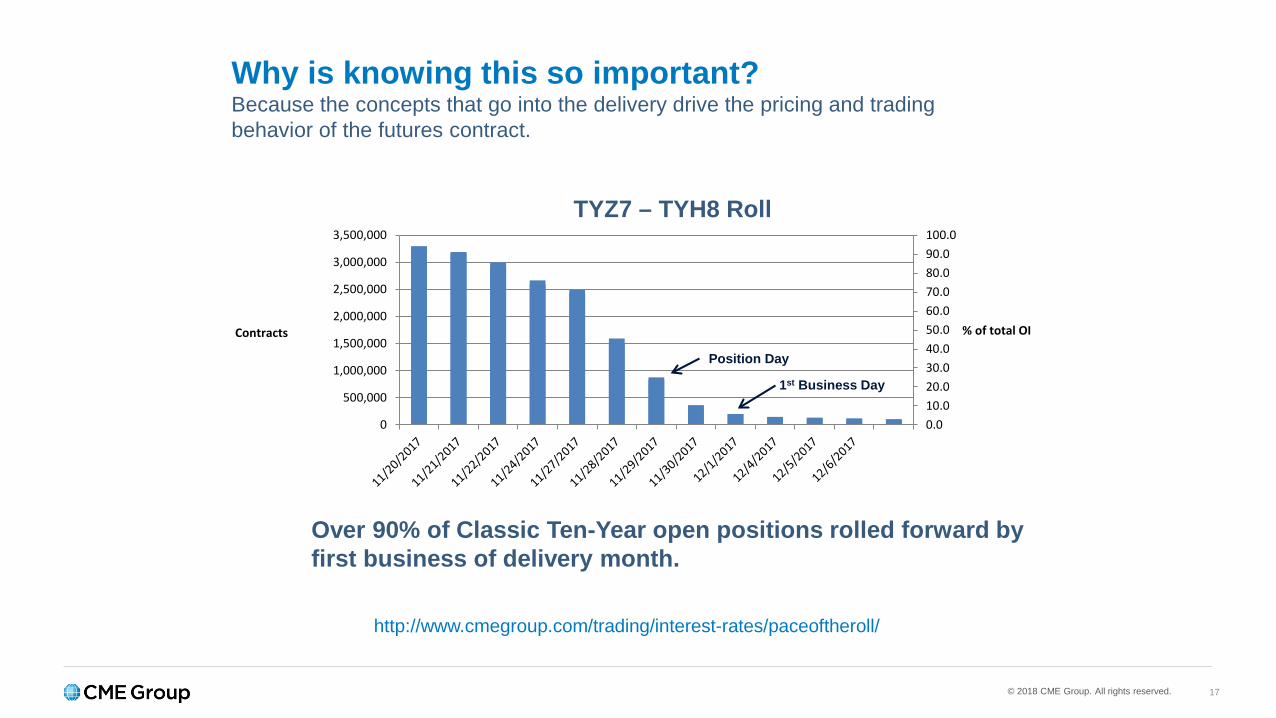
Why is knowing this so important?
Because the concepts that go into the delivery drive the pricing and trading behavior of the futures contract.
Coupon incomeCost of carryConversion Factor (CF)Basis & Net BasisCheapest-to-deliver (CTD)
© 2018 CME Group. All rights reserved.
0.010.020.030.040.050.060.070.080.090.0100.0
0
500,000
1,000,000
1,500,000
2,000,000
2,500,000
3,000,000
3,500,000
% of total OIContracts
17
Why is knowing this so important?Because the concepts that go into the delivery drive the pricing and trading behavior of the futures contract.
TYZ7 – TYH8 Roll
Over 90% of Classic Ten-Year open positions rolled forward by first business of delivery month.
http://www.cmegroup.com/trading/interest-rates/paceoftheroll/
Position Day
1st Business Day
© 2018 CME Group. All rights reserved. 18
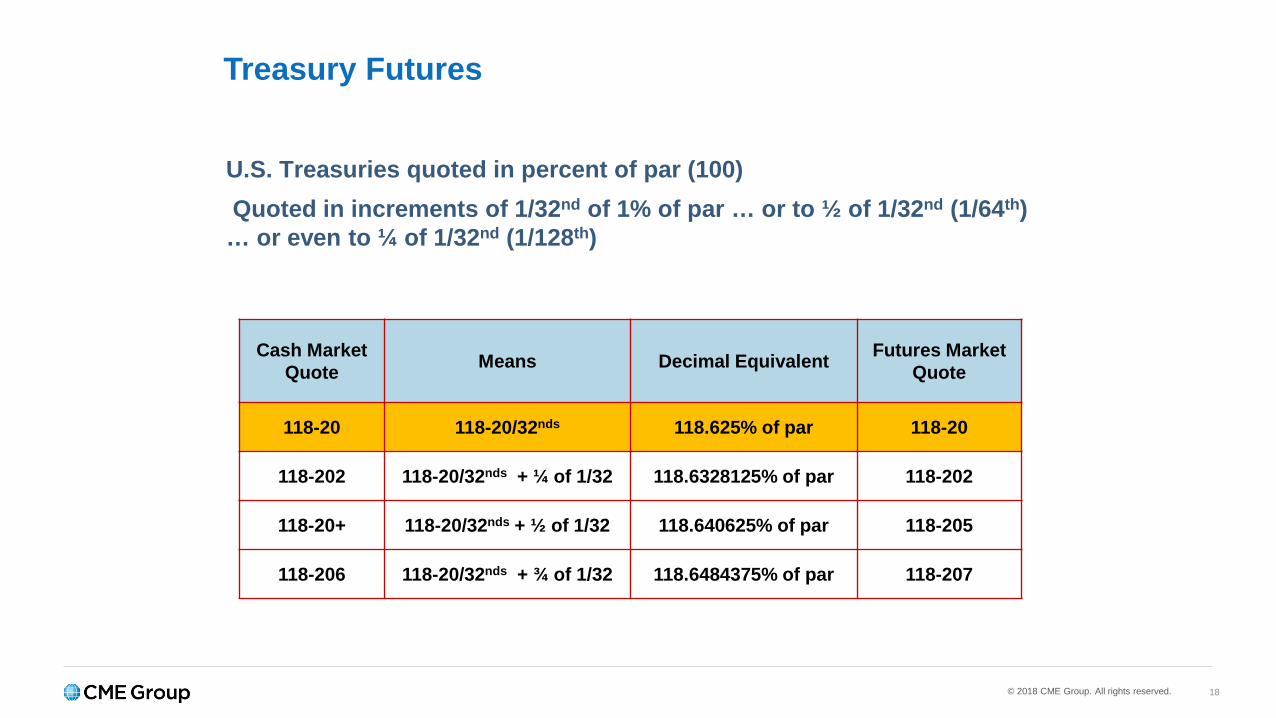
U.S. Treasuries quoted in percent of par (100)Quoted in increments of 1/32nd of 1% of par … or to ½ of 1/32nd (1/64th)
… or even to ¼ of 1/32nd (1/128th)
Treasury Futures
Cash Market Quote Means Decimal Equivalent Futures Market
Quote
118-20 118-20/32nds 118.625% of par 118-20
118-202 118-20/32nds + ¼ of 1/32 118.6328125% of par 118-202
118-20+ 118-20/32nds + ½ of 1/32 118.640625% of par 118-205
118-206 118-20/32nds + ¾ of 1/32 118.6484375% of par 118-207
© 2018 CME Group. All rights reserved. 19
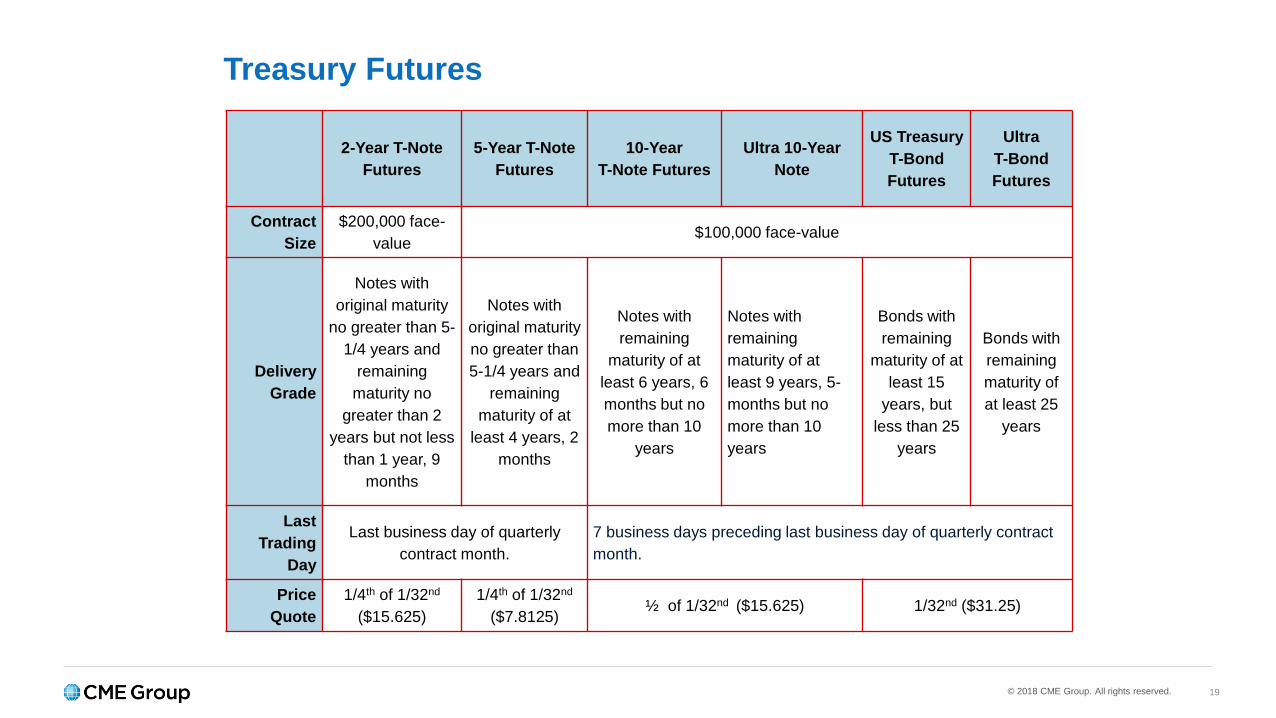
Treasury Futures
2-Year T-Note Futures
5-Year T-Note Futures
10-Year T-Note Futures
Ultra 10-Year Note
US Treasury T-Bond Futures
Ultra T-Bond Futures
Contract Size
$200,000 face-value
$100,000 face-value
Delivery Grade
Notes with original maturity
no greater than 5-1/4 years and
remaining maturity no
greater than 2 years but not less
than 1 year, 9 months
Notes with original maturity no greater than 5-1/4 years and
remaining maturity of at
least 4 years, 2 months
Notes with remaining
maturity of at least 6 years, 6 months but no more than 10
years
Notes with remaining maturity of at least 9 years, 5-months but no more than 10 years
Bonds with remaining
maturity of at least 15
years, but less than 25
years
Bonds with remaining maturity of at least 25
years
Last Trading
Day
Last business day of quarterly contract month.
7 business days preceding last business day of quarterly contract month.
Price Quote
1/4th of 1/32nd
($15.625)1/4th of 1/32nd
($7.8125)½ of 1/32nd ($15.625) 1/32nd ($31.25)
© 2018 CME Group. All rights reserved. 20
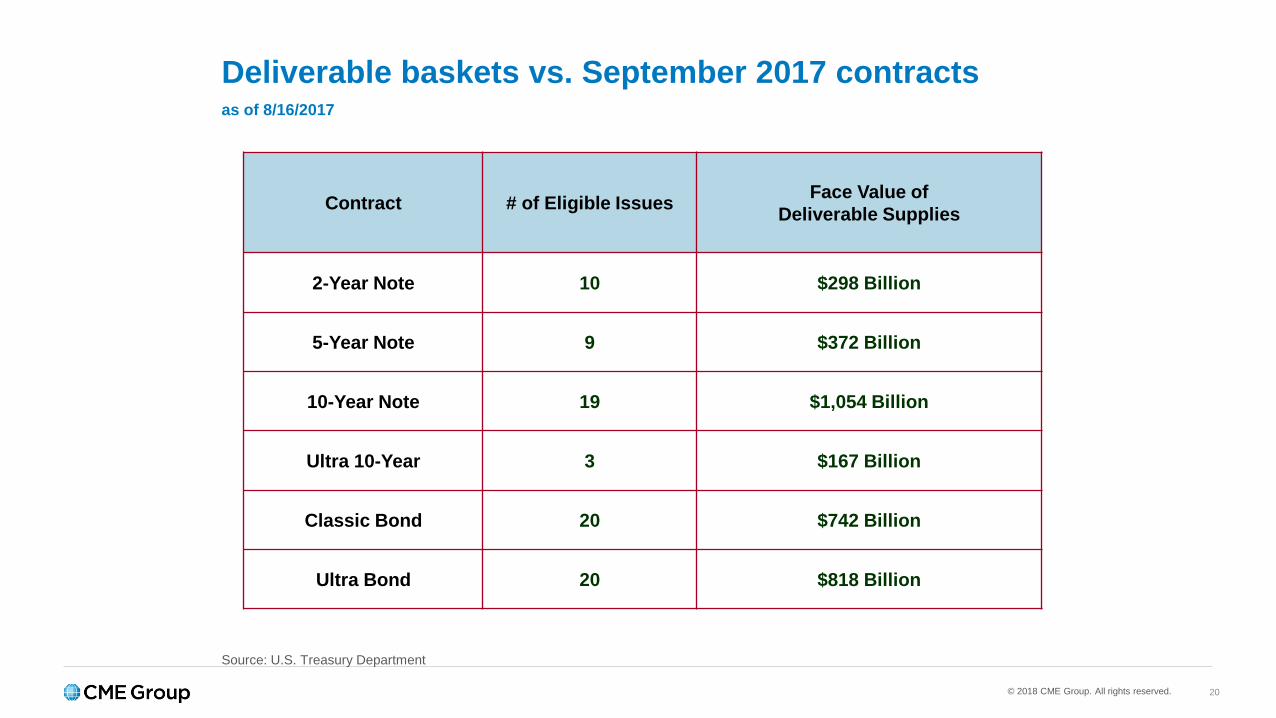
Deliverable baskets vs. September 2017 contractsas of 8/16/2017
Contract # of Eligible Issues Face Value of Deliverable Supplies
2-Year Note 10 $298 Billion
5-Year Note 9 $372 Billion
10-Year Note 19 $1,054 Billion
Ultra 10-Year 3 $167 Billion
Classic Bond 20 $742 Billion
Ultra Bond 20 $818 Billion
Source: U.S. Treasury Department
© 2018 CME Group. All rights reserved. 21
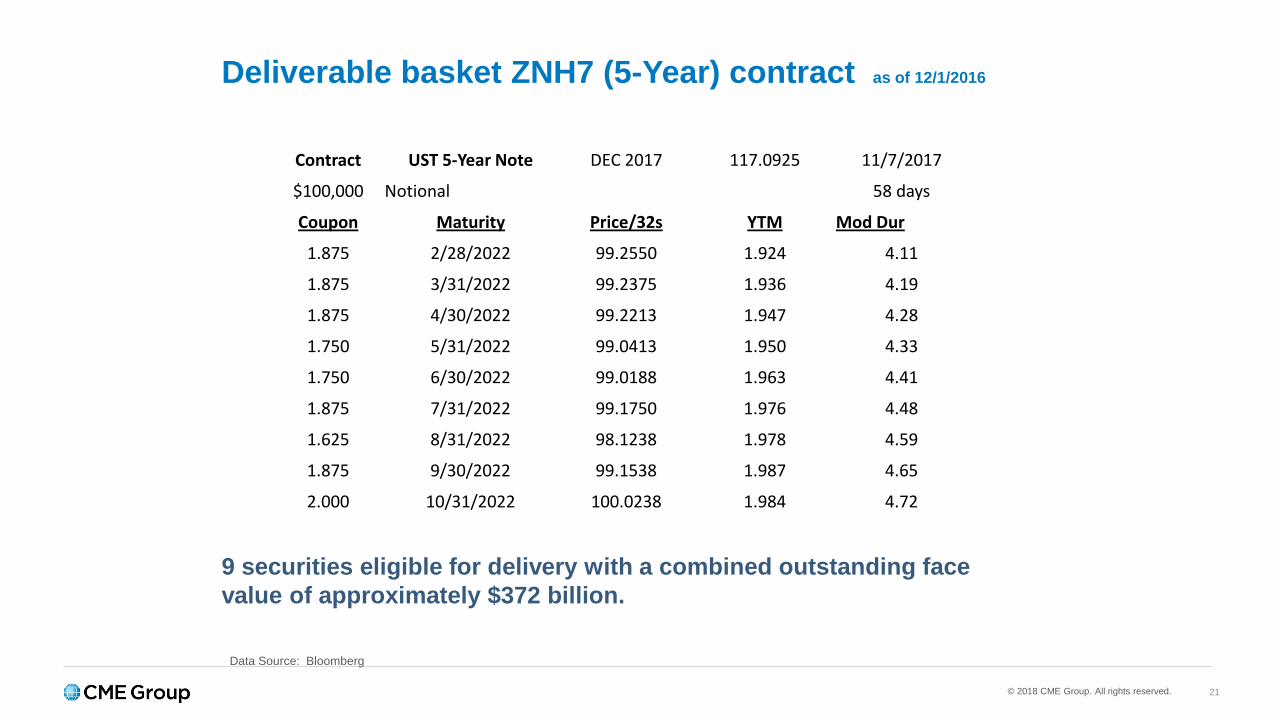
Deliverable basket ZNH7 (5-Year) contract as of 12/1/2016
9 securities eligible for delivery with a combined outstanding face value of approximately $372 billion.
Data Source: Bloomberg
Contract UST 5-Year Note DEC 2017 117.0925 11/7/2017
$100,000 Notional 58 days
Coupon Maturity Price/32s YTM Mod Dur
1.875 2/28/2022 99.2550 1.924 4.11
1.875 3/31/2022 99.2375 1.936 4.19
1.875 4/30/2022 99.2213 1.947 4.28
1.750 5/31/2022 99.0413 1.950 4.33
1.750 6/30/2022 99.0188 1.963 4.41
1.875 7/31/2022 99.1750 1.976 4.48
1.625 8/31/2022 98.1238 1.978 4.59
1.875 9/30/2022 99.1538 1.987 4.65
2.000 10/31/2022 100.0238 1.984 4.72

© 2018 CME Group. All rights reserved. 22
© 2018 CME Group. All rights reserved. 23
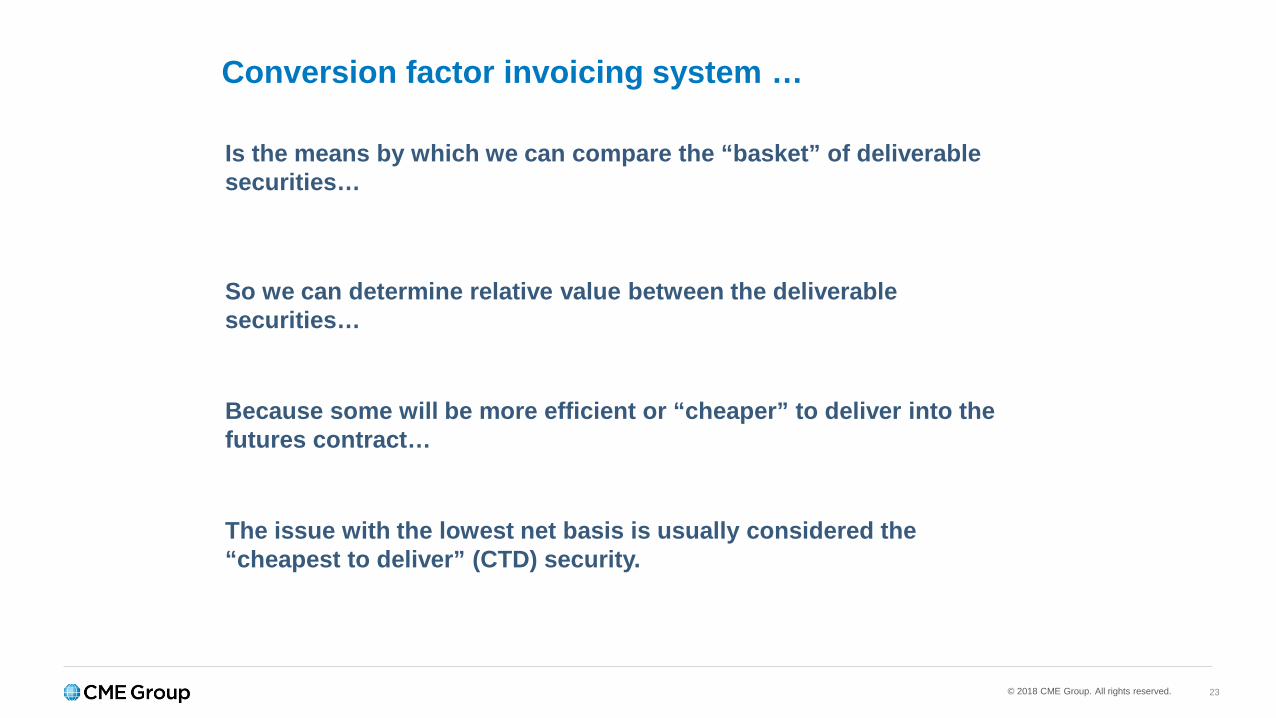
Conversion factor invoicing system …
Is the means by which we can compare the “basket” of deliverable securities…
So we can determine relative value between the deliverable securities…
Because some will be more efficient or “cheaper” to deliver into the futures contract…
The issue with the lowest net basis is usually considered the “cheapest to deliver” (CTD) security.
© 2018 CME Group. All rights reserved. 24
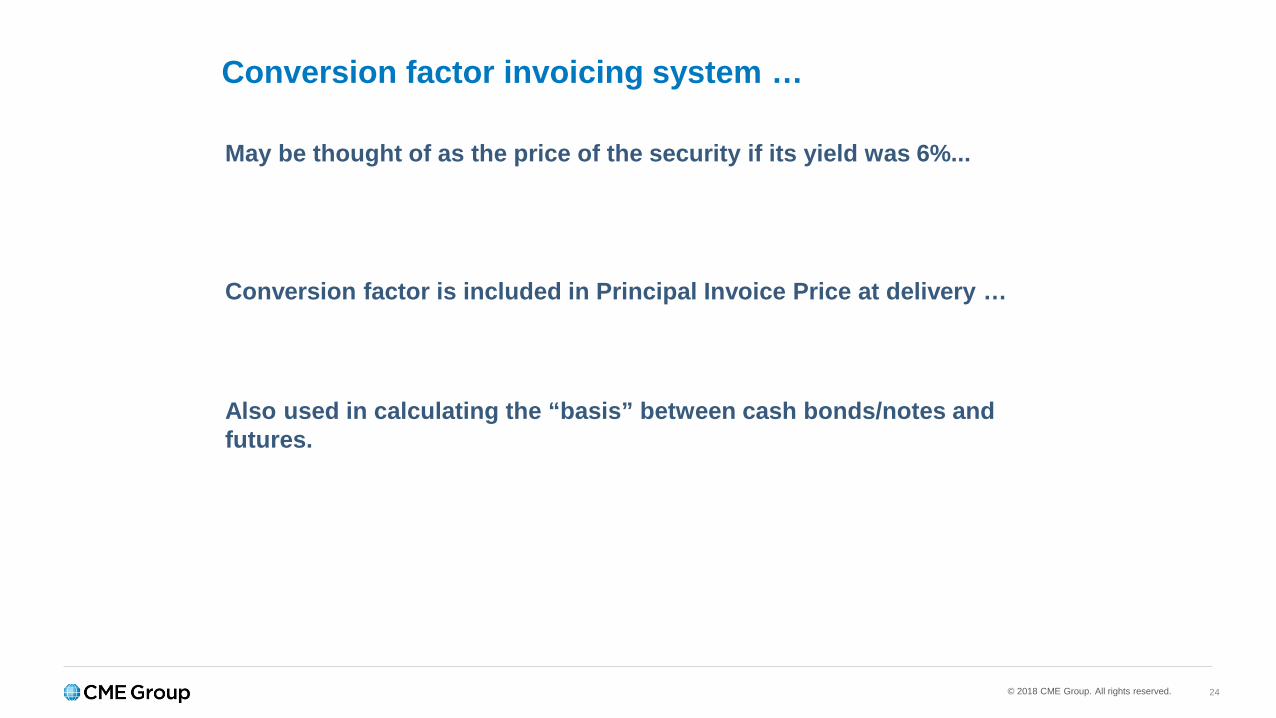
Conversion factor invoicing system …
May be thought of as the price of the security if its yield was 6%...
Conversion factor is included in Principal Invoice Price at delivery …
Also used in calculating the “basis” between cash bonds/notes and futures.
© 2018 CME Group. All rights reserved. 25
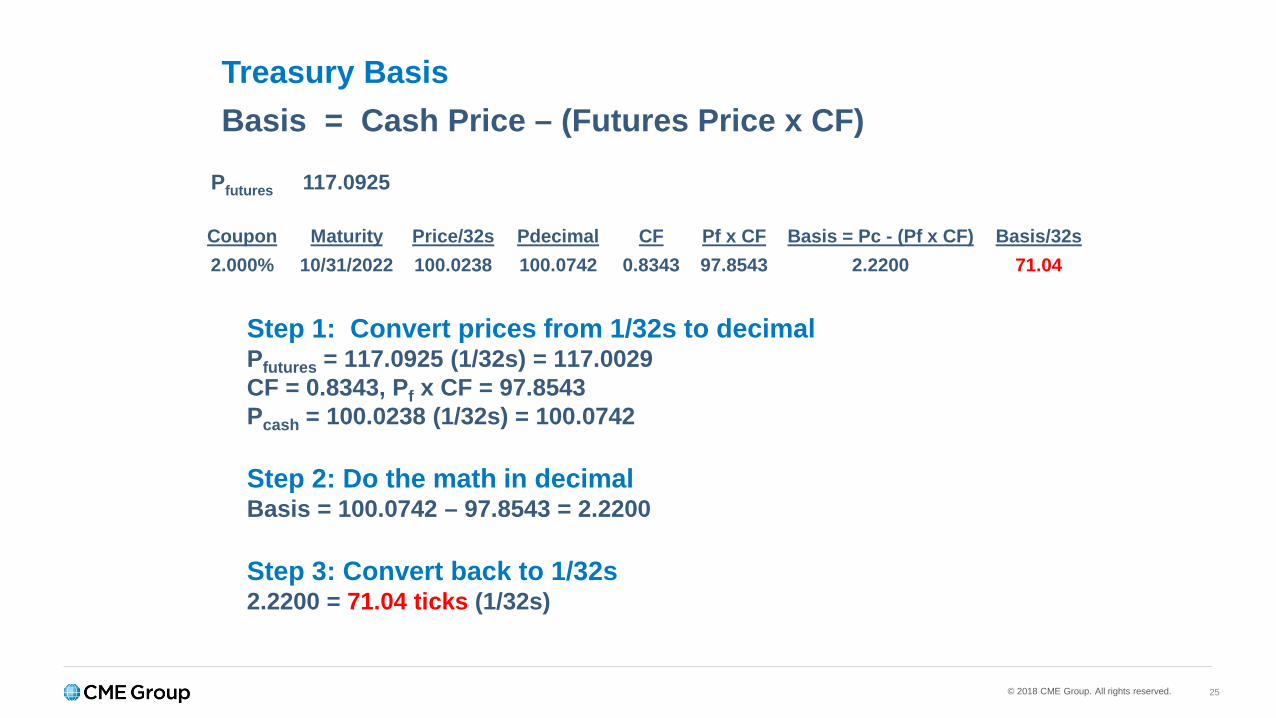
Treasury BasisBasis = Cash Price – (Futures Price x CF)
Pfutures 117.0925
Coupon Maturity Price/32s Pdecimal CF Pf x CF Basis = Pc - (Pf x CF) Basis/32s2.000% 10/31/2022 100.0238 100.0742 0.8343 97.8543 2.2200 71.04
Step 1: Convert prices from 1/32s to decimalPfutures = 117.0925 (1/32s) = 117.0029CF = 0.8343, Pf x CF = 97.8543Pcash = 100.0238 (1/32s) = 100.0742
Step 2: Do the math in decimalBasis = 100.0742 – 97.8543 = 2.2200
Step 3: Convert back to 1/32s2.2200 = 71.04 ticks (1/32s)
© 2018 CME Group. All rights reserved. 26
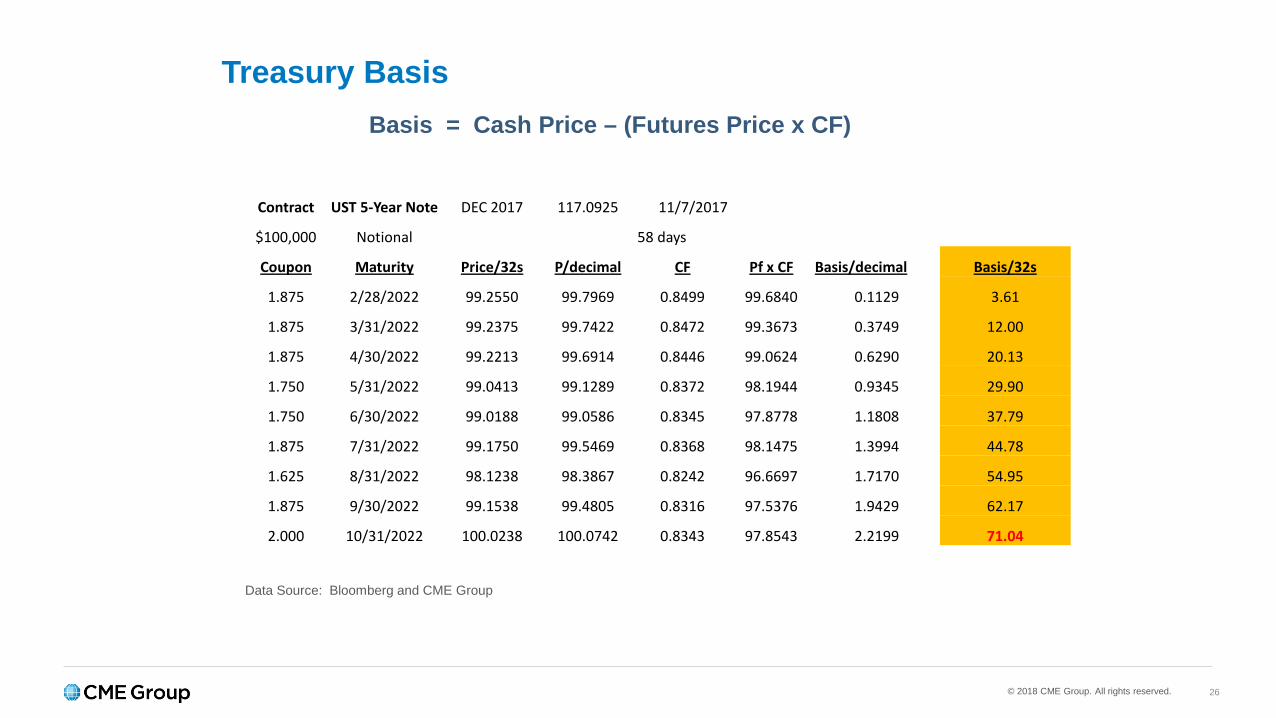
Treasury BasisBasis = Cash Price – (Futures Price x CF)
Data Source: Bloomberg and CME Group
Contract UST 5-Year Note DEC 2017 117.0925 11/7/2017
$100,000 Notional 58 days
Coupon Maturity Price/32s P/decimal CF Pf x CF Basis/decimal Basis/32s
1.875 2/28/2022 99.2550 99.7969 0.8499 99.6840 0.1129 3.61
1.875 3/31/2022 99.2375 99.7422 0.8472 99.3673 0.3749 12.00
1.875 4/30/2022 99.2213 99.6914 0.8446 99.0624 0.6290 20.13
1.750 5/31/2022 99.0413 99.1289 0.8372 98.1944 0.9345 29.90
1.750 6/30/2022 99.0188 99.0586 0.8345 97.8778 1.1808 37.79
1.875 7/31/2022 99.1750 99.5469 0.8368 98.1475 1.3994 44.78
1.625 8/31/2022 98.1238 98.3867 0.8242 96.6697 1.7170 54.95
1.875 9/30/2022 99.1538 99.4805 0.8316 97.5376 1.9429 62.17
2.000 10/31/2022 100.0238 100.0742 0.8343 97.8543 2.2199 71.04
© 2018 CME Group. All rights reserved. 27
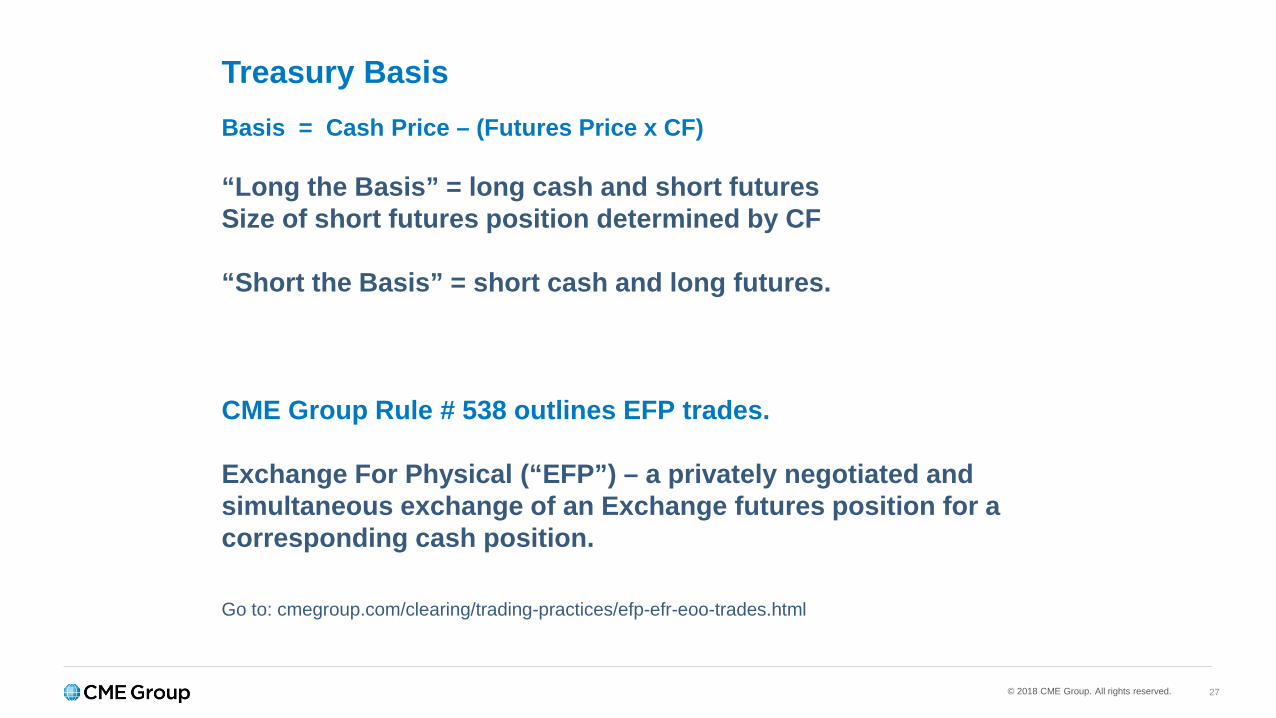
Treasury BasisBasis = Cash Price – (Futures Price x CF)
“Long the Basis” = long cash and short futuresSize of short futures position determined by CF
“Short the Basis” = short cash and long futures.
CME Group Rule # 538 outlines EFP trades.
Exchange For Physical (“EFP”) – a privately negotiated and simultaneous exchange of an Exchange futures position for a corresponding cash position.
Go to: cmegroup.com/clearing/trading-practices/efp-efr-eoo-trades.html
© 2018 CME Group. All rights reserved. 28
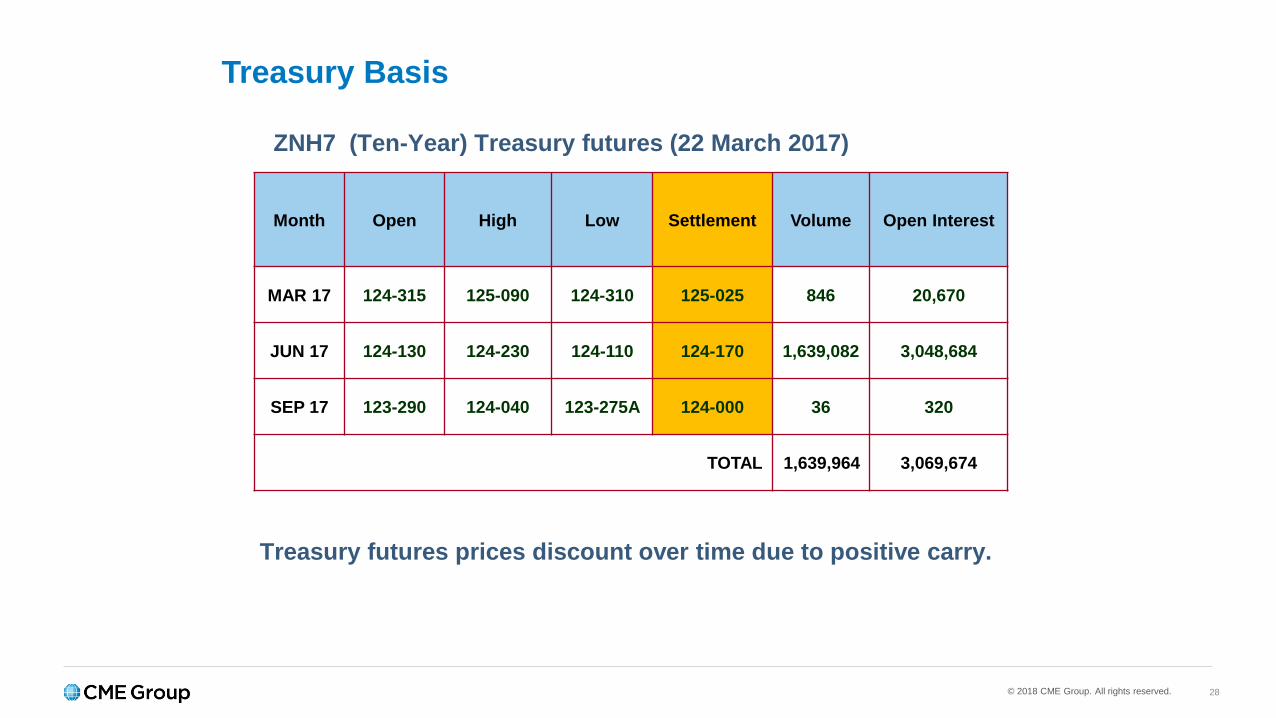
Treasury Basis
Month Open High Low Settlement Volume Open Interest
MAR 17 124-315 125-090 124-310 125-025 846 20,670
JUN 17 124-130 124-230 124-110 124-170 1,639,082 3,048,684
SEP 17 123-290 124-040 123-275A 124-000 36 320
TOTAL 1,639,964 3,069,674
ZNH7 (Ten-Year) Treasury futures (22 March 2017)
Treasury futures prices discount over time due to positive carry.
© 2018 CME Group. All rights reserved. 29
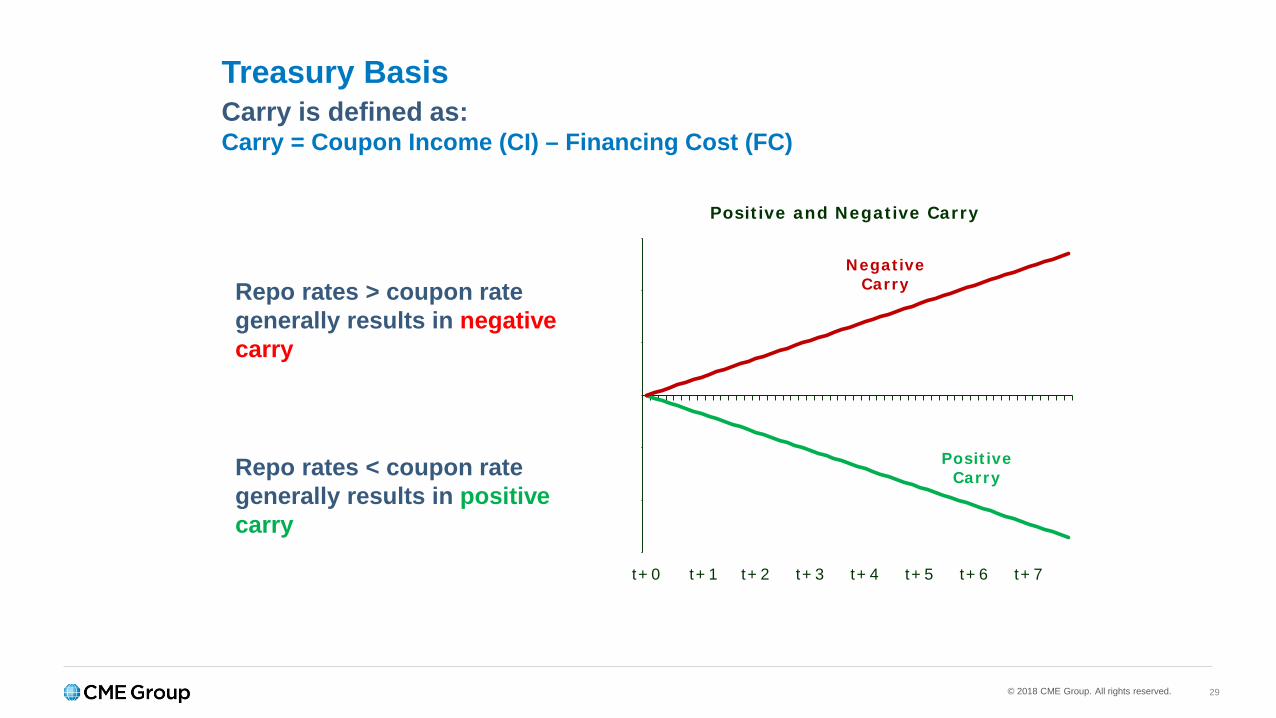
Treasury Basis
-60
-40
-20
0
20
40
60
t+0 t+1 t+2 t+3 t+4 t+5 t+6 t+7
Positive and Negative Carry
Positive Carry
Negative Carry
Carry is defined as:Carry = Coupon Income (CI) – Financing Cost (FC)
Repo rates > coupon rate generally results in negative carry
Repo rates < coupon rate generally results in positive carry
© 2018 CME Group. All rights reserved. 30
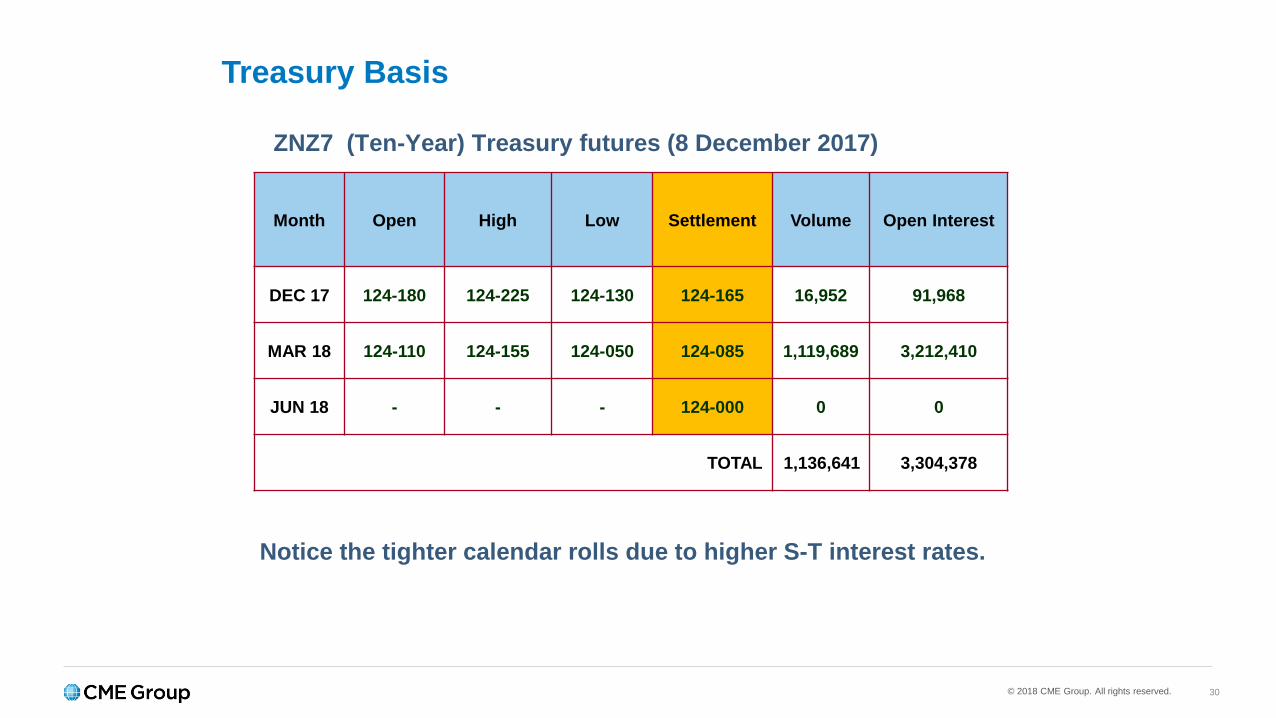
Treasury Basis
Month Open High Low Settlement Volume Open Interest
DEC 17 124-180 124-225 124-130 124-165 16,952 91,968
MAR 18 124-110 124-155 124-050 124-085 1,119,689 3,212,410
JUN 18 - - - 124-000 0 0
TOTAL 1,136,641 3,304,378
ZNZ7 (Ten-Year) Treasury futures (8 December 2017)
Notice the tighter calendar rolls due to higher S-T interest rates.
© 2018 CME Group. All rights reserved. 31
Repo Market
$2.3 trillion daily turnover.
Provides funding for dealer operations.
Provides short-term investment s for excess cash.
Approximately 50% of all Repos are overnight.
Approximately 40% are US Treasuries.
Source: SIFMA Repo Market Fact Sheet 2015
© 2018 CME Group. All rights reserved. 32
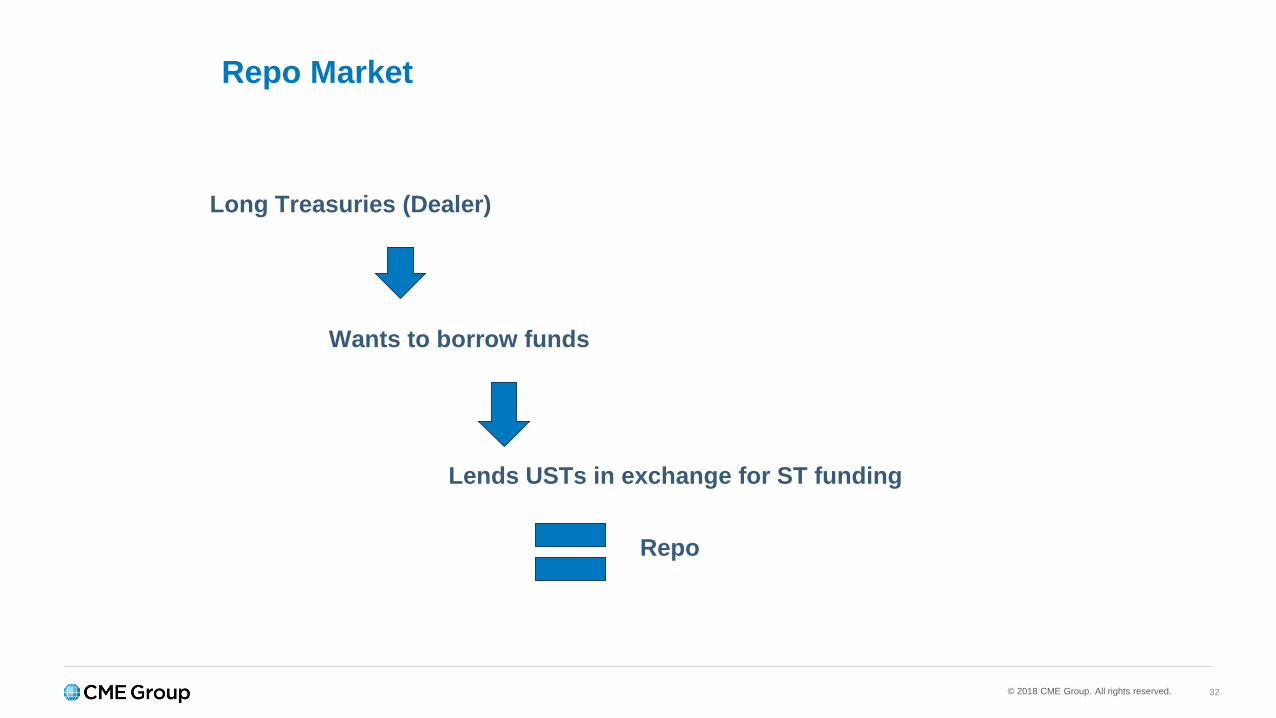
Repo Market
Long Treasuries (Dealer)
Wants to borrow funds
Lends USTs in exchange for ST funding
Repo

© 2018 CME Group. All rights reserved. 33
Repo Market
Short Treasuries (Dealer)
Wants to borrow bonds
Reverse Repo
Lends money ST in exchange for securities
© 2018 CME Group. All rights reserved. 34
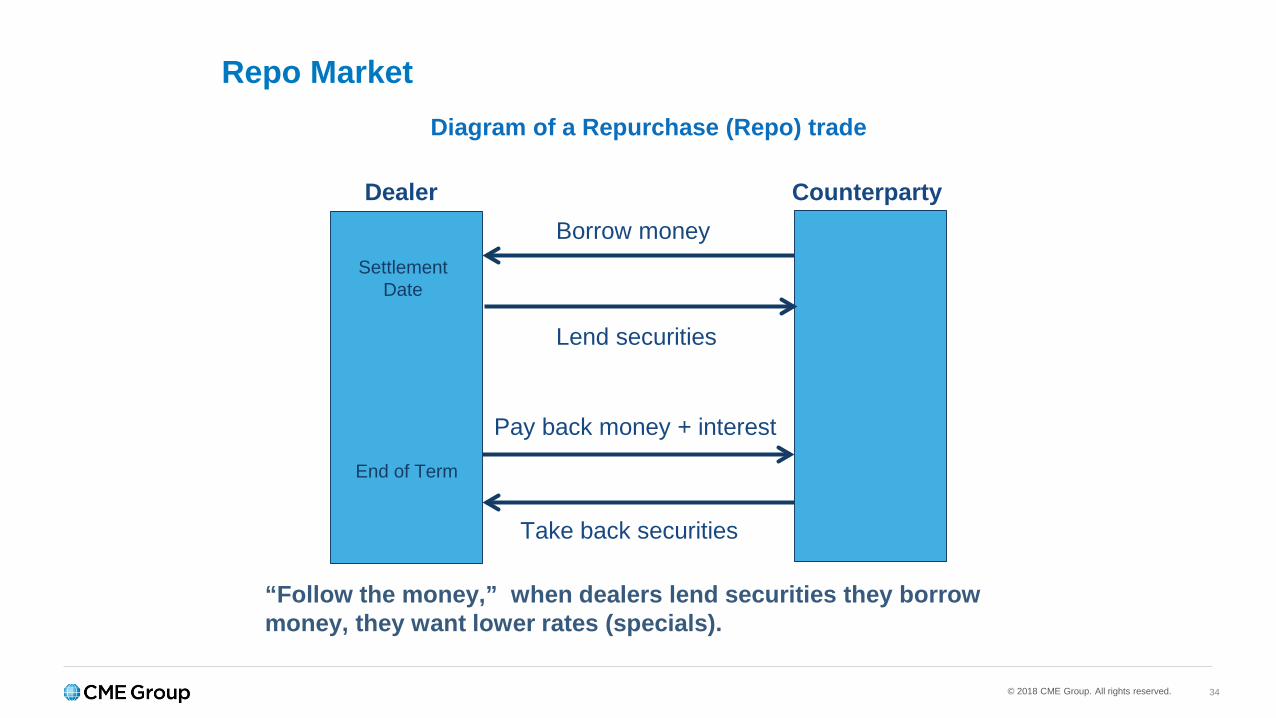
Repo Market
Dealer
SettlementDate
End of Term
CounterpartyBorrow money
Lend securities
Pay back money + interest
Take back securities
“Follow the money,” when dealers lend securities they borrow money, they want lower rates (specials).
Diagram of a Repurchase (Repo) trade
© 2018 CME Group. All rights reserved. 35
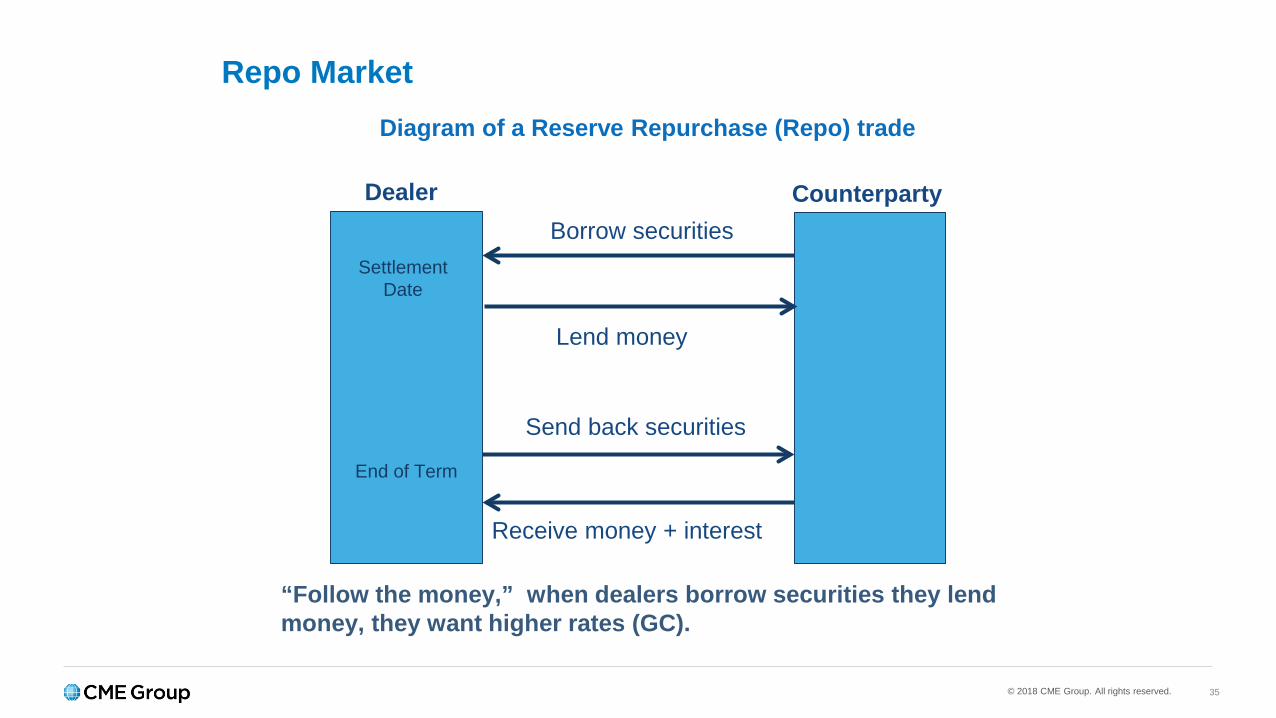
Repo Market
Dealer
SettlementDate
End of Term
CounterpartyBorrow securities
Lend money
Send back securities
Receive money + interest
“Follow the money,” when dealers borrow securities they lend money, they want higher rates (GC).
Diagram of a Reserve Repurchase (Repo) trade
© 2018 CME Group. All rights reserved. 36
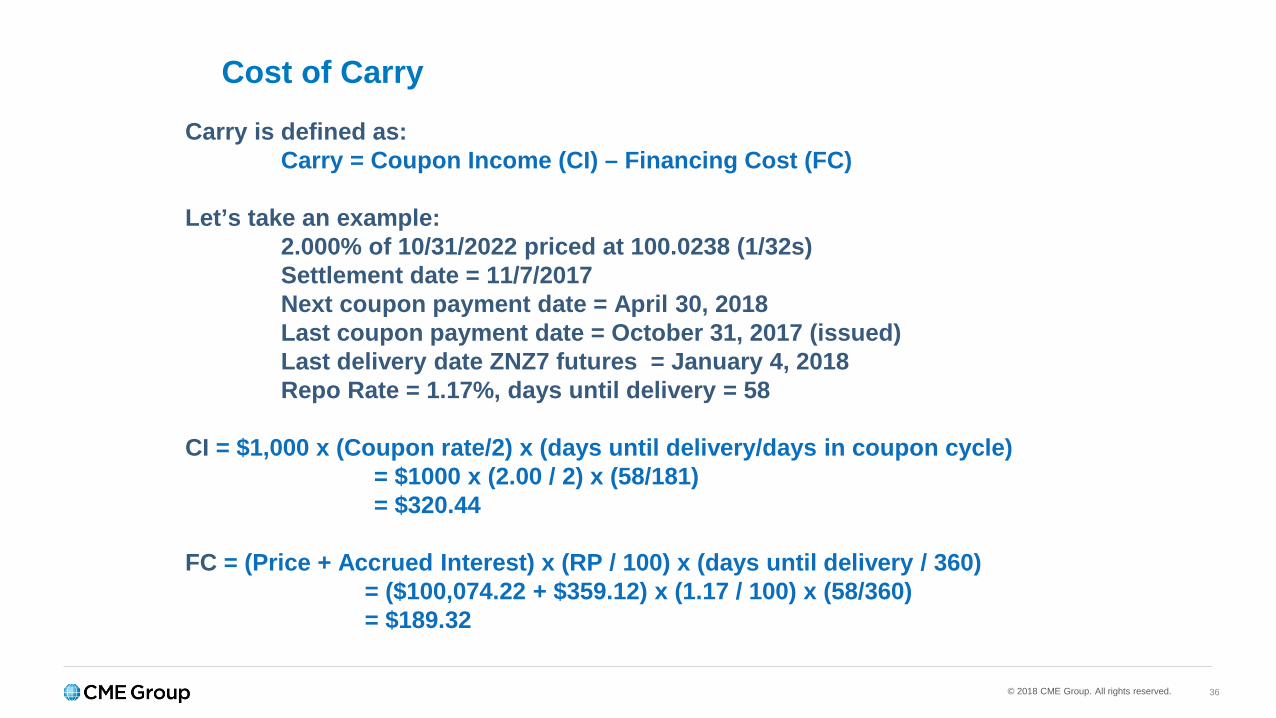
Cost of Carry
Carry is defined as:Carry = Coupon Income (CI) – Financing Cost (FC)
Let’s take an example: 2.000% of 10/31/2022 priced at 100.0238 (1/32s)Settlement date = 11/7/2017Next coupon payment date = April 30, 2018Last coupon payment date = October 31, 2017 (issued)Last delivery date ZNZ7 futures = January 4, 2018 Repo Rate = 1.17%, days until delivery = 58
CI = $1,000 x (Coupon rate/2) x (days until delivery/days in coupon cycle)= $1000 x (2.00 / 2) x (58/181)= $320.44
FC = (Price + Accrued Interest) x (RP / 100) x (days until delivery / 360)= ($100,074.22 + $359.12) x (1.17 / 100) x (58/360)= $189.32
© 2018 CME Group. All rights reserved. 37
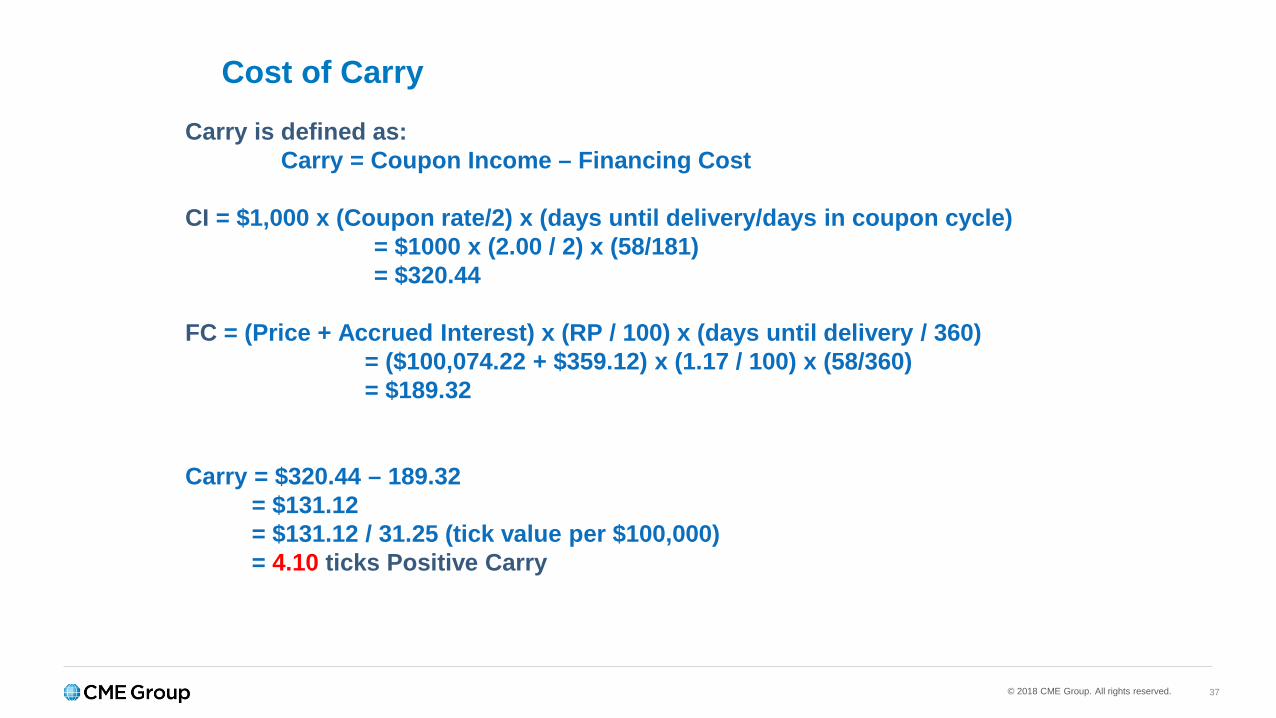
Cost of Carry
Carry is defined as:Carry = Coupon Income – Financing Cost
CI = $1,000 x (Coupon rate/2) x (days until delivery/days in coupon cycle)= $1000 x (2.00 / 2) x (58/181)= $320.44
FC = (Price + Accrued Interest) x (RP / 100) x (days until delivery / 360)= ($100,074.22 + $359.12) x (1.17 / 100) x (58/360)= $189.32
Carry = $320.44 – 189.32= $131.12= $131.12 / 31.25 (tick value per $100,000)= 4.10 ticks Positive Carry
© 2018 CME Group. All rights reserved. 38
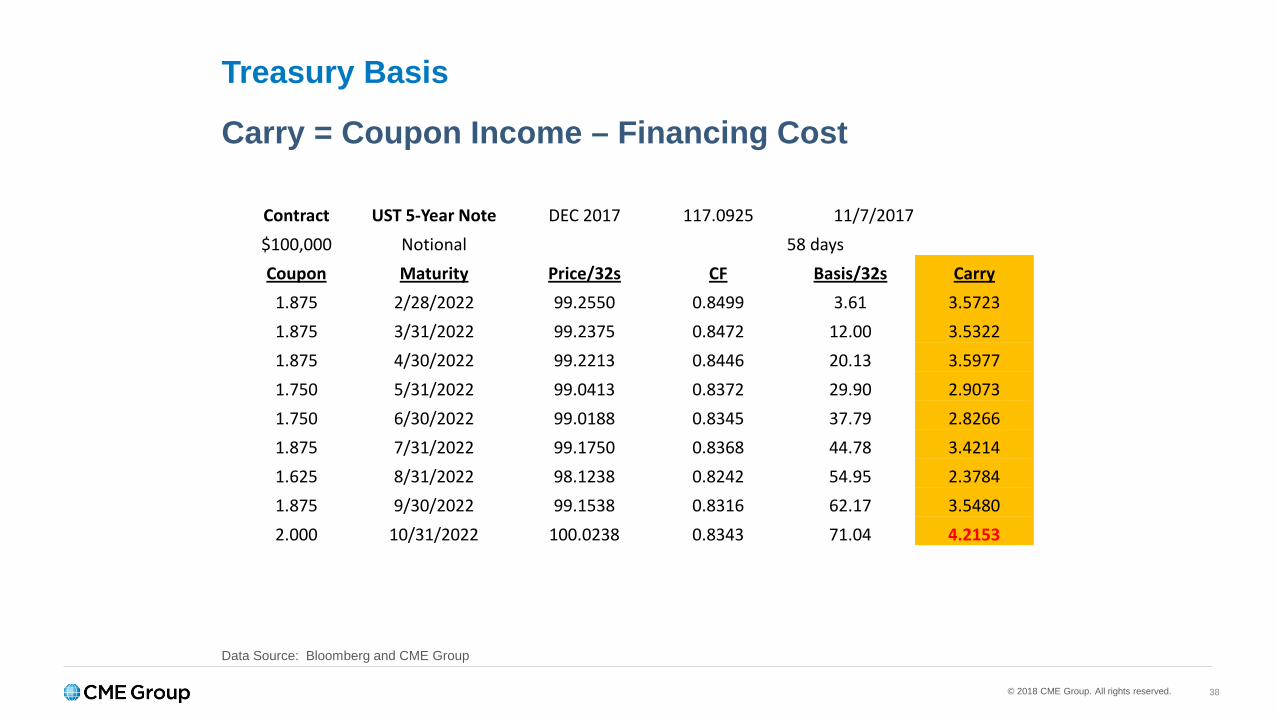
Treasury Basis
Carry = Coupon Income – Financing Cost
Data Source: Bloomberg and CME Group
Contract UST 5-Year Note DEC 2017 117.0925 11/7/2017$100,000 Notional 58 daysCoupon Maturity Price/32s CF Basis/32s Carry
1.875 2/28/2022 99.2550 0.8499 3.61 3.57231.875 3/31/2022 99.2375 0.8472 12.00 3.53221.875 4/30/2022 99.2213 0.8446 20.13 3.59771.750 5/31/2022 99.0413 0.8372 29.90 2.90731.750 6/30/2022 99.0188 0.8345 37.79 2.82661.875 7/31/2022 99.1750 0.8368 44.78 3.42141.625 8/31/2022 98.1238 0.8242 54.95 2.37841.875 9/30/2022 99.1538 0.8316 62.17 3.54802.000 10/31/2022 100.0238 0.8343 71.04 4.2153

© 2018 CME Group. All rights reserved. 39
Treasury BasisNet Basis = Basis - Carry
The security with the lowest net basis in generally considered the CTD security.
Data Source: Bloomberg and CME Group
Contract UST 5-Year Note DEC 2017 117.0925 11/7/2017
$100,000 Notional 58 days
Coupon Maturity Price/32s CF Basis/32s Carry Net Basis
1.875 2/28/2022 99.2550 0.8499 3.61 3.57 0.04
1.875 3/31/2022 99.2375 0.8472 12.00 3.53 8.46
1.875 4/30/2022 99.2213 0.8446 20.13 3.60 16.53
1.750 5/31/2022 99.0413 0.8372 29.90 2.91 27.00
1.750 6/30/2022 99.0188 0.8345 37.79 2.83 34.96
1.875 7/31/2022 99.1750 0.8368 44.78 3.42 41.36
1.625 8/31/2022 98.1238 0.8242 54.95 2.38 52.57
1.875 9/30/2022 99.1538 0.8316 62.17 3.55 58.62
2.000 10/31/2022 100.0238 0.8343 71.04 4.22 66.82
© 2018 CME Group. All rights reserved. 40
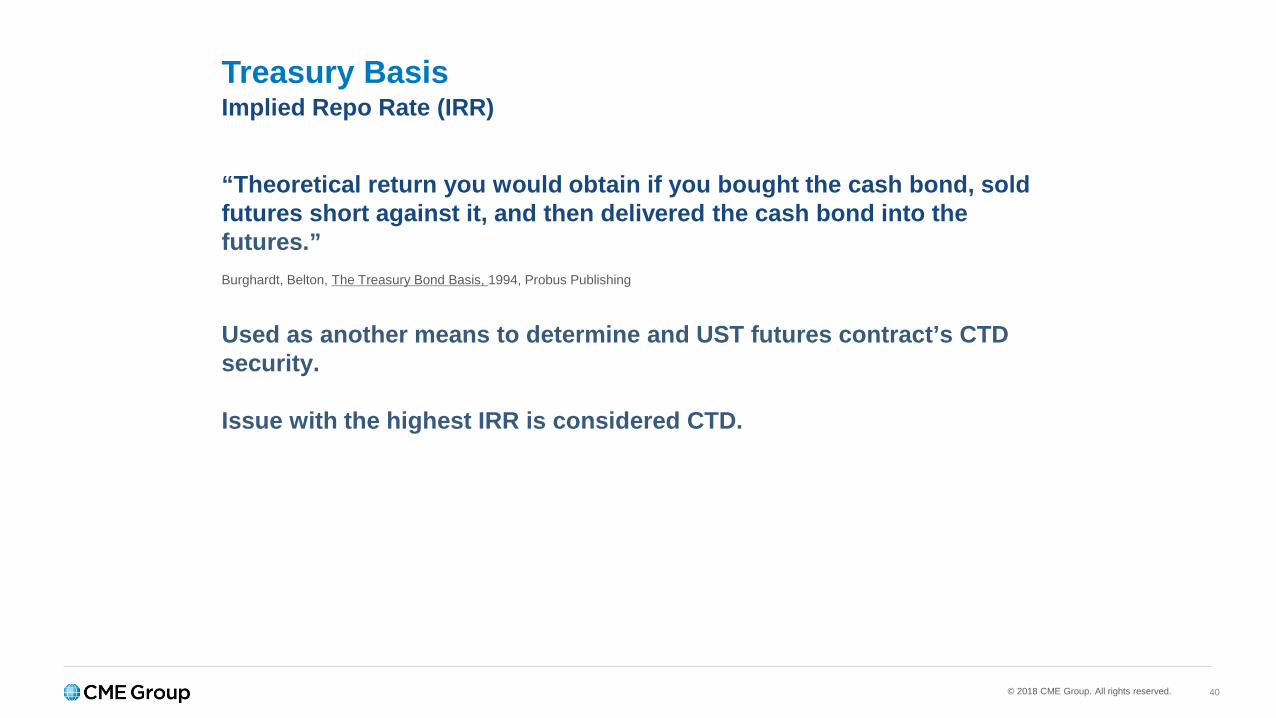
Treasury BasisImplied Repo Rate (IRR)
“Theoretical return you would obtain if you bought the cash bond, sold futures short against it, and then delivered the cash bond into the futures.”Burghardt, Belton, The Treasury Bond Basis, 1994, Probus Publishing
Used as another means to determine and UST futures contract’s CTD security.
Issue with the highest IRR is considered CTD.
© 2018 CME Group. All rights reserved. 41
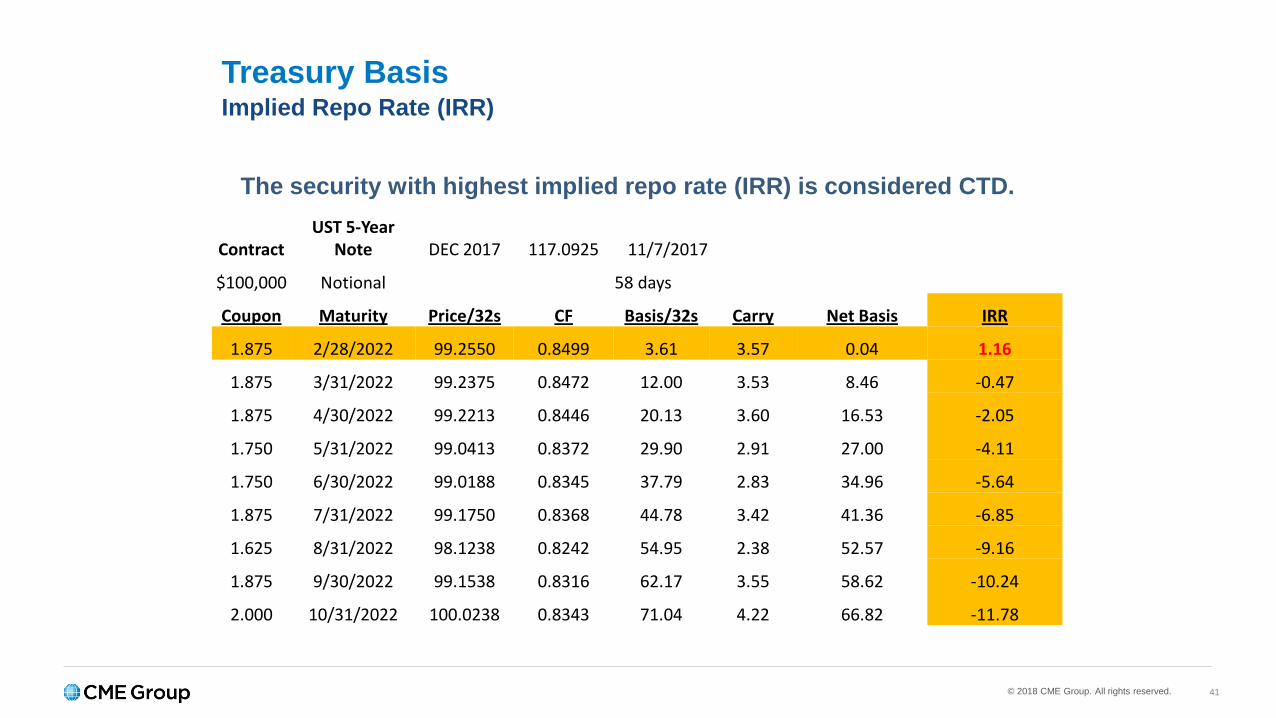
Treasury BasisImplied Repo Rate (IRR)
The security with highest implied repo rate (IRR) is considered CTD.
ContractUST 5-Year
Note DEC 2017 117.0925 11/7/2017
$100,000 Notional 58 days
Coupon Maturity Price/32s CF Basis/32s Carry Net Basis IRR
1.875 2/28/2022 99.2550 0.8499 3.61 3.57 0.04 1.16
1.875 3/31/2022 99.2375 0.8472 12.00 3.53 8.46 -0.47
1.875 4/30/2022 99.2213 0.8446 20.13 3.60 16.53 -2.05
1.750 5/31/2022 99.0413 0.8372 29.90 2.91 27.00 -4.11
1.750 6/30/2022 99.0188 0.8345 37.79 2.83 34.96 -5.64
1.875 7/31/2022 99.1750 0.8368 44.78 3.42 41.36 -6.85
1.625 8/31/2022 98.1238 0.8242 54.95 2.38 52.57 -9.16
1.875 9/30/2022 99.1538 0.8316 62.17 3.55 58.62 -10.24
2.000 10/31/2022 100.0238 0.8343 71.04 4.22 66.82 -11.78
© 2018 CME Group. All rights reserved. 42
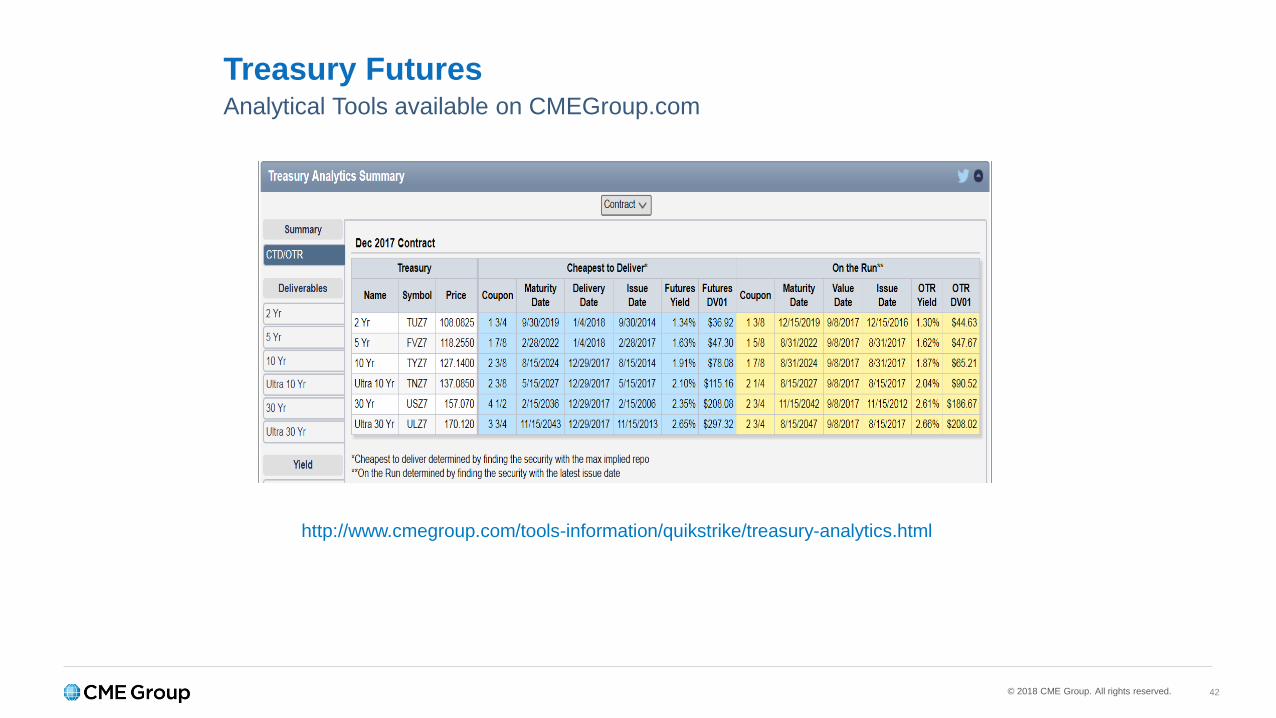
Treasury FuturesAnalytical Tools available on CMEGroup.com
http://www.cmegroup.com/tools-information/quikstrike/treasury-analytics.html
© 2018 CME Group. All rights reserved. 43
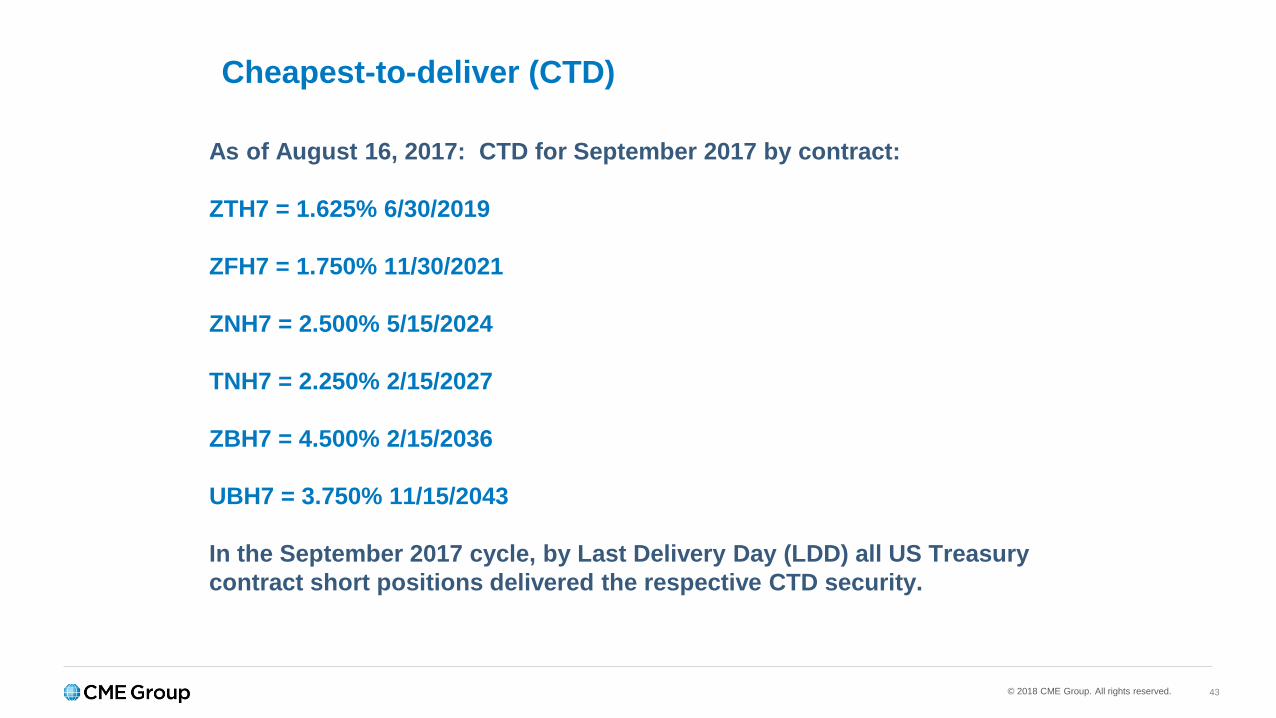
Cheapest-to-deliver (CTD)
As of August 16, 2017: CTD for September 2017 by contract:
ZTH7 = 1.625% 6/30/2019
ZFH7 = 1.750% 11/30/2021
ZNH7 = 2.500% 5/15/2024
TNH7 = 2.250% 2/15/2027
ZBH7 = 4.500% 2/15/2036
UBH7 = 3.750% 11/15/2043
In the September 2017 cycle, by Last Delivery Day (LDD) all US Treasury contract short positions delivered the respective CTD security.
© 2018 CME Group. All rights reserved. 44
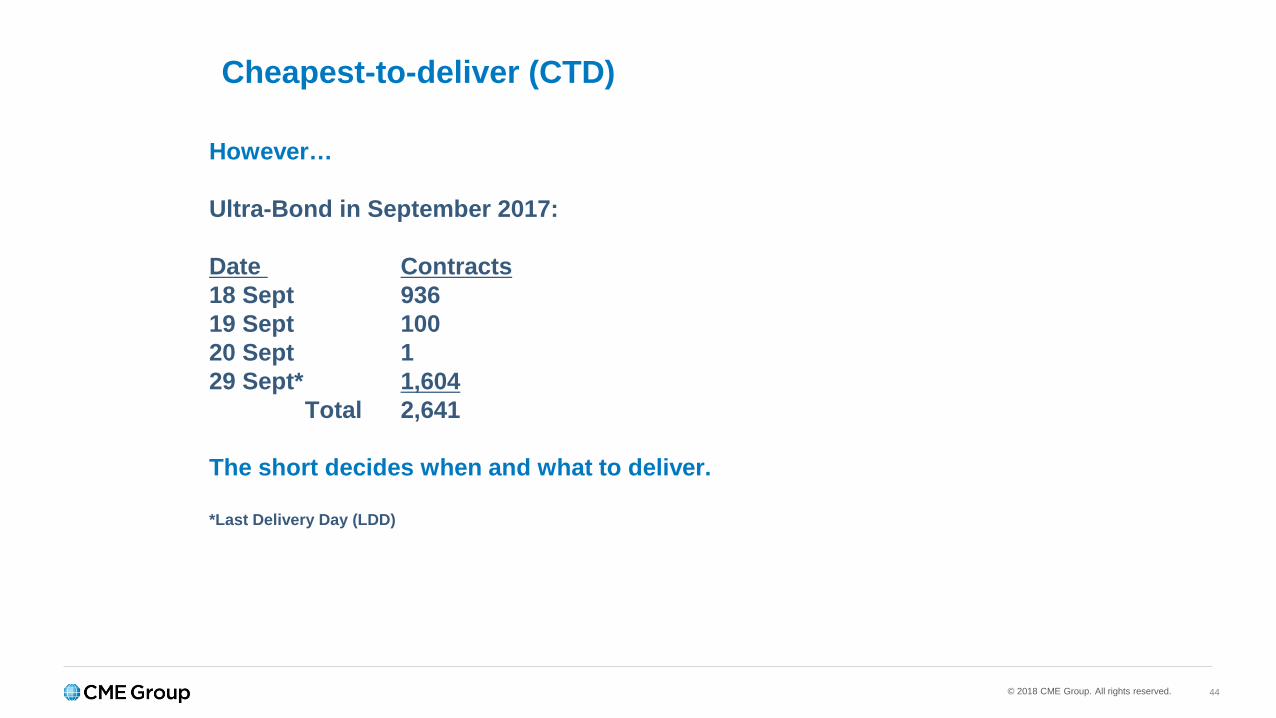
Cheapest-to-deliver (CTD)
However…
Ultra-Bond in September 2017:
Date Contracts18 Sept 93619 Sept 10020 Sept 129 Sept* 1,604
Total 2,641
The short decides when and what to deliver.
*Last Delivery Day (LDD)
© 2018 CME Group. All rights reserved. 45
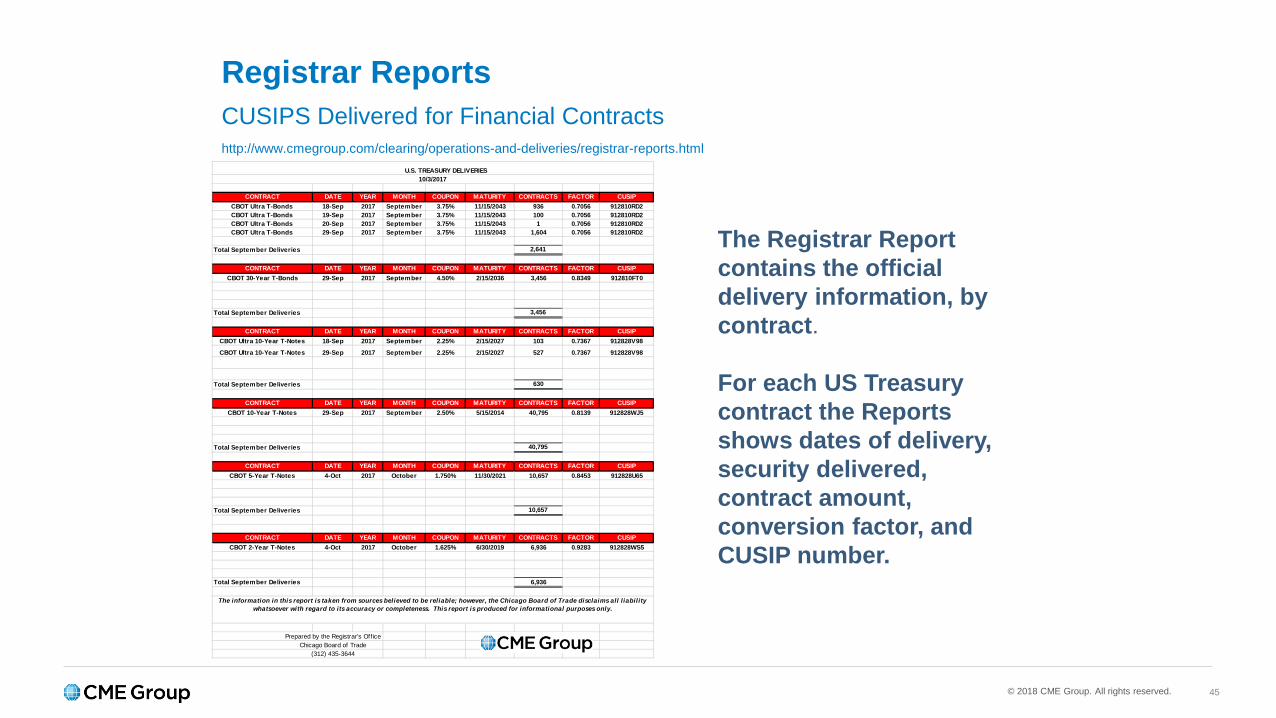
Registrar ReportsCUSIPS Delivered for Financial Contracts
CONTRACT DATE YEAR MONTH COUPON MATURITY CONTRACTS FACTOR CUSIPCBOT Ultra T-Bonds 18-Sep 2017 September 3.75% 11/15/2043 936 0.7056 912810RD2CBOT Ultra T-Bonds 19-Sep 2017 September 3.75% 11/15/2043 100 0.7056 912810RD2CBOT Ultra T-Bonds 20-Sep 2017 September 3.75% 11/15/2043 1 0.7056 912810RD2CBOT Ultra T-Bonds 29-Sep 2017 September 3.75% 11/15/2043 1,604 0.7056 912810RD2
Total September Deliveries 2,641
CONTRACT DATE YEAR MONTH COUPON MATURITY CONTRACTS FACTOR CUSIPCBOT 30-Year T-Bonds 29-Sep 2017 September 4.50% 2/15/2036 3,456 0.8349 912810FT0
Total September Deliveries 3,456
CONTRACT DATE YEAR MONTH COUPON MATURITY CONTRACTS FACTOR CUSIPCBOT Ultra 10-Year T-Notes 18-Sep 2017 September 2.25% 2/15/2027 103 0.7367 912828V98
CBOT Ultra 10-Year T-Notes 29-Sep 2017 September 2.25% 2/15/2027 527 0.7367 912828V98
Total September Deliveries 630
CONTRACT DATE YEAR MONTH COUPON MATURITY CONTRACTS FACTOR CUSIPCBOT 10-Year T-Notes 29-Sep 2017 September 2.50% 5/15/2014 40,795 0.8139 912828WJ5
Total September Deliveries 40,795
CONTRACT DATE YEAR MONTH COUPON MATURITY CONTRACTS FACTOR CUSIPCBOT 5-Year T-Notes 4-Oct 2017 October 1.750% 11/30/2021 10,657 0.8453 912828U65
Total September Deliveries 10,657
CONTRACT DATE YEAR MONTH COUPON MATURITY CONTRACTS FACTOR CUSIPCBOT 2-Year T-Notes 4-Oct 2017 October 1.625% 6/30/2019 6,936 0.9283 912828WS5
Total September Deliveries 6,936
Prepared by the Registrar's Off iceChicago Board of Trade
(312) 435-3644
U.S. TREASURY DELIVERIES10/3/2017
The information in this report is taken from sources believed to be reliable; however, the Chicago Board of Trade disclaims all l iability whatsoever with regard to its accuracy or completeness. This report is produced for informational purposes only.
The Registrar Report contains the official delivery information, by contract.
For each US Treasury contract the Reports shows dates of delivery, security delivered, contract amount, conversion factor, and CUSIP number.
http://www.cmegroup.com/clearing/operations-and-deliveries/registrar-reports.html
© 2018 CME Group. All rights reserved. 46
Cheapest-to-deliver (CTD)
US Treasury Futures tend to trade like their CTD issue.
The exchange does not establish which issue is CTD.
© 2018 CME Group. All rights reserved. 47
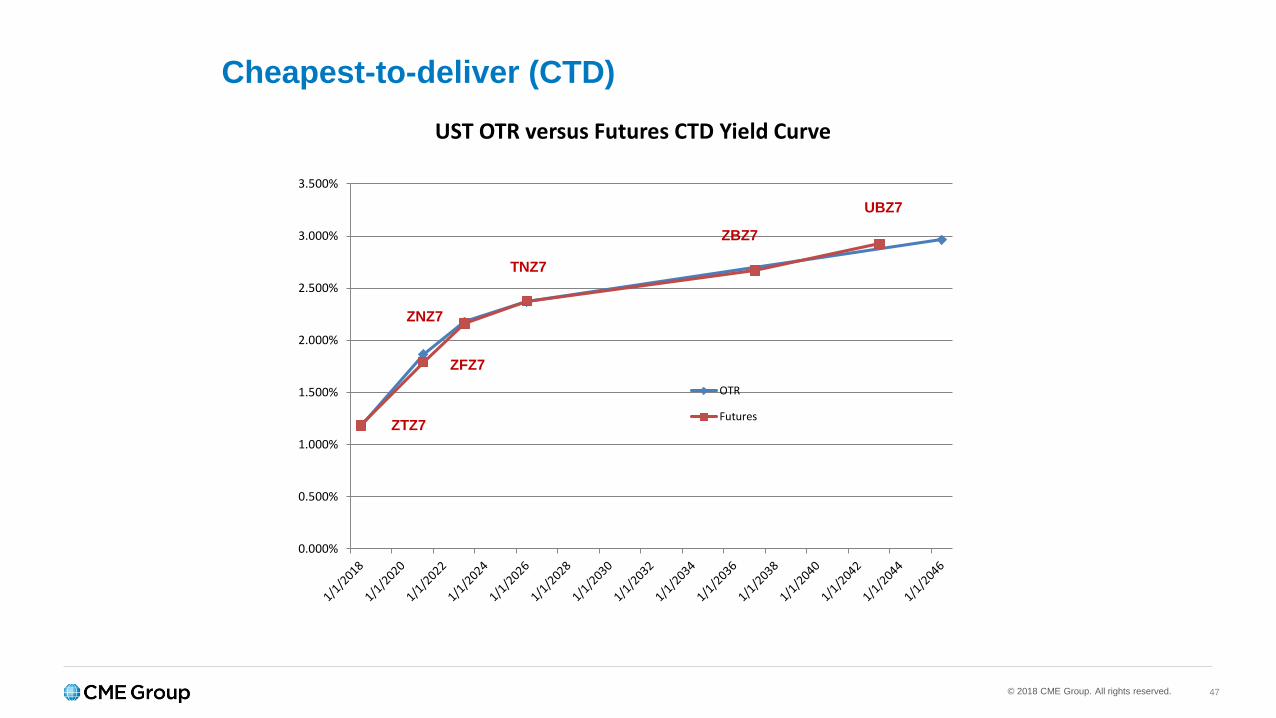
Cheapest-to-deliver (CTD)
0.000%
0.500%
1.000%
1.500%
2.000%
2.500%
3.000%
3.500%
UST OTR versus Futures CTD Yield Curve
OTR
FuturesZTZ7
ZNZ7
ZBZ7
UBZ7
TNZ7
ZFZ7
© 2018 CME Group. All rights reserved. 48
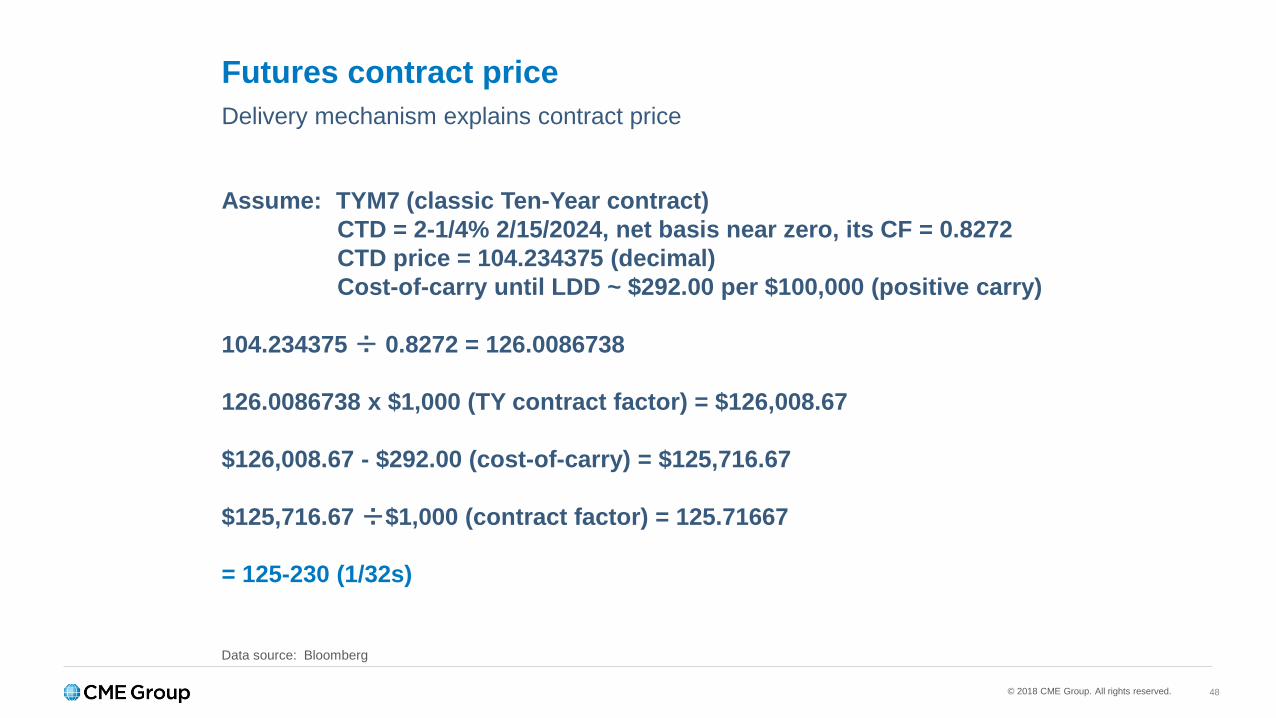
Futures contract priceDelivery mechanism explains contract price
Assume: TYM7 (classic Ten-Year contract)CTD = 2-1/4% 2/15/2024, net basis near zero, its CF = 0.8272CTD price = 104.234375 (decimal)Cost-of-carry until LDD ~ $292.00 per $100,000 (positive carry)
104.234375 ÷ 0.8272 = 126.0086738
126.0086738 x $1,000 (TY contract factor) = $126,008.67
$126,008.67 - $292.00 (cost-of-carry) = $125,716.67
$125,716.67 ÷$1,000 (contract factor) = 125.71667
= 125-230 (1/32s)
Data source: Bloomberg
© 2018 CME Group. All rights reserved. 49
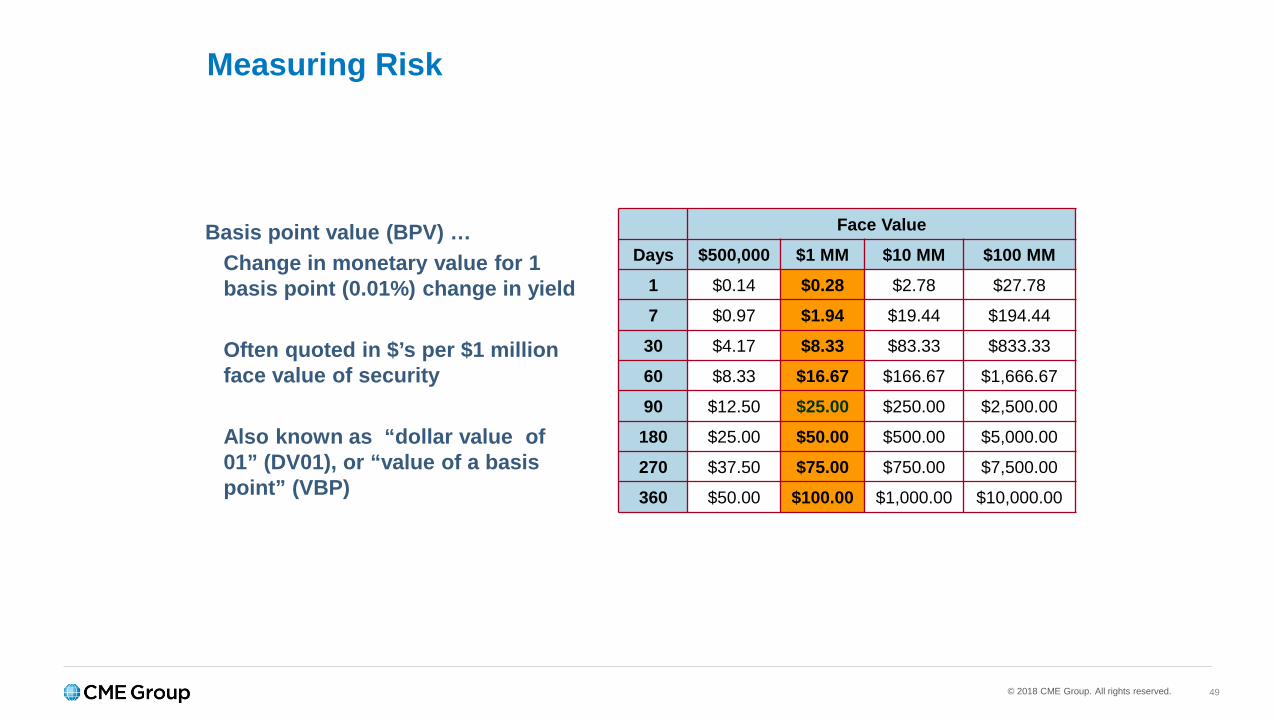
Measuring Risk
Face Value
Days $500,000 $1 MM $10 MM $100 MM
1 $0.14 $0.28 $2.78 $27.78
7 $0.97 $1.94 $19.44 $194.44
30 $4.17 $8.33 $83.33 $833.33
60 $8.33 $16.67 $166.67 $1,666.67
90 $12.50 $25.00 $250.00 $2,500.00
180 $25.00 $50.00 $500.00 $5,000.00
270 $37.50 $75.00 $750.00 $7,500.00
360 $50.00 $100.00 $1,000.00 $10,000.00
Basis point value (BPV) … Change in monetary value for 1 basis point (0.01%) change in yield
Often quoted in $’s per $1 million face value of security
Also known as “dollar value of 01” (DV01), or “value of a basis point” (VBP)
© 2018 CME Group. All rights reserved. 50
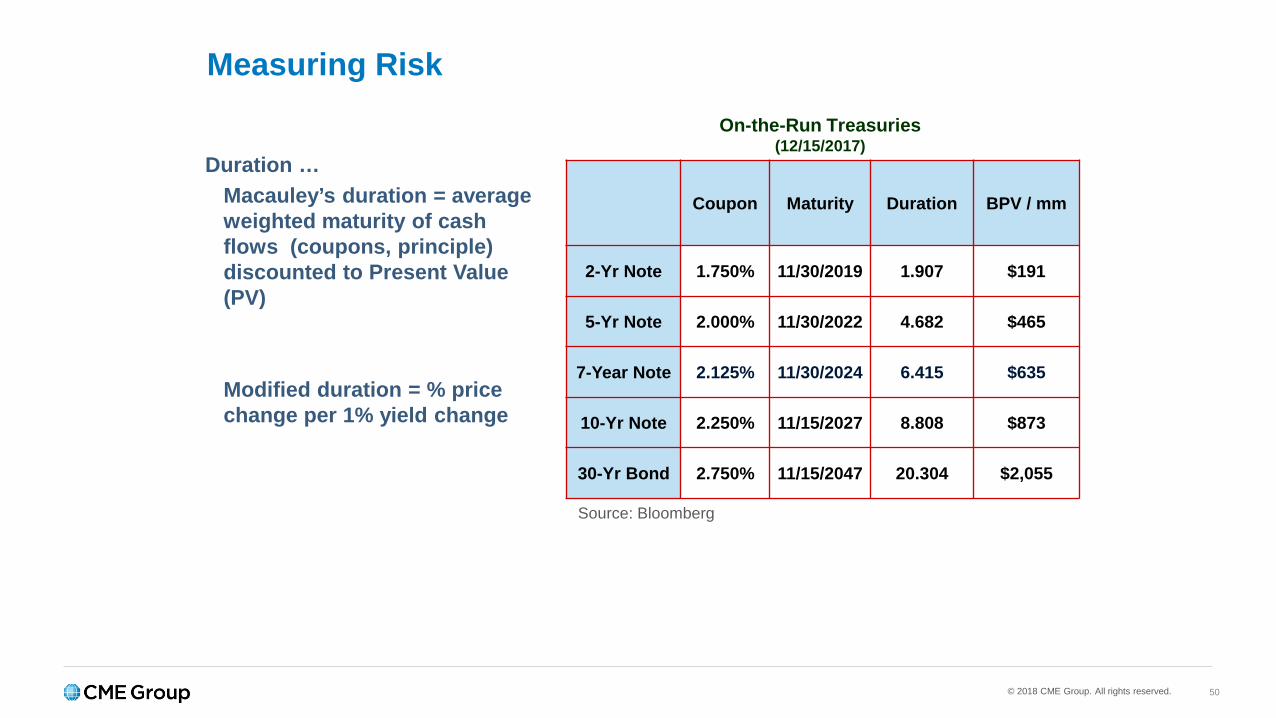
Measuring Risk
Duration … Macauley’s duration = average weighted maturity of cash flows (coupons, principle) discounted to Present Value (PV)
Modified duration = % price change per 1% yield change
Coupon Maturity Duration BPV / mm
2-Yr Note 1.750% 11/30/2019 1.907 $191
5-Yr Note 2.000% 11/30/2022 4.682 $465
7-Year Note 2.125% 11/30/2024 6.415 $635
10-Yr Note 2.250% 11/15/2027 8.808 $873
30-Yr Bond 2.750% 11/15/2047 20.304 $2,055
On-the-Run Treasuries(12/15/2017)
Source: Bloomberg
© 2018 CME Group. All rights reserved. 51
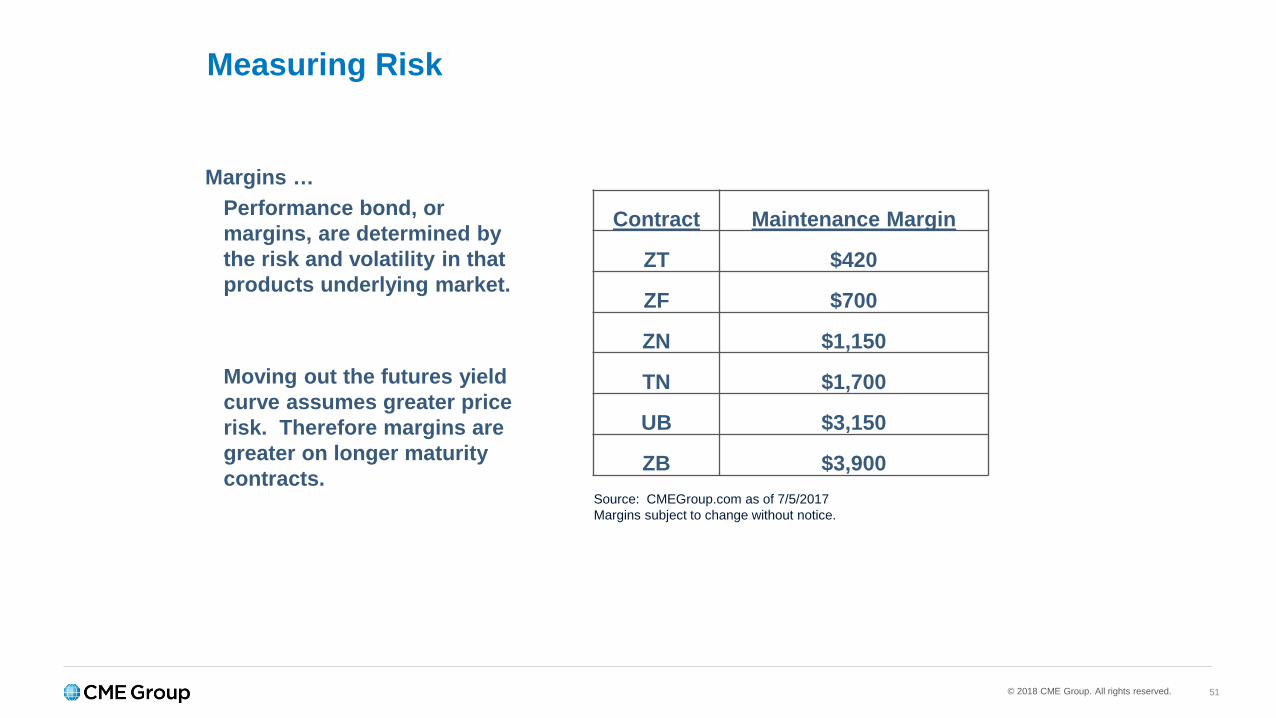
Measuring Risk
Margins … Performance bond, or margins, are determined by the risk and volatility in that products underlying market.
Moving out the futures yield curve assumes greater price risk. Therefore margins are greater on longer maturity contracts.
Contract Maintenance Margin
ZT $420
ZF $700
ZN $1,150
TN $1,700
UB $3,150
ZB $3,900Source: CMEGroup.com as of 7/5/2017Margins subject to change without notice.

© 2018 CME Group. All rights reserved. 52
Measuring Risk
One way to measure a security’s or portfolio’s risk is basis point value (BPV)
Futures contracts can also be measured by their theoretical BPV.
Data Source: Bloomberg and CME Group
Contract UST 5-Year Note DEC 2017 117.0925 Date 11/7/2017
$100,000 Notional Repo Rate 1.17% # Days 58
Coupon Maturity Price/32s YTM BPV/100K CF Basis/32s Carry Net Basis Mod Dur
1.875 2/28/2022 99.2550 1.924 41.15 0.8499 3.61 3.57 0.04 4.11
1.875 3/31/2022 99.2375 1.936 41.89 0.8472 12.00 3.53 8.46 4.19
1.875 4/30/2022 99.2213 1.947 42.63 0.8446 20.13 3.60 16.53 4.28
1.750 5/31/2022 99.0413 1.950 43.24 0.8372 29.90 2.91 27.00 4.33
1.750 6/30/2022 99.0188 1.963 43.97 0.8345 37.79 2.83 34.96 4.41
1.875 7/31/2022 99.1750 1.976 44.85 0.8368 44.78 3.42 41.36 4.48
1.625 8/31/2022 98.1238 1.978 45.27 0.8242 54.95 2.38 52.57 4.59
1.875 9/30/2022 99.1538 1.987 46.30 0.8316 62.17 3.55 58.62 4.65
2.000 10/31/2022 100.0238 1.984 47.22 0.8343 71.04 4.22 66.82 4.72
© 2018 CME Group. All rights reserved. 53
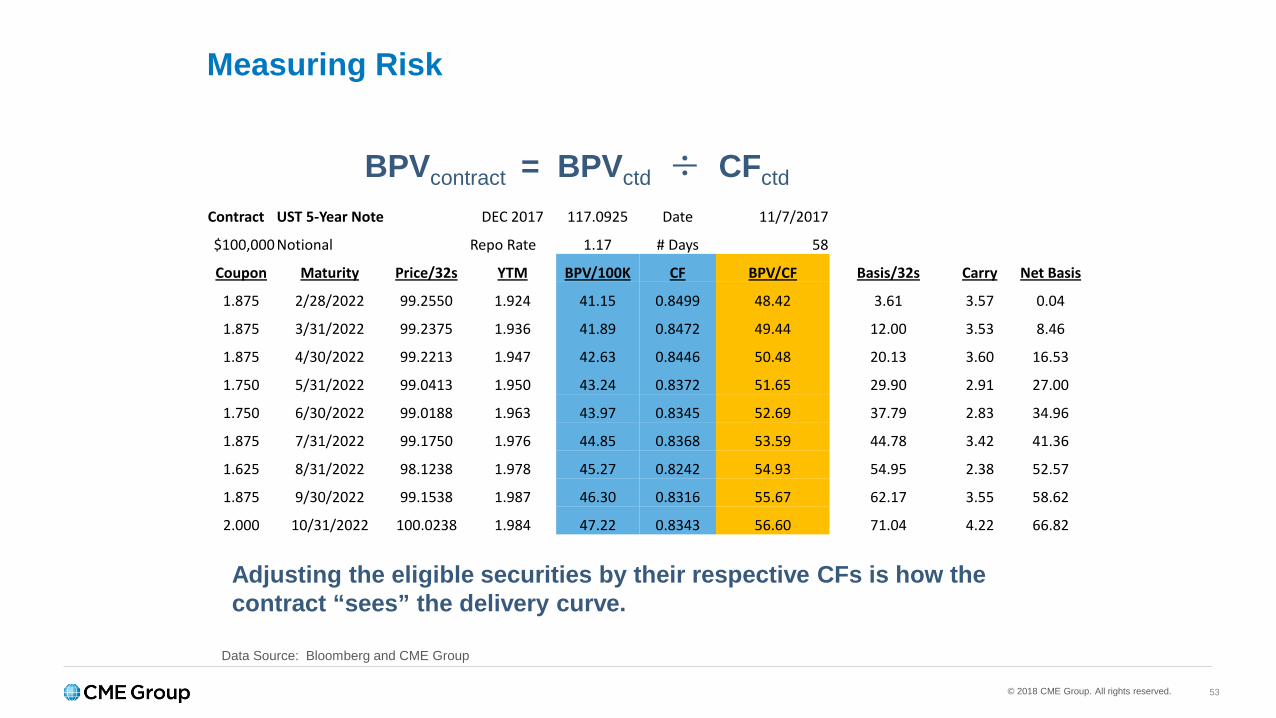
Measuring Risk
BPVcontract = BPVctd ÷ CFctd
Adjusting the eligible securities by their respective CFs is how the contract “sees” the delivery curve.
Data Source: Bloomberg and CME Group
Contract UST 5-Year Note DEC 2017 117.0925 Date 11/7/2017
$100,000 Notional Repo Rate 1.17 # Days 58
Coupon Maturity Price/32s YTM BPV/100K CF BPV/CF Basis/32s Carry Net Basis
1.875 2/28/2022 99.2550 1.924 41.15 0.8499 48.42 3.61 3.57 0.04
1.875 3/31/2022 99.2375 1.936 41.89 0.8472 49.44 12.00 3.53 8.46
1.875 4/30/2022 99.2213 1.947 42.63 0.8446 50.48 20.13 3.60 16.53
1.750 5/31/2022 99.0413 1.950 43.24 0.8372 51.65 29.90 2.91 27.00
1.750 6/30/2022 99.0188 1.963 43.97 0.8345 52.69 37.79 2.83 34.96
1.875 7/31/2022 99.1750 1.976 44.85 0.8368 53.59 44.78 3.42 41.36
1.625 8/31/2022 98.1238 1.978 45.27 0.8242 54.93 54.95 2.38 52.57
1.875 9/30/2022 99.1538 1.987 46.30 0.8316 55.67 62.17 3.55 58.62
2.000 10/31/2022 100.0238 1.984 47.22 0.8343 56.60 71.04 4.22 66.82
© 2018 CME Group. All rights reserved. 54
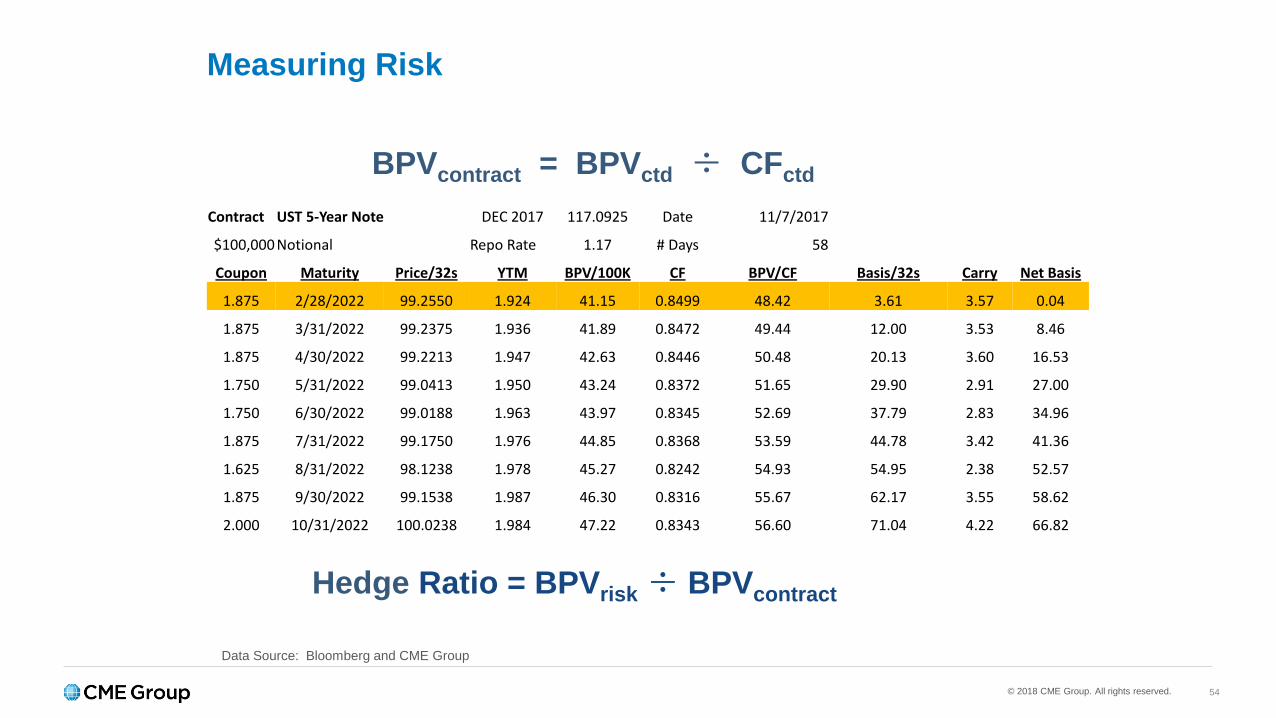
Measuring Risk
Hedge Ratio = BPVrisk ÷ BPVcontract
BPVcontract = BPVctd ÷ CFctd
Data Source: Bloomberg and CME Group
Contract UST 5-Year Note DEC 2017 117.0925 Date 11/7/2017
$100,000 Notional Repo Rate 1.17 # Days 58
Coupon Maturity Price/32s YTM BPV/100K CF BPV/CF Basis/32s Carry Net Basis
1.875 2/28/2022 99.2550 1.924 41.15 0.8499 48.42 3.61 3.57 0.04
1.875 3/31/2022 99.2375 1.936 41.89 0.8472 49.44 12.00 3.53 8.46
1.875 4/30/2022 99.2213 1.947 42.63 0.8446 50.48 20.13 3.60 16.53
1.750 5/31/2022 99.0413 1.950 43.24 0.8372 51.65 29.90 2.91 27.00
1.750 6/30/2022 99.0188 1.963 43.97 0.8345 52.69 37.79 2.83 34.96
1.875 7/31/2022 99.1750 1.976 44.85 0.8368 53.59 44.78 3.42 41.36
1.625 8/31/2022 98.1238 1.978 45.27 0.8242 54.93 54.95 2.38 52.57
1.875 9/30/2022 99.1538 1.987 46.30 0.8316 55.67 62.17 3.55 58.62
2.000 10/31/2022 100.0238 1.984 47.22 0.8343 56.60 71.04 4.22 66.82

© 2018 CME Group. All rights reserved. 55
Hedge Ratio (HR)
Example: Long $100 million U.S Treasury portfolio with an average BPV of $450 per million. How many ZFZ7 contracts would I need to sell?
Step 1: Identify ZFZ7’s CTDStep 2: Calculate ZFZ7’s CF adjusted BPVStep 3: Calculate HR
© 2018 CME Group. All rights reserved. 56
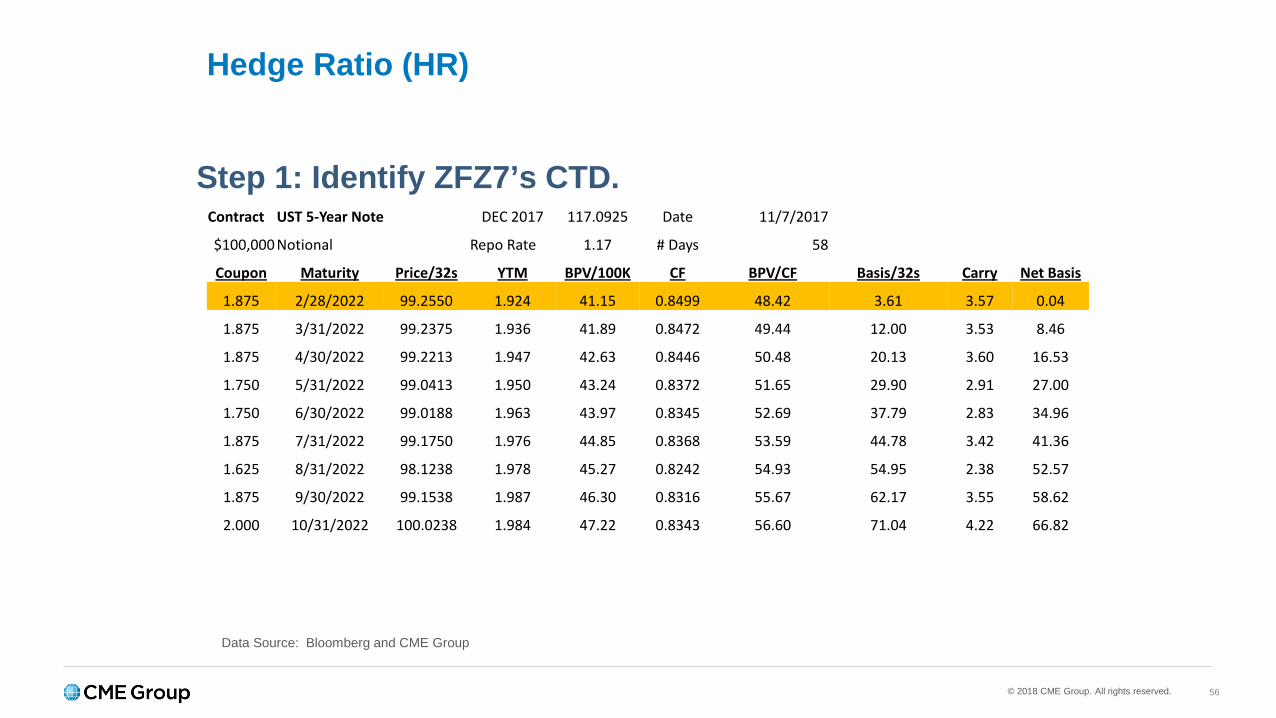
Hedge Ratio (HR)
Step 1: Identify ZFZ7’s CTD.
Data Source: Bloomberg and CME Group
Contract UST 5-Year Note DEC 2017 117.0925 Date 11/7/2017
$100,000 Notional Repo Rate 1.17 # Days 58
Coupon Maturity Price/32s YTM BPV/100K CF BPV/CF Basis/32s Carry Net Basis
1.875 2/28/2022 99.2550 1.924 41.15 0.8499 48.42 3.61 3.57 0.04
1.875 3/31/2022 99.2375 1.936 41.89 0.8472 49.44 12.00 3.53 8.46
1.875 4/30/2022 99.2213 1.947 42.63 0.8446 50.48 20.13 3.60 16.53
1.750 5/31/2022 99.0413 1.950 43.24 0.8372 51.65 29.90 2.91 27.00
1.750 6/30/2022 99.0188 1.963 43.97 0.8345 52.69 37.79 2.83 34.96
1.875 7/31/2022 99.1750 1.976 44.85 0.8368 53.59 44.78 3.42 41.36
1.625 8/31/2022 98.1238 1.978 45.27 0.8242 54.93 54.95 2.38 52.57
1.875 9/30/2022 99.1538 1.987 46.30 0.8316 55.67 62.17 3.55 58.62
2.000 10/31/2022 100.0238 1.984 47.22 0.8343 56.60 71.04 4.22 66.82
© 2018 CME Group. All rights reserved. 57
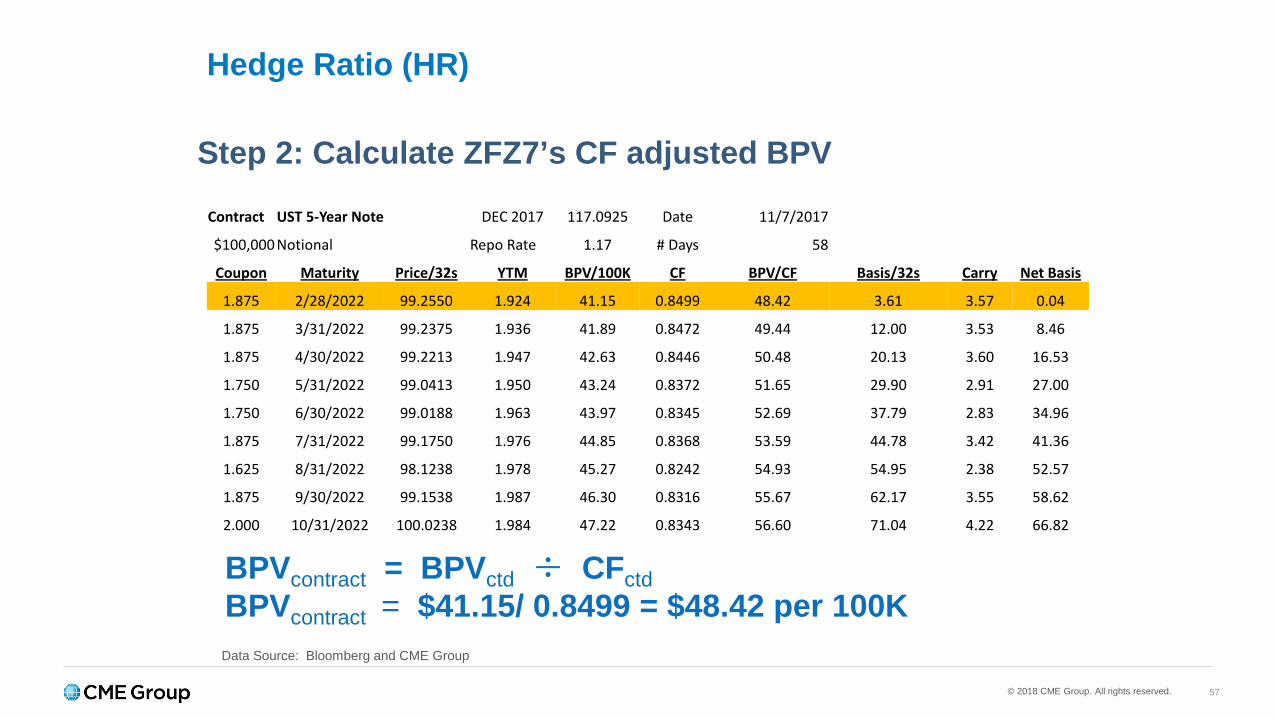
Hedge Ratio (HR)
Step 2: Calculate ZFZ7’s CF adjusted BPV
BPVcontract = BPVctd ÷ CFctdBPVcontract = $41.15/ 0.8499 = $48.42 per 100KData Source: Bloomberg and CME Group
Contract UST 5-Year Note DEC 2017 117.0925 Date 11/7/2017
$100,000 Notional Repo Rate 1.17 # Days 58
Coupon Maturity Price/32s YTM BPV/100K CF BPV/CF Basis/32s Carry Net Basis
1.875 2/28/2022 99.2550 1.924 41.15 0.8499 48.42 3.61 3.57 0.04
1.875 3/31/2022 99.2375 1.936 41.89 0.8472 49.44 12.00 3.53 8.46
1.875 4/30/2022 99.2213 1.947 42.63 0.8446 50.48 20.13 3.60 16.53
1.750 5/31/2022 99.0413 1.950 43.24 0.8372 51.65 29.90 2.91 27.00
1.750 6/30/2022 99.0188 1.963 43.97 0.8345 52.69 37.79 2.83 34.96
1.875 7/31/2022 99.1750 1.976 44.85 0.8368 53.59 44.78 3.42 41.36
1.625 8/31/2022 98.1238 1.978 45.27 0.8242 54.93 54.95 2.38 52.57
1.875 9/30/2022 99.1538 1.987 46.30 0.8316 55.67 62.17 3.55 58.62
2.000 10/31/2022 100.0238 1.984 47.22 0.8343 56.60 71.04 4.22 66.82
© 2018 CME Group. All rights reserved. 58
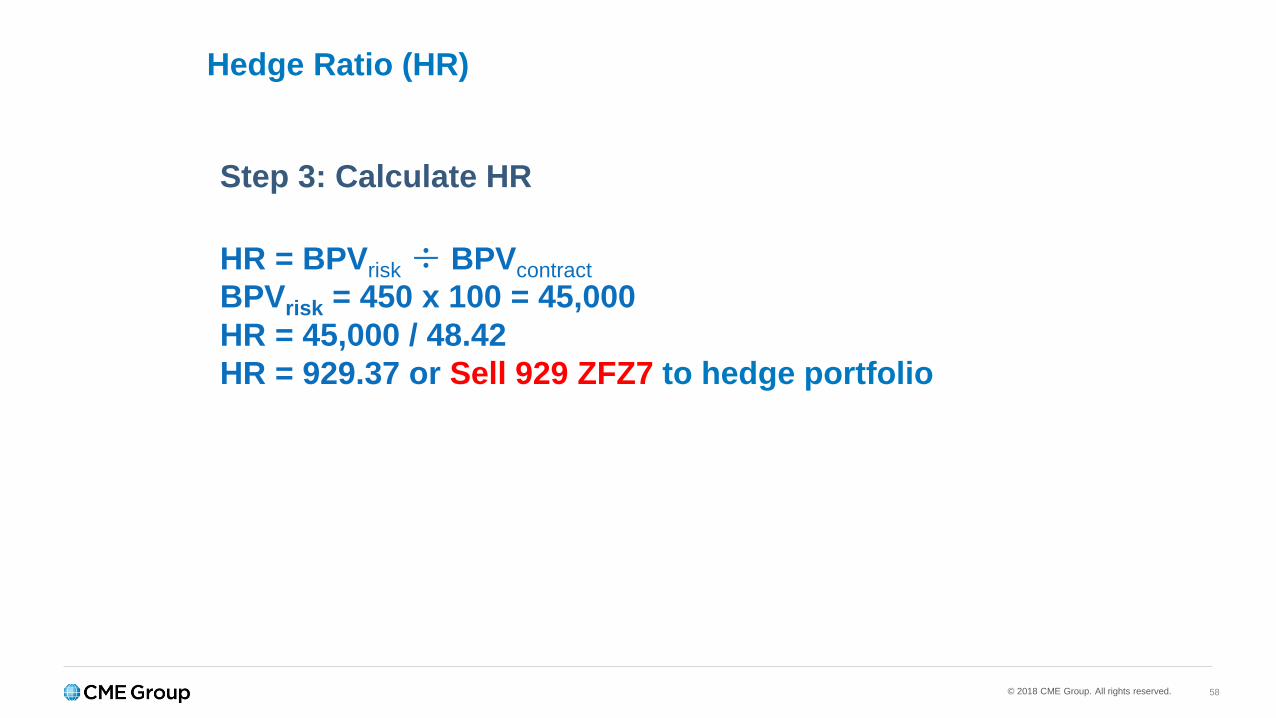
Hedge Ratio (HR)
Step 3: Calculate HR
HR = BPVrisk ÷ BPVcontractBPVrisk = 450 x 100 = 45,000HR = 45,000 / 48.42HR = 929.37 or Sell 929 ZFZ7 to hedge portfolio
© 2018 CME Group. All rights reserved.
Questions?
60© 2018 CME Group. All rights reserved.
For seasoned traders or those who are just getting started, CME Group is your source to learn about the derivatives and risk
management industry.
Explore CME Institute where you will find courses on products and trading strategies, seminars, research and commentary.
Institute.cmegroup.com
© 2018 CME Group. All rights reserved. 61
Contact us:
David Gibbs, Director, Market Development+1 312 207 [email protected]
cmegroup.com
© 2018 CME Group. All rights reserved.
Thank you