U.S. Sugar Market and Policy Update - amscl.orgamscl.org/Images/Interior/contact committee/roney -...
46
American Sugar Cane League Annual Contact Committee Meeting Thibodaux, Louisiana June 22, 2016 U.S. Sugar Market and Policy Update Jack Roney Director of Economics and Policy Analysis American Sugar Alliance Washington, D.C.
Transcript of U.S. Sugar Market and Policy Update - amscl.orgamscl.org/Images/Interior/contact committee/roney -...

American Sugar Cane League Annual Contact Committee Meeting
Thibodaux, Louisiana June 22, 2016
U.S. Sugar Market and Policy Update
Jack Roney Director of Economics and Policy Analysis
American Sugar Alliance Washington, D.C.
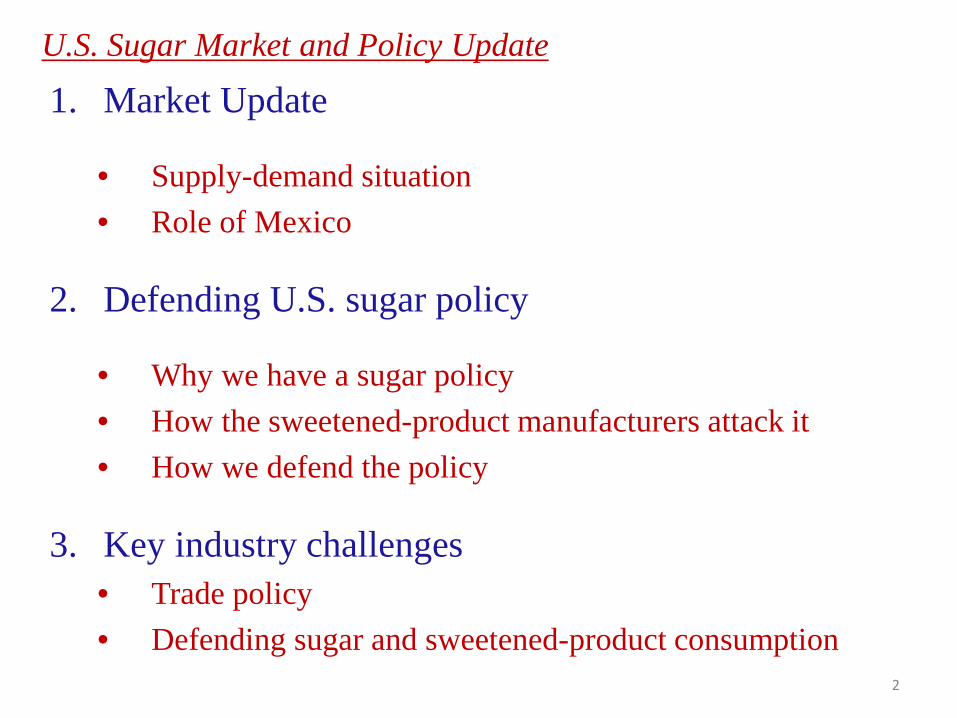
U.S. Sugar Market and Policy Update
1. Market Update
• Supply-demand situation • Role of Mexico
2. Defending U.S. sugar policy
• Why we have a sugar policy • How the sweetened-product manufacturers attack it • How we defend the policy
3. Key industry challenges • Trade policy • Defending sugar and sweetened-product consumption
2

U.S. Sugar Market and Policy Update
1. Market Update
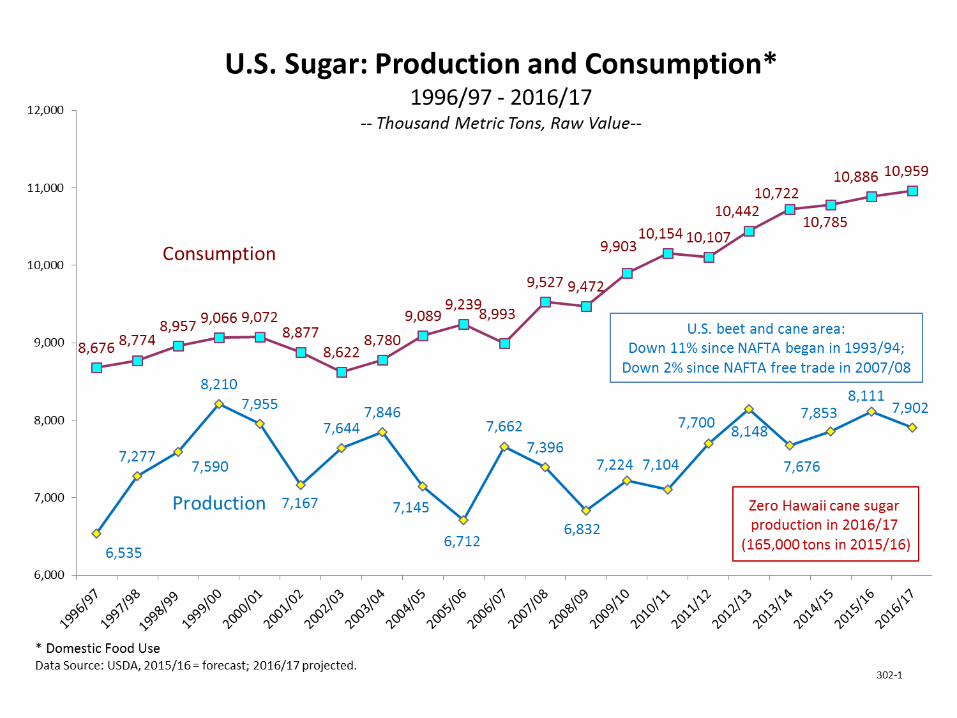
• Market more stable since Suspension Agreements (SAs) enacted in December 2014
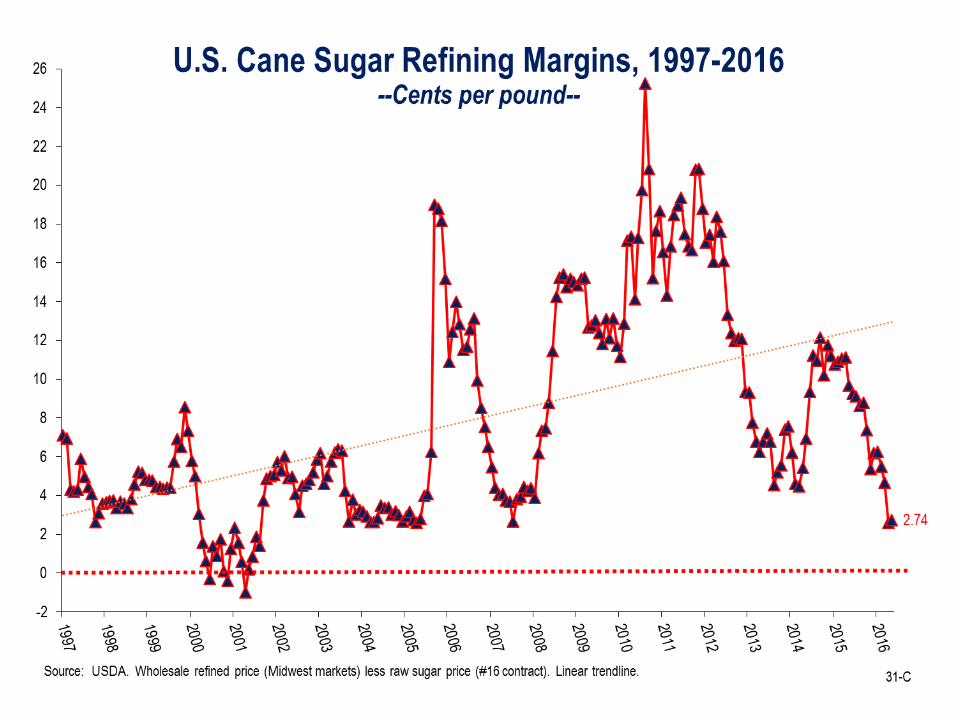
• But major problem for cane refiners: Lack of raw sugar availability Most sugar from Mexico bypassing refiners Raw imports for refined re-exports to Mexico ending Hawaii to end sugarcane production Small refining margins Problem exacerbated by increased demand for cane sugar
(misguided consumer concerns about GMO)
• U.S. and Mexican governments attempting to improve the SAs, ensure cane refiner throughput
3
2.8
3.0
3.2
3.4
3.6
3.8
4.0
4.2
4.4
4.6
4.8
5.0
5.2
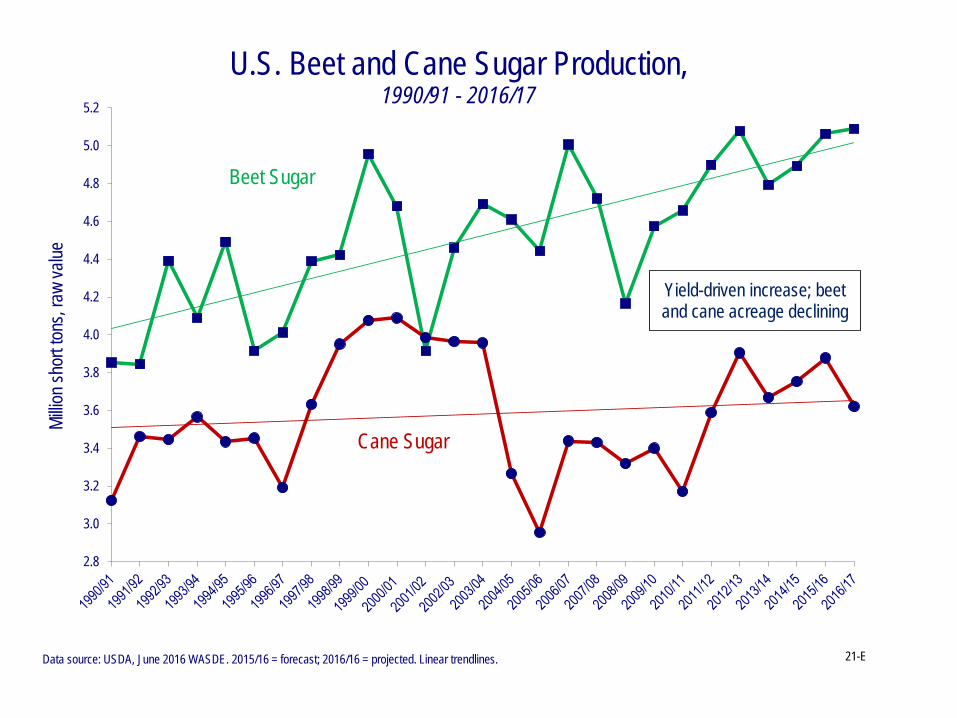
U.S. Beet and Cane Sugar Production, 1990/91 - 2016/17
Data source: USDA, June 2016 WASDE. 2015/16 = forecast; 2016/16 = projected. Linear trendlines.
Beet Sugar
Cane Sugar
Millio
n sho
rt ton
s, ra
w va
lue
21-E
Yield-driven increase; beet and cane acreage declining
6
0
500
1,000
1,500
2,000
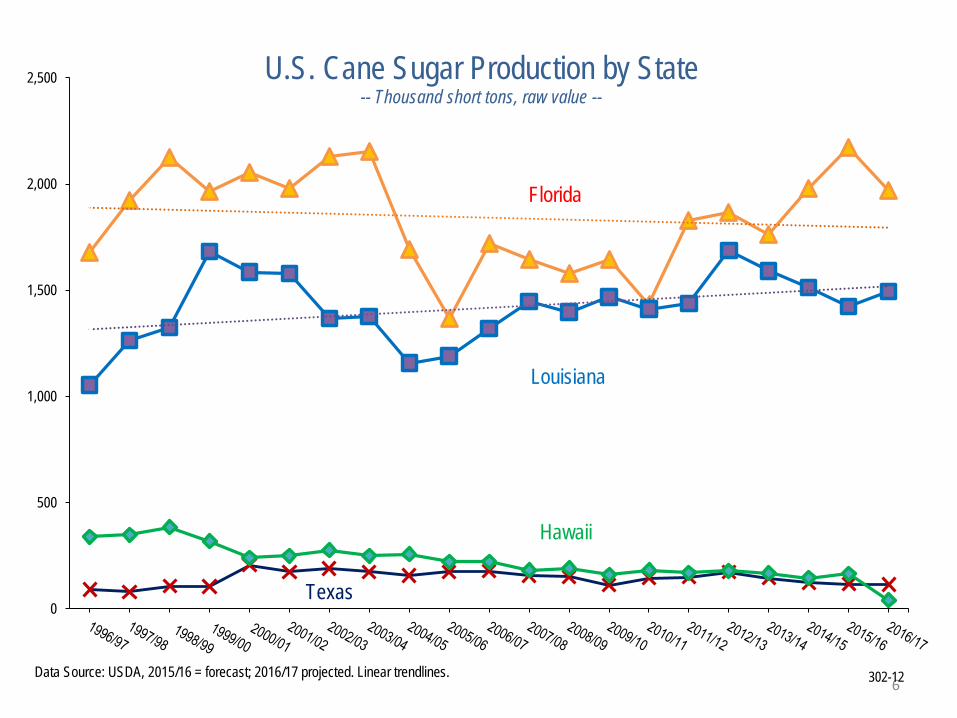
2,500 U.S. Cane Sugar Production by State-- Thousand short tons, raw value --
Hawaii
Texas
Florida
Louisiana
Data Source: USDA, 2015/16 = forecast; 2016/17 projected. Linear trendlines. 302-12


8
U.S. Court of International Trade investigation, upon appeal, of whether the SAs fully eliminate injury to the U.S. sugar industry.
U.S. & Mexican governments sign the SAs. Mexico may fulfill 100% of U.S. import needs above trade commitments; reference prices and limit on refined share of imports set.
DOC finds final dumping margins of 41-42%.
DOC finds final subsidy margins of 48-84%.
ITC final finding, by 6-0 vote, that Mexico injured U.S. sugar industry.
U.S. Anti-Dumping (AD) and Countervailing-Duty (CVD) Cases vs. Mexican Sugar
October
March ITC finds, by 6-0 vote, that the SAs eliminate the injurious effect of Mexican dumping on the U.S. industry.
2016
Mexican sugar production rises by 38%; Mexican sugar exports to the U.S. double (to 2 million tons); U.S. sugar price collapses.
U.S. files AD/CVD cases vs. Mexican sugar.
U.S. International Trade Commission (ITC) preliminary finding, by 5-0 vote, that Mexico has injured the U.S. sugar industry.
U.S. Department of Commerce (DOC) finds that Mexico has been subsidizing and imposes preliminary CVDs at 3-17%.
DOC finds that Mexico has been dumping (selling below domestic cost of production or prices) and imposes preliminary ADs at 40-47%.
U.S. & Mexican governments announce draft Suspension Agreements (SAs) to suspend duties and resume duty-free sugar trade, with Mexican exports to the U.S. no longer to exceed U.S. needs.
August
October
December
2015
September
2012/13
2014March
May
9
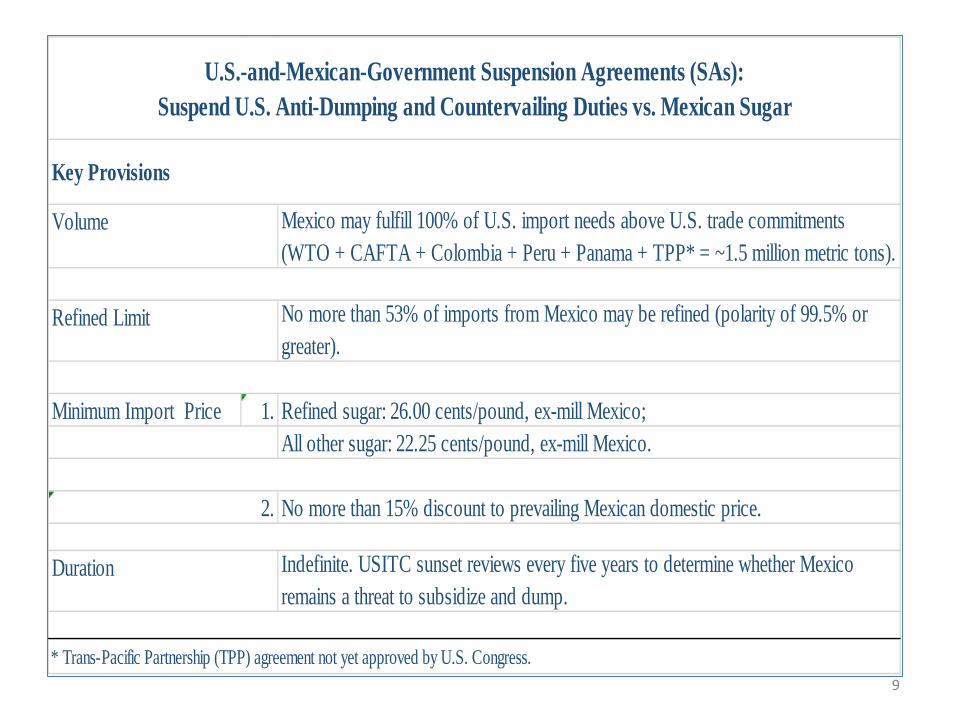
Mexico may fulfill 100% of U.S. import needs above U.S. trade commitments (WTO + CAFTA + Colombia + Peru + Panama + TPP* = ~1.5 million metric tons).
No more than 53% of imports from Mexico may be refined (polarity of 99.5% or greater).
Minimum Import Price 1. Refined sugar: 26.00 cents/pound, ex-mill Mexico;All other sugar: 22.25 cents/pound, ex-mill Mexico.
No more than 15% discount to prevailing Mexican domestic price.
Indefinite. USITC sunset reviews every five years to determine whether Mexico remains a threat to subsidize and dump.
* Trans-Pacific Partnership (TPP) agreement not yet approved by U.S. Congress.
Volume
Refined Limit
U.S.-and-Mexican-Government Suspension Agreements (SAs): Suspend U.S. Anti-Dumping and Countervailing Duties vs. Mexican Sugar
2.
Key Provisions
Duration


13

14

U.S. Sugar Market and Policy Update
2. Defending U.S. sugar policy
• Why we have a sugar policy • How the sweetened-product manufacturers attack it • How we defend the policy
15

U.S. Sugar Market and Policy Update
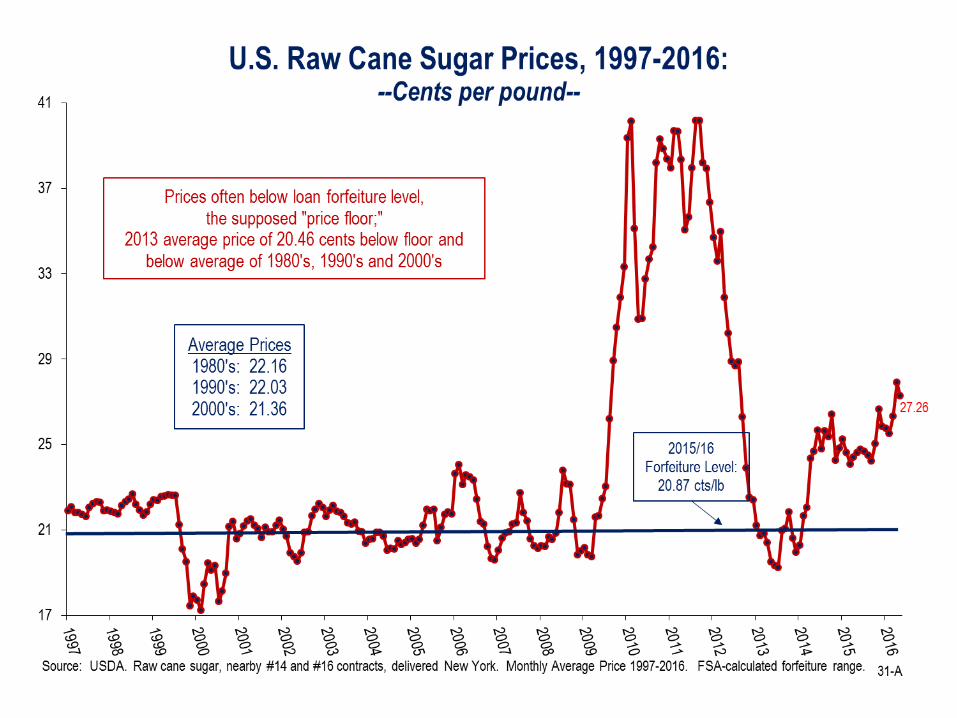
• Why we have a sugar policy
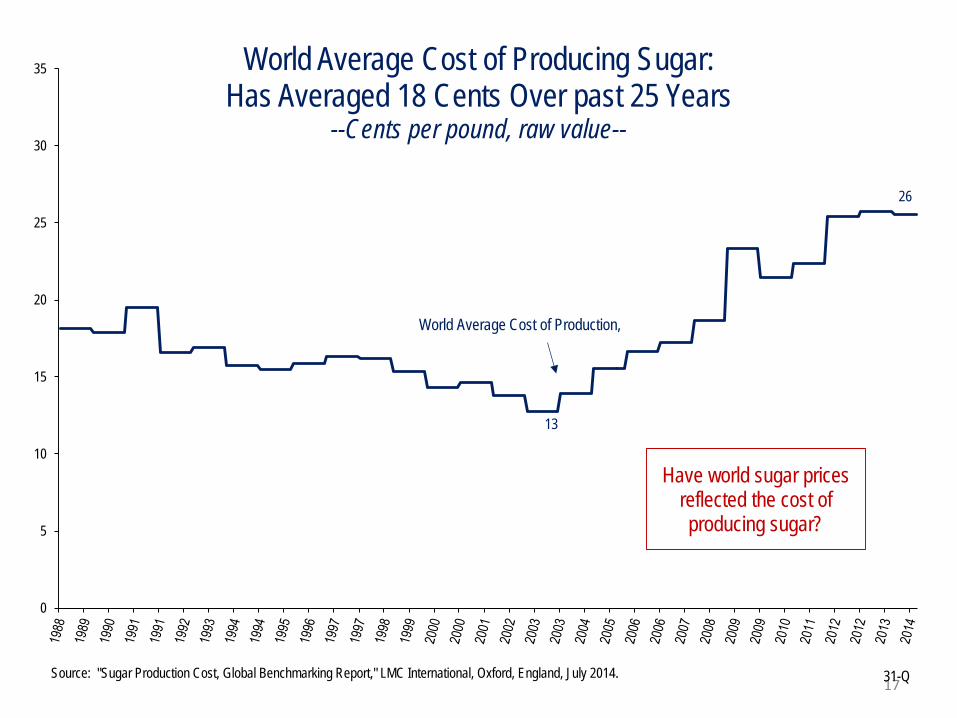
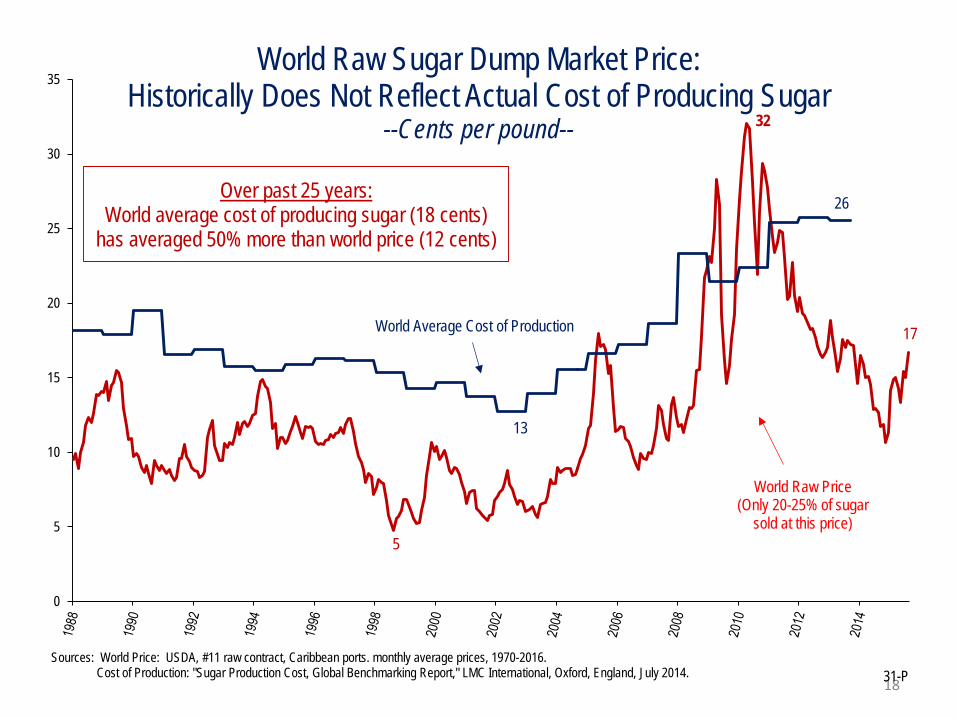
Foreign subsidies and the distorted nature of the world market
A world price that rarely reflects the cost of producing sugar o Actual domestic wholesale prices globally are well above
average costs of production and world dump market prices Foreign sugar subsidies: Pernicious and on the rise
o Continue to distort the world market o Important to track and call attention to
16
17
0
5
10
15
20
25
30
35 World Average Cost of Producing Sugar:Has Averaged 18 Cents Over past 25 Years
--Cents per pound, raw value--
31-QSource: "Sugar Production Cost, Global Benchmarking Report," LMC International, Oxford, England, July 2014.
Have world sugar prices reflected the cost of producing sugar?
World Average Cost of Production,
13
26
18
0
5
10
15
20
25
30
35World Raw Sugar Dump Market Price:
Historically Does Not Reflect Actual Cost of Producing Sugar--Cents per pound--
31-PSources: World Price: USDA, #11 raw contract, Caribbean ports. monthly average prices, 1970-2016.
Cost of Production: "Sugar Production Cost, Global Benchmarking Report," LMC International, Oxford, England, July 2014.
Over past 25 years:World average cost of producing sugar (18 cents)
has averaged 50% more than world price (12 cents)
World Average Cost of Production
World Raw Price (Only 20-25% of sugar
sold at this price)5
13
26
32
17
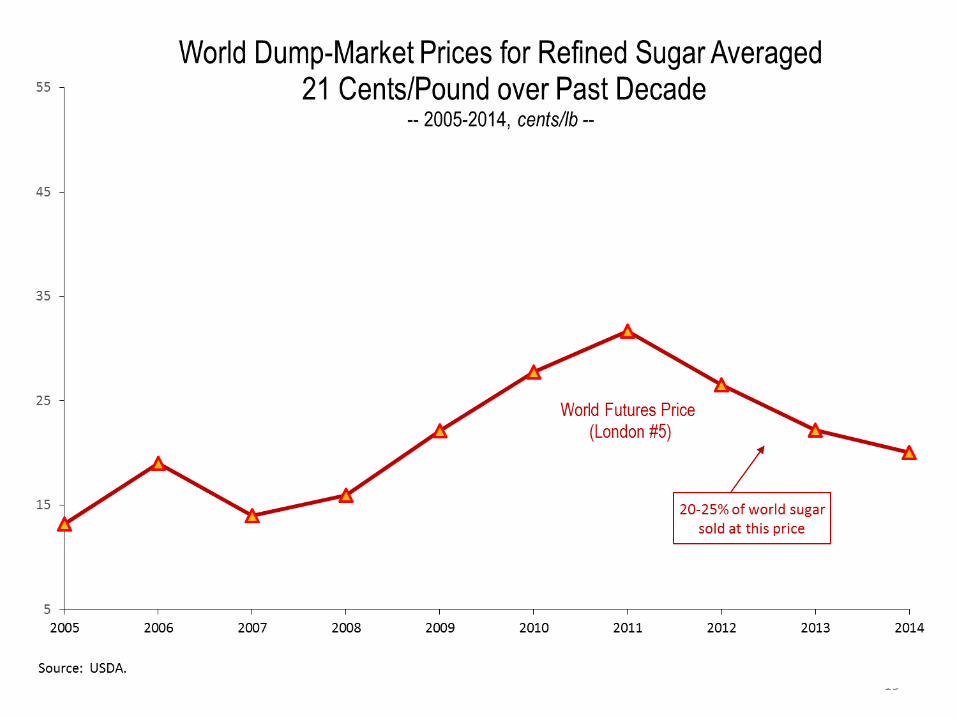
19

20

21
5
10
15
20
25
30
35
40
45
50
55
2005 2006 2007 2008 2009 2010 2011 2012 2013 2014
World Average Wholesale Refined Sugar Price Nearly 50% Higher than World Dump Market Price; Developed-Country Average Nearly Double
-- 2005-2014, cents/lb --
Source: International Sugar Organization (ISO), "Domestic Sugar Prices - a Survey", MECAS(15)06, May 2015. A survey of 78 countries, representing 79% of world sugar consumption; 2014 preliminary. U.S. 10-year average: 37 cents; September 2015 price: 33 cents.1/ EU-28 and other OECD countries in ISO survey.
Developed-Country Wholesale Price1/
World-Average Wholesale Price
World Futures Price(London #5)
2005-2014 AveragesDeveloped-Country Wholesale Price 41.25¢/lbWorld-Average Wholesale Price 31.06¢/lbWorld Dump-Market Refined Price 21.25¢/lb
39
33
20
22
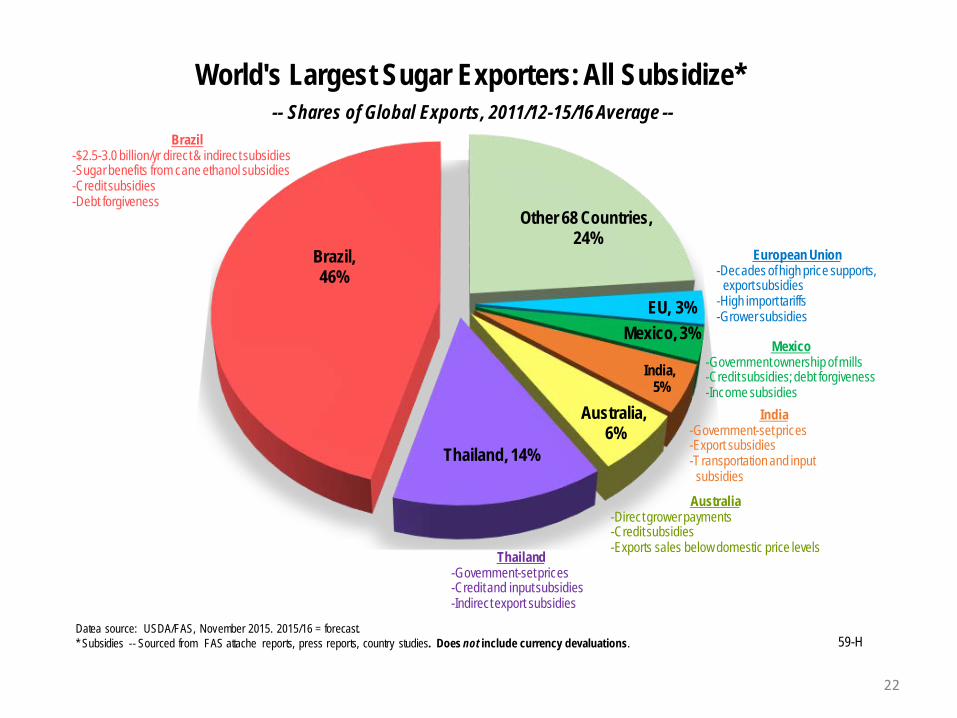
Other 68 Countries,24%
EU, 3%Mexico, 3%
India,5%
Australia,6%
Thailand, 14%
Brazil, 46%
World's Largest Sugar Exporters: All Subsidize*-- Shares of Global Exports, 2011/12-15/16 Average --
59-HDatea source: USDA/FAS, November 2015. 2015/16 = forecast.* Subsidies -- Sourced from FAS attache reports, press reports, country studies. Does not include currency devaluations.
Brazil-$2.5-3.0 billion/yr direct & indirect subsidies-Sugar benefits from cane ethanol subsidies -Credit subsidies-Debt forgiveness
Thailand-Government-set prices-Credit and input subsidies-Indirect export subsidies
Australia-Direct grower payments-Credit subsidies-Exports sales below domestic price levels
European Union-Decades of high price supports,
export subsidies-High import tariffs-Grower subsidies
India-Government-set prices-Export subsidies-Transportation and input
subsidies
Mexico-Government ownership of mills-Credit subsidies; debt forgiveness-Income subsidies

23
Year Author Study Key Finding
2003, 2008
LMC International "A Review of Sugar Policies in Selected Countries"
Documented extensive transparent and non-transparent (indirect) subsidies in 14 countries (2003) and 11 countries (2008).
2013 Patrick Chatenay, ProSunergy Ltd
"Government Support and the Brazilian Sugar Industry"
Found direct and indirect subsidies valued at $2.5 billion per year.
2015Antoine Meriot,
Sugar Expertise LLC" Thailand’s sugar policy: Government
drives production and export expansion"Found direct and indirect subsidies valued at "at least $1.3 billion per year."
2015 Patrick Chatenay, ProSunergy Ltd
" European Union Sugar Industry Support" Found that, even after "reform" of the EU sugar regime in 2017, EU producers will still receive $665 million per year in coupled and decoupled payments.
2016 Antoine Meriot, Sugar Expertise LLC
" Indian sugar policy: Government role in production expansion, and transition from
importer to exporter"
Found direct and indirect subsidies valued at $1.7 billion per year.
ASA-Commissioned Studies on Foreign Sugar Subsidies

U.S. Sugar Market and Policy Update
2. Defending U.S. sugar policy
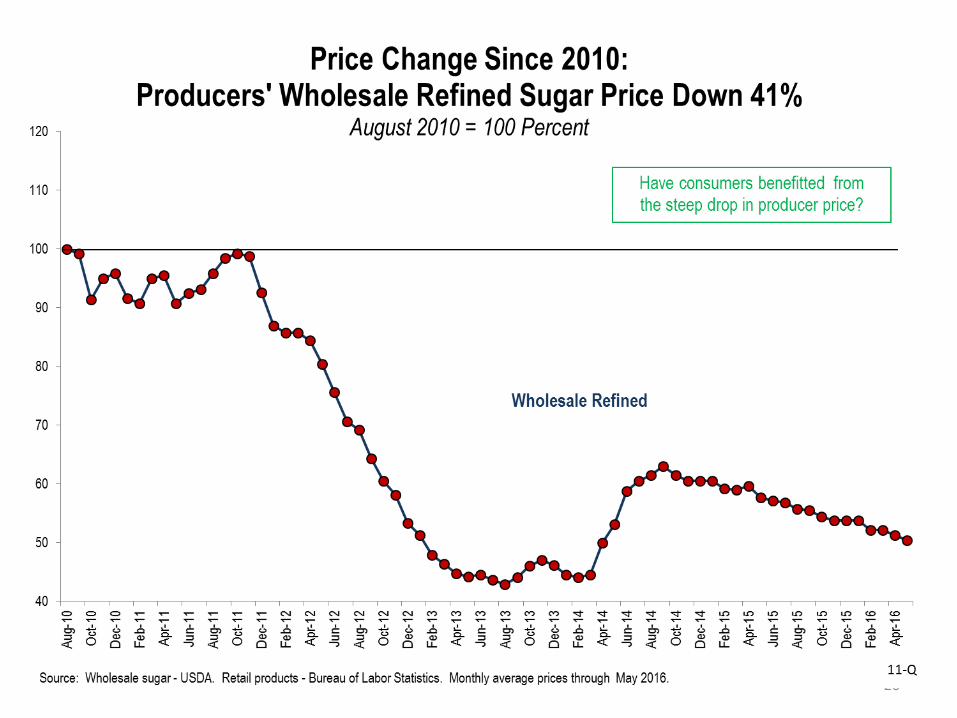
• How/why the sweetened-product manufacturers attack it Users’ focus on 2010-11 period of reasonable prices – high
enough to cover costs of production and re-invest Users’ focus on comparisons to world market price Users’ illusion they could buy unlimited supplies, reliable,
high-quality, no price increase Users’ fantasy – their argument to Congress – that they
would pass all their savings on cheaper sugar along to consumers
Users’ fantasy – their argument to Congress – that high sugar prices are costing them jobs
24

25
26

27
28

29


-3.0%
-2.5%
-2.0%
-1.5%
-1.0%
-0.5%
0.0%
0.5%
1.0%
1.5%
2.0%
2.5%
-50%
-40%
-30%
-20%
-10%
0%
10%
20%
30%
40%
50%
1990 1992 1994 1996 1998 2000 2002 2004 2006 2008 2010 2012
Change in SCP Employment
Change in U.S. Refined Sugar Price
Chart Source: "Economic Effects of U.S. Sugar Policy," Alexander Triantis, University of Maryland, April 2016.Data Sources: BLS QCEW; USDA ERS Sugar and Sweetener Table 5. SCP = sugar-containing product.
Annual Percentage Changes in U.S. Refined Sugar Price and SCP Industries Employment: No Relationship between Sugar Price and SCP Jobs
2014

34
$0.00
$0.20
$0.40
$0.60
$0.80
$1.00
$1.20
$1.40 1.33
1.18
1.01
0.910.84 0.82 0.79 0.77 0.76
0.72 0.71 0.69 0.67 0.66 0.65 0.65 0.63 0.60 0.59 0.59 0.59 0.570.49
0.450.39 0.38
U.S
. Dol
lars
per
pou
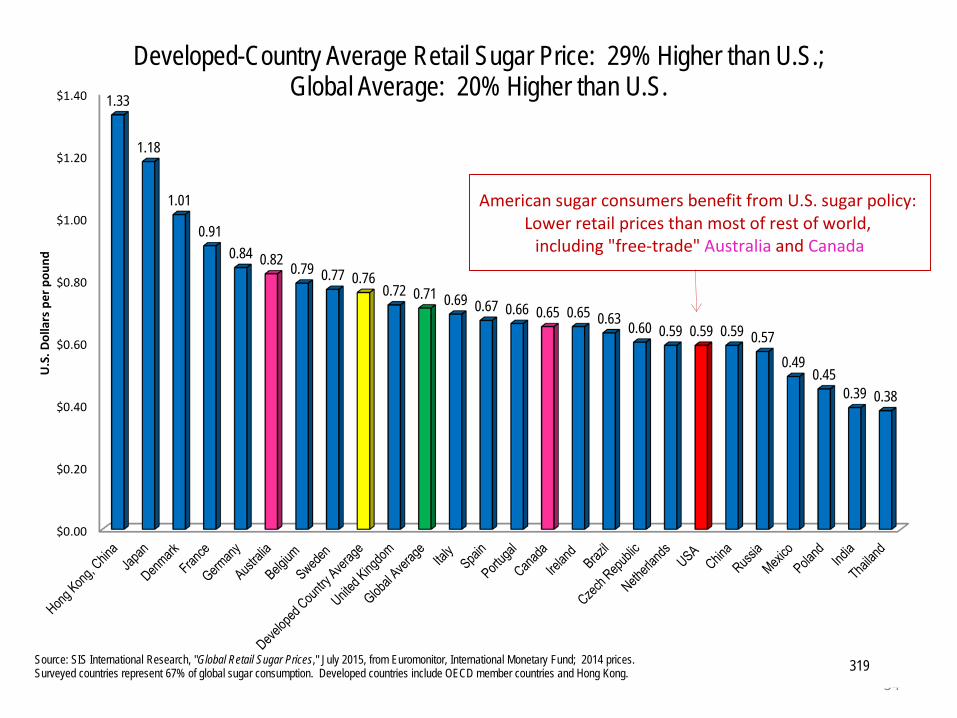
ndDeveloped-Country Average Retail Sugar Price: 29% Higher than U.S.;
Global Average: 20% Higher than U.S.
American sugar consumers benefit from U.S. sugar policy: Lower retail prices than most of rest of world,
including "free-trade" Australia and Canada
319Source: SIS International Research, "Global Retail Sugar Prices," July 2015, from Euromonitor, International Monetary Fund; 2014 prices. Surveyed countries represent 67% of global sugar consumption. Developed countries include OECD member countries and Hong Kong.
U.S. Sugar Market and Policy Update
3. Key industry challenges • Trade policy: Vigilance on upcoming agreements Trans-Pacific Partnership: Completed but not yet passed
o Minimal concessions; will come out of Mexican access to U.S. market o Passage in question
U.S. & European Union: Transatlantic Trade and Investment Partnership (TTIP) o Both U.S. and EU are net importers of sugar o Both sugar industries have requested sugar not be included in the TTIP
Doha Round of WTO o Only pathway to address all global sugar subsidies
Way to achieve “zero-for-zero” approach o But negotiations stalled
35
36
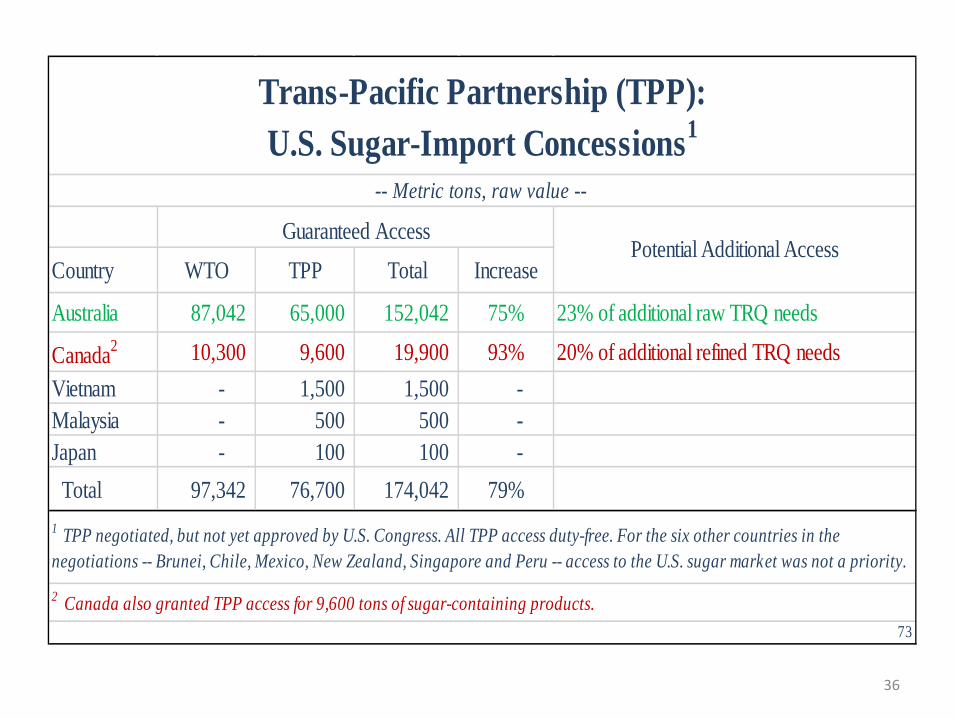
Country WTO TPP Total Increase
Australia 87,042 65,000 152,042 75% 23% of additional raw TRQ needs
Canada2 10,300 9,600 19,900 93% 20% of additional refined TRQ needsVietnam - 1,500 1,500 - Malaysia - 500 500 - Japan - 100 100 - Total 97,342 76,700 174,042 79%
2 Canada also granted TPP access for 9,600 tons of sugar-containing products.73
Trans-Pacific Partnership (TPP): U.S. Sugar-Import Concessions1
-- Metric tons, raw value --
1 TPP negotiated, but not yet approved by U.S. Congress. All TPP access duty-free. For the six other countries in the negotiations -- Brunei, Chile, Mexico, New Zealand, Singapore and Peru -- access to the U.S. sugar market was not a priority.
Guaranteed AccessPotential Additional Access

Zero-for-Zero
The U.S. sugar industry supports the Congressional resolution introduced by Rep. Ted Yoho, R-FL:
When foreign countries eliminate their sugar subsidies, we will eliminate U.S. sugar policy
− To modify or surrender U.S. sugar policy with no concessions by foreign countries would amount to unilateral disarmament and transfer of American jobs to countries that subsidize
37

U.S. Sugar Market and Policy Update
3. Key industry challenges • Defending sugar and sweetened-product consumption Address the misconception that sugar, and rising sugar
consumption, are responsible for obesity and other health concerns
38

39
50%
100%
150%
200%
250%
300%
350%
Since 1974: U.S. Child Obesity Has Tripled, Adult Obesity Has More than Doubled(1974=100%)
Child Obesity(% of population)
Source: Caloric Sweetener (Sugar + High Fructose Corn Syrup) Data -- Economic Research Service/USDA: ttp://www.ers.usda.gov/Briefing/sugar/data.htm Obesity Data -- Centers for Disease Control and Prevention/HHS.Note: Official obesity data available only for years shown. 206C
Adult Obesity(% of population)
What role has sugar played?
40
50%
100%
150%
200%
250%
300%
350%
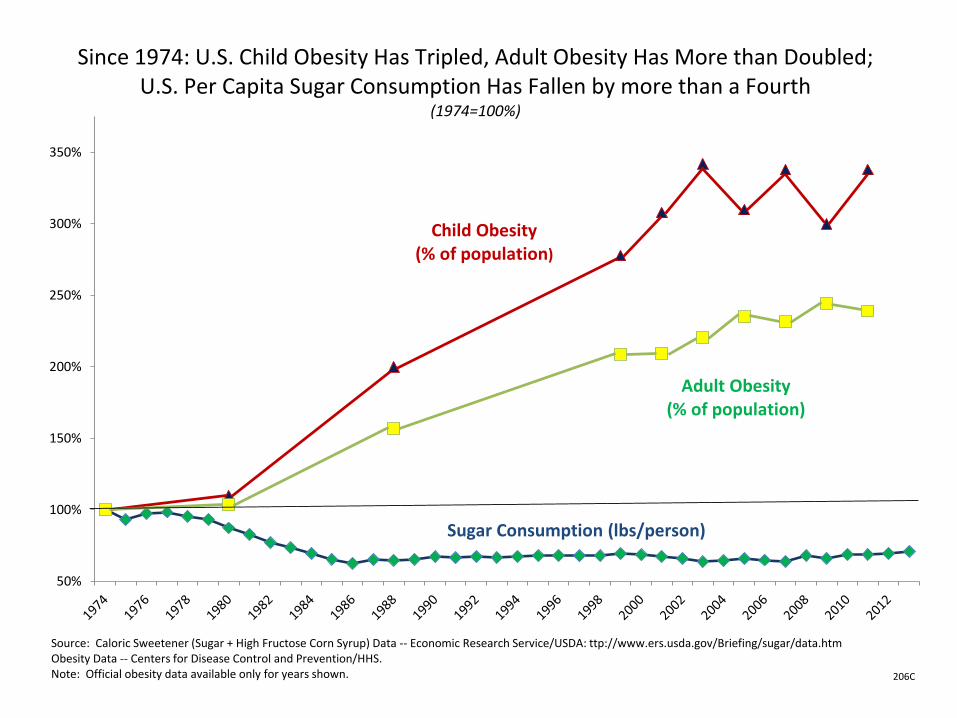
Since 1974: U.S. Child Obesity Has Tripled, Adult Obesity Has More than Doubled;U.S. Per Capita Sugar Consumption Has Fallen by more than a Fourth
(1974=100%)
Child Obesity(% of population)
Sugar Consumption (lbs/person)
Source: Caloric Sweetener (Sugar + High Fructose Corn Syrup) Data -- Economic Research Service/USDA: ttp://www.ers.usda.gov/Briefing/sugar/data.htm Obesity Data -- Centers for Disease Control and Prevention/HHS.Note: Official obesity data available only for years shown. 206C
Adult Obesity(% of population)

41
50%
100%
150%
200%
250%
300%
350%
Since 1974: U.S. Child Obesity has Tripled, Adult Obesity more than Doubled;U.S. Per Capita Caloric Sweetener Consumption up Only Slightly,
Down 19% Since 1999(1974=100%)
Child Obesity(% of population)
Source: Caloric Sweetener (Sugar + High Fructose Corn Syrup) Data -- Economic Research Service/USDA: http://www.ers.usda.gov/Briefing/sugar/data.htm Obesity Data -- Centers for Disease Control and Prevention/HHS.Note: Official obesity data available only for years shown. 206
Adult Obesity(% of population)
Caloric Sweetener Consumption (lbs/person)
42
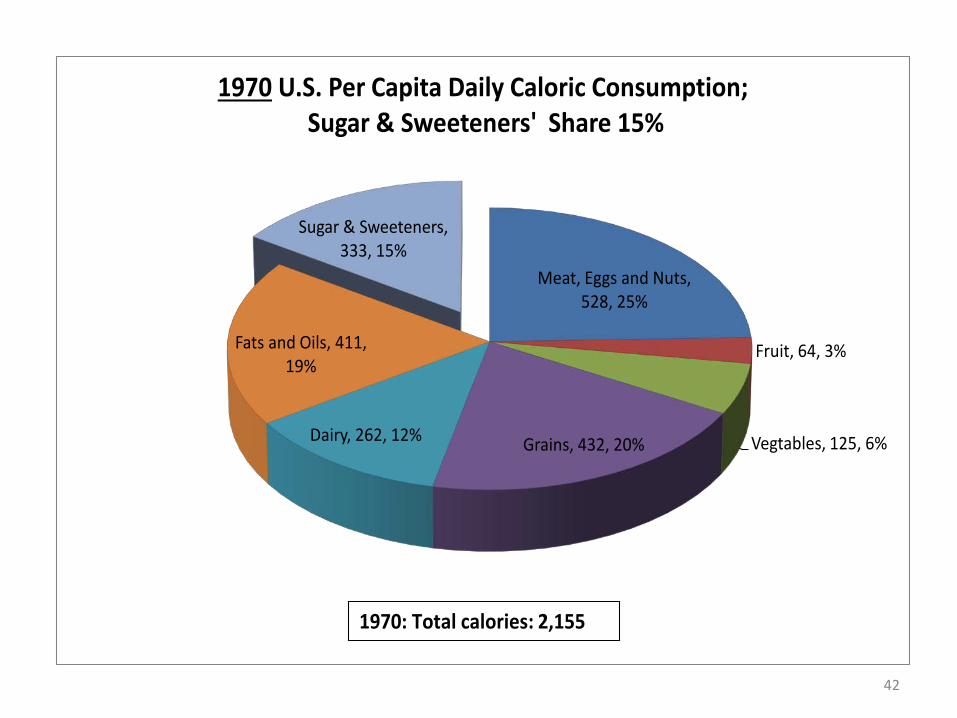
Meat, Eggs and Nuts, 528, 25%
Fruit, 64, 3%
Vegtables, 125, 6%Grains, 432, 20%Dairy, 262, 12%
Fats and Oils, 411, 19%
Sugar & Sweeteners, 333, 15%
1970 U.S. Per Capita Daily Caloric Consumption;Sugar & Sweeteners' Share 15%
1970: Total calories: 2,155

43
Meat, Eggs and Nuts, 544, 21%
Fruit, 81, 3%
Vegtables, 121, 4%
Grains, 620, 24%Dairy, 255, 10%
Fats and Oils, 616, 24%
Sugar & Sweeteners, 367, 14%
2010 U.S. Per Capita Caloric Consumption Up 21% from 1970;Sugar & Sweeteners' Share Drops to 14%
2010: Total calories: 2,604
Source: USDA/ERS; http://www.ers.usda.gov/data-products/food-availability-%28per-capita%29-data-system.aspx206

44
15.5%
14.1%
0%
2%
4%
6%
8%
10%
12%
14%
16%
18%
1970 2010
Sugar and Sweeteners' Share of U.S. Caloric ConsumptionDrops 9% from 1970 to 2010
Sugar and sweeteners cannot be
blamed for rising U.S. obesity
Source: USDA/ERS; http://www.ers.usda.gov/data-products/food-availability-%28per-capita%29-data-system.aspx206-1

U.S. Sugar Market and Policy Update
Conclusions 1. Market. The U.S. sugar market has stabilized after
nearly being destroyed by subsidized, dumped Mexican sugar in 2013 Problems remain, but optimism that suspension
agreements with Mexico can be altered to ensure cane refiner throughput, reduce Mexican dumping
Rising world prices could take U.S. prices higher 2. Policy. Always threatened, but strong arguments to
defend; talented, dedicated team in Washington D.C. 3. Challenges. Trade policy challenges appear to be
under control; must defend sugar consumption
45

www.sugaralliance.org
Coeur d’Alene, Idaho
July 29-August 3, 2016